Article

Identification of Parasitic Infections by Analyzing Honeybees, Honey, and Pollen Using Droplet Digital RT-PCR

by
Luigi Jacopo D’Auria
1,†,
Andrea Mancusi
2,*,†,
Yolande Thérèse Rose Proroga
2,
Irene Dini
3,*,
Tiziana Cardellicchio
2,
Orlandina Di Maro
2,
Sabato De Vita
1,
Marica Egidio
4,
Raffaele Marrone
4 and
Giuseppe Rofrano
1
1
Centro di Referenza Nazionale per L’analisi e lo Studio delle Correlazioni tra Ambiente, Animali e Uomo, Istituto Zooprofilattico Sperimentale del Mezzogiorno, 80055 Portici, Italy
2
Department of Food Security Coordination, Istituto Zooprofilattico Sperimentale del Mezzogiorno, 80055 Portici, Italy
3
Department of Pharmacy, University of Naples Federico II, 80138 Naples, Italy
4
Department of Veterinary Medicine and Animal Production, University of Naples Federico II, 80138 Naples, Italy
*
Authors to whom correspondence should be addressed.
These authors contributed equally to this work.
Microorganisms 2025, 13(7), 1487; https://doi.org/10.3390/microorganisms13071487
Submission received: 26 May 2025 / Revised: 24 June 2025 / Accepted: 25 June 2025 / Published: 26 June 2025
(This article belongs to the Special Issue Advances in Genomics and Ecology of Environmental Microorganisms)

Abstract

Toxoplasma gondii, Giardia intestinalis, and Cryptosporidium spp. are common pathogens that contaminate water and food. They can pose serious health risks, especially to vulnerable groups like immunocompromised individuals, pregnant women, young children, and aging people. An all-encompassing approach to minimizing transmission involves identifying effective techniques for detecting, treating, and preventing protozoan parasites. This study confirmed the effectiveness of a Droplet Digital Reverse Transcription Polymerase Chain Reaction (dd RT-PCR) method for quickly and accurately identifying Toxoplasma gondii, Giardia intestinalis, and Cryptosporidium species in honeybees, honey, and pollen by using ISO 17468 and ISO 16140 standard guidelines. The study evaluated honeybee (n = 16), honey (n = 12), and pollen (n = 8) samples collected from various apiaries in Southern Italy between June and September 2023. The results showed that honeybees, honey, and pollen can be considered bioindicators of infections by T. gondii, G. intestinalis, and Cryptosporidium spp. Furthermore, pollen, along with honey to a lesser degree, can serve as significant indicators for evaluating food safety. Therefore, it is essential to monitor their quality and purity due to environmental influences.

1. Introduction

Soil contamination by protozoan parasites poses a significant infection risk to humans and animals [1]. Toxoplasma gondii can cause asymptomatic or mild symptomatic infections that are often resolved independently in individuals with a healthy immune system. However, it can cause central nervous system diseases, myocarditis, and pneumonitis in fetuses and immunosuppressed subjects. Latent infections may also be associated with neuropsychiatric disorders. During pregnancy, infection can cause congenital transmission, resulting in complications such as miscarriage, stillbirth, premature birth, neonatal mortality, and various symptoms in newborns [2]. Giardia intestinalis and Cryptosporidium spp. are responsible for significant intestinal disorders. For instance, human cryptosporidiosis primarily manifests as severe watery diarrhea, mild fever, abdominal discomfort, vomiting, nausea, and weight loss. While often asymptomatic or mild in healthy individuals, they can be severe and fatal in immunocompromised patients. Acute giardiasis symptoms resemble those of cryptosporidiosis [3]. All three of these protozoa are characterized by high resilience and survival, as they can persist for months in the environment. Their survival in the soil depends on soil chemistry, temperature, and humidity [4,5]. Contaminated soil with protozoan cysts (G. intestinalis) or oocysts (T. gondii, Cryptosporidium spp.) act as a pabulum matrix for contaminating water sources and agricultural products like fruits and vegetables [6]. Previous research has shown that oocyst survival is higher during the rainy season, as moisture facilitates their spread [7]. Additionally, sandy and loamy soils have the highest contamination rates, as they enhance the survival chances of these parasites [8]. The World Health Organization [1] promoted a “One Health approach” for managing zoonotic diseases [9]. It is a collaborative strategy that operates at various scales to achieve optimal health by recognizing the interconnections among humans, animals, plants, and the environment. Real-time environmental monitoring, using biotic or abiotic systems through physical, chemical, and genomic analyses, can be crucial for tracking changes and promoting human health. This study assessed the prevalence and parasitic load of T. gondii, G. intestinalis, and Cryptosporidium spp. DNA in honeybee, honey, and pollen samples from selected apiaries of southern Italy through a Digital RT-PCR technique. The European honeybee (Apis mellifera) is an ideal biomonitoring candidate due to its extensive foraging behavior, during which it inadvertently collects chemical and microbiological pollutants. As a result, the hive products, particularly honey, can indicate both contaminant exposure and potential food safety risks. Their widespread distribution and human management further enhance their potential in the context of environmental and food safety monitoring [10,11,12].

2. Materials and Methods

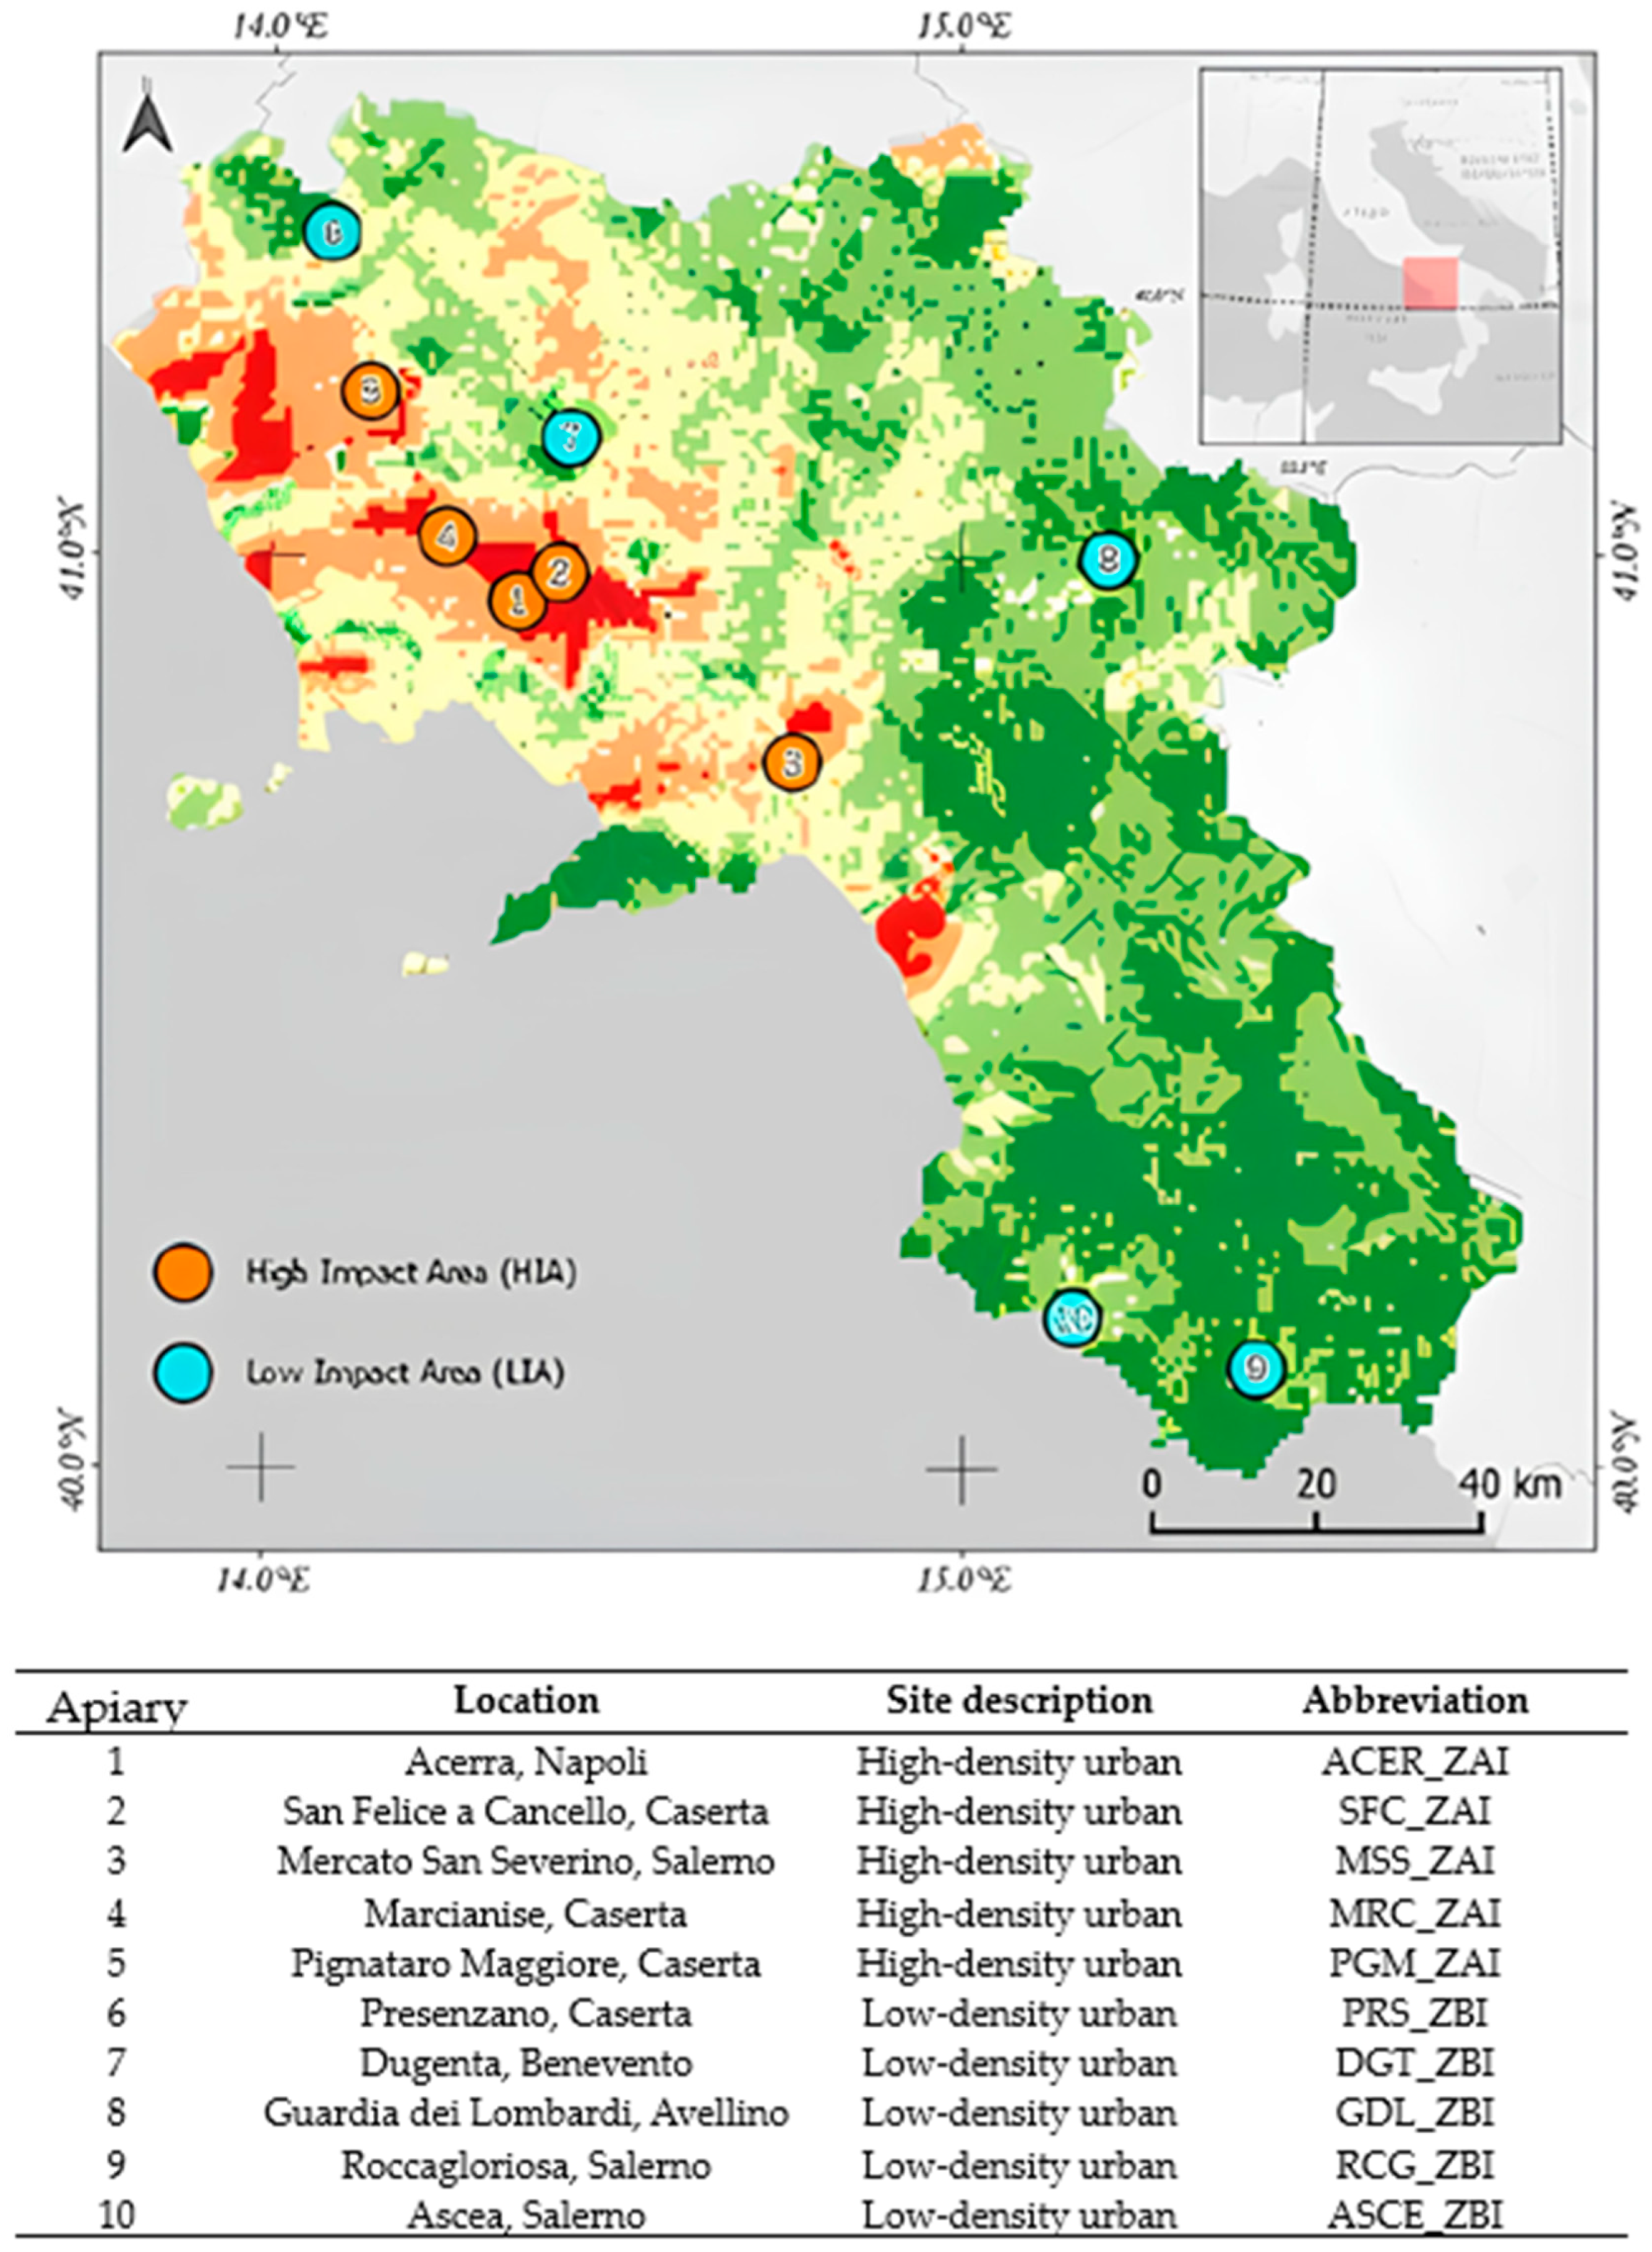
2.1. Study Area and Sampling

This study was conducted in the Campania, a southern Italy region (Figure 1). It is characterized by a typical Mediterranean temperate climate and progressively continental features, particularly in the mainland and mountainous landscapes.
The apiaries were selected because of a risk index based on five environmental variables (i.e., pollution, land use, hydrographic network, air quality, and bee density) and classified as high-impact areas (HIAs) or low-impact areas (LIAs).
From June to September 2023, samples of honeybees (n = 16, S1–S16), honey (n = 12, S17–S28), and pollen (n = 8, S29–S36) were collected from 10 different apiaries (Table 1 and Figure 1) in collaboration with apiary owners that monitored the presence of Varroa destructor in the hive potentially related to the infections. Bees were captured alive and collected using special cages (formerly under-basket cages) to monitor mortality, allowing for the safe and effective collection of samples without harming the insects [13]. The honey was collected directly from the brood combs inside the beehives, ensuring the maximum freshness and integrity of the sample. The pollen was obtained by installing front traps on the hives, which captured the pollen grains collected by the bees during their foraging activities. All samples were stored at −20 °C in specific 500 µL glass jars and delivered to the Animal Health Department of the Experimental Zooprophylactic Institute of Southern Italy (Portici, Italy) for molecular analyses.

2.2. DNA Extraction

This study was conducted on honeybees (n = 16 comprising 50 honeybees), honey (n = 12 containing 1 mL of honey), and pollen (n = 8 each of 10 g).
Every sample underwent molecular analysis to assess the potential presence of parasites (T. gondii, G. intestinalis, and Cryptosporidium spp.). Three replicates were performed at each concentration level. Honeybee DNA was obtained by adding 40 mL of Tris-glycine buffer (TGBE; Merck, Darmstadt, Germany) to sub-samples in a Falcon tube, vertexing for 10 s, and shaking in an orbital shaker (DLAB Scientific, Beijing, China) for 1 h at 150 rpm at room temperature. Then, the Falcon tubes were centrifuged for 30 min at 10,000× g at 4 °C. The pellet was resuspended in 1 mL of PBS pH 7.3 and transferred to a 1.5 mL tube at −20 °C. Pollen and honey DNA were extracted from each sample by diluting 1 mL of honey or 10 g of pollen with TGBE (Merck, Darmstadt, Germany) at a ratio of 1:10. Subsequently, the prepared samples were vortexed for 10 s and blended in an orbital shaker (DLAB Scientific, Beijing, China) for 1 h at 150 rpm at room temperature. Then, 1 mL from each sample was transferred into a 1.5 mL tube and stored at −20 °C.
The extraction process was carried out using the EGene-UP system (bioMerieux, Marcy-l’Étoile, France), along with NucliSENS reagents (bioMerieux, Marcy-l’Étoile, France) and magnetic silica (bioMérieux, Marcy-l’Étoile, France). A sample lysis was conducted following the ISO 15216-2:2019 [14]. Two milliliters of lysis buffer were added to the 500 μL sample, mixed, and incubated at room temperature for 10 min. The resulting mixture was centrifuged (Eppendorf, Hamburg, Germany) at 1800× g for 2 min at 4 °C to collect any sample droplets that may have adhered to the walls of the tubes and their caps. Subsequently, 50 μL of magnetic silica (bioMerieux, Marcy-l’Étoile, France) was incorporated and kept for 10 min at room temperature. The subsequent steps followed the manufacturer’s guidelines, utilizing an INTEGRA 1250 μL 8-channel FW 4.02 pipette (INTEGRA Biosciences Corp, Hudson, NY, USA). The magnetic silica was resuspended in 100 μL of Nuclisens® extraction buffer 3 (bioMerieux, Marcy-l’Étoile, France). The DNA was eluted from the silica (temperature: 60 °C, time: 5 min, speed: 1400 rpm) and stored at −20 °C until it was analyzed using dd-PCR.

2.3. Droplet Digital RT-PCR (dd RT-PCR) for Parasitic Load Detection

Droplet digital RT-PCR was performed on Bio-Rad’s QX200 system (Bio-rad, Hercules, CA, USA), following the manufacturer’s guidelines. The reaction mixture, with a total volume of 20 µL, was composed of ddPCR Supermix for probes (10 μL; Bio-Rad, Hercules, CA, USA); forward, reverse, and probe (Table 2); and DNA (35–50 ng), along with primers and probes and nuclease-free water as necessary to obtain the final volume. The PCR amplification was performed using a CFX96 Deep Well instrument (Bio-Rad, Hercules, CA, USA) with an initial 60 min step at 50 °C, followed by 10 min at 95 °C, and then 45 cycles of 15 s at 95 °C and 45 s at 60 °C, concluding with a final extension at 98 °C for 10 min. The QX200 Droplet Reader analyzed positive droplets following the Poisson distribution. QuantaSoft software (version 1.7) counts both PCR-positive and PCR-negative droplets, enabling the absolute quantification of DNA. The results were expressed as the number of genomic copies per 1 μL of the reaction (gc/1 μL).

2.4. Test Performance Assessment

Solutions of T. gondii MBC047, G. intestinalis MBC119-R (2 × 10⁴ genomic copies gc/μL; Vircell Microbiologist, Granada, Spain), and Cryptosporidium spp. MBC126-R (2 × 10⁴ gc/μL. Vircell Microbiologist, Granada, Spain) were used as reference strains. The strains were diluted in DNase/RNase-free water to obtain three concentrations: 100 gc/μL, 10 gc/μL, and 1 gc/μL. Validation samples were prepared by inoculating the reference strains (100 gc/μL, 10 gc/μL, and 1 gc/μL) or sterile water (negative control) into honeybees, pollen, and honey samples that tested negative for the examined parasites. The negativity for Toxoplasma gondii was assessed utilizing the qPCR protocol recommended by the National Reference Centre for Toxoplasmosis in Palermo, Italy. In contrast, Giardia intestinalis and Cryptosporidium spp. were detected using the real-time PCR protocol established by Haque et al. [16].
The test’s sensitivity was assessed by calculating the Limit of Detection at a 95% probability (LOD95), utilizing ten replicates for each concentration of parasites.
The detection limit for the dd-PCR assay was established as the final serial dilution measured in 95% of the replicates. The limit of quantification (LOQ) was established at the minimum concentration, demonstrating a coefficient of variation percentage (CV%) below the acceptance threshold of 25% for quantitative methods [18].
The test precision was evaluated by controlling the intraday and interday intra-laboratory repeatability. The intraday repeatability was assessed by performing ten analyses on each dilution level of the samples (100, 10, and 1 gc/mL) on the same day, while the interday repeatability was determined by repeating the same analyses on two different days. Different operators performed the same analyses to confirm the reliability of the ddPCR method and to obtain the intra-laboratory repeatability.

2.5. Statistical Analyses

For the validation test, statistical analysis was performed by calculating the intra-assay coefficient of variation (CV%) for each dilution level (100, 10, and 1 gc/mL) and overall, using the following formula. A coefficient of variation (CV%) lower than 10% indicates no significant intra-laboratory variation.
CV % = Standard   deviation the   mean   value   for   each   level × 100
Moreover, Chi-square and Fisher’s exact tests were performed separately for each sample matrix and each pathogen using IBM SPSS Statistics (version 29, IBM Analytics, Armonk, NY, USA) to compare them. Odds ratios (ORs) and p-values were calculated, and significance was set at p < 0.05. Finally, prevalence (%) and corresponding 95% confidence intervals (IC95%) were calculated using the Wilson score method to avoid bias associated with small sample sizes.

3. Results

3.1. Performance Evaluation of dd-PCR Assay

The ddPCR technique enabled highly sensitive DNA amplification, detecting concentrations as low as 1 genome copy per microliter (gc/μL).
The detection limit confirmed the method’s sensitivity at 95% confidence (LOD95), which was 10 genome copies per microliter (gc/μL) for pollen samples and 1 gc/μL for bee and honey samples. These values were consistent across the different pathogens tested, namely T. gondii, G. intestinalis, and Cryptosporidium spp., indicating a stable performance of the method across diverse biological matrices.
According to the Bio-rad (Bio-rad, Hercules, CA, USA) manual, a minimum of 1 droplet is required as the essential quantitative parameter. In this work, as indicated by Srisutham et al. [19], sample classification as positive was based on detecting at least two positive droplets, a criterion that ensured high reliability in infection identification. All infected replicates were correctly detected as positive, while negative controls showed no detectable signal, confirming the high specificity of the technique.
During the reactions, the number of generated droplets ranged from 9245 to 14,681, with an average of 12,847 droplets per reaction, underscoring the robustness and reproducibility of the system. The analysis revealed a clear separation between positive and negative droplets, with a minimal presence of intermediate or ambiguous droplets, further supporting the high specificity and efficiency of ddPCR.
Regarding diagnostic performance, ddPCR showed a sensitivity of 97.6% (95% CI: 86.4–99.9) and a specificity of 100%. The overall coefficient of variation (CV%) among positive replicates was 20.2%, with CV values increasing as the target concentration decreased, as shown in Table 3.
At higher concentrations (100 gc/μL), CV values remained low across all matrices and pathogens, ranging from 0.41% to 6.74%. However, at 10 gc/μL, the CV% increased notably, particularly in pollen samples, where values reached up to 48.23% for Cryptosporidium spp. At the lowest concentration (1 gc/μL), CV values were markedly higher, especially for Giardia intestinalis in honey (65%) and honeybee samples (51.22%), and for Toxoplasma gondii in the same matrices (49.33% and 37.89%, respectively). At this concentration, all targets in pollen were below the detection limit. These results emphasize the high precision of ddPCR at moderate-to-high DNA concentrations while highlighting the expected variability at the lower detection limits.

3.2. Honeybees, Honey, and Pollen Analyses

The screening of honeybees collected between June and September 2023 from different apiaries in the Campania region revealed the presence of seven samples positive for the Toxoplasma gene (prevalence: 43.8%; IC95%: 23.1–66.8), twelve for the Giardia gene (prevalence: 75%; IC95%: 50.5–89.8), and eight (prevalence: 50%; IC95%: 28–72) for the Cryptosporidium spp. gene (Table 4). No statistically significant differences (p > 0.05) related to seasonality were observed for any of the three pathogens.
Regarding the geographic distribution, the Toxoplasma gene was detected in Naples, Caserta, and Benevento; instead, the Giardia and Cryptosporidium spp. genes were in all five provinces of the Campania region.
The analysis of honey gathered from various apiaries in the Campania region between June and September 2023 indicated that three samples were positive for the Toxoplasma gondii gene (prevalence: 25%; IC95%: 8.9–53.2), one for the Giardia intestinalis gene (prevalence: 8.3%; IC95%: 1.5–35.4), and one for the Cryptosporidium spp. gene (prevalence: 8.3%; IC95%: 1.5–35.4). No statistically significant differences (p > 0.05) related to seasonality were observed for any of the three pathogens (Table 5).
Regarding the geographic distribution, the Toxoplasma gondii gene was detected in Caserta and Salerno, the Giardia intestinalis in Caserta, and Cryptosporidium spp. in Benevento province.
The examination of pollen collected from different apiaries in the Campania region from June to September 2023 revealed that five samples tested positive for the Toxoplasma gondii gene (prevalence: 62.5%; IC95%: 30.6–86.3), three for the Giardia intestinalis gene (prevalence: 37.5%; IC95%: 13.7–69.4), and four for the Cryptosporidium spp. gene (prevalence: 50%; IC95%: 21.5–78.5). No statistically significant differences (p > 0.05) related to seasonality were observed for any of the three pathogens.
Regarding the geographic distribution, the Giardia intestinalis gene was detected in Avellino, Salerno, and Benevento; instead, the Toxoplasma gondii and Cryptosporidium spp. genes were in all five provinces of the Campania region (Table 6).

4. Discussion

T. gondii, G. intestinalis, and Cryptosporidium spp. are prevalent zoonotic foodborne protozoa; however, systematic food safety controls for these parasites are not applied, allowing food safety concerns to persist. This deficiency is primarily attributed to insufficient specific regulations and standardized detection methods for identifying parasites in food matrices [18]. There is an urgent need for rapid and standardized detection methods to address the growing threat of protozoan parasites in our food supply. Advances in molecular biology and diagnostic technologies offer promising avenues for accurately and timely identifying these pathogens. Examining the parasitic load and prevalence in various food products is vital for understanding the level of contamination and developing targeted interventions. Providing occurrence data pertinent to food safety risk managers is essential, clarifying the implications of negative, positive, and quantifiable samples. This study assessed the efficacy of ddPCR technology in identifying target parasites. ddPCR, which eliminates the need for sequencing, utilizes fluorescent-labeled, target-specific probes for identification, enabling the rapid and sensitive detection of low levels of parasite DNA [20]. The primary advantage of ddPCR is its utilization of water–oil droplet emulsion technology, which divides samples into approximately 20,000 droplets, thereby enhancing sensitivity, accuracy, and precision in detecting low target quantities. This method eliminates the need for a standard curve in DNA quantification, allowing for absolute counting through Poisson statistics and enabling the detection of subtle differences in target DNA copy numbers. ddPCR also offers superior reproducibility to qPCR, as it is less affected by operator and environmental variables, reducing errors from pipetting and standard curve preparation. Additionally, ddPCR is less sensitive to PCR inhibitors, leading to greater consistency among replicates and improved repeatability [15].
In the absence of established performance criteria for detecting parasites in food, the test performance was evaluated using the guidelines from ISO 17468 [21], ISO 16140-1 [22], and ISO 16140-2 [23], which were initially formulated for bacterial detection [24].
ISOs are typically employed with slight adjustments to optimize parasite identification, ensuring accuracy and adaptability across different samples. Qualitative methods require LOD and sensitivity, while quantitative methods focus on LOQ and percentage recovery, both needing artificial contamination studies and interlaboratory trials. Inclusivity and exclusivity do not require artificial contamination. ISO 16140–2:2016 suggests evaluating sensitivity first; however, for parasites, determining the Limit of Detection (LOD) initially is more logical. The recommended number of food items and biological replicates can be challenging for non-culture methods due to the limited availability of parasites and the difficulties associated with processing large sample volumes [24].
The ddPCR assay demonstrated excellent diagnostic performance, with a specificity of 100% and a sensitivity of 97.6% (95% CI), across all tested matrices and target pathogens (T. gondii, G. intestinalis, and Cryptosporidium spp.). These results support the method’s potential as a reliable tool for standardized food safety inspections, which can reduce the public health risks associated with these parasitic contaminants.
This study evaluated the presence of T. gondii, G. intestinalis, and Cryptosporidium spp. in the five provinces of the Campania region. The study areas were chosen to address key environmental concerns, including the presence of surface water bodies, intensive agricultural activities, and significant human impact. This selection aimed to facilitate precise environmental and parasitological monitoring using bioindicators, ensuring an insightful analysis of ecological conditions and potential risks [25].
The data show that the parasite’s presence in Campania varied across the provinces. Notably, the honeybee samples with a high rate of parasite (T. gondii, G. intestinalis, and Cryptosporidium spp.) gene contamination were those that came from Palma Campania, followed by Guardia Lombardi, Dugenta, Acerra, and Presenzano. The geographical location, climate, and agronomic practices all affected parasitosis levels in the different countries. In the two weeks leading up to the sample collection, Palma Campania, Guardia Lombardi, and Acerra experienced rainfall and higher humidity levels (Figure S1). This finding is consistent with the conclusions of Berrouch et al. [26], who identified humidity and precipitation as key factors in the spread of parasites. The meteorological conditions cannot support the data collected in the provinces of Acerra, Dugenta, and Presenzano before the sample collection (Figure S2).
It is worth mentioning that the Acerra and Dugenta areas have a strong agricultural vocation. The Dugenta province is famous for its wines, which are marked by the “Dugenta” geographical indication. Many farmers use irrigation in the warm months (June and August) to boost agricultural production yields. The water used for irrigation, combined with rising temperatures, may affect local humidity levels.
In Presenzano, a closed-cycle hydroelectric facility with two reservoirs holding about 6 million cubic meters can also influence humidity during hot periods.
The data on the hive products revealed the presence of T. gondii, G. intestinalis, and Cryptosporidium spp. in both pollen and honey samples, albeit with lower detection frequencies than those observed in honeybees. This finding suggests that, although all matrices are exposed to similar environmental sources, they exhibit different capacities for accumulating or preserving protozoan pathogens, also depending on the localization of the raw material from which they originate (e.g., external or internal parts of flowers) and on how honeybees process them [27].
Notably, pollen exhibited a higher prevalence compared to honey samples (13.9% and 50%, respectively), with no statistically significant differences (p > 0.05), likely due to its direct collection from the external parts of flowers, which may be more contaminated by environmental particles, such as rainwater, organic fertilizers, or dust containing oocysts, and less transformation by bees [6,7,8,27].
In contrast, honey showed a lower contamination incidence than the other two sample types. This is likely due to its raw material origin (the nectar is located within floral structures inherently less exposed to environmental contaminants than the external parts), low water activity, high sugar content, acidic pH, and the presence of compounds such as polyphenols, 1,2-dicarbonyl compounds, bee defensin-1, and substances such as hydrogen peroxide, which may reduce pathogen viability [28,29], and to the biofilter role of honeybees, which mitigate contamination in nectar during the production process of honey, even under conditions of high environmental pollution [27].
Nevertheless, the detection of protozoan DNA, albeit limited, confirms that honey is not entirely exempt from environmental contamination. Our data are in accordance with those reported by Flamminii, Salkova, and González-Alcaraz [27,30,31], who also identified pollen as a more effective bioindicator of harmful pollutants such as heavy metals, radionuclides, and pathogenic microorganisms, compared to honey for the reasons outlined above.
From a geographical perspective, the heterogeneous distribution of T. gondii, G. intestinalis, and Cryptosporidium spp. genes across the three different matrices (honeybees, honey, and pollen) and the five provinces of the Campania region is likely the result of a complex interplay between agronomic practices, climatic conditions, and environmental contamination sources. Agricultural intensity exhibits substantial inter-provincial variation, with some areas characterized by intensive crop cultivation or high-density livestock farming. These activities can increase the environmental loads of protozoan (oo)cysts through the use of organic fertilizers, runoff, or irrigation with untreated water. Climatic differences, such as higher precipitation and humidity, can further facilitate the dissemination of protozoan contaminants in the environment [27]. Thus, detecting protozoan DNA in different provinces depending on the matrix likely reflects localized environmental conditions and matrix-specific susceptibility to contamination.
Finally, the temporal analysis revealed that July recorded the highest prevalence (June: 50%; July: 80%; August: 66.6%; September: 25%) of contaminated honey and pollen samples, aligning with the honeybees’ findings. This peak may be attributed to increased foraging activity during the summer months and/or a higher environmental pathogen load during this period, supported by climatic conditions favorable to protozoan persistence [4].

5. Conclusions

The research conducted following the ISO 17468 and ISO 16140 standards confirmed the effectiveness of the ddRT-PCR method for the rapid and precise identification of Toxoplasma gondii, Giardia intestinalis, and Cryptosporidium genes in honeybees, honey, and pollen. The findings indicate that honeybees, along with pollen and honey, could potentially act as vectors for the transmission of T. gondii, G. intestinalis, and Cryptosporidium spp. Honey and pollen, with their direct use as a food product, can serve as both a valuable indicator of environmental contamination and a reliable marker of food safety. Further studies involving a larger and standardized number of honey, pollen, and honeybee samples are currently underway to confirm these preliminary results.

Supplementary Materials

The following supporting information can be downloaded at: https://www.mdpi.com/article/10.3390/microorganisms13071487/s1, Figure S1: Climatic conditions in the two weeks before sample collection in the Palma Campania and Guardia Lombardi provinces with high parasite prevalence. Figure S2: Climatic conditions in the two weeks before sample collection in the Acerra, Dugenta, and Presenzano provinces with high parasite prevalence.

Author Contributions

Conceptualization, I.D.; methodology, Y.T.R.P.; software A.M.; formal analysis, A.M.; investigation, T.C., S.D.V., L.J.D., O.D.M., G.R. and A.M.; resources, Y.T.R.P.; data curation, A.M. and M.E.; writing—original draft preparation I.D., A.M. and M.E.; writing—review and editing, I.D., R.M. and Y.T.R.P.; visualization, I.D. and R.M.; supervision, Y.T.R.P.; project administration, Y.T.R.P.; funding acquisition, Y.T.R.P. All authors have read and agreed to the published version of the manuscript.

Funding

This research was supported by the Italian Ministry (authorization no. IZS ME 08/22 RC) “project on bee welfare”.

Institutional Review Board Statement

Not applicable.

Informed Consent Statement

Not applicable.

Data Availability Statement

The original contributions presented in this study are included in the article/Supplementary Material. Further inquiries can be directed to the corresponding authors.

Conflicts of Interest

The authors declare no conflicts of interest.

References

  1. WHO, Geneva. Soil-Transmitted Helminth Infections (Updated 2023 January 18). 2023. Available online: https://www.who.int/en/news-room/fact-sheets/detail/soil-transmitted-helminth-infections (accessed on 23 December 2024).
  2. Rossi, F.; Santonicola, S.; Amadoro, C.; Marino, L.; Colavita, G. Food and Drinking Water as Sources of Pathogenic Protozoans: An Update. Appl. Sci. 2024, 14, 5339. [Google Scholar] [CrossRef]
  3. Grellet, A.; Mila, H. Endoparasitic Diseases in Breeding Kennels: A Frequent and Complex Problem Requiring a Holistic Approach. Animals 2024, 14, 2357. [Google Scholar] [CrossRef] [PubMed]
  4. Shapiro, K.; Bahia-Oliveira, L.; Dixon, B.; Dumètre, A.; de Wit, L.A.; VanWormer, E.; Villena, I. Environmental transmission of Toxoplasma gondii: Oocysts in water, soil and food. Food Waterborne Parasitol. 2019, 15, e00049. [Google Scholar] [CrossRef]
  5. Badri, M.; Olfatifar, M.; Karim, R.; Modirian, E.; Houshmand, E.; Abdoli, A.; Nikoonejad, A.; Sotoodeh, S.; Zargar, A.; Samimi, R.; et al. Global prevalence of intestinal protozoan contamination in vegetables and fruits: A systematic review and meta-analysis. Food Control 2022, 133, 108656. [Google Scholar] [CrossRef]
  6. López Ureña, N.M.; Chaudhry, U.; Calero Bernal, R.; Cano Alsua, S.; Messina, D.; Evangelista, F.; Betson, M.; Lalle, M.; Jokelainen, P.; Ortega Mora, L.M.; et al. Contamination of Soil, Water, Fresh Produce, and Bivalve Mollusks with Toxoplasma gondii Oocysts: A Systematic Review. Microorganisms 2022, 10, 517. [Google Scholar] [CrossRef] [PubMed]
  7. Kakakhel, M.A.; Wu, F.; Anwar, Z.; Saif, I.; ul Akbar, N.; Gul, N.; Ali, I.; Feng, H.; Wang, W. The Presence of Toxoplasma gondii in Soil, Their Transmission, and Their Influence on the Small Ruminants and Human Population: A Review. Microb. Pathog. 2021, 158, 104850. [Google Scholar] [CrossRef]
  8. González-Alcaraz, M.N.; Malheiro, C.; Cardoso, D.N.; Prodana, M.; Morgado, R.G.; van Gestel, C.A.M.; Loureiro, S. Bioaccumulation and Toxicity of Organic Chemicals in Terrestrial Invertebrates; Springer Science and Business Media Deutschland GmbH: Berlin, Germany, 2020; pp. 149–189. [Google Scholar] [CrossRef]
  9. Hristovski, M.; Cvetkovik, A.; Cvetkovik, I.; Dukoska, V. Concept of one health-a new professional imperative. Maced. J. Med. Sci. 2010, 3, 229–232. [Google Scholar] [CrossRef]
  10. Cunningham, M.M.; Tran, L.; McKee, C.G.; Ortega Polo, R.; Newman, T.; Lansing, L.; Griffiths, J.S.; Bilodeau, G.J.; Rott, M.; Marta Guarna, M. Honey bees as biomonitors of environmental contaminants, pathogens, and climate change. Ecol. Indic. 2022, 134, 108457. [Google Scholar] [CrossRef]
  11. Girotti, S.; Ghini, S.; Ferri, E.; Bolelli, L.; Colombo, R.; Serra, G.; Porrini, C.; Sangiorgi, S. Bioindicators and biomonitoring: Honeybees and hive products as pollution impact assessment tools for the Mediterranean area. Euro Mediterr. J. Environ. Integr. 2020, 5, 62. [Google Scholar] [CrossRef]
  12. Grabowski, N.T.; Klein, G. Microbiology and Foodborne Pathogens in Honey. Crit. Rev. Food Sci. Nutr. 2015, 57, 1852–1862. [Google Scholar] [CrossRef]
  13. Bellucci, V.; Lucci, S.; Bianco, P.; Ubaldi, A.; Felicioli, A.; Porrini, C.; Mutinelli, F.; Battisti, S.; Spallucci, V.; Cersini, A.; et al. Monitoring honey bee health in five natural protected areas in Italy. Vet. Ital. 2019, 55, 15–25. [Google Scholar] [CrossRef] [PubMed]
  14. Trudel-Ferland, M.; Collard, M.È.; Goulet-Beaulieu, V.; Jubinville, E.; Hamon, F.; Jean, J. Evaluation of a new automated viral RNA extraction platform for hepatitis A virus and human norovirus in testing of berries, lettuce, and oysters. Int. J. Food Microbiol. 2024, 416, 110664. [Google Scholar] [CrossRef] [PubMed]
  15. Mancusi, A.; Fulgione, A.; Girardi, S.; Di Maro, O.; Capuano, F.; Proroga, Y.T.R.; Cristiano, D. Droplet Digital PCR (ddPCR) Analysis for Detecting Shiga-Toxin-Producing Escherichia coli (STEC). Appl. Sci. 2022, 12, 3654. [Google Scholar] [CrossRef]
  16. Haque, R.; Roy, S.; Siddique, A.; Mondal, U.; Rahman, S.M.; Mondal, D.; Houpt, E.; Petri, W.A., Jr. Multiplex real-time PCR assay for detection of Entamoeba histolytica, Giardia intestinalis, and Cryptosporidium spp. Am. J. Trop. Med. Hyg. 2007, 76, 713–717. [Google Scholar] [CrossRef] [PubMed]
  17. Mazzara, M.; Savini, J.; Delobel, J.; Broll, H.; Damant, A.; Paoletti, J.; Van den Eede, G. Definition of Minimum Performance Requirements for Analytical Methods of GMO Testing Part 2 European Network of GMO Laboratories European Union Reference Laboratory for Genetically Modified Food and Feed—Part 2; Publications Office of the European Union: Luxembourg, 2023. [Google Scholar] [CrossRef]
  18. Cazeaux, C.; Lalle, M.; Durand, L.; Aubert, D.; Favennec, L.; Dubey, J.P.; Geffard, A.; Villena, I.; La Carbona, S. Evaluation of Real-Time QPCR-Based Methods to Detect the DNA of the Three Protozoan Parasites Cryptosporidium Parvum, Giardia Duodenalis and Toxoplasma gondii in the Tissue and Hemolymph of Blue Mussels (M. edulis). Food Microbiol. 2022, 102, 103870. [Google Scholar] [CrossRef]
  19. Srisutham, S.; Saralamba, N.; Malleret, B.; Rénia, L.; Dondorp, A.M.; Imwong, M. Four human Plasmodium species quantification using droplet digital PCR. PLoS ONE 2017, 12, e0175771. [Google Scholar] [CrossRef]
  20. Baltrušis, P.; Höglund, J. Digital PCR: Modern solution to parasite diagnostics and population trait genetics. Parasit. Vectors 2023, 16, 143. [Google Scholar] [CrossRef]
  21. ISO 17468; Microbiology of the Food Chain—Technical Requirements and Guidance on Establishment or Revision of a Standardized Reference Method. International Organization for Standardization, Beuth: Berlin, Germany, 2016.
  22. ISO 16140-1; Microbiology of the Food Chain—Method Validation—Part 1—Vocabulary. International Organization for Standardization, Beuth: Berlin, Germany, 2016.
  23. ISO 16140-2; Microbiology of the Food Chain—Method Validation—Part 2—Protocol for the Validation of Alternative (Proprietary) Methods Against a Reference Method. International Organization for Standardization, Beuth: Berlin, Germany, 2016.
  24. Chalmers, R.M.; Katzer, F.; La Carbona, S.; Lalle, M.; Razakandrainibe, R.; Robertson, L.J.; Robinson, G.; Šoba, B.; Temesgen, T.; Mayer-Scholl, A. A Guide to Standardise Artificial Contamination Procedures with Protozoan Parasite Oocysts or Cysts during Method Evaluation, Using Cryptosporidium and Leafy Greens as Models. Food Control 2022, 134, 108678. [Google Scholar] [CrossRef]
  25. Signorelli, D.; D’Auria, L.J.; Di Stasio, A.; Gallo, A.; Siciliano, A.; Esposito, M.; De Felice, A.; Rofrano, G. Application of a Quality-Specific Environmental Risk Index for the Location of Hives in Areas with Different Pollution Impacts. Agriculture 2023, 13, 998. [Google Scholar] [CrossRef]
  26. Berrouch, S.; Escotte-Binet, S.; Amraouza, Y.; Flori, P.; Aubert, D.; Villena, I.; Hafid, J. Cryptosporidium spp., Giardia duodenalis and Toxoplasma gondii Detection in Fresh Vegetables Consumed in Marrakech, Morocco. Afr. Health Sci. 2020, 20, 1669–1678. [Google Scholar] [CrossRef]
  27. Flamminii, F.; Consalvo, A.; Cichelli, A.; Chiaudani, A. Assessing Mineral Content and Heavy Metal Exposure in Abruzzo Honey and Bee Pollen from Different Anthropic Areas. Foods 2024, 13, 1930. [Google Scholar] [CrossRef] [PubMed]
  28. Ogwu, M.C.; Izah, S.C. Honey as a Natural Antimicrobial. Antibiotics 2025, 14, 255. [Google Scholar] [CrossRef] [PubMed]
  29. Almasaudi, S. The Antibacterial Activities of Honey. Saudi J. Biol. Sci. 2021, 28, 2188–2196. [Google Scholar] [CrossRef] [PubMed]
  30. Salkova, D.; Panayotova-Pencheva, M. Honey Bees and Their Products as Indicators of Environmental Pollution: A Review. Agric. Sci. Technol. 2016, 8, 175–182. [Google Scholar] [CrossRef]
  31. Gonzalez-Ramirez, L.C.; Djabayan-Djibeyan, P.; Prato, J.G.; Garcia Rios, C.A.; Carrero, J.C.; Trelis, M.; Fuentes, M.V. Field study of parasitic contamination of fruits, vegetables and leafy greens in the Ecuadorian Andes. F1000Research 2023, 12, 532. [Google Scholar] [CrossRef]
Figure 1. Map showing the sampling sites, classified as high-impact areas (HIAs) and low-impact areas (LIAs), investigated in this study in southern Italy.
Microorganisms 13 01487 g001
Table 1. Samples (i.e., honeybees, honey, and pollen) and collection sites in the Campania region.
Sample Sampling PeriodSampling Site
Honey beesS1June Nocera (SA)
S2JuneGuardia Lombardi
S3JunePalma Campania (NA)
S4July Presenzano (CE)
S5July Acerra (NA)
S6JulyPignataro (CE)
S7July Marcianise (CE)
S8July Mercato S.S. (SA)
S9JulyNocera (SA)
S10July Palma Campania (NA)
S11JulyMercato S.S. (SA)
S12August San Felice Cancello (CE)
S13August San Felice Cancello (CE)
S14AugustDugenta (BN)
S15September Roccagloriosa (SA)
S16SeptemberAscea (SA)
HoneyS17June Guardia Lombardi (AV)
S18June Guardia Lombardi (AV)
S19July Acerra (NA)
S20July Pignataro (CE)
S21July Marcianise (CE)
S22JulyPresenzano (CE)
S23JulyMercato S.S. (SA)
S24August Dugenta (BN)
S25AugustDugenta (BN)
S26AugustSan Felice Cancello (CE)
S27September Presenzano (CE)
S28September Ascea (SA)
PollenS29June Guardia Lombardi (AV)
S30June Guardia Lombardi (AV)
S31July Acerra (NA)
S32JulyAcerra (NA)
S33July Mercato S.S. (SA)
S34August Dugenta (BN)
S35August Dugenta (BN)
S36AugustSan Felice Cancello (CE)
Table 2. Primers and probes used for the parasites’ detection.
Primer NameSequence 5′–3′ConcentrationsReference
AF1CACAGAAGGGACAGAAGT500 nM[15]
AF2TCGCCTTCATCTACAGTC500 nM
AF probeFAM—CTCTCCTCCAAGACGGCTGG—BHQ250 nM
GD 80 ForGACGGCTCAGGACAACGGTT360 nM[16]
GD 127 RevTTGCCAGCGGTGTCCG360 nM
GD 105 probeFAM—CCCGCGGCGGTCCCTGCTAG—BHQ190 nM
COWP ForCAAATTGATACCGTTTGTCCTTCTG600 nM[17]
COWP RevGGCATGTCGATTCTAATTCAGCT600 nM
Crypto probeFAM—TGCCATACATTGTTGTCCTGACAAATTGAAT—BHQ1240 nM
BHQ: Black Hole Quencher.
Table 3. Honey, pollen, and honeybees (CV%) for each concentration level of the parasite sample.
100 gc/μL 10 gc/μL 1 gc/μL
HoneybeeToxoplasma gondii0.622.9337.89
Giardia intestinalis0.524.9251.22
Cryptosporidium spp.0.415.7251.07
HoneyToxoplasma gondii0.647.8749.33
Giardia intestinalis0.647.8665
Cryptosporidium spp.0.8311.6750
PollenToxoplasma gondii3.7529.88NOT DETECTED
Giardia intestinalis6.7443.09NOT DETECTED
Cryptosporidium spp.3.8448.23NOT DETECTED
Table 4. Parasite-positive honeybee samples.
Sampling PeriodSampleSampling SiteToxoplasma gondiiGiardia intestinalisCryptosporidium spp.
DDPCRcopies/μLDDPCRcopies/μLDDPCRcopies/μL
JuneS1Nocera (SA)+4.6
JuneS2Guardia Lombardi (AV)+14.1+13.8+12.4
JuneS3Palma Campania (NA)+21.5+18.8+6.8
JulyS4Presenzano (CE)+2.5+1.1+1
JulyS5Acerra (NA)+3.2+5.6+4.6
JulyS6Pignataro (CE)+2.1+4.3
JulyS7Marcianise (CE)-
JulyS8Mercato S.S. (SA)+1.6
JulyS9Nocera (SA)+9.6+19.2
JulyS10Palma Campania (NA)+6+5.9
JulyS11Mercato S.S. (SA)-
AugustS12San Felice Cancello (CE)+1+1.6+0.7
AugustS13San Felice Cancello (CE)-
AugustS14Dugenta (BN)+3.7+6.5+4.3
SeptemberS15Roccagloriosa (SA)-
SeptemberS16Ascea (SA)+2.3
Prevalence (%)43.757550
IC 95%23.1–66.850.5–89.828–72
+ = positive samples; − negative samples.
Table 5. Parasite-positive honey samples.
Sampling PeriodSampleSampling SiteToxoplasma gondiiGiardia intestinalisCryptosporidium spp.
DDPCRcopies/μLDDPCRcopies/μLDDPCRcopies/μL
JuneS17Guardia Lombardi (AV)
JuneS18Guardia Lombardi (AV)
JulyS19Acerra (NA)
July S20Pignataro (CE)+1.5
July S21Marcianise (CE)+0.13
July S22Presenzano (CE)
JulyS26Mercato S.S. (SA)+1.2
AugustS24Dugenta (BN)
AugustS23Dugenta (BN)+0.13
AugustS25San Felice Cancello (CE)
SeptemberS27Presenzano (CE)
SeptemberS28Ascea (SA)+0.8
Prevalence (%)258.38.3
IC 95%8.9–53.21.5–35.41.5–35.4
+ = positive samples; − negative samples.
Table 6. Parasite-positive pollen samples.
Sampling PeriodSampleSampling SiteToxoplasma gondiiGiardia intestinalisCryptosporidium spp.
DDPCRcopies/μLDDPCRcopies/μLDDPCRcopies/μL
JuneS29Guardia Lombardi (AV)+7.8+7.8+7.9
JuneS30Guardia Lombardi (AV)
JulyS31Acerra (NA)+1.1
July S32Acerra (NA)
July S33Mercato S.S. (SA)+24.3+14.9+30.6
AugustS34Dugenta (BN)+0.7+0.4+1.2
AugustS35Dugenta (BN)
AugustS36San Felice Cancello (CE)+2.2+4.4
Prevalence (%)62.537.550
IC 95%30.6–86.313.7–69.421.5–78.5
+ = positive samples; − negative samples.
Disclaimer/Publisher’s Note: The statements, opinions and data contained in all publications are solely those of the individual author(s) and contributor(s) and not of MDPI and/or the editor(s). MDPI and/or the editor(s) disclaim responsibility for any injury to people or property resulting from any ideas, methods, instructions or products referred to in the content.

