
Comparison of Photofermentative Hydrogen Production in Cylindrical Photobioreactors Using Different Mixing Systems

 ,
,  ,
,  and
and
Abstract
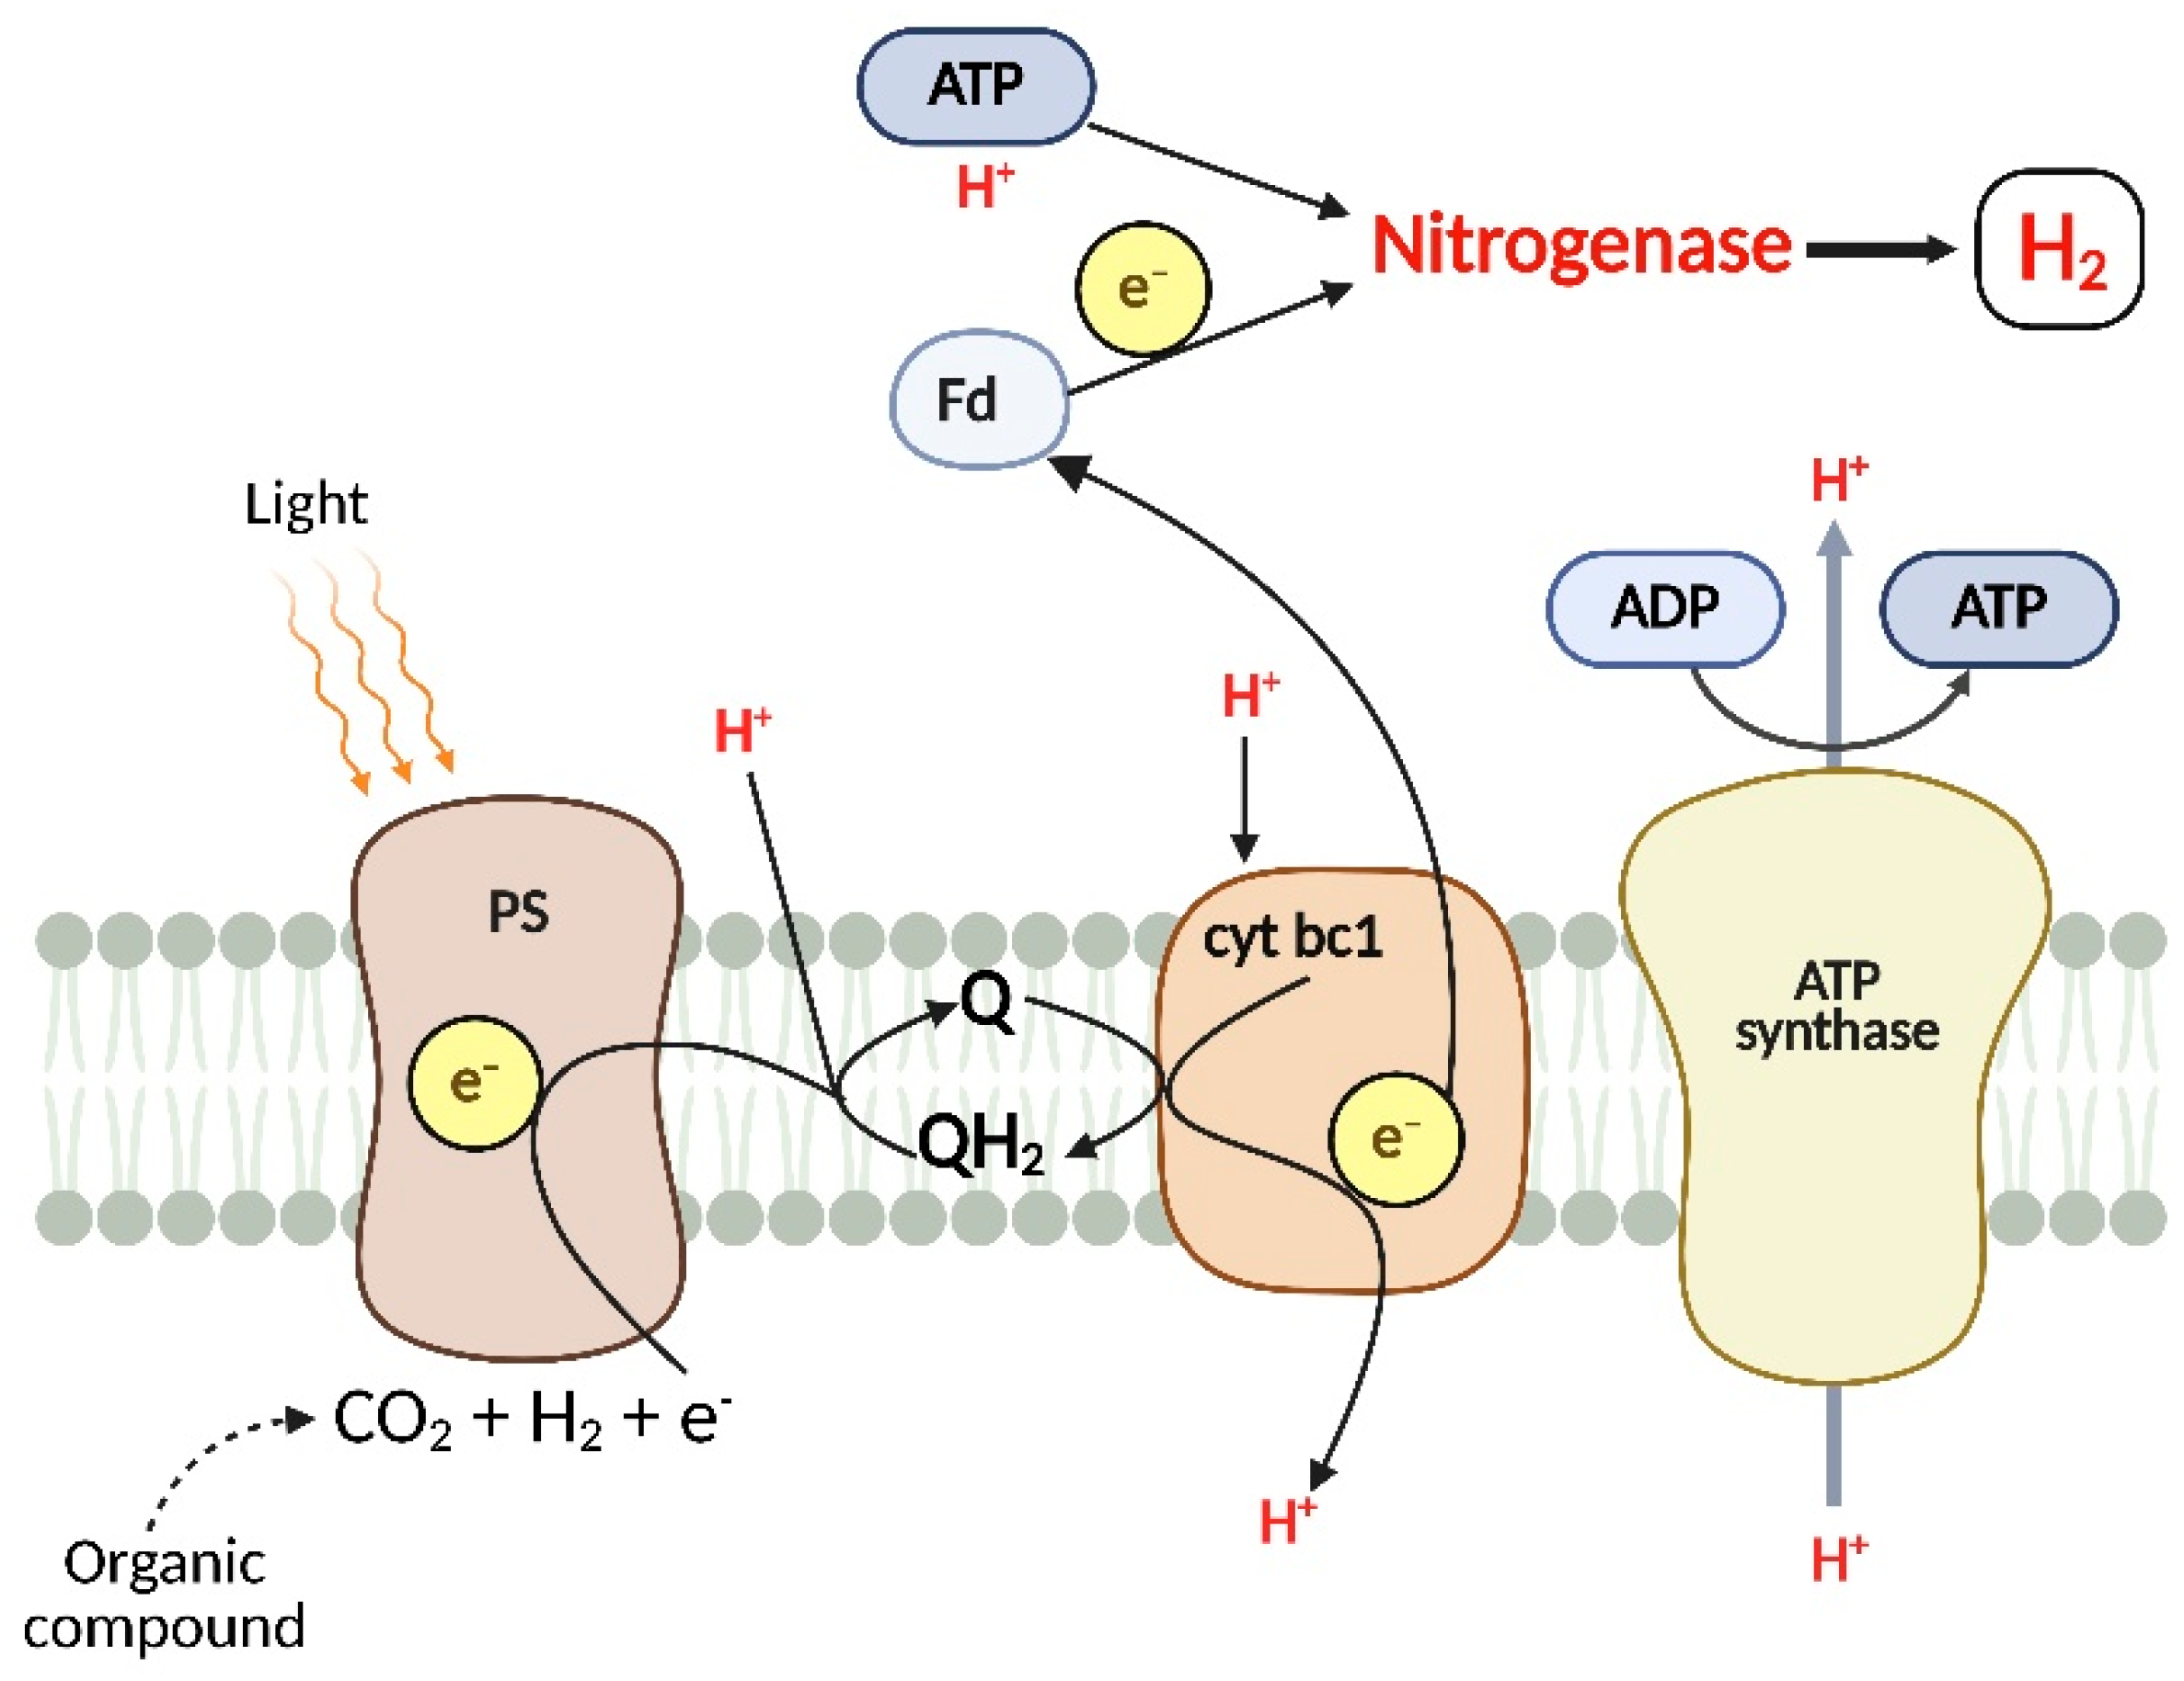
1. Introduction
2. Materials and Methods
2.1. Growth Conditions
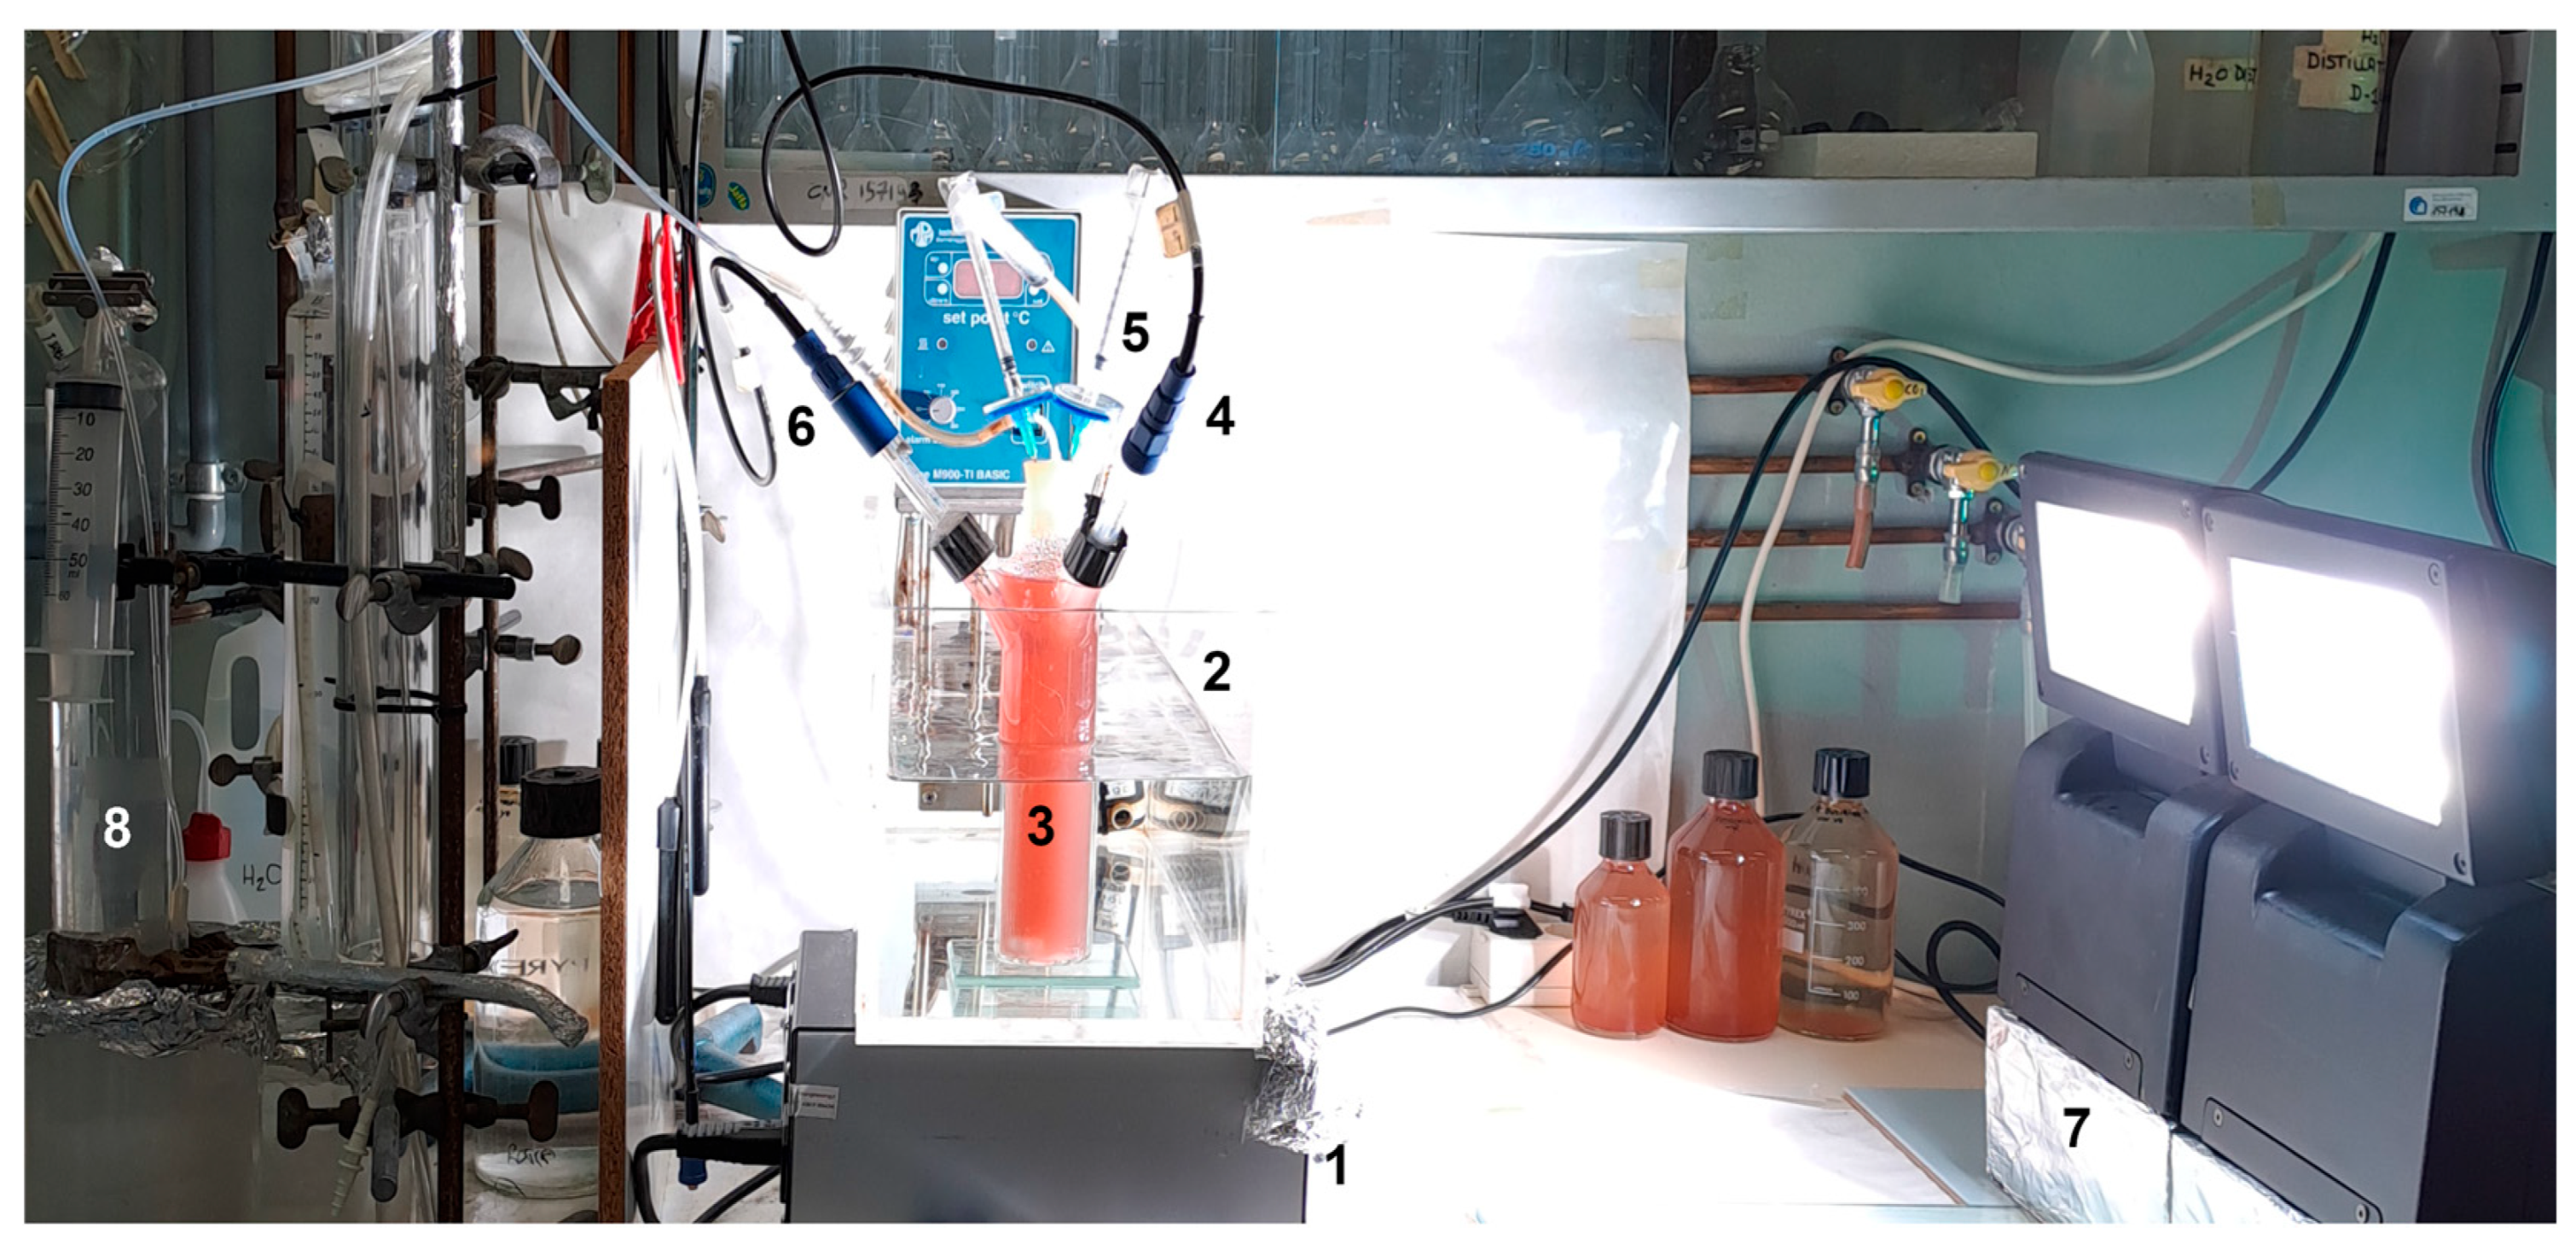
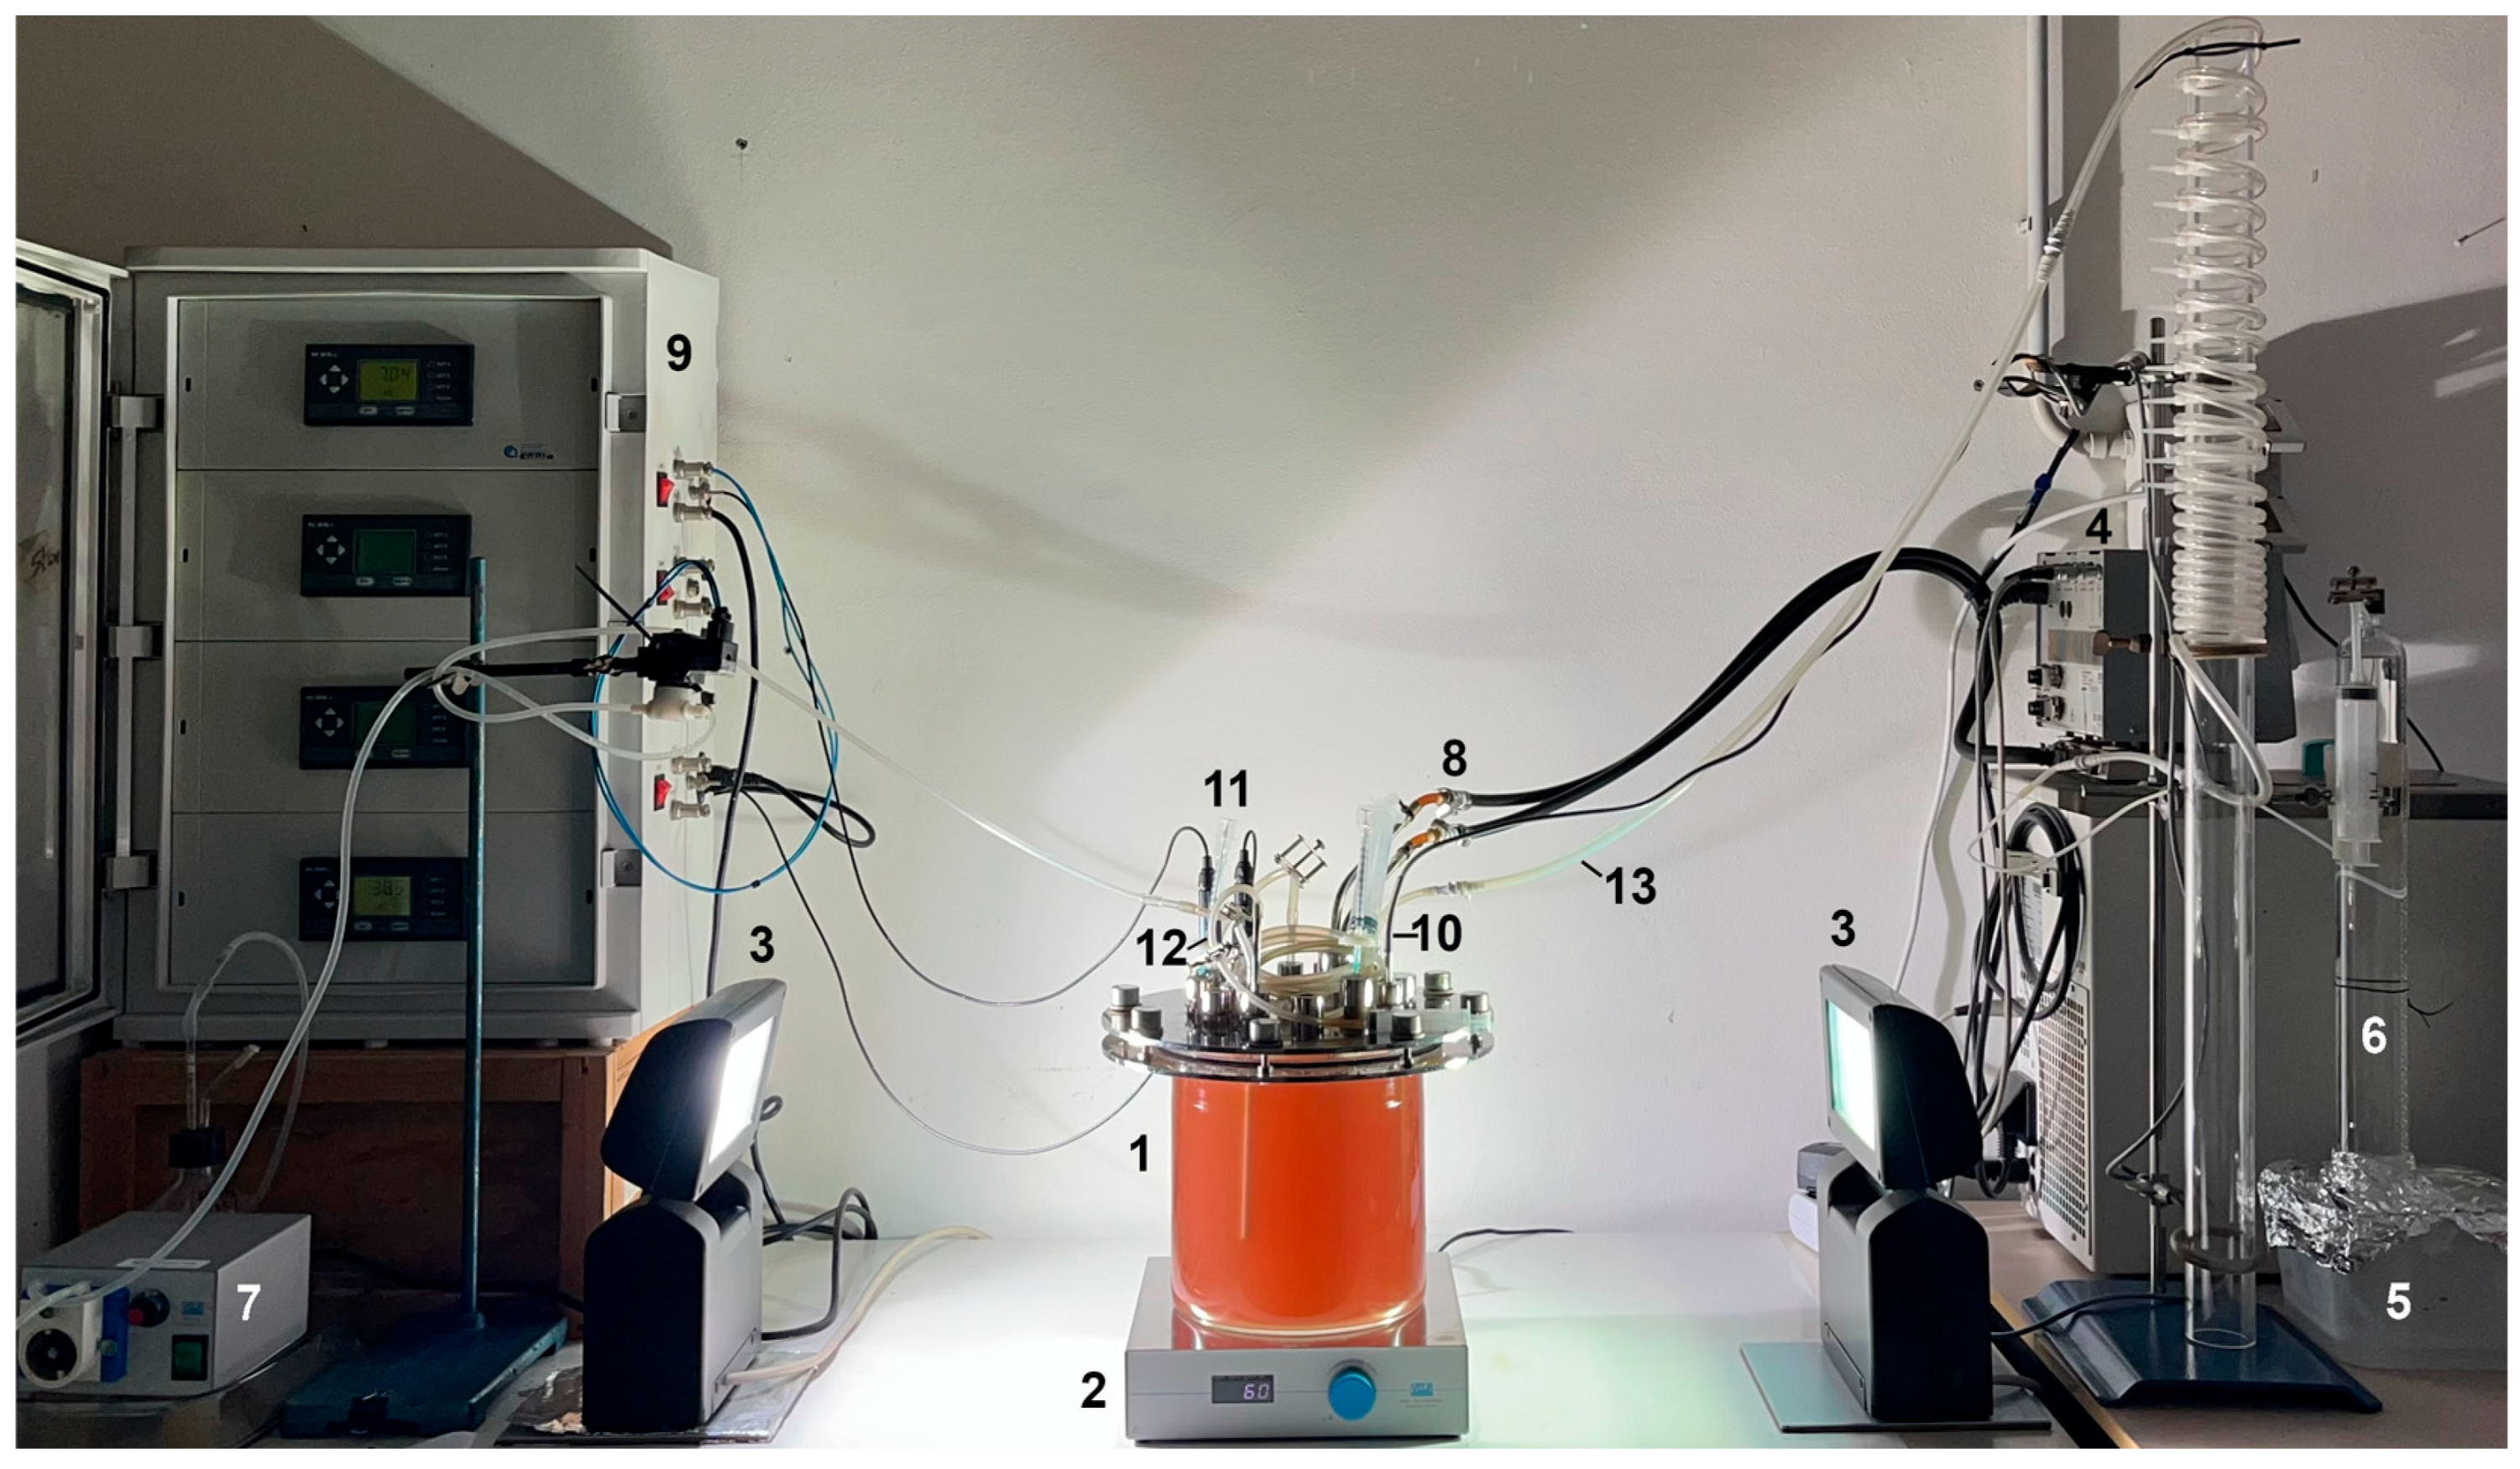
2.2. Photobioreactors Set-Up
2.2.1. The 0.2-PBR
2.2.2. The 4.0-PBR
2.3. H2 Production
2.4. Analytical Procedures
3. Results
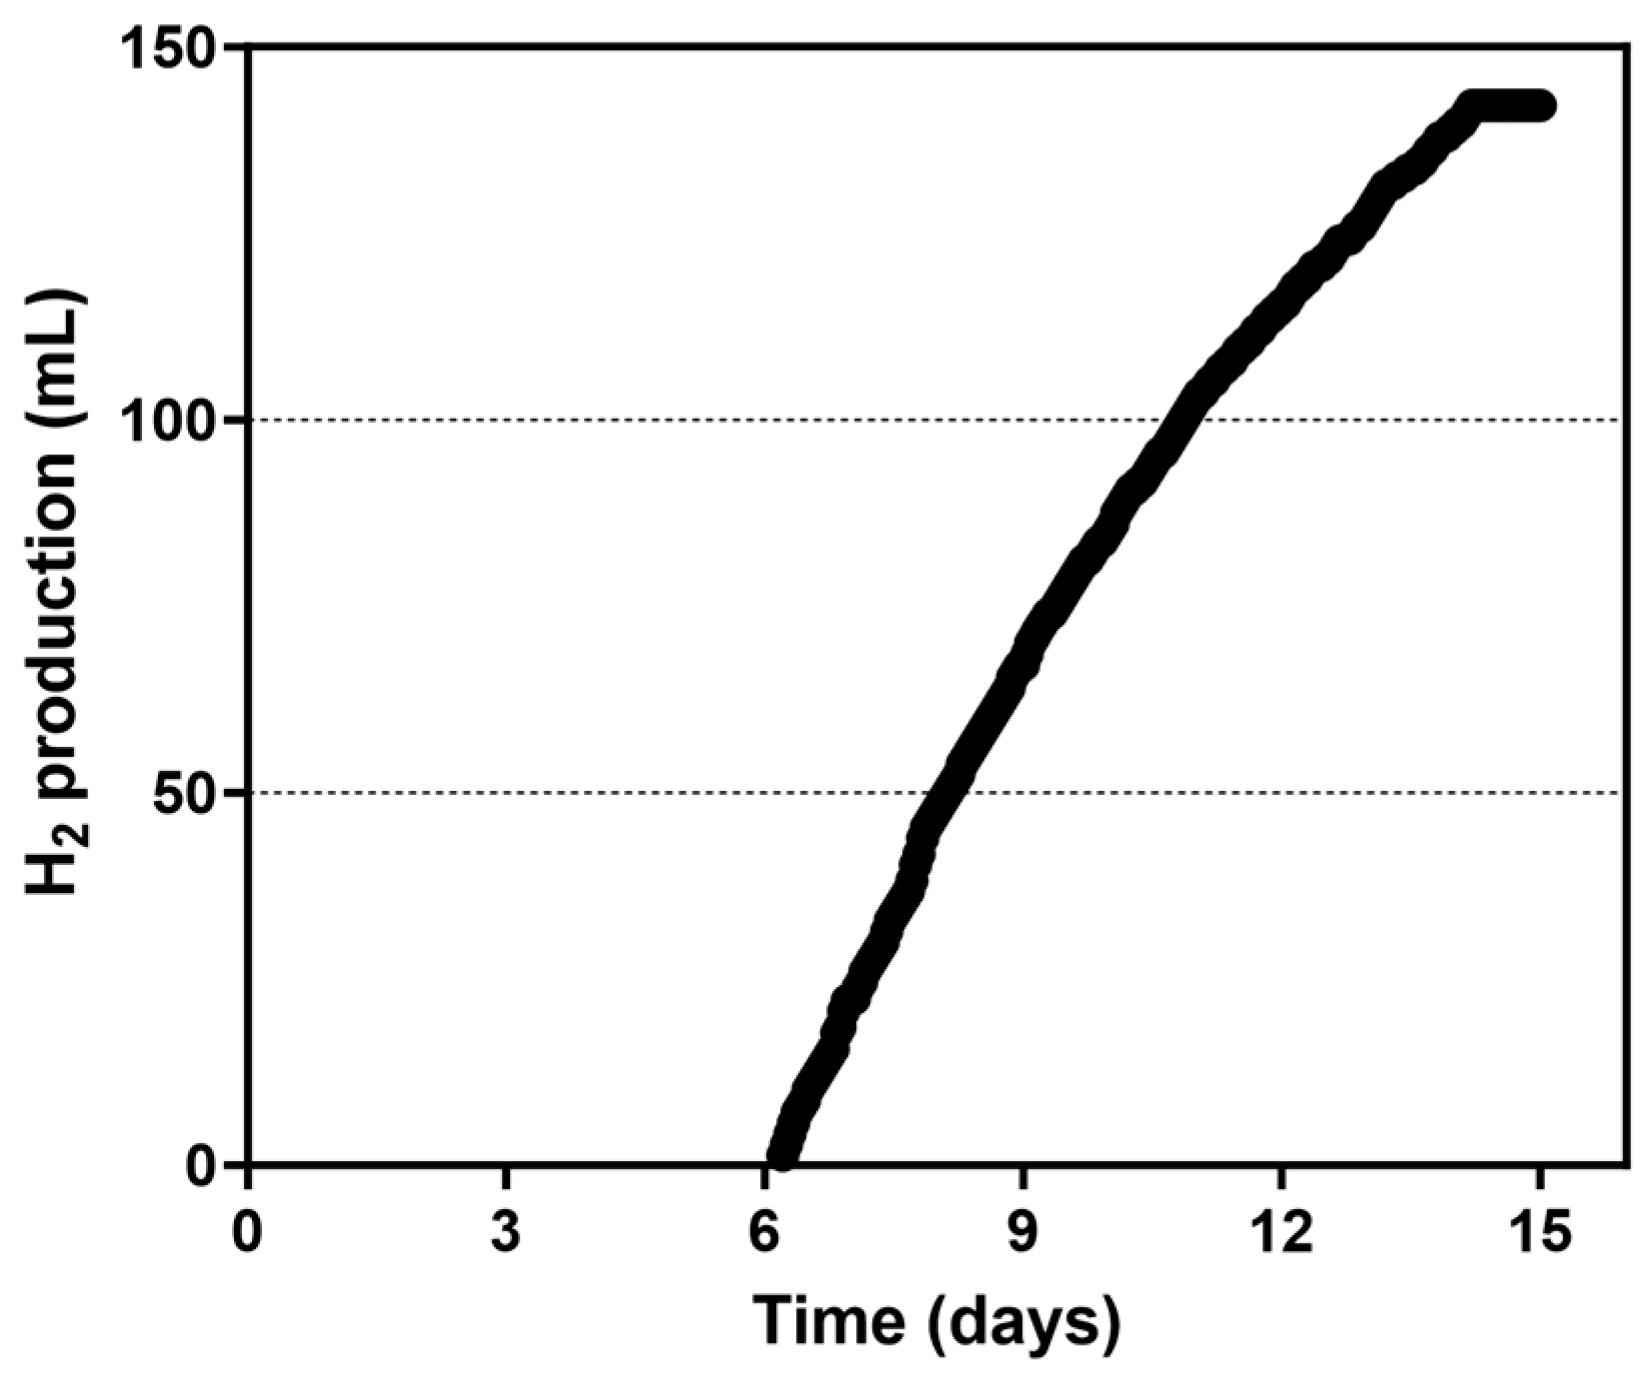
3.1. H2 Production in the 0.2-PBR
3.2. H2 Production in the 4.0-PBR
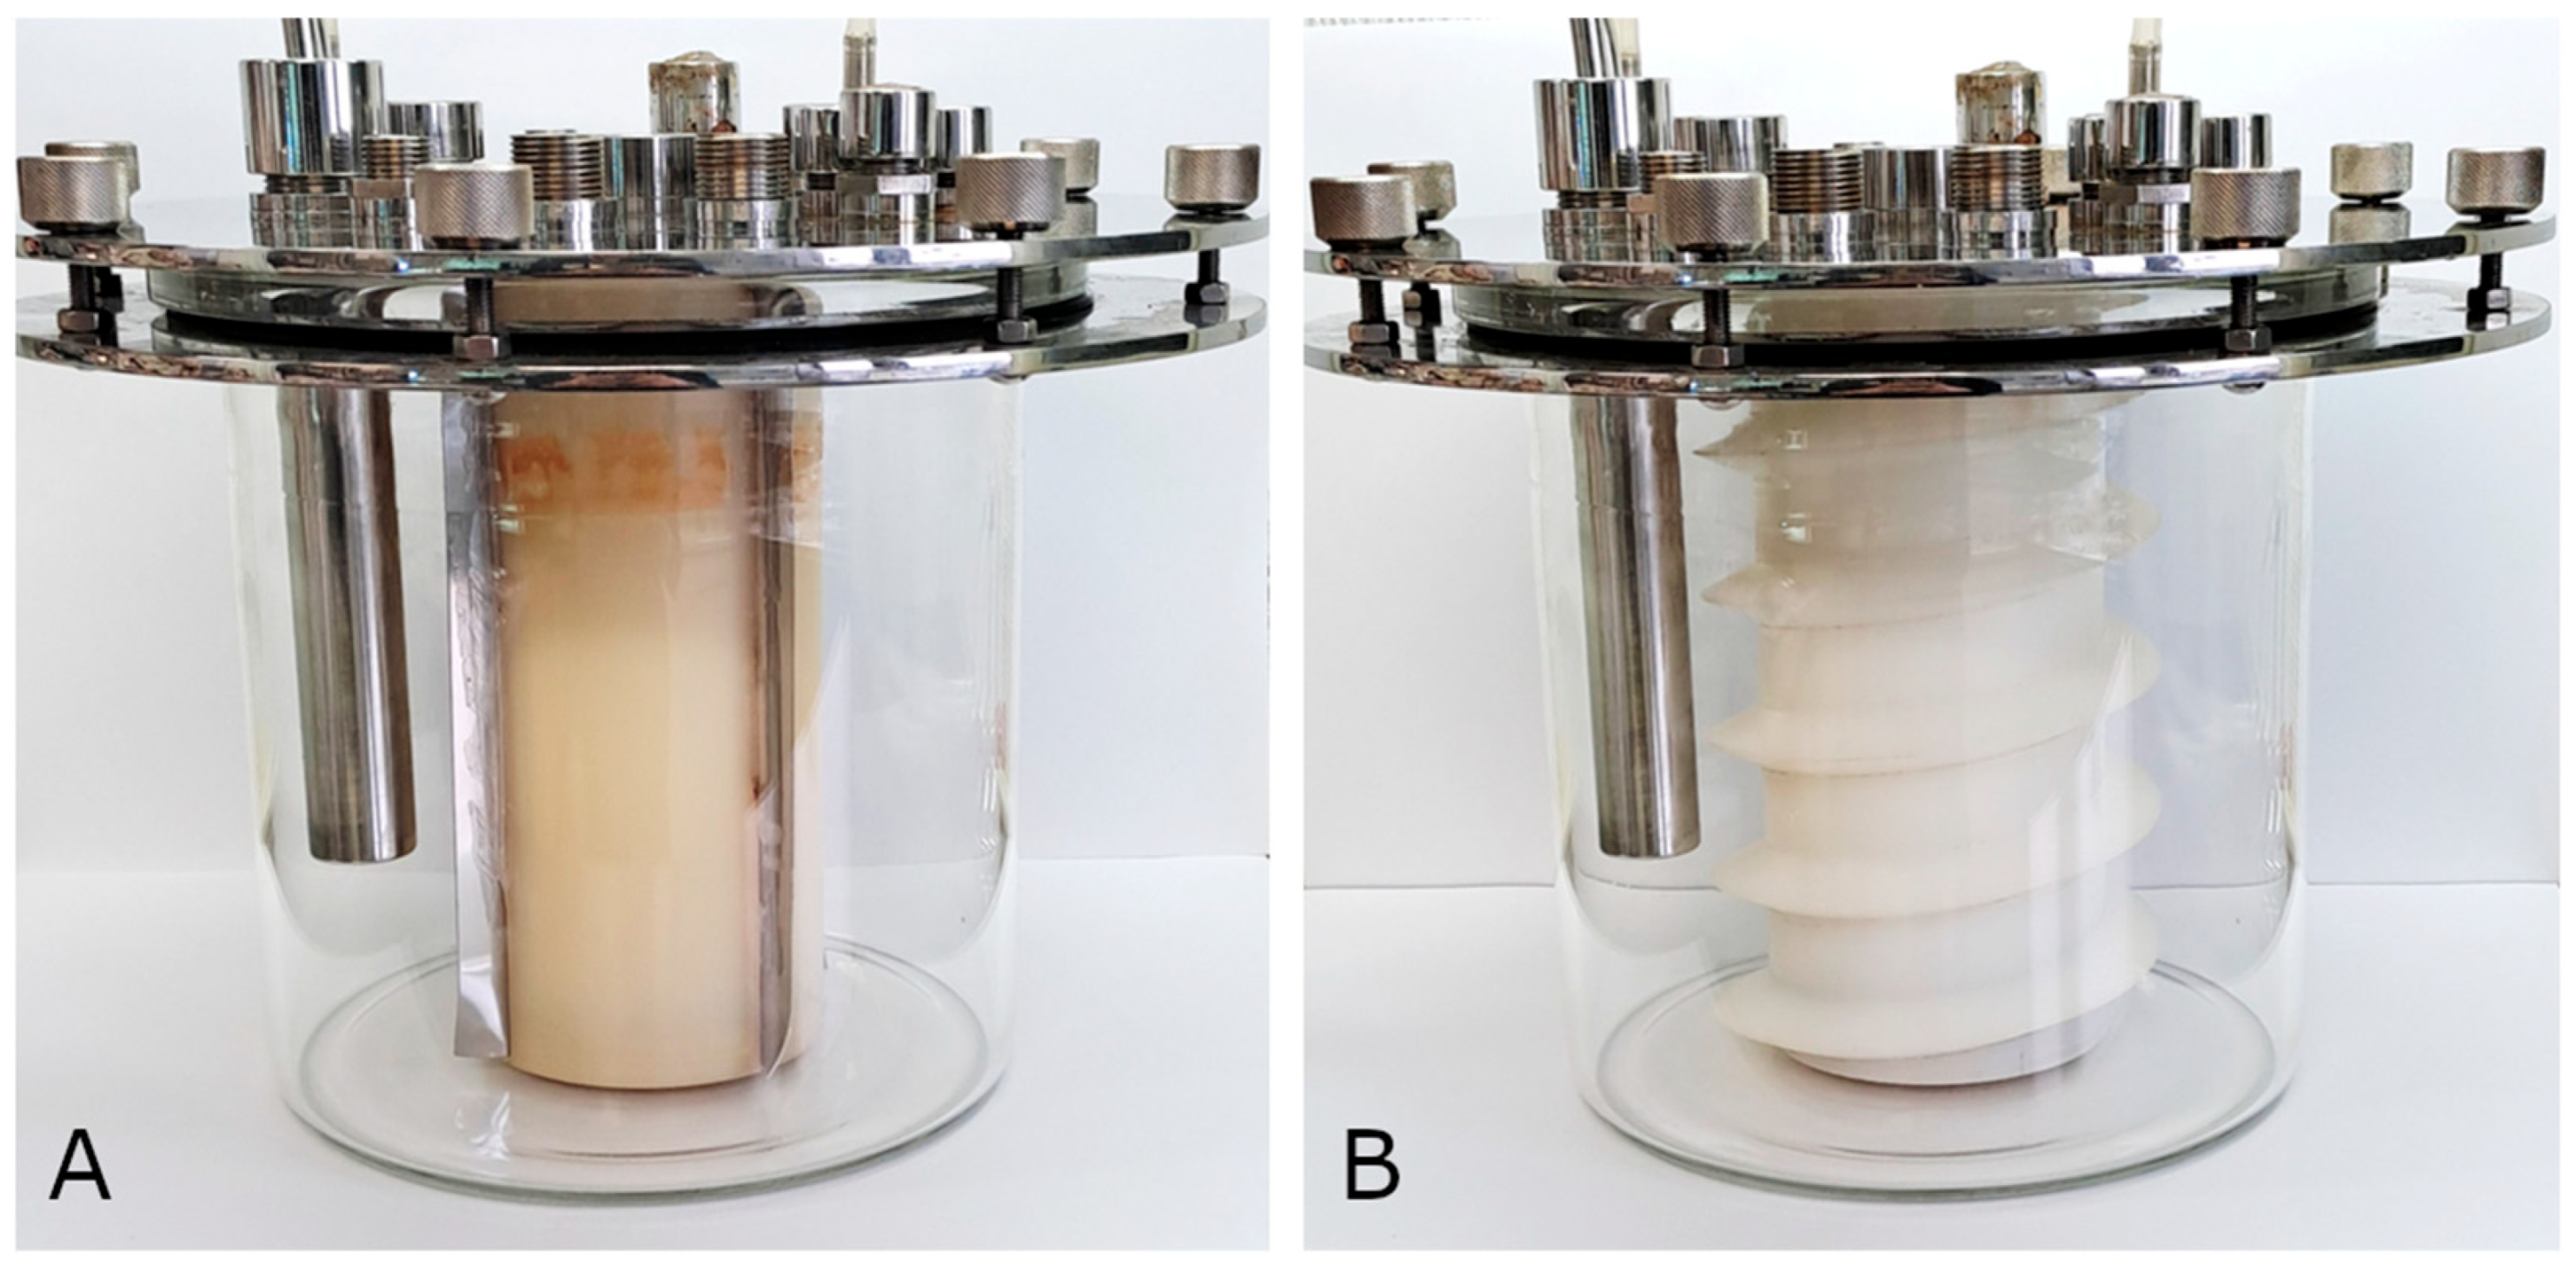
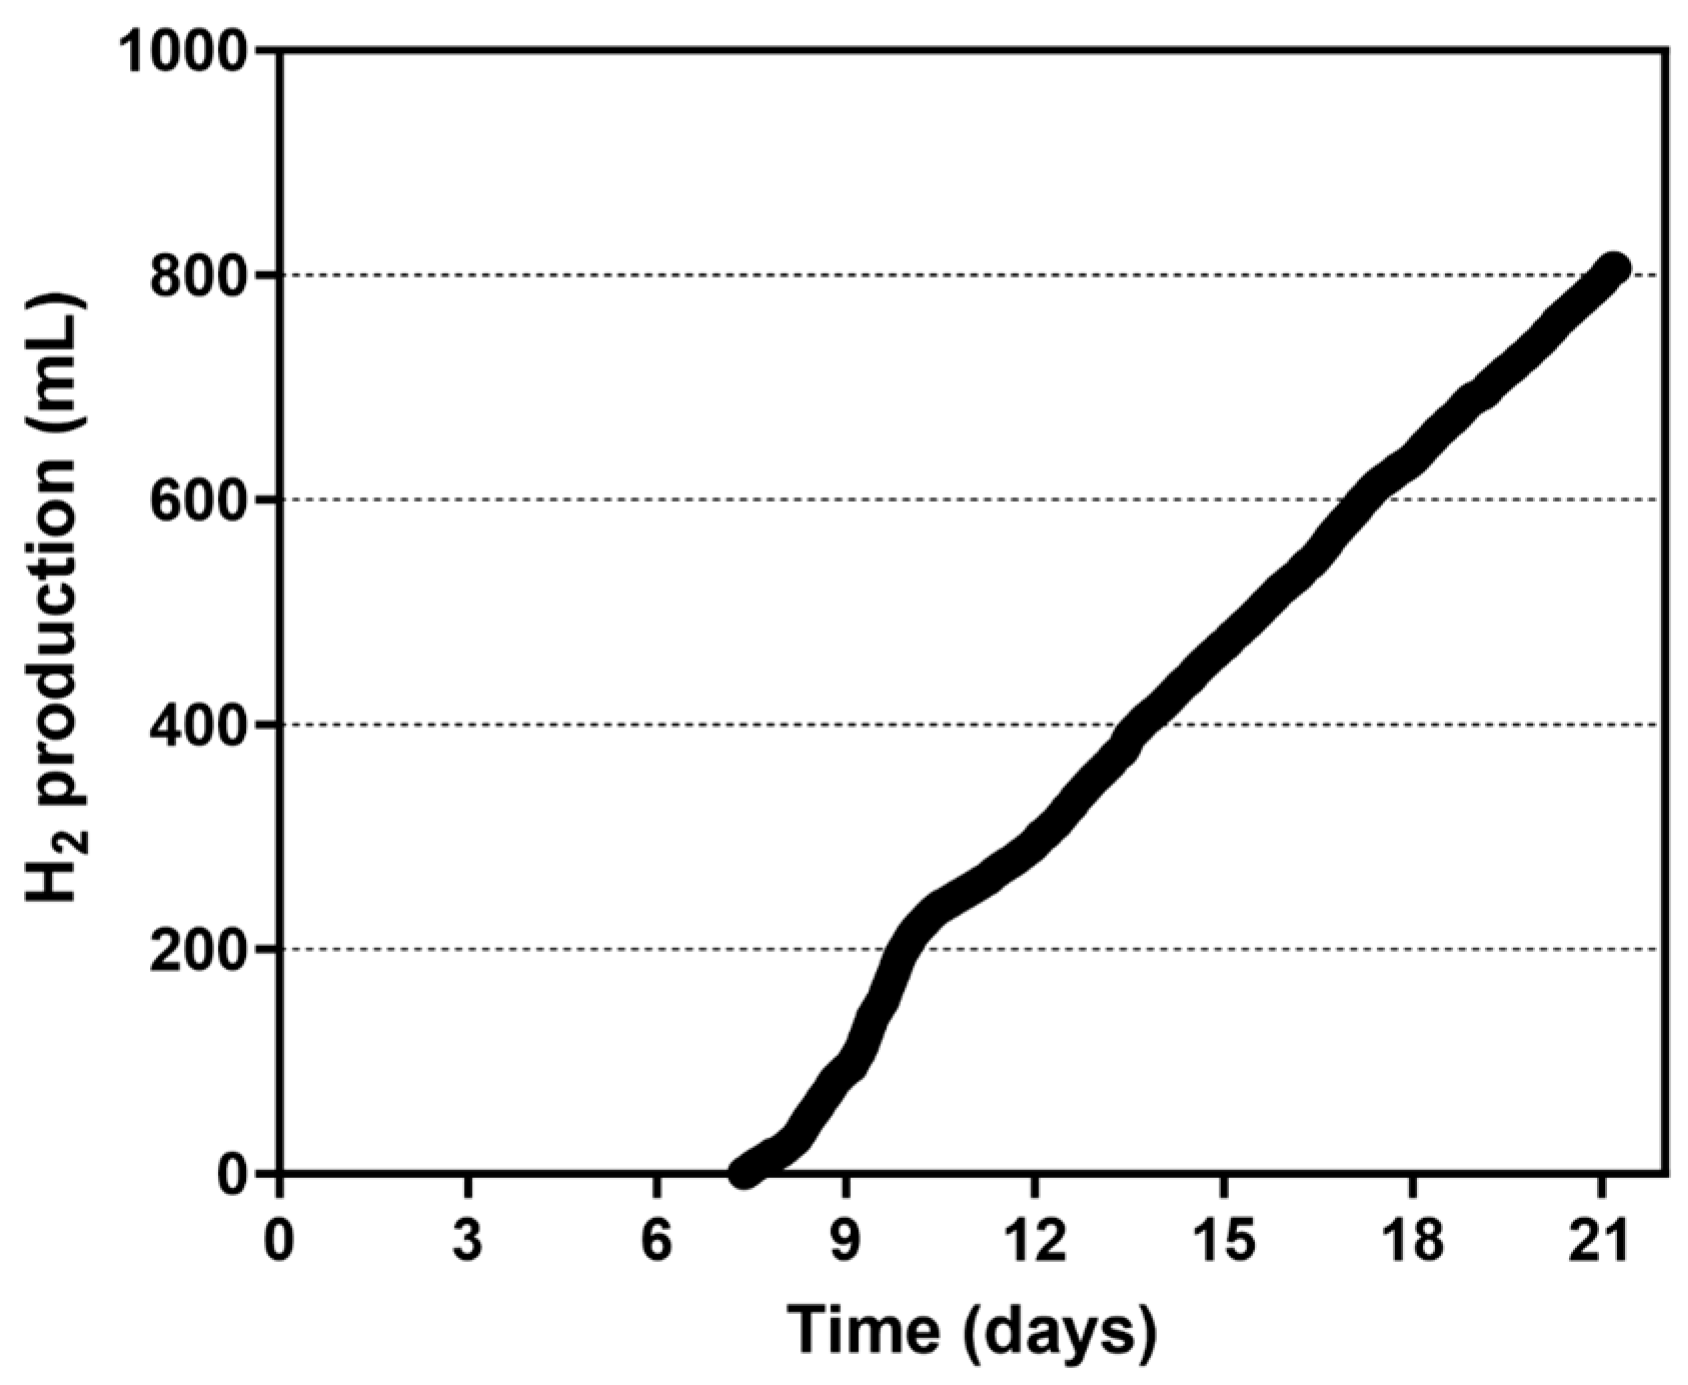
3.2.1. Use of a 4-Paddle Rotor
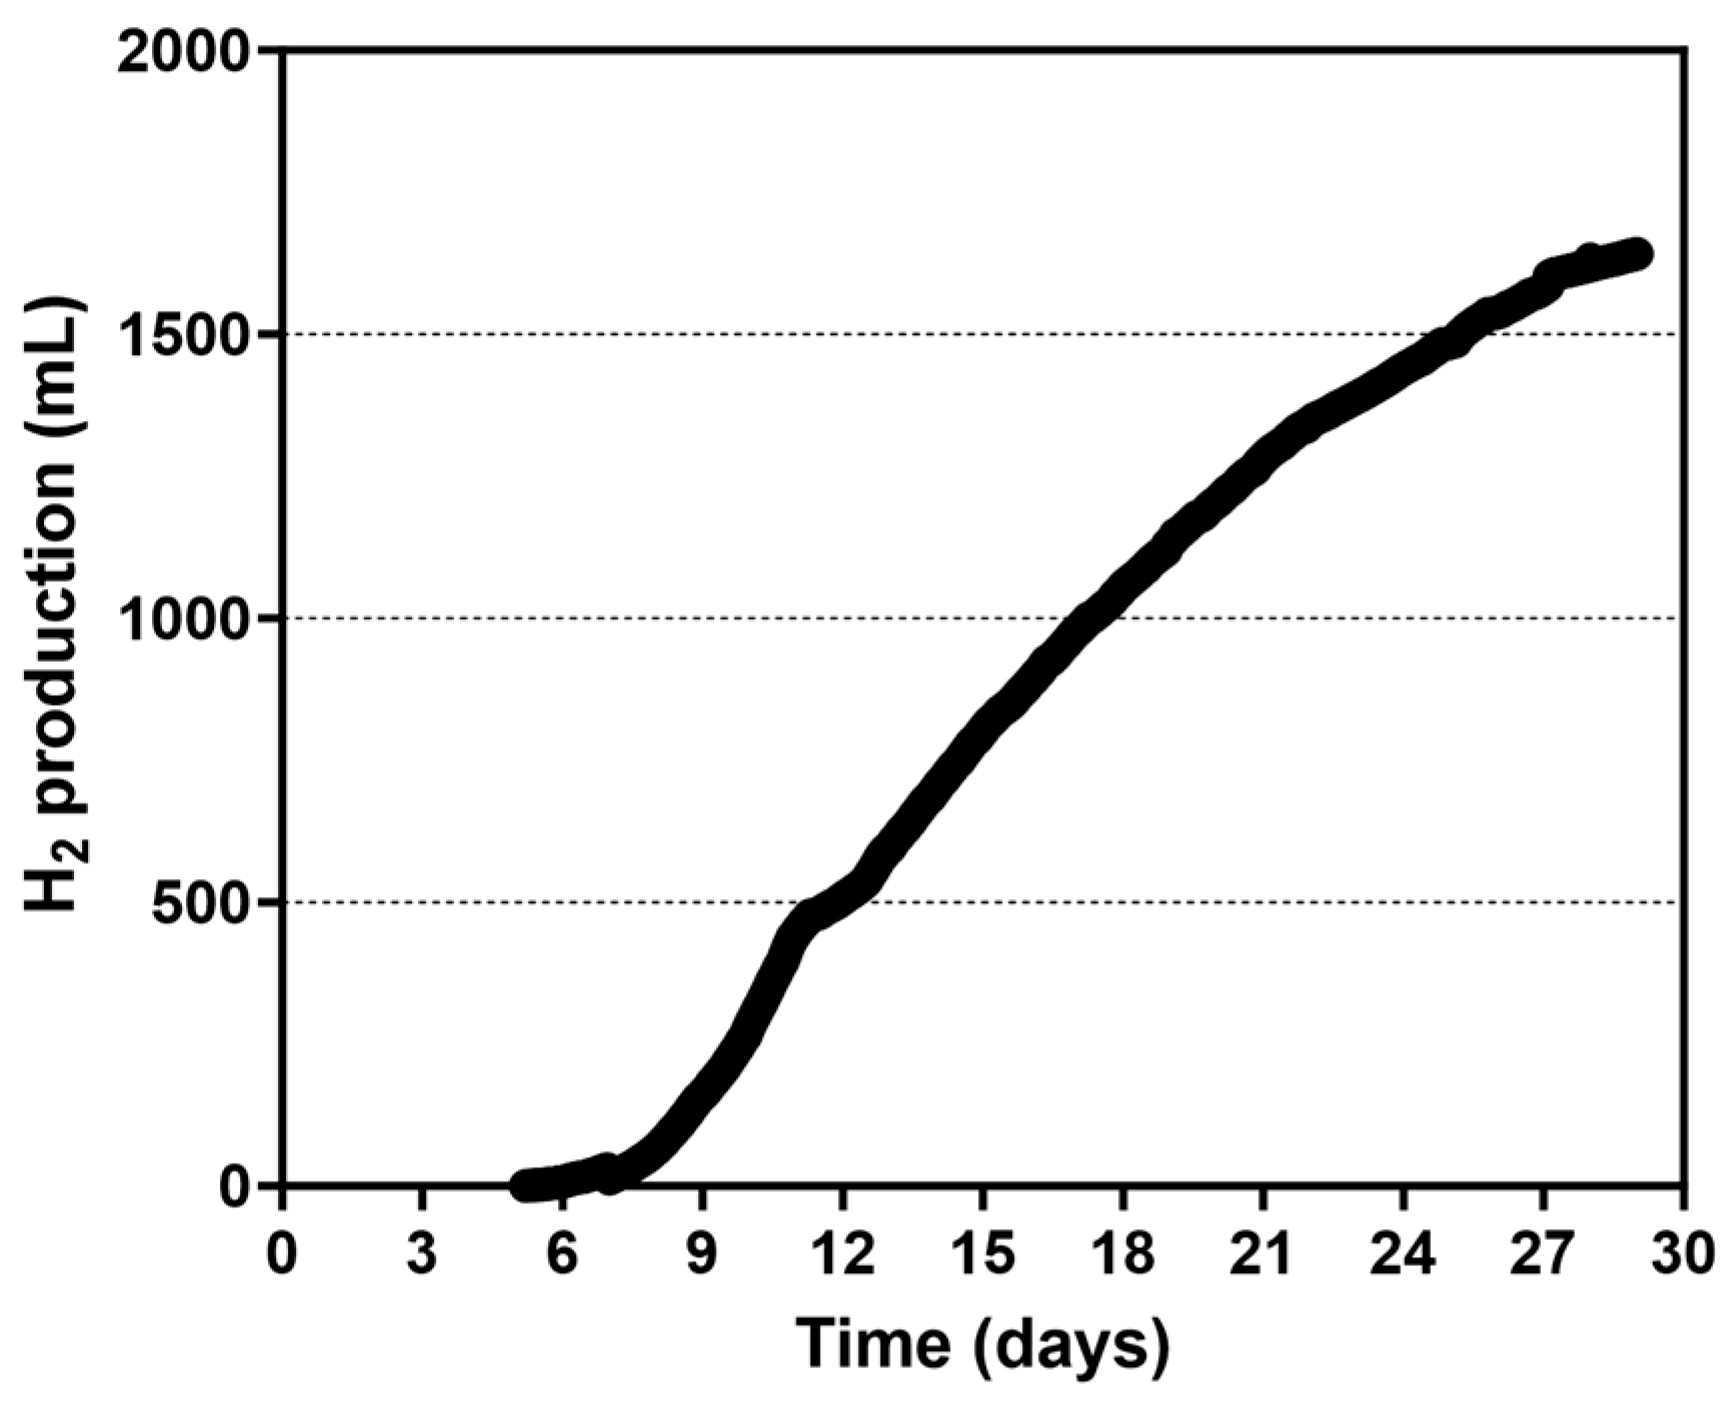
3.2.2. Use of a Spiral Rotor
4. Discussion

| Organism | PBR Type (Liters) | Carbon Source (g/L) | Light Intensity | Productivity (mL/L/h) | LCE (%) | Reference |
|---|---|---|---|---|---|---|
| R. sphaeroides HY01 | Composite tubular (70) | Glucose (5.4) | 3000 lx | 22.8 | 4.0 | [41] |
| R. sphaeroides O.U. 001 | Flat plate (0.235) | Malate (2.0) | 64 W/m2 | 12.7 | - | [42] |
| R. capsulatus | Stirred tank (1.5) | Lactose (10) | 5000 lx | 3.37 | - | [43] |
| Rhodospirillum rubrum | Stirred tank (1.5) | Lactose (10) | 5000 lx | 6.4 | - | [43] |
| R. sphaeroides O.U. 001 | Flat panel (1.0) | Malate (2.05) | 10.25 W/m2 | 11.0 | 3.31 | [44] |
| Rhodopseudomonas sp. | Cylindrical (0.22) | Acetate (4.0) | 80 W/m2 | 10.2 | 1.20 | [28] |
| R. capsulatus DSM 1710 | Flat panel (1.4) | Acetate (3.6) | 4000 lx | 18.0 | - | [45] |
| R. palustris GCA009 | Flat panel (0.9) | Glucose (10) | 210 W/m2 | 30.4 | 5.34 | [46] |
| Rhodopseudomonas | Cylindrical (0.2) | Acetate (4) | 80 W/m2 | 14.9 | 2.37 | [19] |
| R. sphaeroides O.U.001 | Cylindrical (2.0) | Dark fermentative cheese whey effluent | 10,000 lx | 41.9 | - | [47] |
| R. sphaeroides KKU-PS1 | Serum bottles (0.12) | Succinate fermentation effluent | 15,000 lx | 13.8 | 3.10 | [48] |
| Rhodopseudomonas sp. S16-VOGS3 | Cylindrical (0.2) | Acetate (6.0) | 75 W/m2 | 10.6 | 0.59 | This work |
| Rhodopseudomonas sp. S16-VOGS3 | Cylindrical (4.0) Paddle rotor | Acetate (6.0) | 75 W/m2 | 1.55 | 0.58 | This work |
| Rhodopseudomonas sp. S16-VOGS3 | Cylindrical (4.0) Spiral rotor | Acetate (6.0) | 75 W/m2 | 2.25 | 0.72 | This work |
5. Conclusions
Supplementary Materials
Author Contributions
Funding
Institutional Review Board Statement
Informed Consent Statement
Data Availability Statement
Conflicts of Interest
References
- Slorach, P.C.; Jeswani, H.K.; Cuéllar-Franca, R.; Azapagic, A. Environmental and economic implications of recovering resources from food waste in a circular economy. Sci. Total Environ. 2019, 693, 133516. [Google Scholar] [CrossRef] [PubMed]
- Ramamurthy, P.C.; Singh, S.; Kapoor, D.; Parihar, P.; Samuel, J.; Prasad, R.; Kumar, A.; Singh, J. Microbial biotechnological approaches: Renewable bioprocessing for the future energy systems. Microb. Cell Fact. 2021, 20, 55. [Google Scholar] [CrossRef] [PubMed]
- Faraloni, C.; Torzillo, G.; Balestra, F.; Moia, I.C.; Zampieri, R.M.; Jiménez-Conejo, N.; Touloupakis, E. Advances and challenges in biohydrogen production by photosynthetic microorganisms. Energies 2025, 18, 2319. [Google Scholar] [CrossRef]
- Pal, D.B.; Singh, A.; Bhatnagar, A. A review on biomass based hydrogen production technologies. Int. J. Hydrogen Energy 2022, 47, 1461–1480. [Google Scholar] [CrossRef]
- Dowaidar, M. Microbial pathways for sustainable hydrogen production. Int. J. Hydrogen Energy, 2025; in press. [Google Scholar] [CrossRef]
- Longden, T.; Beck, F.J.; Jotzo, F.; Andrews, R.; Prasad, M. Clean hydrogen?–Comparing the emissions and costs of fossil fuel versus renewable electricity based hydrogen. Appl. Energy 2022, 306, 118145. [Google Scholar] [CrossRef]
- Baeyens, J.; Zhang, H.; Nie, J.; Appels, L.; Dewil, R.; Ansart, R.; Deng, Y. Reviewing the potential of biohydrogen production by fermentation. Renew. Sustain. Energy Rev. 2020, 131, 110023. [Google Scholar] [CrossRef]
- Xie, D.; Kong, L.; Hu, J.; Li, H.; Wang, Y. A comparative review of biohydrogen and biomethane production from biowaste through photo-fermentation. Green. Chem. 2024, 27, 1331–1347. [Google Scholar] [CrossRef]
- Putatunda, C.; Behl, M.; Solanki, P.; Sharma, S.; Bhatia, S.K.; Walia, A.; Bhatia, R.K. Current challenges and future technology in photofermentation-driven biohydrogen production by utilizing algae and bacteria. Int. J. Hydrogen Energy 2023, 48, 21088–21109. [Google Scholar] [CrossRef]
- Dhar, K.; Venkateswarlu, K.; Megharaj, M. Anoxygenic phototrophic purple non-sulfur bacteria: Tool for bioremediation of hazardous environmental pollutants. World J. Microbiol. Biotechnol. 2023, 39, 283. [Google Scholar] [CrossRef]
- Gupta, S.; Fernandes, A.; Lopes, A.; Grasa, L.; Salafranca, J. Photo-fermentative bacteria used for hydrogen production. Appl. Sci. 2024, 14, 1191. [Google Scholar] [CrossRef]
- Lu, H.; Zhang, G.; He, S.; Zhao, R.; Zhu, D. Purple non-sulfur bacteria technology: A promising and potential approach for wastewater treatment and bioresources recovery. World J. Microbiol. Biotechnol. 2021, 37, 161. [Google Scholar] [CrossRef] [PubMed]
- Bayon-Vicente, G.; Toubeau, L.; Gilson, M.; Gégo, G.; Landgey, N.; Krings, S.; Leroy, B. Metabolic pathways to sustainability: Review of purple non-sulfur bacteria potential in agri-food waste valorization. Front. Bioeng. Biotechnol. 2025, 13, 1529032. [Google Scholar] [CrossRef]
- Haq, I.U.; Christensen, A.; Fixen, K.R. Evolution of Rhodopseudomonas palustris to degrade halogenated aromatic compounds involves changes in pathway regulation and enzyme specificity. Appl. Environ. Microbiol. 2024, 90, e0210423. [Google Scholar] [CrossRef] [PubMed]
- Verma, Y.; Iqbal, J.; Naushad, M.; Bhaskaralingam, A.; Kumar, A.; Dhiman, P.; Lai, C.W.; Sharma, G. Recent developments in photo-fermentative hydrogen evolution: Fundamental biochemistry and influencing factors a review. J. Environ. Manag. 2025, 374, 123976. [Google Scholar] [CrossRef]
- Zhang, Y.; Wang, X.; Yuan, J.; Guo, L. Multidimensional engineering of Rhodobacter sphaeroides for enhanced photo-fermentative hydrogen production. Chem. Eng. J. 2024, 488, 150852. [Google Scholar] [CrossRef]
- Hernández-Herreros, N.; Rodríguez, A.; Galán, B.; Auxiliadora Prieto, M. Boosting hydrogen production in Rhodospirillum rubrum by syngas-driven photoheterotrophic adaptive evolution. Bioresour. Technol. 2024, 406, 130972. [Google Scholar] [CrossRef]
- Tiang, M.F.; Fitri Hanipa, M.A.; Abdul, P.M.; Jahim, J.M.d.; Mahmod, S.S.; Takriff, M.S.; Lay, C.H.; Reungsang, A.; Wu, S.Y. Recent advanced biotechnological strategies to enhance photo-fermentative biohydrogen production by purple non-sulphur bacteria: An overview. Int. J. Hydrogen Energy 2020, 45, 13211–13230. [Google Scholar] [CrossRef]
- Moia, I.C.; Kanaropoulou, A.; Ghanotakis, D.F.; Carlozzi, P.; Touloupakis, E. Photofermentative hydrogen production by immobilized Rhodopseudomonas sp. S16-VOGS3 cells in photobioreactors. Energy Rev. 2024, 3, 100055. [Google Scholar] [CrossRef]
- Hallenbeck, P.C.; Liu, Y. Recent advances in hydrogen production by photosynthetic bacteria. Int. J. Hydrogen Energy 2016, 41, 4446–4454. [Google Scholar] [CrossRef]
- Ghosh, S. Retrofitting nanotechnology into photofermentation: State-of-the-art and prospect analysis for ameliorated production of clean hydrogen. Fuel 2024, 359, 130374. [Google Scholar] [CrossRef]
- Goveas, L.C.; Nayak, S.; Kumar, P.S.; Vinayagam, R.; Selvaraj, R.; Rangasamy, G. Recent advances in fermentative biohydrogen production. Int. J. Hydrogen Energy 2024, 54, 200–217. [Google Scholar] [CrossRef]
- Agyekum, E.B.; Odoi-Yorke, F. Review of over two decades of research on dark and photo fermentation for biohydrogen production—A combination of traditional, systematic, and bibliometric approaches. Int. J. Hydrogen Energy 2024, 91, 1149–1169. [Google Scholar] [CrossRef]
- Hoşafcı, E.; Ateş, C.; Volkan, A.E.; Koku, H.; Erguder, T.H. Effect of pH and salinity on photofermentative hydrogen and poly-hydroxybutyric acid production via Rhodobacter capsulatus YO3. Int. J. Hydrogen Energy 2025, 118, 331–342. [Google Scholar] [CrossRef]
- Budiman, P.M.; Wu, T.Y. Role of chemicals addition in affecting biohydrogen production through photofermentation. Energy Convers. Manag. 2018, 165, 509–527. [Google Scholar] [CrossRef]
- Hakobyan, L.; Gabrielyan, L.; Trchounian, A. Biohydrogen by Rhodobacter sphaeroides during photo-fermentation: Mixed vs. sole carbon sources enhance bacterial growth and H2 production. Int. J. Hydrogen Energy 2019, 44, 674–679. [Google Scholar] [CrossRef]
- Hitam, C.N.C.; Jalil, A.A. A review on biohydrogen production through photo-fermentation of lignocellulosic biomass. Biomass Convers. Biorefin. 2023, 13, 8465–8483. [Google Scholar] [CrossRef]
- Touloupakis, E.; Chatziathanasiou, A.; Ghanotakis, D.F.; Carlozzi, P.; Pecorini, I. Hydrogen production by immobilized Rhodopseudomonas sp. cells in calcium alginate beads. Energies 2022, 15, 8355. [Google Scholar] [CrossRef]
- Oflaz, F.B.; Koku, H. Pilot-scale outdoor photofermentative hydrogen production from molasses using pH control. Int. J. Hydrogen Energy 2021, 46, 29160–29172. [Google Scholar] [CrossRef]
- Policastro, G.; Cesaro, A.; Fabbricino, M. Photo-fermentative hydrogen production from cheese whey: Engineering of a mixed culture process in a semi-continuous, tubular photo-bioreactor. Int. J. Hydrogen Energy 2023, 48, 21038–21054. [Google Scholar] [CrossRef]
- Moreira, F.S.; Rodrigues, M.S.; Sousa, L.M.; Batista, F.R.X.; Ferreira, J.S.; Cardoso, V.L. Single-stage repeated batch cycles using co-culture of Enterobacter cloacae and purple non-sulfur bacteria for hydrogen production. Energy 2022, 239, 122465. [Google Scholar] [CrossRef]
- Pandey, A.; Sinha, P.; Pandey, A. Hydrogen production by sequential dark and photofermentation using wet biomass hydrolysate of Spirulina platensis: Response surface methodological approach. Int. J. Hydrogen Energy 2021, 46, 7137–7146. [Google Scholar] [CrossRef]
- Gernigon, V.; Chekroun, M.A.; Cockx, A.; Guiraud, P.; Morchain, J. How mixing and light heterogeneity impact the overall growth rate in photobioreactors. Chem. Eng. Technol. 2019, 42, 1663–1669. [Google Scholar] [CrossRef]
- Touloupakis, E.; Poloniataki, E.G.; Ghanotakis, D.F.; Carlozzi, P. Production of biohydrogen and/or poly-β-hydroxybutyrate by Rhodopseudomonas sp. using various carbon sources as substrate. Appl. Biochem. Biotechnol. 2021, 193, 307–318. [Google Scholar] [CrossRef] [PubMed]
- Watanabe, Y.; Hall, D.O. Photosynthetic production of the filamentous cyanobacterium Spirulina platensis in a cone-shaped helical tubular photobioreactor. Appl. Microbiol. Biotechnol. 1996, 44, 693–698. [Google Scholar] [CrossRef]
- Policastro, G.; Carraturo, F.; Compagnone, M.; Guida, M.; Fabbricino, M. Enhancing hydrogen production from winery wastewater through fermentative microbial culture selection. Bioresour. Technol. Rep. 2022, 19, 101196. [Google Scholar] [CrossRef]
- Smith, S.C.; Toledo-Alarcón, J.; Schiappacasse, M.C.; Tapia-Venegas, E. Enrichment of a mixed culture of purple non-sulfur bacteria for hydrogen production from organic acids. Sustainability 2023, 15, 16607. [Google Scholar] [CrossRef]
- Frowijn, L.S.F.; van Sark, W.G.J.H.M. Analysis of photon-driven solar-to-hydrogen production methods in the Netherlands. Sustain. Energy Technol. Assess. 2021, 48, 101631. [Google Scholar] [CrossRef]
- Genç, Ş.; Koku, H. A preliminary techno-economic analysis of photofermentative hydrogen production. Int. J. Hydrogen Energy 2024, 52, 212–222. [Google Scholar] [CrossRef]
- Jaramillo, A.; Satta, A.; Pinto, F.; Faraloni, C.; Chini Zittelli, G.; Silva Benavides, A.M.; Torzillo, G.; Schumann, C.; Fernandez Mendez, J.; Berggren, G.; et al. Outlook on synthetic biology-driven hydrogen production: Lessons from algal photosynthesis applied to cyanobacteria. Energy Fuels 2025, 31, 4987–5006. [Google Scholar] [CrossRef]
- Ren, C.; Zhang, S.; Li, Q.; Jiang, Q.; Li, Y.; Gao, Z.; Cao, W.; Guo, L. Pilot composite tubular bioreactor for outdoor photo-fermentation hydrogen production: From batch to continuous operation. Bioresour. Technol. 2024, 401, 130705. [Google Scholar] [CrossRef] [PubMed]
- Zagrodnik, R.; Seifert, K.; Stodolny, M.; Laniecki, M. Continuous photofermentative production of hydrogen by immobilized Rhodobacter sphaeroides O.U.001. Int. J. Hydrogen Energy 2015, 40, 5062–5073. [Google Scholar] [CrossRef]
- Ferreira, G.M.T.; Moreira, F.S.; Cardoso, V.L.; Batista, F.R.X. Enhancement of photo-fermentative hydrogen production with co-culture of Rhodobacter capsulatus and Rhodospirillum rubrum by using medium renewal strategy. Bioenerg. Res. 2023, 16, 1816–1828. [Google Scholar] [CrossRef]
- Gilbert, J.J.; Ray, S.; Das, D. Hydrogen production using Rhodobacter sphaeroides (O.U.001) in a flat panel rocking photobioreactor. Int. J. Hydrogen Energy 2011, 36, 3434–3441. [Google Scholar] [CrossRef]
- Elkahlout, K.; Sagir, E.; Alipour, S.; Koku, H.; Gunduz, U.; Eroglu, I.; Yucel, M. Long-term stable hydrogen production from acetate using immobilized Rhodobacter capsulatus in a panel photobioreactor. Int. J. Hydrogen Energy 2018, 44, 18801–18810. [Google Scholar] [CrossRef]
- Wang, Y.; Tahir, N.; Cao, W.; Zhang, Q.; Lee, D.-J. Grid columnar flat panel photobioreactor with immobilized photosynthetic bacteria for continuous photofermentative hydrogen production. Bioresour. Technol. 2019, 291, 121806. [Google Scholar] [CrossRef]
- Rao, R.; Basak, N. Process optimization and mathematical modelling of photo-fermentative hydrogen production from dark fermentative cheese whey effluent by Rhodobacter sphaeroides O.U.001 in 2-L cylindrical bioreactor. Biomass Convers. Biorefin. 2023, 13, 3929–3952. [Google Scholar] [CrossRef]
- Hanipa, M.A.F.; Tiang, M.F.; Luthfi, A.A.I.; Sajab, M.S.; Abu Bakar, M.H.; Reungsang, A.; Lay, C.-H.; Wu, S.-Y.; Kamarudin, K.F.; Abdul, P.M. Illumination optimization strategies to enhance hydrogen productivity and light conversion efficiency for photo-fermentation by Rhodobacter sphaeroides KKU-PS1 using a concentrated multi-substrate feedstock. Int. J. Hydrogen Energy 2024, 88, 418–431. [Google Scholar] [CrossRef]
- Pan, M.; Colpo, R.A.; Roussou, S.; Lindblad, P.; Krömer, J.O. Engineering a photoautotrophic microbial coculture toward enhanced biohydrogen production. Environ. Sci. Technol. 2025, 59, 337–348. [Google Scholar] [CrossRef]
- Fanesi, A.; Lavayssière, M.; Breton, C.; Bernard, O.; Briandet, R.; Lopes, F. Shear stress affects the architecture and cohesion of Chlorella vulgaris biofilms. Sci. Rep. 2021, 11, 4002. [Google Scholar] [CrossRef]
- Zhang, Z.; Wang, Y.; Hu, J.; Wu, Q.; Zhang, Q. Influence of mixing method and hydraulic retention time on hydrogen production through photo-fermentation with mixed strains. Int. J. Hydrogen Energy 2015, 40, 6521–6529. [Google Scholar] [CrossRef]

Disclaimer/Publisher’s Note: The statements, opinions and data contained in all publications are solely those of the individual author(s) and contributor(s) and not of MDPI and/or the editor(s). MDPI and/or the editor(s) disclaim responsibility for any injury to people or property resulting from any ideas, methods, instructions or products referred to in the content. |
© 2025 by the authors. Licensee MDPI, Basel, Switzerland. This article is an open access article distributed under the terms and conditions of the Creative Commons Attribution (CC BY) license (https://creativecommons.org/licenses/by/4.0/).
Share and Cite
Zampieri, R.M.; Touloupakis, E.; Faraloni, C.; Moia, I.C. Comparison of Photofermentative Hydrogen Production in Cylindrical Photobioreactors Using Different Mixing Systems. Microorganisms 2025, 13, 1386. https://doi.org/10.3390/microorganisms13061386
Zampieri RM, Touloupakis E, Faraloni C, Moia IC. Comparison of Photofermentative Hydrogen Production in Cylindrical Photobioreactors Using Different Mixing Systems. Microorganisms. 2025; 13(6):1386. https://doi.org/10.3390/microorganisms13061386
Chicago/Turabian StyleZampieri, Raffaella Margherita, Eleftherios Touloupakis, Cecilia Faraloni, and Isabela Calegari Moia. 2025. "Comparison of Photofermentative Hydrogen Production in Cylindrical Photobioreactors Using Different Mixing Systems" Microorganisms 13, no. 6: 1386. https://doi.org/10.3390/microorganisms13061386
APA StyleZampieri, R. M., Touloupakis, E., Faraloni, C., & Moia, I. C. (2025). Comparison of Photofermentative Hydrogen Production in Cylindrical Photobioreactors Using Different Mixing Systems. Microorganisms, 13(6), 1386. https://doi.org/10.3390/microorganisms13061386