Abstract
The growing demand for sustainable aquaculture has intensified research on probiotics as antibiotic alternatives. This study aims to evaluate the effects of three probiotic supplements—1 × 10¹⁰ CFU/g of Bacillus subtilis (BS), Clostridium butyricum (CB), or Enterococcus faecalis (EF)—on growth performance, antioxidant capacity, intestinal structure, and gut microbiota in grass carp (Ctenopharyngodon idella; initial body weight: 42.52 ± 4.17 g) for 28 d. Compared to the non-supplemented (NC) control group, all probiotic-supplemented groups significantly enhanced final body weight, weight gain rate, specific growth rate, and crude protein content, and reduced feed conversion ratio (p < 0.05). Probiotic supplementation upregulated the intestinal ctrb1 gene expression and increased villus length. Serum superoxide dismutase (SOD) and catalase activity were elevated in the BS group, whereas only SOD was increased in the CB group (p < 0.05). Gut microbiota analysis revealed reduced Proteobacteria abundance in all probiotic-supplemented groups. Compared with the NC group, the BS group enriched Bacteroidetes and Prevotella_7, while the CB group promoted the abundance of Actinobacteria, Lactobacillus, and Clostridium_sensu_stricto_1. The EF group increased the abundance of Fusobacteria, Cetobacterium, and Bacteroides (p < 0.05). These findings demonstrate that dietary supplementation with probiotics enhances growth performance by modulating antioxidant responses, intestinal morphology, and microbial community balance.
1. Introduction
In recent years, feed demand has driven a surge due to the expansion of intensive aquaculture practices [1]. With the increasing price of feed raw materials, cheap plant-based proteins have been widely used in large quantities in feeds, which not only reduce feed palatability and its utilization efficiency but also weaken the immune function of fish, causing tissue damage and infections of fish [2,3,4]. To mitigate fish disease outbreaks, antibiotics have been used routinely in aquaculture. However, prolonged antibiotic overuse has led to problems including drug residue, antibiotic resistance, and decreased fish immunity [5,6]. Consequently, the development and application of antibiotic alternatives with no side effects on the environment are classified as a critical priority for sustainable and eco-friendly aquaculture development.
Probiotics, defined as beneficial microorganisms that can be colonized in the fish gut or improve aquaculture water quality, play a positive role in growth performance, nutrient absorption, energy metabolism, and immune response of fish [7,8,9]. Probiotics can alleviate the adverse effects of high-density farming and the side effects and pollution caused by antibiotics and other drugs, thereby showing great application prospects [10,11]. Currently, prevalent probiotic strains, including Bacillus-like, lactic acid bacteria-like, and fungal-like probiotics, have been successfully applied in the feed of grass carp (Ctenopharyngodon idella), common carp (Cyprinus carpio L.), South American catfish (Rhamdia quelen), Nile tilapia (Oreochromis niloticus), and largemouth bass (Micropterus salmoides) [1,12,13,14,15,16].
Bacillus subtilis stands out for its production of abundant extracellular enzyme systems and participation in degrading harmful substances such as ammonia nitrogen and nitrite, thereby improving aquaculture water quality [12,17]. B. subtilis increases the digestive enzyme activity in aquatic animals, modulates hepatic lipid metabolism, reduces fat deposition, and consequently improves the growth performance and serum biochemical profiles of aquatic animals [18,19,20]. For example, B. subtilis at 108 or 109 CFU/g can improve intestinal protease activity in Nile tilapia (O. niloticus) or Yellow River carp (C. carpio L.), respectively [21,22]. B. subtilis can also compete with pathogens for intestinal adhesion sites and nutrients by producing antibiotics and bacteriocins. Therefore, B. subtilis inhibits the adherence of pathogens to fish intestinal epithelial cells, resulting in the enrichment of anaerobic beneficial bacteria. Dietary supplementation of B. subtilis has been reported to restructure the intestinal microbiota, repair tissue damage, and enhance the intestinal immune function, thereby boosting fish growth [23,24].
Clostridium butyricum and Enterococcus faecalis are widely recognized as short-chain fatty acid-producing bacteria that can enhance metabolism, improve intestinal morphology, optimize gut microbiota composition, and strengthen mucosal immunity in fish by producing short-chain fatty acids [25]. C. butyricum can ferment polysaccharides to generate butyric acid, which can prevent the colonization of enteropathogens by creating an acidic environment. It has been reported that C. butyricum has a significant inhibitory effect on pathogenic bacteria (e.g., Enterobacter), while it enriches beneficial bacteria such as Bifidobacterium and Lactobacillus. C. butyricum can also enhance the resistance of fish to pathogens such as Streptococcus agalactiae and Carassius auratus herpesvirus, thus reducing the mortality rate of fish [26,27].
E. faecalis, a type of lactic acid bacterium, is also an indigenous bacterium in the fish gut. It has been demonstrated that E. faecalis can synthesize L-type lactic acid through glycolytic metabolism, thereby facilitating the intestinal calcium absorption in fish. In addition, E. faecalis can secrete various enzymes (proteases, lipases, and amylases) to catalyze the macromolecule breakdown, thus improving the nutrient utilization efficiency of fish [28,29]. For instance, supplementation with E. faecalis or Lactococcus lactis at 108 CFU/g enhanced protease activity in the intestine of snakehead fish (Channa argus) [30]. Earlier research has demonstrated that dietary supplementation with E. faecalis at 1 × 10⁷ CFU/g significantly elevated the weight gain rate, specific growth rate, and serum alkaline phosphatase (ALP) activity of tilapia (O. niloticus) [31]. It has also been reported that E. faecalis produces antimicrobials, such as bacteriocins and antimicrobial peptides, to specifically inhibit or kill pathogens, thereby maintaining intestinal microbial balance [32,33].
Numerous studies have documented the positive effects of probiotics on intestinal digestive enzyme activity in fish [21,22,34]. Chymotrypsin, a serine proteolytic enzyme that hydrolyzes the carboxyl side chains of aromatic amino acid residues, not only plays a critical role in protein digestion and energy metabolism in fish, but also serves as a key biomarker for evaluating nutritional status and growth efficiency of fish [34,35]. For instance, dietary supplementation with a synbiotic containing Lactococcus lactis significantly enhanced chymotrypsin activity in the intestine of Caspian roach (Rutilus frisii kutum), along with improvements in body weight gain and protein efficiency [36]. Similarly, the metabolite of C. butyricum also increased intestinal chymotrypsin activity in grass carp [37]. Chymotrypsin is synthesized in the pancreas as an inactive precursor, chymotrypsinogen, which is subsequently secreted into the intestine to be activated [35]. Consequently, the expression of the chymotrypsinogen B gene (ctrb1) directly influences chymotrypsin activity [38]. However, limited research has addressed how probiotics regulate ctrb1 expression in fish. Therefore, investigating the effects of dietary probiotics on the ctrb1 gene expression in grass carp is essential for understanding their role in modulating digestive capacity and nutritional status in aquaculture species.
Grass carp (C. idella) is the most prevalent freshwater farmed fish in China and is also listed of the four major fish in China because of its rapid growth, adaptability, wide food source, low protein requirement, and delicious meat flavor [39]. Although these probiotics have been extensively studied in various fish species, most research has focused on identifying optimal supplementation gradients for single strains [40] or evaluating the efficacy of individual and combined strains [30]. In contrast, limited studies have systematically compared the probiotic effects of B. subtilis, C. butyricum, and E. faecalis on grass carp at equivalent concentrations. Furthermore, previous investigations predominantly emphasized growth performance and immune responses in fish, while the specific mechanisms by which these probiotics improve intestinal digestion and modulate gut microbiota in grass carp remain poorly elucidated. To address these gaps, this study conducted a 28-day feeding trial using three experimental diets supplemented with B. subtilis, C. butyricum, and E. faecalis at 1 × 10¹⁰ CFU/g, respectively. We comprehensively analyzed and compared the effects of these probiotics on growth performance, digestive capacity, antioxidant activity, intestinal morphology, and gut microbiota in grass carp. Additionally, the regulatory impact of probiotic supplementation on intestinal ctrb1 gene expression levels was investigated. These findings provide theoretical insights to optimize the application of these probiotics in aquaculture practices.
2. Materials and Methods
2.1. Preparation of Probiotic Additives and Experimental Diets
The experiment consisted of four groups: the control group (NC), the B. subtilis group (BS), the C. butyricum group (CB), and the E. faecalis group (EF), with three replicates per group. The feed in the NC group did not contain any probiotics, while the feeds in the BS, CB, and EF groups contained B. subtilis, C. butyricum, and E. faecalis were obtained from Wuhan SunHY Biology Co., Ltd. (Wuhan, China). All feed ingredients except probiotics were weighed according to the basic diet formula (Table 1) and thoroughly mixed in a mixer. Oil was then added and mixed for 5 min. Subsequently, deionized water (400 mL/kg of dry ingredient mixture) was added and mixed for another 5 min. The mixture was then ground and passed through an 80-mesh sieve. A pellet mill was used to form the mixture into 2 mm pellets.

Table 1.
Feed formulation for grass carp in different probiotic-supplemented groups and the control group.
Following granulation, three probiotic agents were sprayed onto the diet at specified ratios, air-dried, and stored in sealed plastic bags at −20 °C. Prior to the experiment, feed samples were analyzed by Wuhan SunHY Biology Co., Ltd. (Wuhan, China) to quantify probiotic concentrations using the dilution plate counting method. The final concentrations of B. subtilis (BS), C. butyricum (CB), and E. faecalis (EF) in diets were confirmed as 1 × 10¹⁰ CFU/g. To maintain bacterial viability, diets were stored at −20 °C throughout the 28-day trial. Weekly monitoring confirmed stable probiotic viability in the probiotic-supplemented feed (0.97 × 10¹⁰–0.99 × 10¹⁰ CFU/g).
2.2. Experimental Fish and Design
Grass carp were purchased from Wuhan Baishazhou Aquatic Market (Wuhan, China). After a 14-day acclimatization period, 240 grass carp of uniform size, robust health, and no injuries were selected. The grass carp, with an initial body weight (IBW) of 42.59 ± 0.46 g, were randomly distributed into 12 experimental tanks (300 L in volume, 1 m in diameter), with three tanks per group and a stocking density of 20 fish per tank. Before the start of the experiment, the fish were fasted for 24 h, and their initial weights were measured. The 28-day breeding experiment was conducted at the Aquaculture Experiment Base of the College of Fisheries, Huazhong Agricultural University (Wuhan, China). During the experiment, the fish were fed to satiation twice daily (at 8:30 and 16:30) with a feeding amount not exceeding 3% of the grass carp’s body weight. Two hours after feeding, feces and leftover feed were siphoned off, dried at 60 °C for 12 h until constant weight, and then weighed. Daily feed intake and mortality were recorded. The water was changed twice daily, with a daily water exchange rate of 40% to 60% of the total volume, and continuous aeration was provided for 24 h to ensure water quality requirements. During the experiment, the water quality was monitored and adjusted as follows: water temperature was maintained at 12–15 °C, dissolved oxygen at 7 ± 0.45 mg/L, pH at 7.5 ± 0.3, and the photoperiod was set to the natural light cycle. Before the end of the experiment, the fish were fasted for 24 h, weighed, and counted. Growth performance indices, including feed intake rate (FR), weight gain rate (WGR), specific growth rate (SGR), feed conversion ratio (FCR), and protein efficiency ratio (PER), were calculated.
2.3. Sample Collection
After 28 days of cultivation, all grass carp were collected from each tank. The fish were anesthetized with MS-222 (10 mg/L) for counting and weighing to determine growth performance. Three fish were randomly selected from each tank, quickly frozen in liquid nitrogen, and then transferred to a −20 °C freezer for crude protein analysis. Three additional fish were randomly selected from each tank for tail vein blood collection to determine serum antioxidant enzyme activities. Furthermore, two fish from each tank were anesthetized and rapidly dissected on ice. Intestinal tissue samples were collected, frozen in liquid nitrogen, and stored at −80 °C for quantitative gene expression analysis. Another portion of the intestinal samples was fixed in a 4 °C fixative for intestinal morphology analysis. Before intestinal microbiota collection, the grass carp were subjected to a 12-h fasting period. Two fish from each tank were anesthetized, and their body surface was rinsed with 0.9% saline solution. The intestines were rapidly removed using sterile surgical tools and placed in sterile Petri dishes. The intestines were longitudinally opened, the intestinal fat tissue was removed, and the intestinal contents were quickly scraped and frozen in liquid nitrogen, then transferred to −80 °C for subsequent intestinal microbiota analysis.
2.4. Calculation of Growth Performance
The survival rate and growth performance indices of grass carp (survival rate, feed rate, specific growth rate, and feed conversion ratio) were calculated using the following formulas:
Specific growth rate (SGR, %/d) = 100 × (Ln final body weight − Ln initial body weight)/day
Survival rate (SR, %) = 100 × (total fish − dead fish)/total fish
Weight gain rate (WGR, %) = 100 × (final body weight − initial body weight)/initial body weight
Feed rate (FR, %) = 100 × feed intake/(final body weight + initial body weight)/2 × day
Feed conversion ratio (FCR) = feed intake/weight gain
Protein efficiency ratio (PER) = weight gain/protein intake
2.5. Analysis of Crude Protein Content in Fish Body
The frozen samples stored at low temperatures were retrieved, and the crude protein content in the fish body was determined using the Kjeldahl method as described in previous studies [15].
2.6. Determination of Serum Antioxidant Enzyme Activity
At the end of the experiment, the fish were deprived of food for 24 h. Two grass carp were randomly selected from each tank, anesthetized, and blood was collected from the tail vein using sterile syringes (2 mL). Blood samples were left to stand overnight at 4 °C and then centrifuged at 5000 r/min for 10 min. The upper serum layer was collected, aliquoted into centrifuge tubes, and stored at −80 °C. The activities of total superoxide dismutase (SOD) and catalase (CAT) in the serum were measured using the Total Superoxide Dismutase Assay Kit and the Catalase Assay Kit (Nanjing Jiancheng Bioengineering Research Institute, Nanjing, China), respectively, following the manufacturer’s instructions.
2.7. Quantitative Gene Expression Analysis
Total RNA was extracted from fish intestinal tissue using the RNAiso Plus Kit (Takara, Dalian, China). RNA purity and concentration were measured using a NanoDrop 2000 spectrophotometer (Thermo Scientific, Waltham, MA, USA), and RNA quality and integrity were assessed by 1.0% agarose gel electrophoresis. cDNA was synthesized from the RNA using the Evo M-MLV Reverse Transcription Premix Kit (Aikuri Biotechnology, Changsha, China) and stored at −20 °C.
Chymotrypsin is a critical digestive enzyme for protein degradation, and the chymotrypsinogen B1 gene (ctrb1) encodes the precursor of chymotrypsin [35]. Primers specific to the ctrb1 gene were designed using Primer Premier 6.0 software: forward primer ctrb1-F (GGGGCCTGACCAGGTACAAT) and reverse primer ctrb1-R (CCAGAGGACCACCAGAATCAC), synthesized by Sangon Biotech Co., Ltd. (Shanghai, China). Quantitative real-time PCR (qRT-PCR) was performed using the Roche Light Cycler 480® real-time PCR instrument (Roche, Indianapolis, IN, USA) with cDNA as the template. The reaction system (20 μL) consisted of 1 μL cDNA, 0.4 μL ctrb1-F, 0.4 μL ctrb1-R, 10 μL 2 × SYBR Green qPCR Mix, and 8.2 μL diethylpyrocarbonate water (Novozyme, Nanjing, China). The reaction program was as follows: 95 °C for 30 s, followed by 40 cycles of 95 °C for 5 s and 60 °C for 30 s. Each reaction was performed in triplicate. The relative expression levels of the ctrb1 gene in the intestines of grass carp from different groups were analyzed using the 2−ΔΔCT method, with β-actin as the reference gene for normalization [41].
2.8. Intestinal Morphological Analysis
At the end of the cultivation experiment, three grass carp were collected from each tank. After being rinsed with 0.9% saline solution and distilled water, the fish were dissected. Intestinal tissue samples (approximately 4 mm in length) were fixed in 4% paraformaldehyde fixative (Wuhan Service, Wuhan, China) at 4 °C. The samples were then subjected to graded ethanol dehydration, xylene cleaning, paraffin embedding, and sectioning (5 μm thickness), followed by hematoxylin-eosin (HE) staining (Wuhan Sevicebio Technology Co., Ltd., Wuhan, China). Morphological observations of the intestinal samples were conducted using Zeiss Axio Imager A2 fluorescent microscope (Zeiss, Oberkochen, Germany), and photographs were taken at 40× magnification under identical background lighting. The lengths of intestinal villi were measured using Image-Pro Plus 6.0 software [42,43].
2.9. Intestinal Microbiota Profiling
Intestinal contents from four randomly selected fish per group were stored at −80 °C. The samples were sent to Biomarker Technologies Co., Ltd. (Beijing, China) for 16S rRNA high-throughput sequencing. Bacterial DNA was extracted from the intestinal samples using the E.Z.N.A.® Soil DNA Kit (Omega, Norcross, GA, USA), and the integrity and quality of the DNA samples were assessed by 1% agarose gel electrophoresis. The purity and concentration of the DNA were determined using a NanoDrop 2000 spectrophotometer (Thermo Scientific, Norcross, GA, USA) [9].
PCR amplification of the V3-V4 variable regions of the 16S rRNA gene was performed using the forward primer 338F (5′-ACTCCTACGGGAGGCAGCAG-3′) and reverse primer 806R (5′-GGACTACHVGGGTWTCTAAT-3′) on a T100 Thermal Cycler (BIO-RAD, Hercules, CA, USA). The PCR products were purified, quantified, and normalized to create sequencing libraries. Qualified libraries were sequenced using the Illumina HiSeq 2500 (Illumina, San Diego, CA, USA) with paired-end sequencing. The original data were assembled using FLASH (version 1.2.11), and the assembled sequences were quality filtered (Trimmomatic, version 0.33) and chimerism was removed (UCHIME, version 8.1) to obtain high-quality tag sequences [44].
Effective sequences were analyzed using Usearch 10.0 software since operational taxonomic units (OTUs) have been widely adopted in fish gut microbiota studies [27,30,45]. OTUs were clustered at a sequence similarity of 97% and were subjected to rarefaction processing. The Good’s coverage in all groups remained at 99.09%, confirming sufficient sequencing depth to reliably represent microbial community diversity. Taxonomic annotations of OTUs were performed using the RDP Classifier 2.2 software based on the Silva 16S rRNA gene database (version 132, http://www.arb-silva.de, accessed on 18 November 2019). The microbial community composition of each sample was analyzed at different taxonomic levels (phylum, class, order, family, genus, and species), and diversity indices such as Shannon, Simpson, Chao, and Ace were calculated [36]. To mitigate the influence of sequencing depth on α- and β-diversity analyses, all samples were subjected to rarefaction processing. Post-rarefaction, the average sequence coverage (Good’s coverage) remained at 99.09%, confirming sufficient sequencing depth to reliably represent microbial community diversity.
2.10. Statistical Analysis
Statistical analyses were performed using SPSS 25.0 software, and graphs were created using GraphPad Prism 9.0 software. Numerical data are expressed as mean ± standard error (mean ± SE). One-way ANOVA and Duncan’s test were used for statistical analysis. The significance threshold was set at p < 0.05. Different letters or asterisks (*) indicate significant differences between groups (p < 0.05), while identical letters or no markings indicate no significant differences between groups (p > 0.05).
3. Results
3.1. Effects of Dietary Probiotic Supplementation on Growth Performance of Grass Carp
The effects of different probiotics on the growth performance of grass carp are presented in Table 2. Compared to the NC group, the SR in the BS group showed no significant difference, while the SR in the CB and EF groups was significantly higher (p < 0.05). The FBW, WGR, FR, and SGR of grass carp in the BS, CB, and EF groups were significantly higher than those in the NC group (p < 0.05), while the FCR was significantly lower (p < 0.05). For PER, the BS group showed an increasing trend compared to the NC group, but the difference was not significant (p > 0.05). However, the PER in the CB and EF groups was significantly higher than that in the NC and BS groups (p < 0.05).
Table 2.
The growth performance parameters of grass carp in different probiotic-supplemented groups and the control group.
3.2. Effects of Probiotics in Feed on Crude Protein Content of Grass Carp
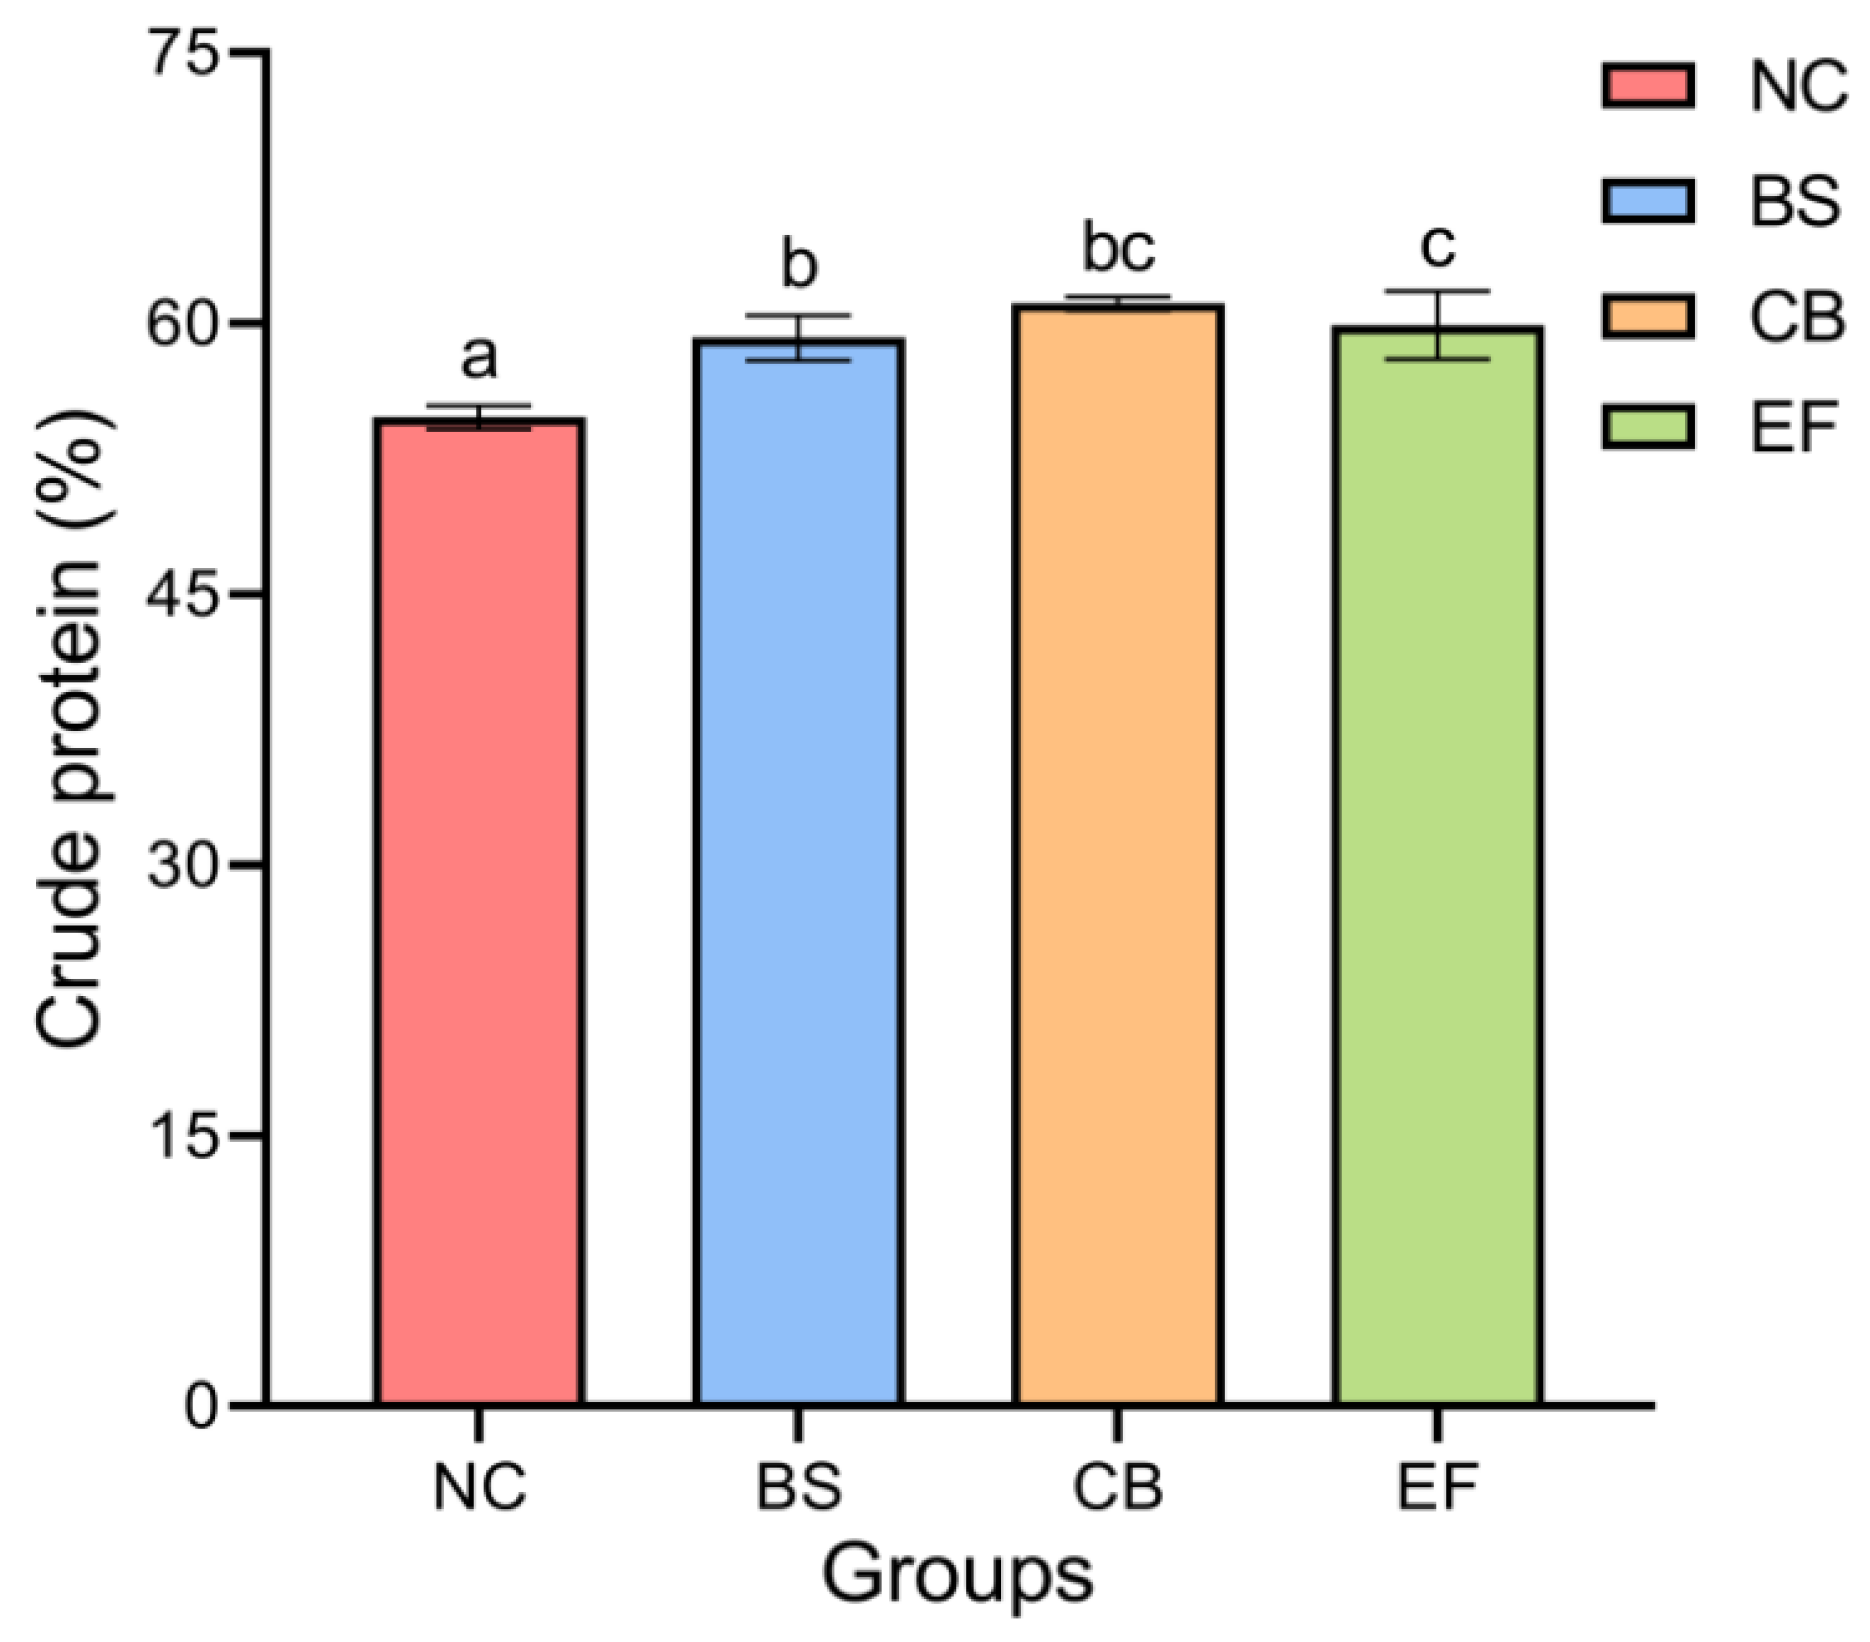
As shown in Figure 1, the crude protein content in the BS, CB, and EF groups was 59.20 ± 1.24%, 61.11 ± 0.38%, and 57.37 ± 0.39%, respectively, all of which were significantly higher than that in the NC group (54.79 ± 0.67%) (p < 0.05). This indicates that the addition of three types of probiotics (B. subtilis, C. butyricum, and E. faecalis) in feed can significantly increase the crude protein content of grass carp.
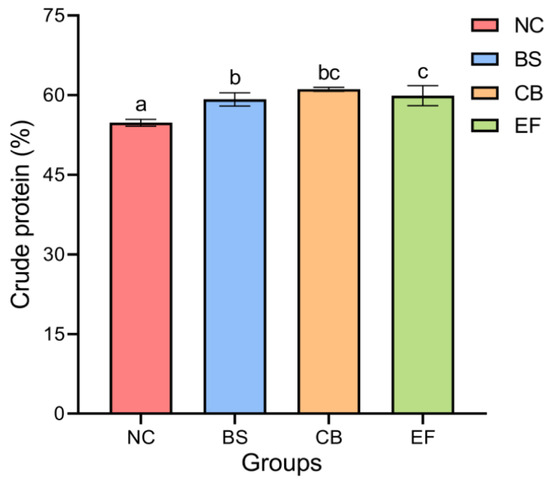
Figure 1.
The crude protein contents of grass carp in different probiotic-supplemented groups and the control group. Bars marked with different letters represent statistically significant differences (p < 0.05).
3.3. Effects of Dietary Probiotic Supplementation on Serum Antioxidant Enzyme Activity in Grass Carp
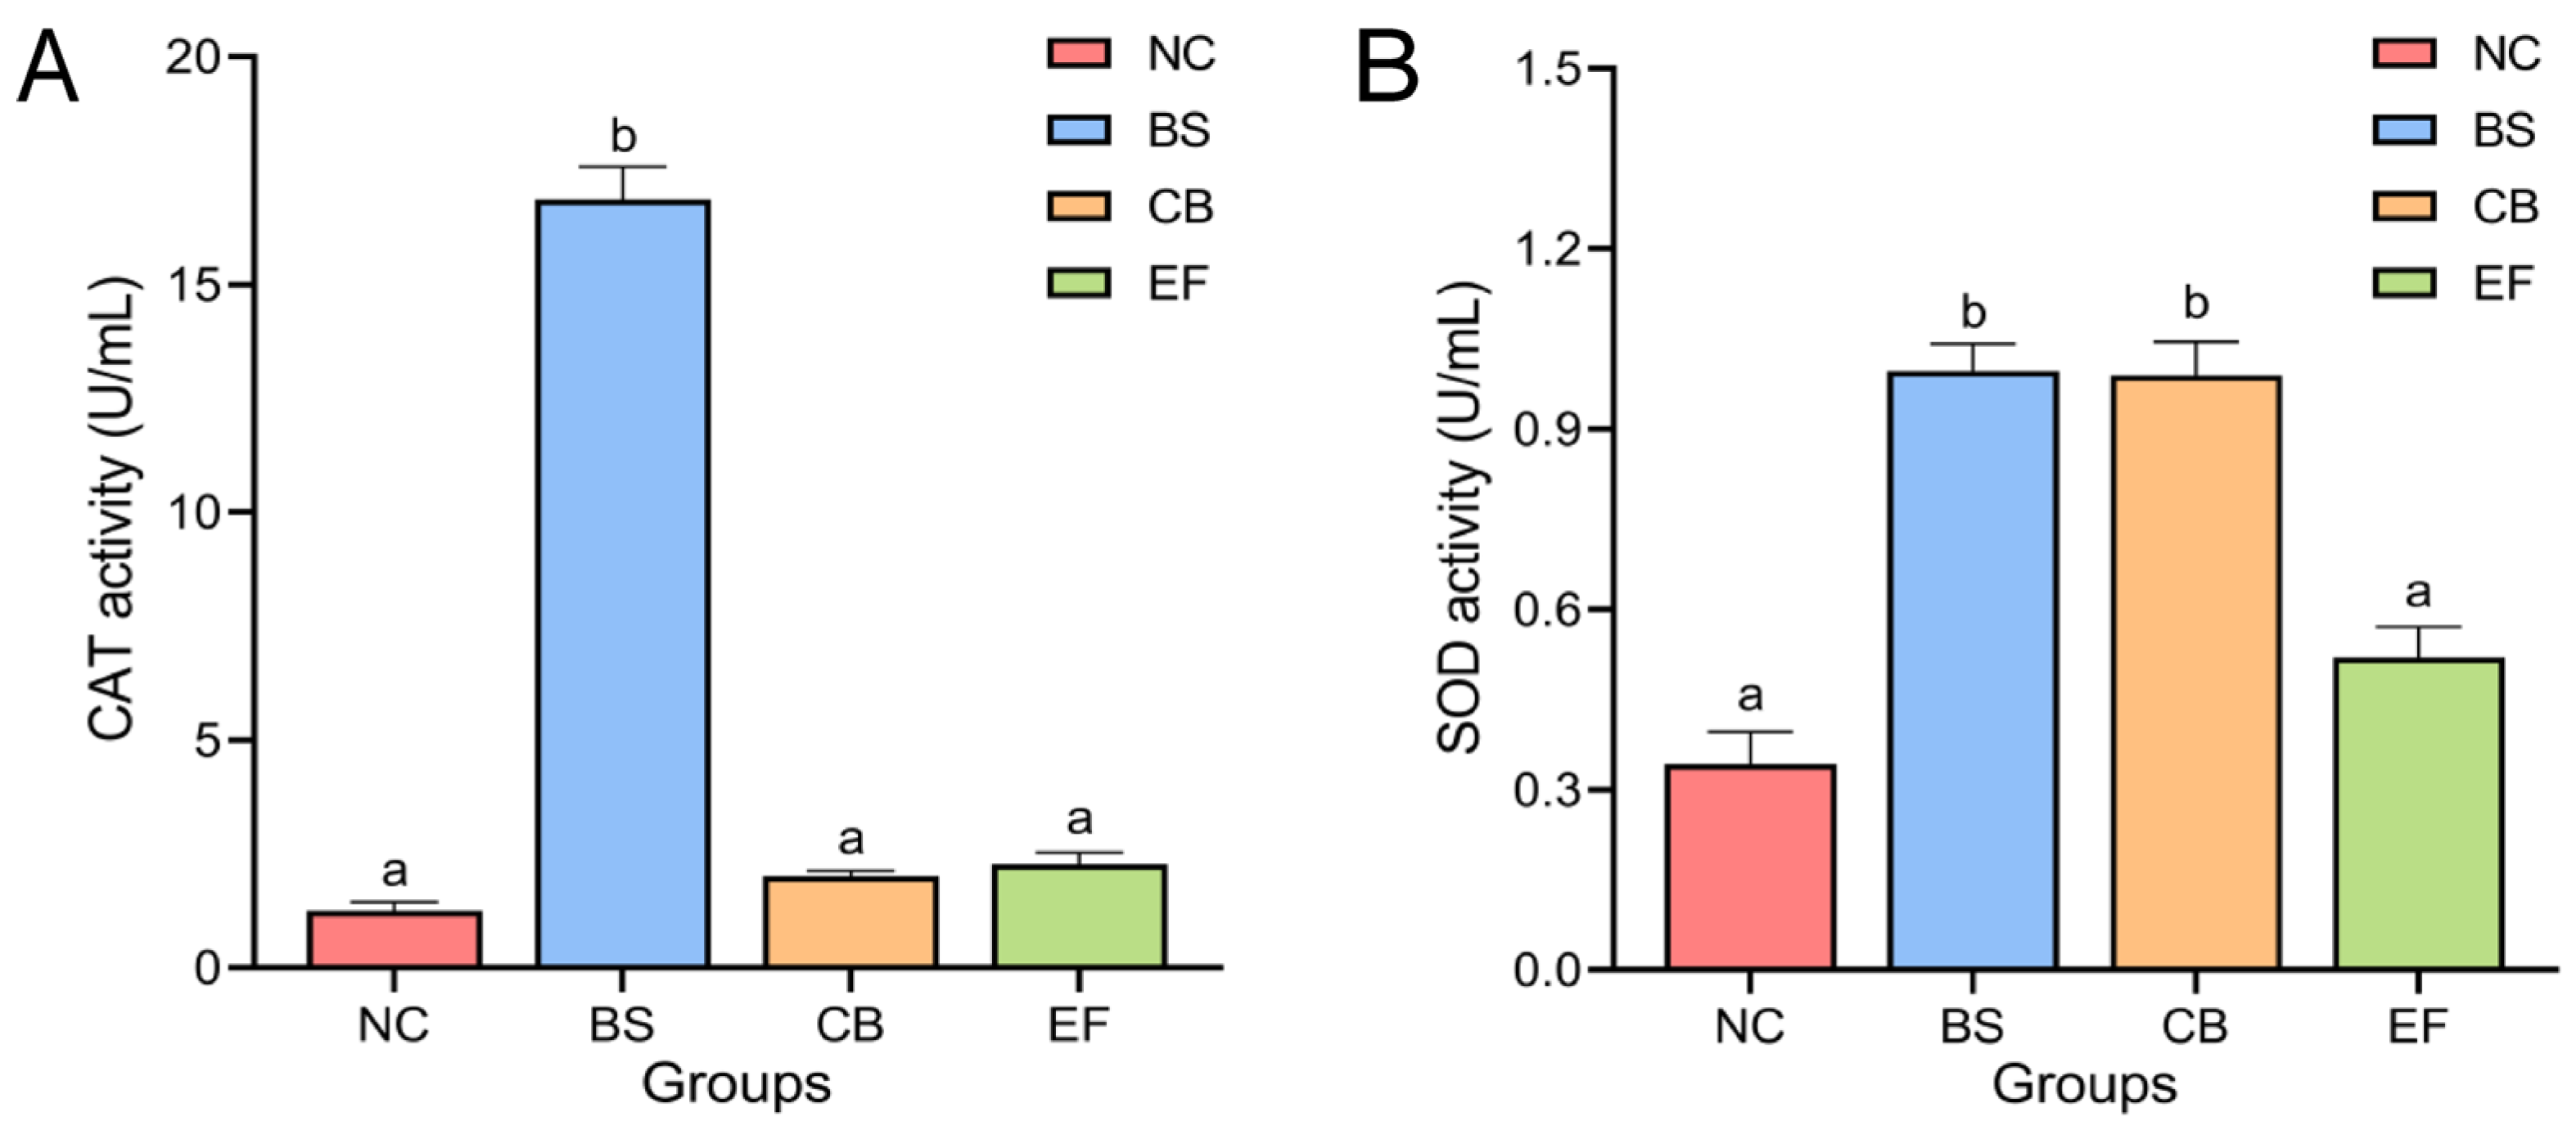
The effects of different probiotic additions on the activity of antioxidant enzymes CAT and SOD in grass carp serum are shown in Figure 2. The serum CAT activity of grass carp in the BS group (16.87 ± 0.72 U/mL) was significantly higher than in the NC group (1.25 ± 0.19 U/mL). The serum CAT activity of grass carp in the CB group (2.01 ± 0.12 U/mL) and EF group (2.27 ± 0.25 U/mL) was higher than that in the NC group (1.25 ± 0.19 U/mL), but there was no significant difference (p > 0.05).

Figure 2.
Activity of serum antioxidant enzymes (A) CAT and SOD (B) in grass carp from different probiotic-supplemented groups and the control group (U/mL). Bars marked with different letters represent statistically significant differences (p < 0.05).
Serum SOD activity in the BS group (1.00 ± 0.05 U/mL) and the CB group (0.99 ± 0.06 U/mL) were significantly higher than that of the serum SOD activity of the NC group (0.34 ± 0.05 U/mL) (p < 0.05), whereas the difference between the serum SOD activity of the EF group (0.52 ± 0.05 U/mL) and that of the NC group was not significant (p > 0.05).
3.4. Effects of Dietary Probiotic Supplementation on Chymotrypsinogen B1 Gene Expression in the Intestine of Grass Carp
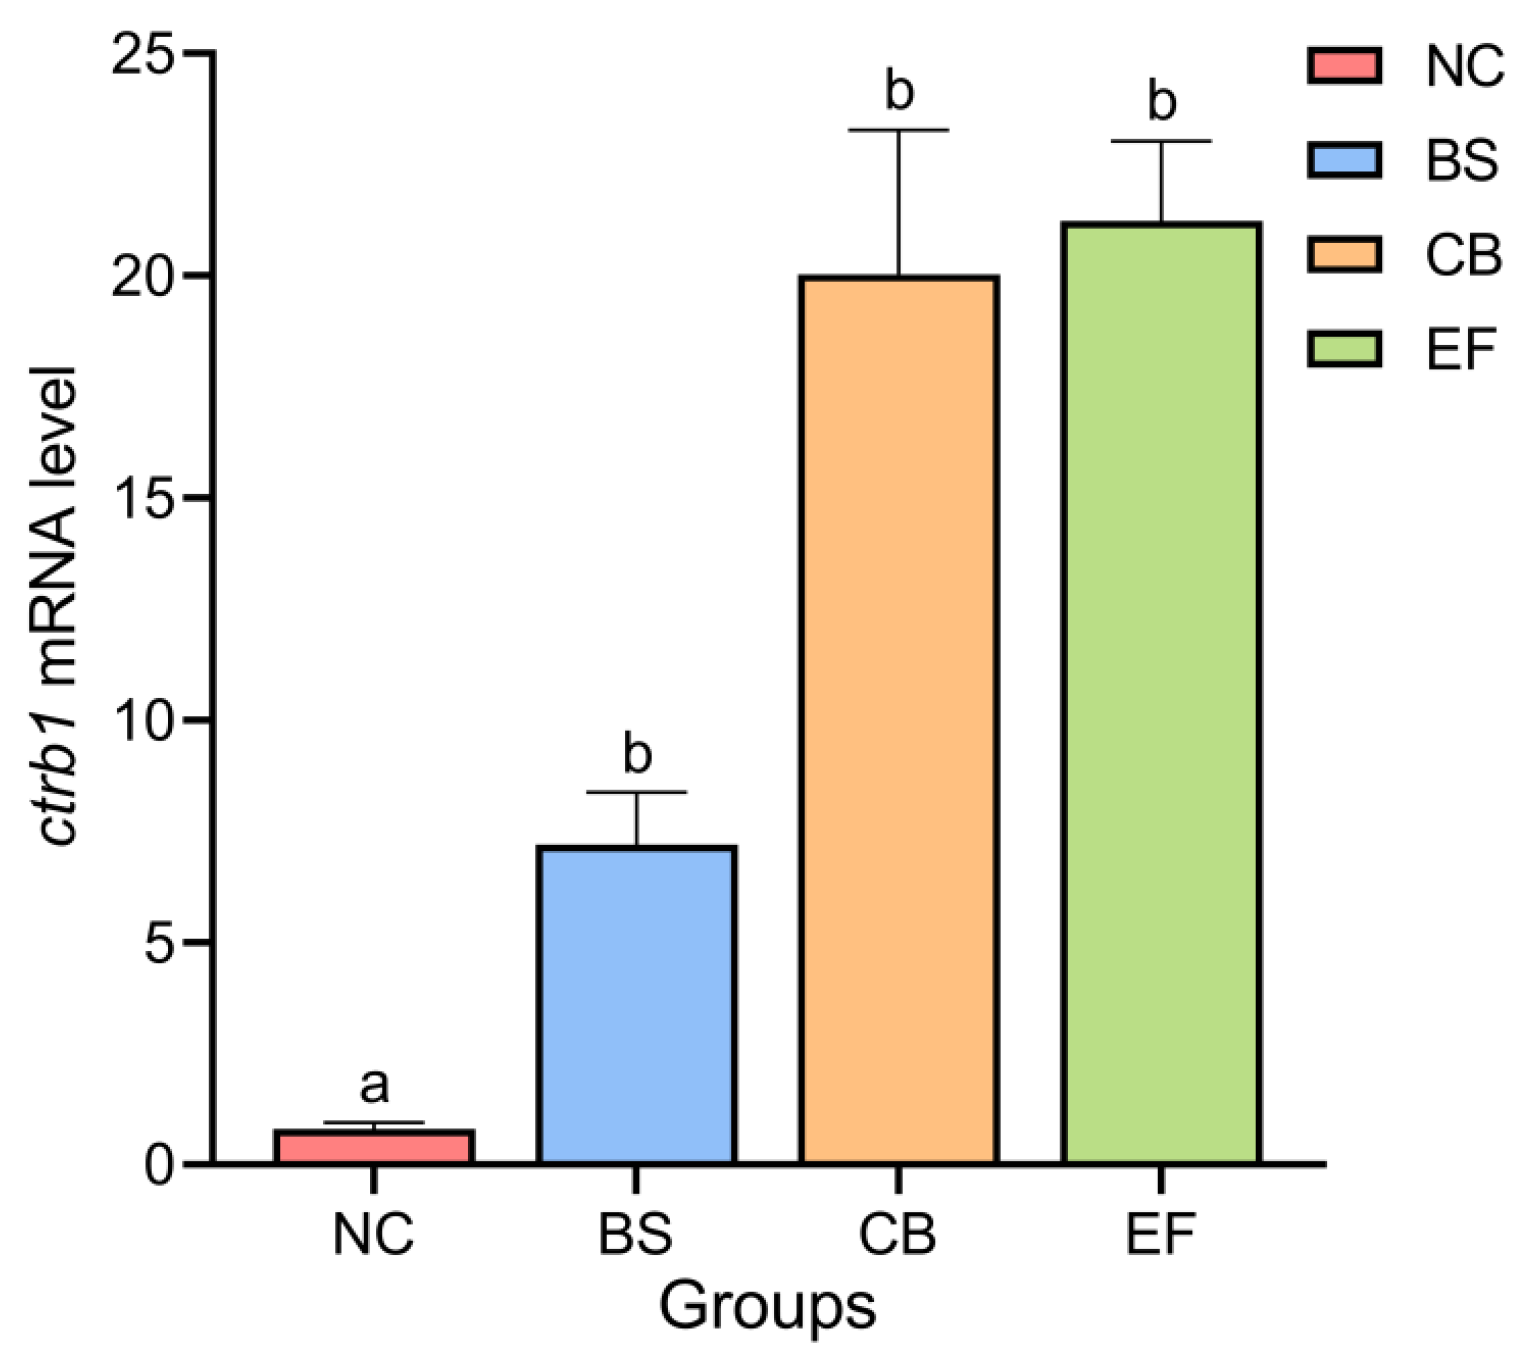
As shown in Figure 3, the relative expression levels of the Chymotrypsinogen B1 gene (ctrb1) in the intestines of the NC, BS, CB, and EF groups were 0.79 ± 0.15, 7.20 ± 1.17, 20.03 ± 3.25, and 21.23 ± 1.80, respectively. Compared to the NC group, the relative expression levels of the ctrb1 gene in the intestines of the BS, CB, and EF groups were significantly higher (p < 0.05).

Figure 3.
Relative expression levels of the ctrb1 gene in the intestines of grass carp from different probiotic-supplemented groups and the control group. Bars marked with different letters represent statistically significant differences (p < 0.05).
3.5. Effects of Dietary Probiotic Supplementation on Intestinal Histomorphology of Grass Carp
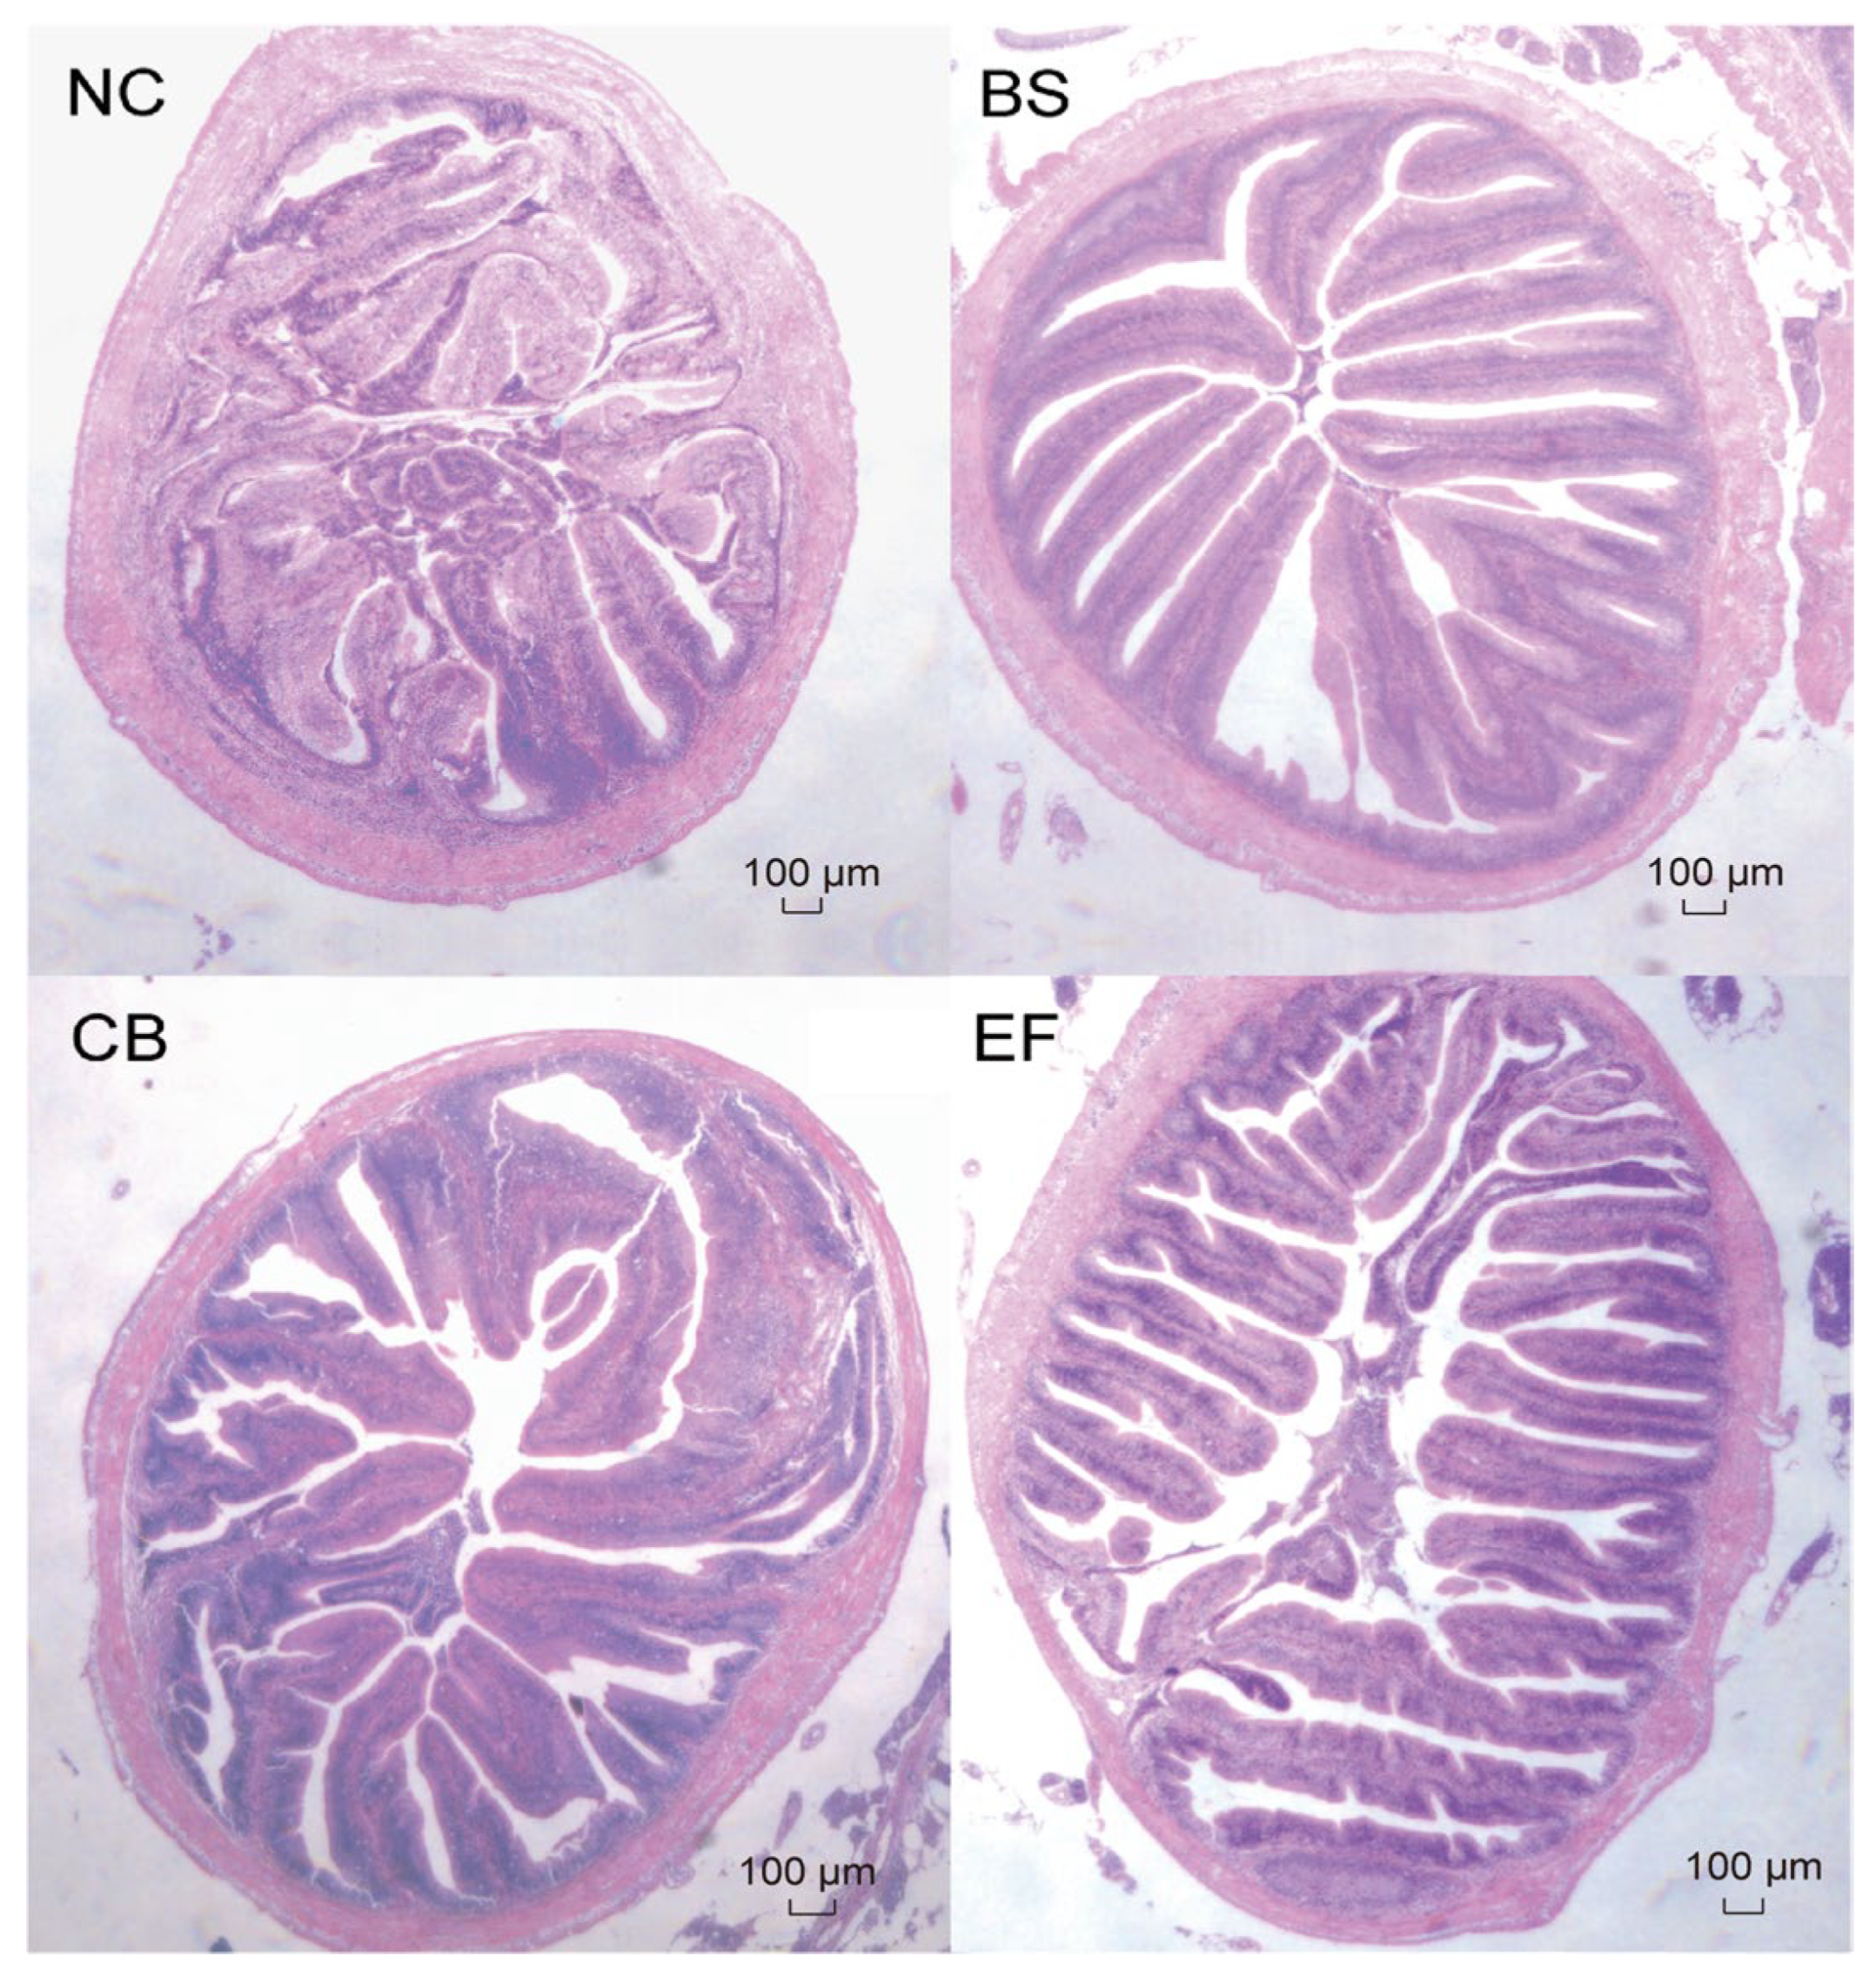
As shown in Figure 4, the intestinal epithelial cells of grass carp in all groups were structurally intact, and the distribution of intestinal villi was relatively uniform, indicating that the morphology and structure of grass carp in all groups were normal.

Figure 4.
Microstructure of grass carp intestines from different groups (scale bar = 100 µm, original magnification ×400).
As shown in Table 3, compared to the NC group, the villus height (VH) in the BS, CB, and EF groups was significantly higher (p > 0.05). However, there were no significant differences in crypt depth (CD) and villus height/crypt depth ratio (V/C) among the groups (p > 0.05), except that the V/C in the BS group was significantly higher than that in the NC group (p < 0.05).
Table 3.
Intestinal morphology of grass carp in different probiotic-supplemented groups and the control group.
3.6. Effects of Dietary Probiotic Supplementation on Intestinal Microbiota of Grass Carp
The effects of different probiotics on the diversity of gut microbial communities in grass carp are presented in Table 4. The Chao, Shannon, and Simpson indices in the BS and EF groups were significantly lower than those in the NC group (p < 0.05), while the Ace index showed no significant difference (p > 0.05). The Chao index in the CB group was significantly higher than that in the NC group (p < 0.05), while the Ace, Shannon, and Simpson indices showed no significant differences (p > 0.05).
Table 4.
Alpha diversity index of the intestinal microbiota of grass carp in different probiotic-supplemented groups and the control group.
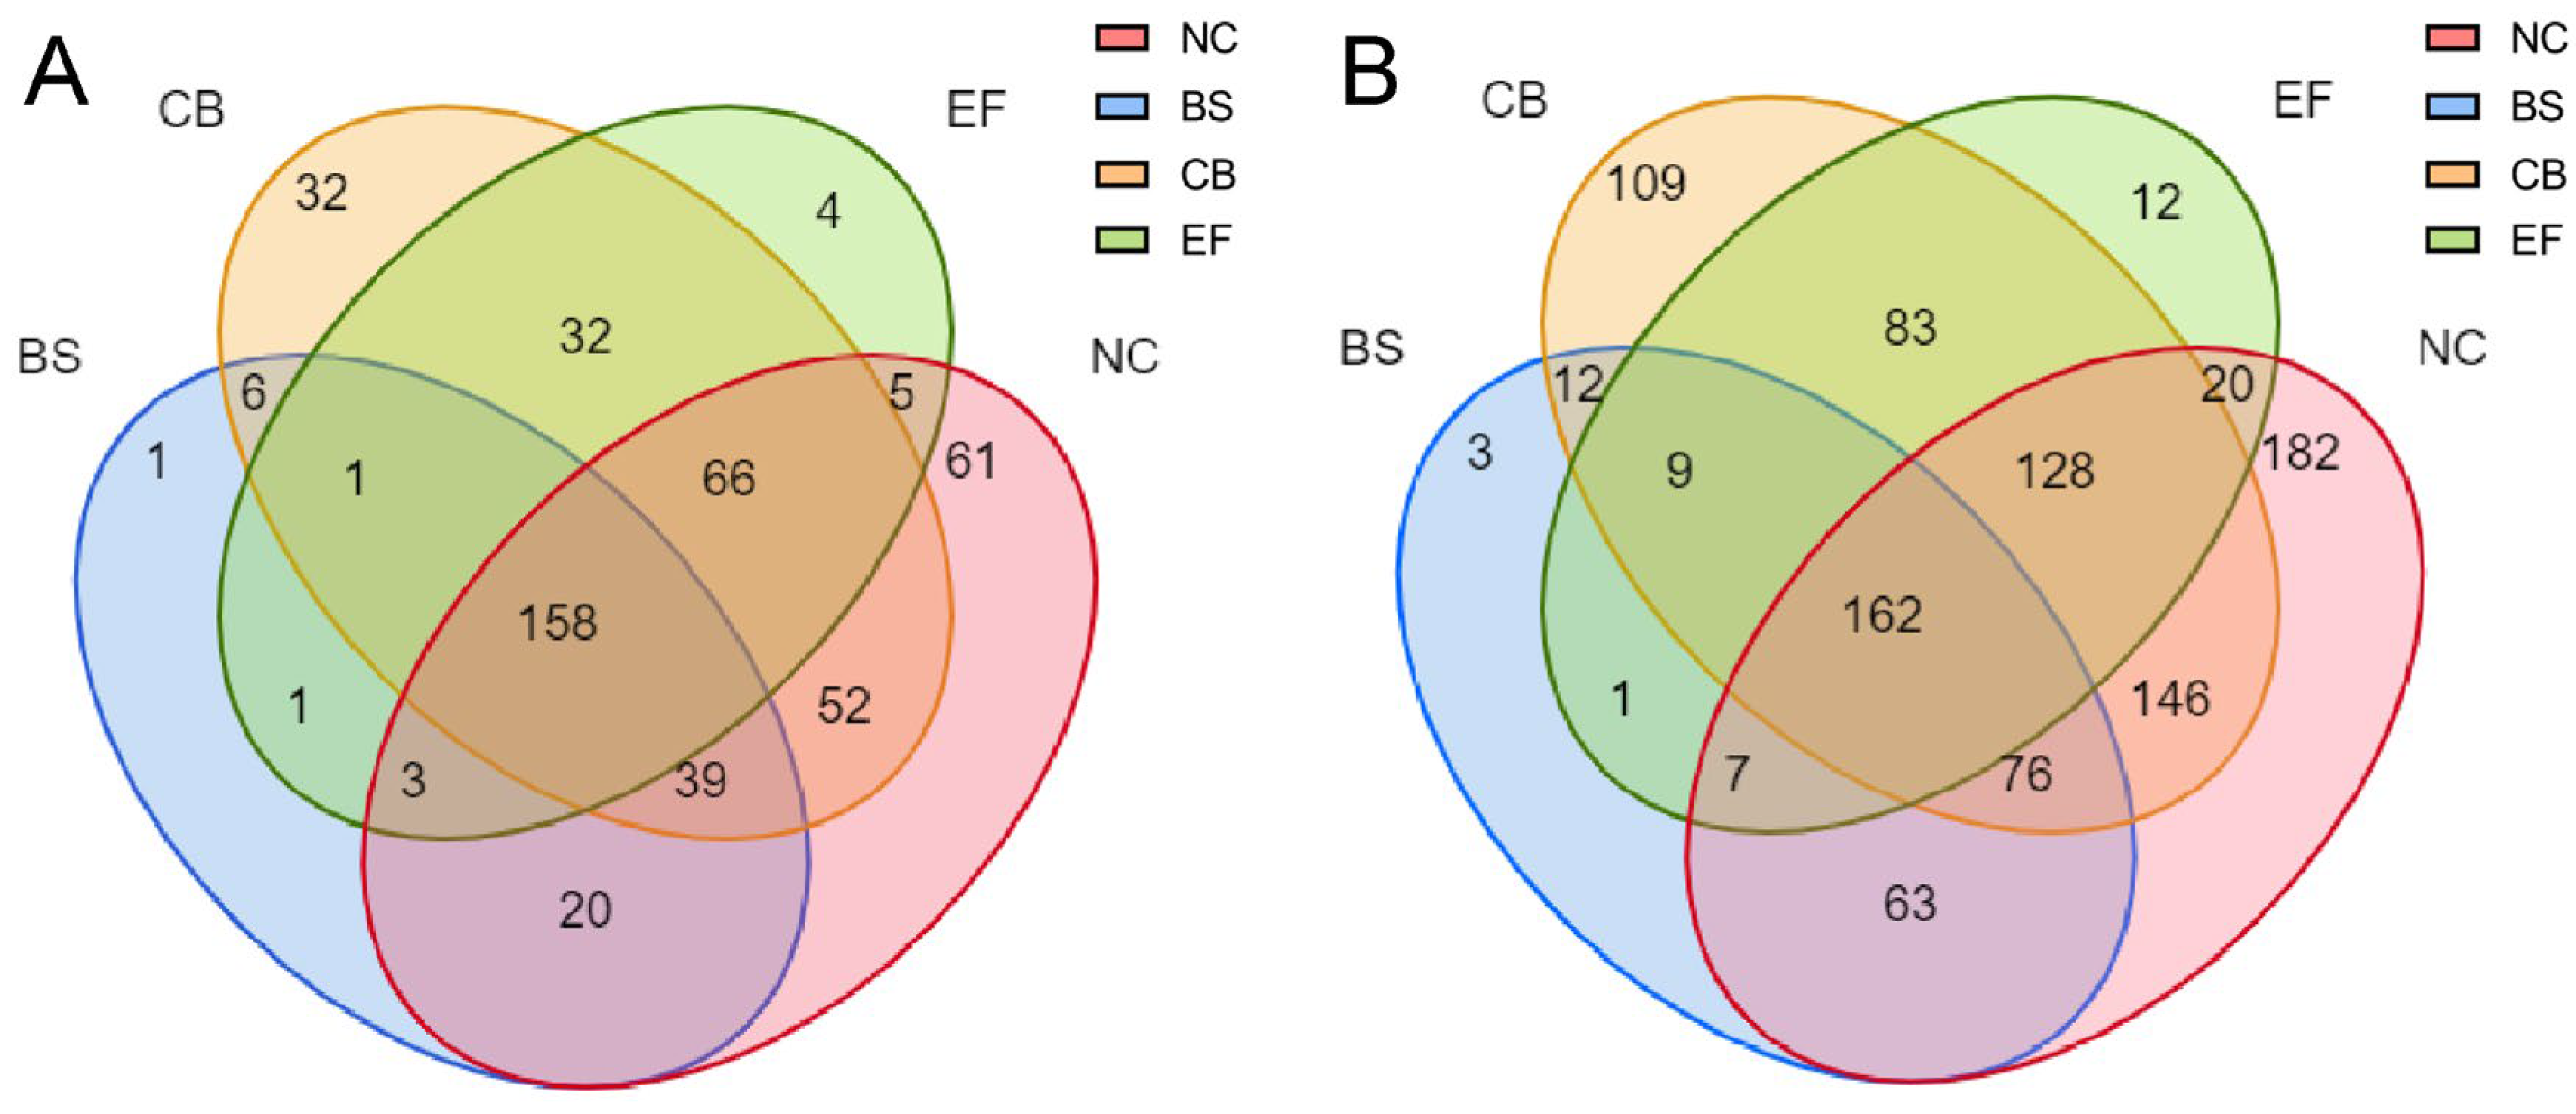
Venn diagram analysis of all grass carp gut microbial communities at the OTU and genus levels (Figure 5) showed that the NC had the highest number of unique OTUs (61), the BS group had one unique OTU, the CB had 32 unique OTUs, the EF had four unique OTUs, and the probiotic-added group and the control group shared 158 OTUs.
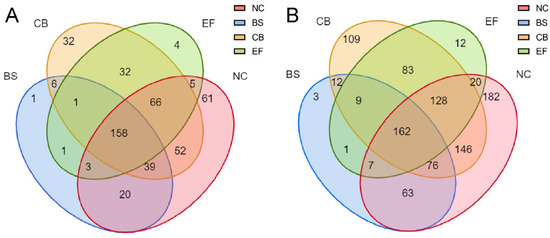
Figure 5.
Venn diagrams of gut microbiota in grass carp from different probiotic-supplemented groups and the control group on the OTU level (A) and genus level (B).
At the genus level, the NC had the highest number of unique taxa (182), the BS group had three, the CB had 109, the EF had 12, and the probiotic-added group shared 162 taxa with the control group. At different taxonomic levels, the BS group had fewer unique taxa than the remaining groups, suggesting that the microbial richness in its group was lower, but its dominant populations were more prominent.
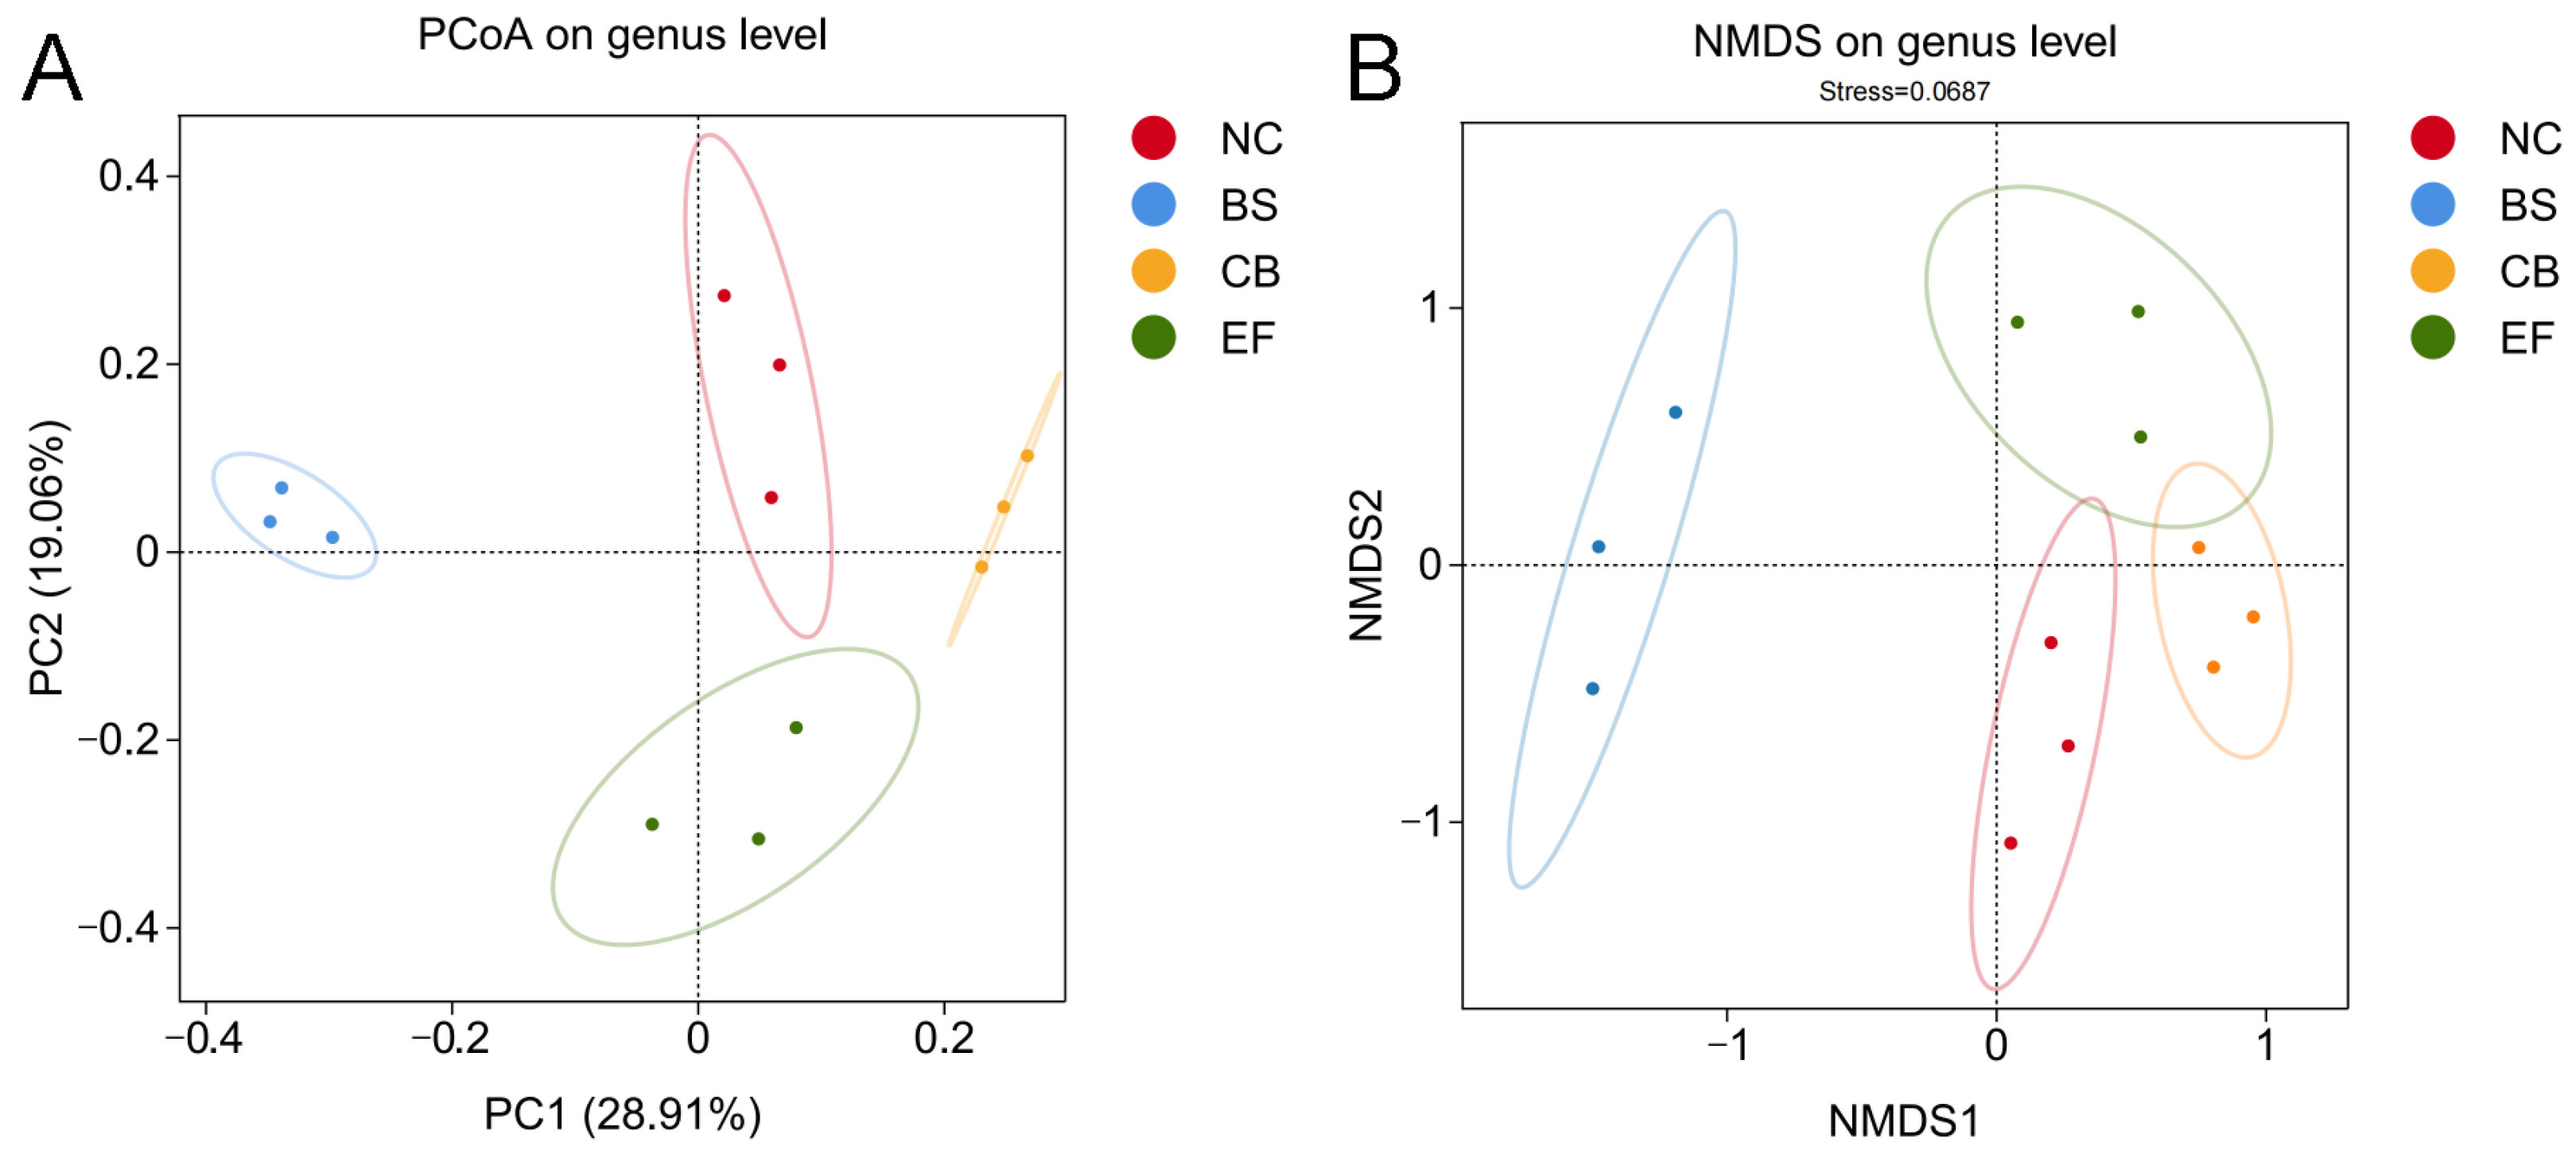
Principal coordinate analysis (PCoA) and non-metric multidimensional scaling (NMDS) based on genus-level data (Figure 6) showed that the probiotic-supplemented groups (BS, CB, EF) were distant from the NC group, while samples within each probiotic group were closely clustered. This indicates that the gut microbiota structure of grass carp in the probiotic-supplemented groups differed significantly from those in the NC group, suggesting that the three types of probiotics in the feed altered the gut microbiota composition of grass carp.
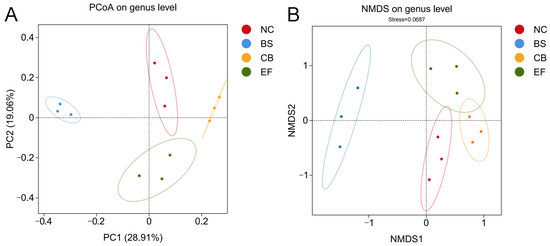
Figure 6.
β-diversity analysis of gut microbiota of grass carp in different probiotic-supplemented groups and control group. (A) Principal coordinate analysis (PCoA) plot based on the binary_jaccard distance matrix; (B) Non-metric multidimensional scaling (NMDS) plot based on the binary_jaccard distance matrix.
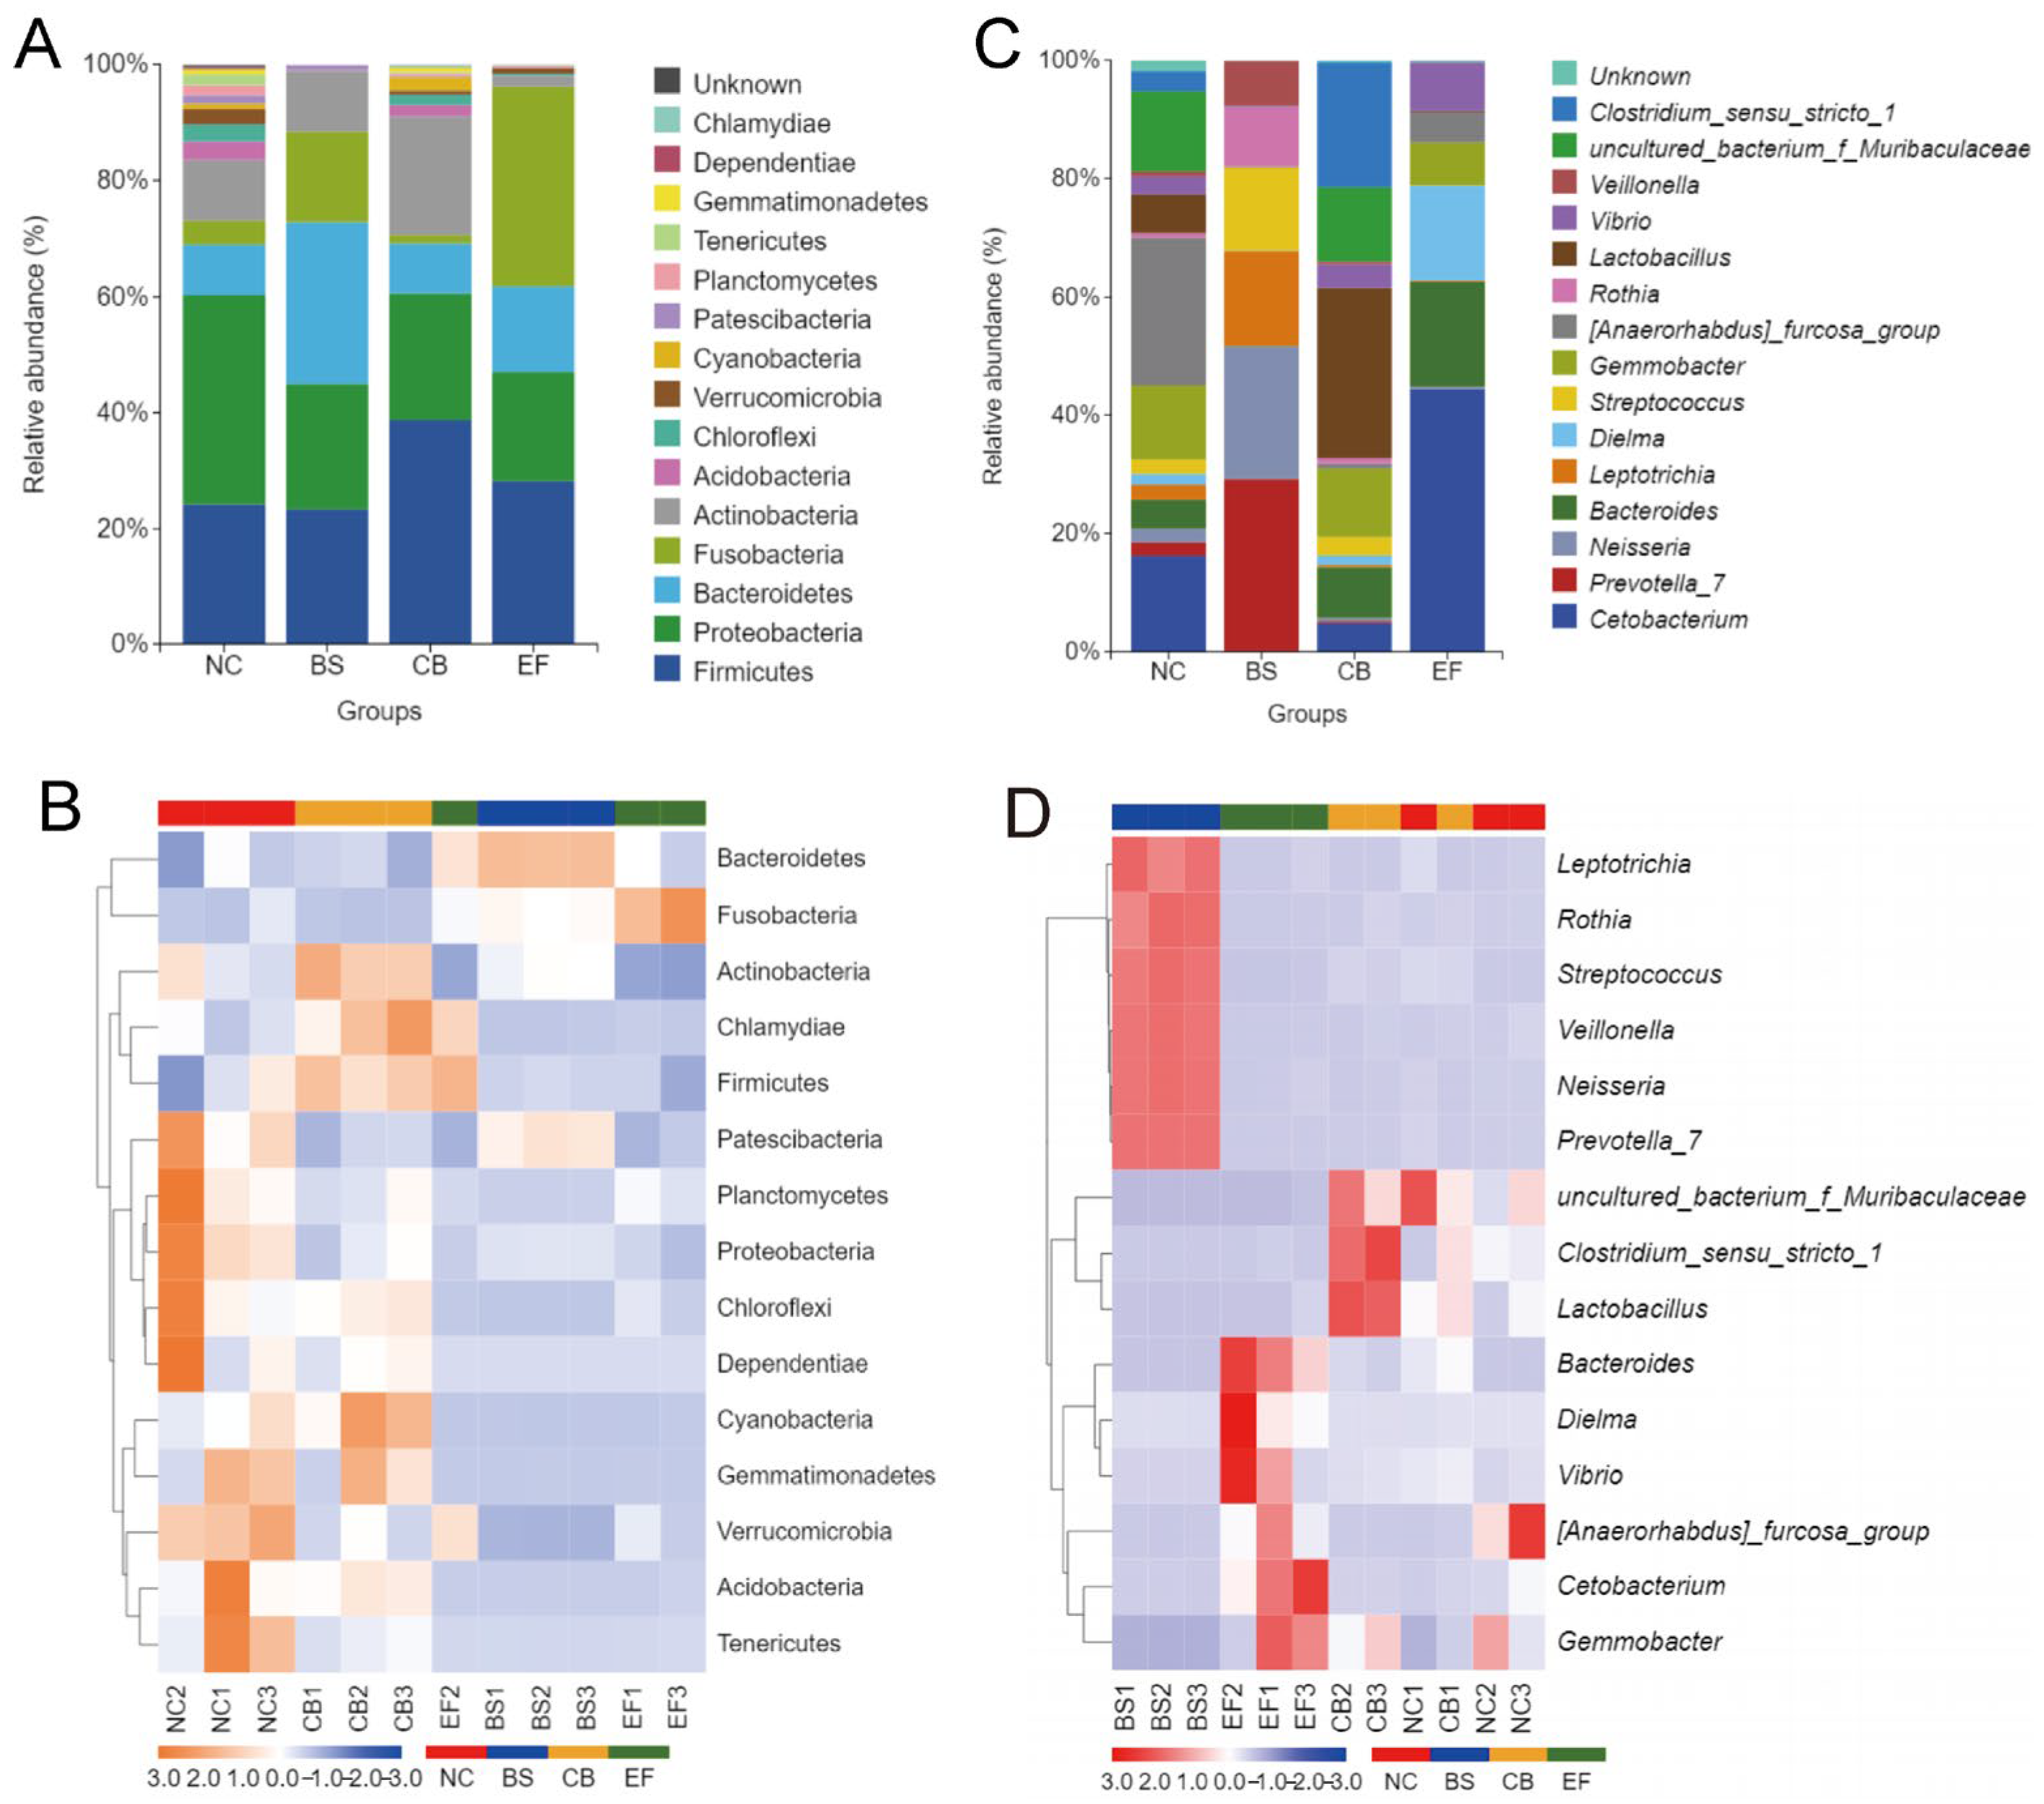
Analysis of the relative abundance of gut microbiota at the phylum level in grass carp from different probiotic-supplemented groups is shown in Figure 7A,B. The four groups had similar major phyla, including Firmicutes, Proteobacteria, Bacteroidetes, Fusobacteria, Actinobacteria, and Acidobacteria, but with differences in relative abundance. The relative abundance of Proteobacteria in the BS, CB, and EF groups was 21.76%, 21.81%, and 18.96%, respectively, all significantly lower than in the NC group (36.12%) (p < 0.05). The relative abundance of Verrucomicrobia in the BS, CB, and EF groups was below 1%, also significantly lower than that in the NC group (2.63%) (p < 0.05). The Bacteroidetes relative abundance in the BS group (27.75%) was significantly higher than in the NC group (8.58%) (p < 0.05), while the Acidobacteria relative abundance (0.03%) was significantly lower than in the NC group (3.19%) (p < 0.05). The Actinobacteria and Cyanobacteria relative abundances in the CB group were 20.33% and 2.26%, respectively, both significantly higher than in the NC group (10.46% and 0.94%) (p < 0.05). The Fusobacteria relative abundance in the EF group (34.19%) was significantly higher than that in the NC group (4.08%) (p < 0.05), while the Actinobacteria relative abundance (1.85%) was significantly lower than in the NC group (10.46%) (p < 0.05). Additionally, the relative abundance of Patescibacteria in the CB and EF groups (0.24% and 0.10%, respectively) was significantly lower than in the NC group (1.39%) (p < 0.05).

Figure 7.
Composition of gut microbiota of grass carp in different probiotic-supplemented groups and the control group. (A) Histograms on phylum level; (B) Heatmaps on phylum level; (C) Histograms on genus level; (D) Heatmaps of gut community on genus level.
At the genus level, the dominant genera in the gut microbiota of grass carp were Cetobacterium, Gemmobacter, and Bacteroides, but their relative abundances varied among the groups. In the BS group, the relative abundance of Prevotella_7, Neisseria, Leptotrichia, and Streptococcus was significantly higher than in the other groups (p < 0.05). In the CB group, the relative abundance of Lactobacillus and Clostridium_sensu_stricto_1 was significantly higher than in the other groups (p < 0.05). In the EF group, the relative abundance of Cetobacterium and Bacteroides was significantly higher than in the other groups (p < 0.05).
Linear discriminant analysis effect size (LEfSe) analysis based on one-to-one comparisons of gut microbiota from phylum to genus levels is shown in Figure 8. In the BS group, the relative abundance of Prevotella_7, Streptococcus, Prevotellaceae, Bacteroidales, and Lactobacillales was significantly higher than in the NC group (p < 0.05). In the CB group, the relative abundance of Lactobacillaceae, Clostridiaceae_1, and Clostridiales was significantly higher than in the other groups (p < 0.05). In the EF group, the relative abundance of Bacteroides, Cetobacterium, Bacteroidaceae, Fusobacteriaceae, and Fusobacteriales was significantly higher than in the NC group (p < 0.05), consistent with the results shown in Figure 7.
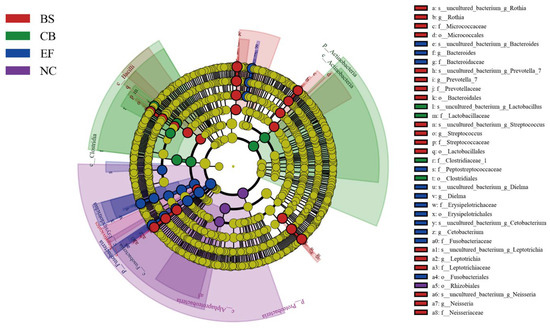
Figure 8.
LEfSe analysis of microbial communities from phylum to genus level (LDA = 4.5) in probiotic-supplemented groups and the control group.
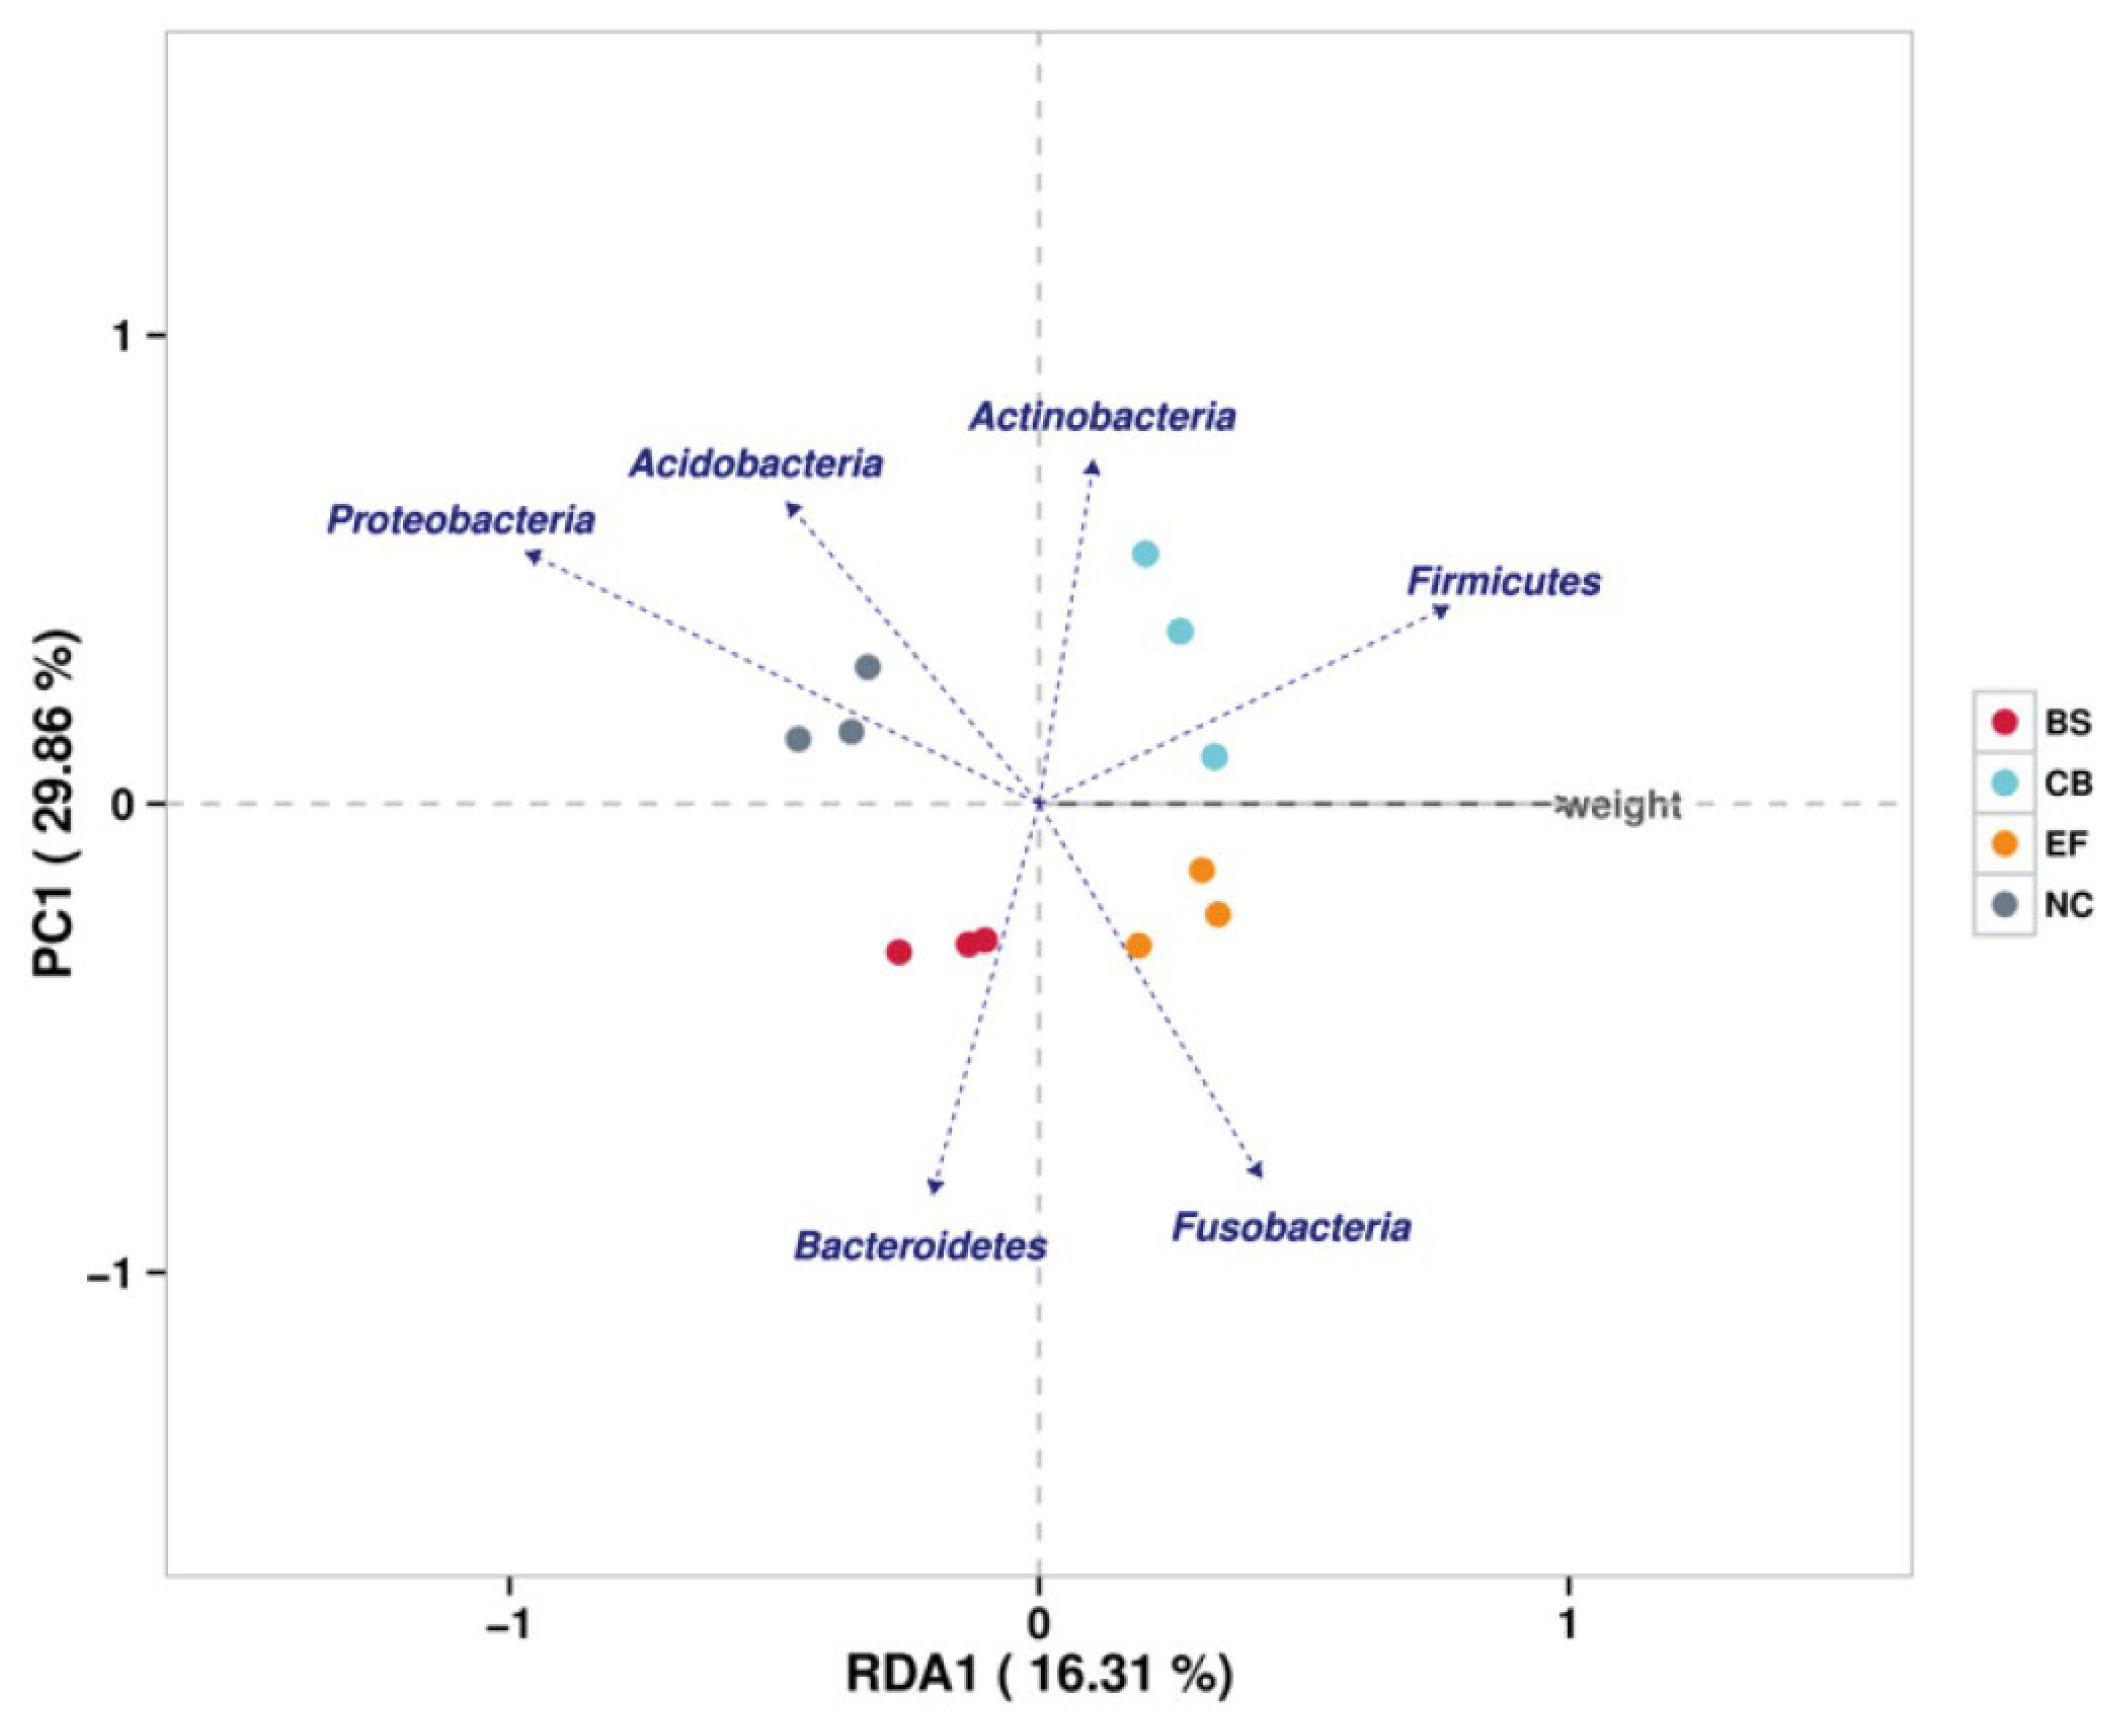
Redundancy analysis (RDA) showed that phyla such as Firmicutes, Fusobacteria, and Actinobacteria were positively correlated with increased fish weight, while Proteobacteria showed a negative correlation. This suggests that specific gut microbiota may play a role in promoting fish growth by influencing nutrient metabolism and energy utilization (Figure 9).
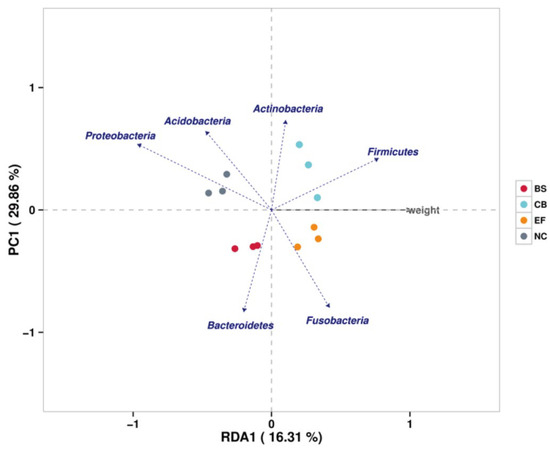
Figure 9.
Redundancy analysis (RDA) correlating the abundance of intestinal microbiota with the body weight of grass carp in different probiotic-supplemented groups and the control group.
4. Discussion
4.1. Dietary Probiotic Supplementation Enhances Growth Performance in Grass Carp
The results of this study demonstrated that compared to the NC group, the BS group supplemented with B. subtilis (1 × 10¹⁰ CFU/g) showed no significant improvement in SR but exhibited significantly increased FBW, WGR, SGR, and crude protein content (p < 0.05), along with a significant reduction in FCR (p < 0.05). These findings align with previous studies on B. subtilis in Japanese eel (A. japonica) and Nile tilapia (O. niloticus). For instance, dietary supplementation of B. subtilis WB60 or B. subtilis HAINUP40 at 1.0 × 10⁸ CFU/g significantly improved FBW, FCR, PER, and SGR in fish, while also enhancing post-infection survival rates of Vibrio anguillarum-challenged Japanese eels [21,46].
In the present study, the CB and EF groups exhibited significantly higher SR, FW, WGR, SGR, PER, and crude protein content compared to the NC group (p < 0.05). The study of Wang et al. confirmed that grass carp (C. idella) fed with Clostridium butyricum metabolites had higher growth performance (FBW, WGR, and SGR) [39]. Similarly, C. butyricum has been reported to improve growth performance in largemouth bass (M. salmoides), Nile tilapia (O. niloticus), large yellow croaker (Larimichthys crocea), and yellow catfish (Pelteobagrus fulvidraco), with optimal supplementation levels ranging from 1.0 × 10⁶ to 1.5 × 10⁸ CFU/g [27,47,48,49]. Furthermore, dietary supplementation with E. faecalis W24 or E. faecium L6 at 1.0 × 10⁸ CFU/g significantly increased FW, WG, SGR, FE, and FER of snakehead fish (Channa argus) and grass carp (C. idella), and SR of Aeromonas hydrophila-challenged grass carp showed the same trend [30,50]. Collectively, these studies confirm that B. subtilis, C. butyricum, and E. faecalis enhance feed utilization, growth performance, and stress resistance of fish.
4.2. Dietary Probiotics Increase Intestinal Digestive Enzyme and Antioxidant Enzyme Activity in Grass Carp
Numerous studies indicate that Bacillus and lactic acid bacteria can secrete exogenous enzymes and metabolites (e.g., short-chain fatty acids and vitamins) in the fish intestine, synergizing with endogenous enzymes to enhance nutrient digestion and absorption [16,20]. For example, supplementation of C. butyricum at 3 × 10¹⁰ to 3 × 10¹¹ CFU/kg in Nile tilapia diets significantly increased trypsin, lipase, and amylase activities of fish [51]. In blunt snout bream (Megalobrama amblycephala), protease activity initially increased and then decreased with escalating E. faecalis supplementation (1 × 10⁵ to 1 × 10⁷ CFU/g), peaking at 1 × 10⁶ CFU/g [45]. Additionally, dietary B. subtilis (1.0 × 10⁶ to 1.0 × 10¹⁰ CFU/g) enhanced intestinal protease activity in Yellow River carp (C. carpio L.), Nile tilapia (O. niloticus), yellow catfish (P. fulvidraco), red sea bream (Pagrus major), striped catfish (Pangasius hypophthalmus), and olive flounder (Paralichthys olivaceus) [21,22,52,53,54]. Therefore, the positive effects of probiotics on intestinal digestive enzyme activity in fish have been well-documented [51,52,53,54]. Chymotrypsin, a serine endopeptidase, specifically hydrolyzes peptide bonds at aromatic amino acid residues (e.g., tryptophan, tyrosine, phenylalanine) [35]. Synthesized as inactive zymogens (chymotrypsinogen) in the pancreas, it is enzymatically activated upon intestinal secretion [35]. As a key determinant for protein metabolism and nutritional status [34,35,36,37,38], the increase of chymotrypsin activity has been reported in Caspian roach (R. frisii kutum) and grass carp (C. idella) fed with synbiotics or sodium butyrate [36,37]. This study showed upregulated expression of its precursor gene (ctrb1) in all probiotic-supplemented groups (p < 0.05), with the EF group exhibiting the highest ctrb1 expression. This suggests that probiotics may enhance the intestinal digestive enzyme activity and protein metabolism by modulating the synthesis of chymotrypsin.
Antioxidant enzymes, including SOD and CAT, constitute the primary defense against oxidative stress. SOD catalyzes the conversion of O2− to H2O2, which is further decomposed by CAT into H2O and O2 [55]. Dietary C. butyricum (1.5 × 10⁶–3.2 × 10⁶ CFU/g) significantly elevated hepatic SOD, CAT, and peroxidase (POD) activities in largemouth bass [49]. Similarly, C. butyricum-fermented feed (1000 g/kg) upregulated intestinal antioxidant enzyme activities (SOD, CAT, T-AOC) and related gene expression in grass carp [16]. Moreover, B. subtilis supplementation (1.0 × 10⁶–1.0 × 10¹⁰ CFU/g) enhanced SOD and CAT activities or regulated antioxidant genes (nrf2, sod1, cat) in grass carp (C. idellus), Japanese eel (A. japonica), olive flounder (P. olivaceus), rainbow trout (Oncorhynchus mykiss), and hybrid grouper (Epinephelus coioides) [40,46,54,56,57]. In this study, serum SOD and CAT activities were significantly elevated in the BS group (p < 0.05), while SOD activity increased notably in the CB group (p < 0.05). These improvements may stem from probiotic-induced modulation of gut microbiota and activation of the Nrf2-Keap1-ARE pathway, promoting antioxidant gene expression [16]. Although E. faecalis supplementation showed a non-significant upward trend in enzyme activities, this may reflect dose-dependent effects, as higher doses could attenuate its beneficial impact due to its conditional pathogenicity [58]. Overall, all three probiotics enhanced SOD activity, highlighting their critical role in mitigating oxidative stress in grass carp.
4.3. Dietary Probiotics Improve Intestinal Morphology and Microbial Community Composition in Grass Carp
Gut microbiota is a complex microbial community colonizing the fish gut, which plays a vital role in maintaining intestinal microecological balance. Numerous studies have demonstrated that dietary probiotics can enhance fish growth, lipid-glucose metabolism, and immune responses by modulating intestinal microbial diversity and composition [46,59]. Alpha-diversity indices reflect microbial community richness and diversity in fish intestines [46,59]. Specifically, the Ace and Chao indices represent community richness, which means higher values indicate greater species richness. The Shannon and Simpson indices reflect community diversity, integrating species richness and evenness. A higher Shannon index and lower Simpson index suggest greater diversity.
In this study, dietary supplementation with 1 × 10¹⁰ CFU/g of B. subtilis, C. butyricum, or E. faecalis significantly increased intestinal villus height in grass carp (p < 0.05). Moreover, B. subtilis notably elevated the intestinal V/C ratio (p < 0.05). Compared to the NC group, significantly lower Chao, Shannon, and Simpson indices were found in the BS and EF groups, while significantly higher Ace indices were found in the CB group (p < 0.05), indicating three probiotics had different impacts on the diversity of fish gut microbiota. These findings suggest that three probiotics supplements improved intestinal morphology, enhanced nutrient absorption, and had an obvious impact on the diversity of fish gut microbial communities. This phenomenon may arise from the dominance of specific beneficial taxa, which do not necessarily correlate positively with overall diversity, as previously reported in Chinese perch (Siniperca chuatsi) and large yellow croaker (L. crocea) [47,60].
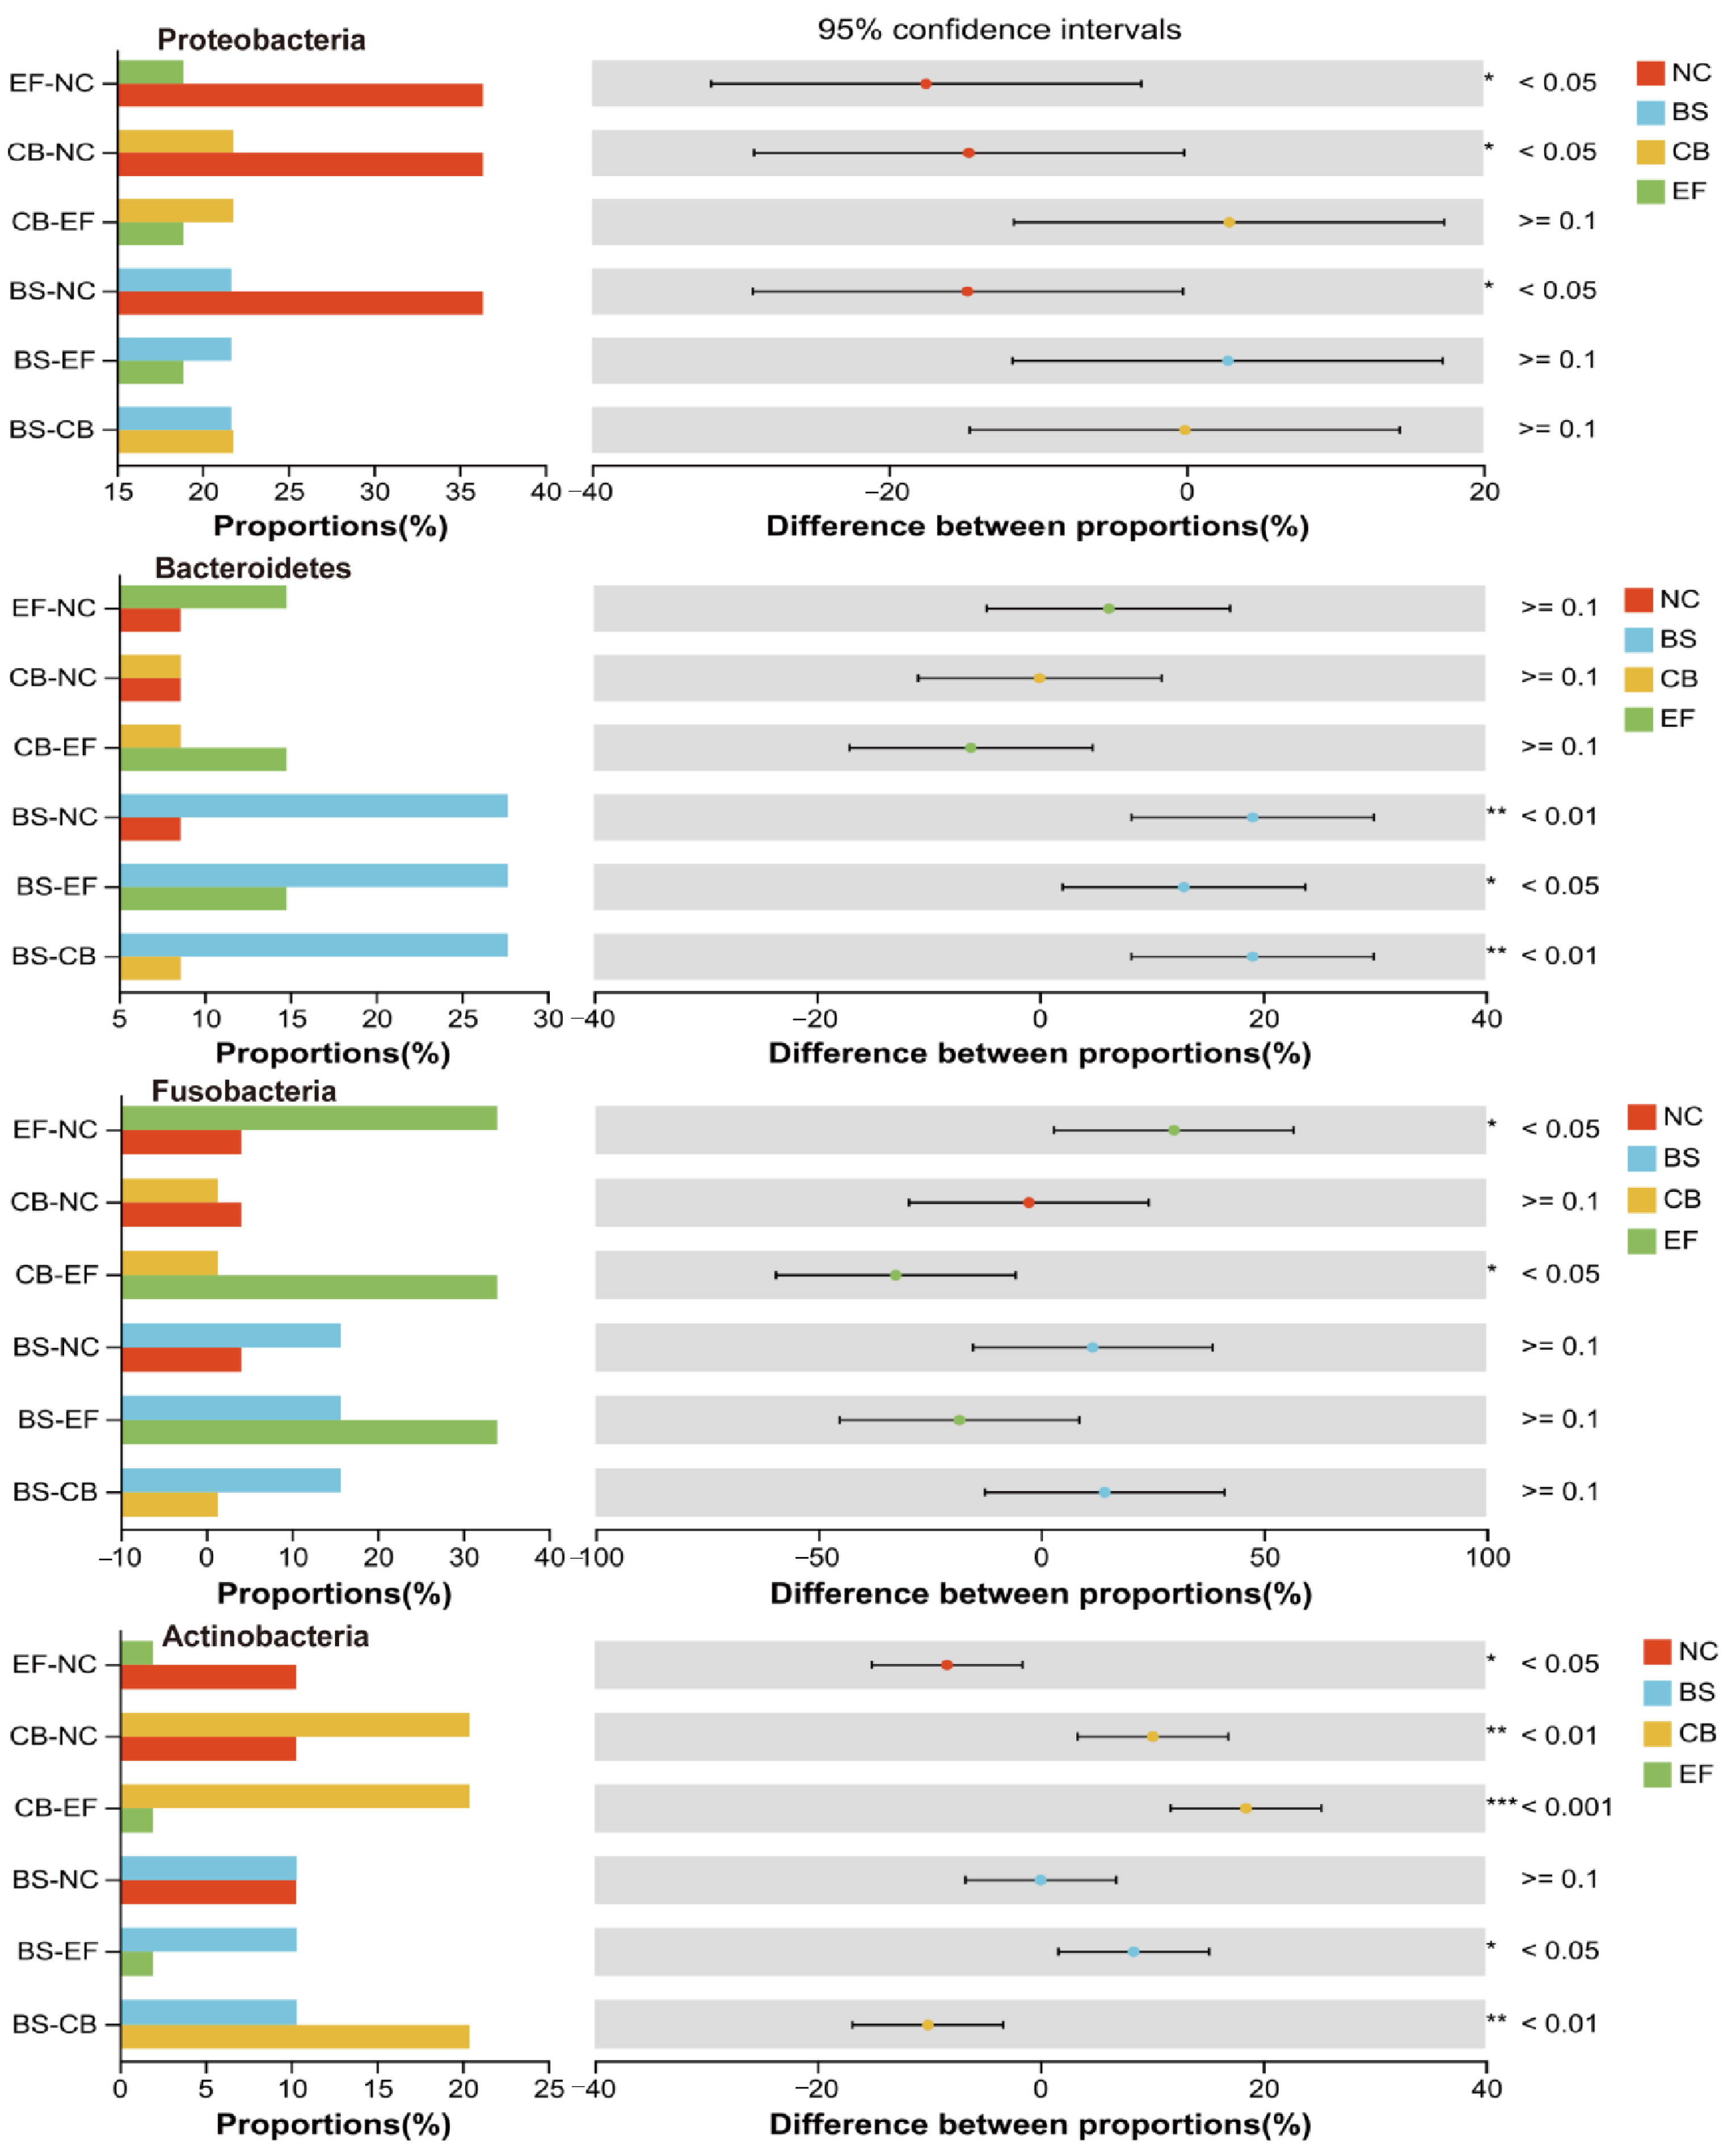
Composition, LEfSe, and RDA analyses of the gut microbiota of grass carp supplemented with different probiotics demonstrated that the relative abundance of Firmicutes was the highest in all groups at the phylum level, is 23.86%, 23.20%, 38.45%, and 28.34% in NC, BS, CB, and EF groups, respectively. The results indicated that the colonization of three probiotics in the fish gut was successful. Also, it was found that three probiotics significantly reduced the relative abundance of Proteobacteria (Figure 10) (p < 0.05), which is consistent with research on common carp and Chinese perch [61,62]. Proteobacteria are a Gram-negative bacterial phylum whose lipopolysaccharide-rich outer membrane can trigger intestinal inflammation [63]. The decrease in the abundance of this phylum may be attributable to the inhibitory effect of probiotic bacteria on the pathogenic bacteria within the intestinal tract [62].

Figure 10.
One-way ANOVA analysis of the comparison of gut microbial community on phylum level in different probiotic-supplemented groups and the control group. Values are means ± SE. Bars marked with * represent statistically significant differences (p < 0.05). Bars marked with ** represent statistically significant differences (p < 0.01). Bars marked with *** represent statistically significant differences (p < 0.001).
In this study, the relative abundance of Actinobacteria in the intestinal tract was significantly higher in the C. butyricum-supplemented group compared to other groups (p < 0.05) (Figure 10). Actinobacteria are known to possess the capacity to impede the reproduction of potentially harmful bacteria through the production of antibiotic-active metabolites, thereby enhancing the immunity of fish [64]. The B. subtilis-supplemented group showed a significantly elevated relative abundance of Bacteroidetes compared to other groups (p < 0.05). The relative abundance of Actinobacteria was significantly increased after the supplementation of C. butyricum (1 × 10¹⁰ CFU/g) compared to the NC group (Figure 10) (p < 0.05). Also, the relative abundance of Fusobacteria was significantly higher in the E. faecalis-supplemented group than the NC group (Figure 10) (p < 0.05). Furthermore, the relative abundance of Actinobacteria and Fusobacteria was found to be positively correlated with the final body weight of grass carp in the study. Consistent with these findings, Sun et al. reported that supplementation of E. faecium L6 (1.0 × 10⁸ CFU/g) in diets significantly increased the relative abundance of Fusobacteria, Bacteroidetes, Cetobacterium, and Bacteroides levels in grass carp [44]. Bacteroidetes, Actinobacteria, and Fusobacteria have the capacity to degrade indigestible polysaccharides and generate short-chain fatty acids like butyrate, which could enhance the growth performance of fish by improving intestinal barrier function, ameliorating intestinal inflammation, and modulating gut microbiota homeostasis [64].
In this study, at the genus level, supplementation with 1 × 10¹⁰ CFU/g of B. subtilis significantly increased the relative abundance of Prevotella_7, Neisseria, Leptotrichia, and Streptococcus (p < 0.05). Prevotella_7 could facilitate cellulose/hemicellulose digestion and SCFA production to improve lipid and glucose metabolism [65]. The C. butyricum-supplemented group showed increased abundance of Lactobacillus and Clostridium_sensu_stricto_1 (p < 0.05), consistent with studies adding B. subtilis BOE9 or E. faecium AT5 to fish feed [62]. It has been reported that lactic acid bacteria (Streptococcus and Lactobacillus) could not only produce lactic acid to lower environmental pH but also produce antimicrobial compounds such as exopolysaccharides and H2O2, effectively inhibiting pathogen adhesion and colonization [66,67,68]. Clostridium_sensu_stricto_1 could upregulate tight junction gene expression and suppress pro-inflammatory cytokine genes. The increased relative abundance of Clostridium_sensu_stricto_1 in the C. butyricum-supplemented group suggests that probiotic supplementation improves intestinal microbiota balance to strengthen mucosal immunity, which is consistent with findings from Amoah et al. [69]. In this study, the supplementation with 1 × 10¹⁰ CFU/g of E. faecalis led to a substantial increase (p < 0.05) in the abundance of Cetobacterium and Bacteroides, and the abundance of them exhibited a positive correlation with the final body weight of the grass carp. Bacteroides has been shown to facilitate the digestion of polysaccharides in fish [30]. Cetobacterium has been confirmed to be capable of metabolizing and producing vitamin B12, which possesses antioxidant and anti-inflammatory properties that contribute to the alleviation of oxidative stress and the enhancement of immune function in fish [70,71].
In summary, this study reveals that dietary B. subtilis, C. butyricum, or E. faecalis supplementation could increase the relative abundance of Actinobacteria, Fusobacteria, Bacteroidota, Lactobacillus, Cetobacteria, Clostridium_sensu_stricto_1, and Bacteroides and decrease the relative abundance of gut-harmful bacteria Proteobacteria in grass carp. These results demonstrate that the addition of three probiotics could not only promote the colonization and growth of beneficial bacteria associated with short-chain fatty acid production, glycolipid metabolism, oxidative stress, and immune response, but also inhibit the adhesion of harmful bacteria in grass carp intestines. Therefore, three probiotics could improve the growth performance, antioxidant capacity, and intestinal structure in grass carp by regulating the balance of gut microbiota.
5. Conclusions
This study demonstrated that dietary supplementation with 1 × 10¹⁰ CFU/g of B. subtilis, C. butyricum, or E. faecalis significantly enhanced the FBW, WGR, SGR, and crude protein content in grass carp. Notably, three probiotic treatments increased serum SOD activity, with particularly significant improvements observed in the B. subtilis-supplement group. The probiotic supplementation significantly upregulated the relative expression level of the ctrb1, increased intestinal villus length, and modulated the gut microbiota composition by elevating the relative abundance of beneficial bacterial taxa while reducing the proportion of potentially harmful phyla such as Proteobacteria. In conclusion, the three probiotics improved growth performance and feed utilization in juvenile grass carp through multiple mechanisms, including upregulating the expression of the chymotrypsin gene to enhance digestive capacity, optimizing intestinal morphology, rebalancing gut microbiota composition, strengthening intestinal barrier function, and boosting antioxidant enzyme activity. These synergistic effects collectively contributed to increased survival rates and overall growth efficiency in the experimental subjects.
Author Contributions
Conceptualization, Y.Y., W.Z. and J.S.; methodology, W.Z., Y.Y. and T.L.; software, W.Z. and Z.Z.; validation, W.Z., Y.Y. and Z.Z.; formal analysis, W.Z. and Y.Y; investigation, Y.Y., W.Z. and Z.Z.; resources, Z.Z.; data curation, H.L.; writing—original draft preparation, Y.Y.; writing—review and editing, W.Z., Z.Z. and H.L.; visualization, Y.Y., Z.Z., T.L. and Q.S.; supervision, J.S. and L.L; project administration, J.S. and L.L.; funding acquisition, J.S. and L.L. All authors have read and agreed to the published version of the manuscript.
Funding
This research was funded by the National Natural Science Foundation of China (grant number 31800027), the Open Funds of Hubei Key Laboratory of Regional Development and Environmental Response (2019(A)002), and the Key Project of Science and Technology Research Program of Hubei Educational Commission (grant number D20211004).
Institutional Review Board Statement
The animal study protocol was approved by the Ethics Committee of the Institute of Laboratory Animal Centre, Huazhong Agricultural University (protocol code: HZAUFI-2023-003, approval date: 20 October 2023).
Informed Consent Statement
Not applicable.
Data Availability Statement
The original contributions presented in this study are included in the article. Further inquiries can be directed to the corresponding authors.
Acknowledgments
We would like to acknowledge the support provided by Jianjun Wu and Ying Zhou from Wuhan SunHY Biology Co., Ltd., Wuhan, China.
Conflicts of Interest
The authors declare no conflict of interest.
References
- Tran, N.T.; Liang, H.; Li, J.; Deng, T.; Zhang, M.; Li, S. Health benefits of butyrate and its producing bacterium, Clostridium butyricum, on aquatic animals. Fish Shellfish Immunol. Rep. 2023, 4, 100088. [Google Scholar] [CrossRef] [PubMed]
- Bai, N.; Gu, M.; Xu, X.; Xu, B.; Krogdahl, Å. Protective effects of mannan oligosaccharides on turbot Scophthalmus maximus suffering from soy enteropathy. Aquaculture 2017, 476, 141–151. [Google Scholar] [CrossRef]
- Rahimnejad, S.; Lu, K.; Wang, L.; Song, K.; Mai, K.; Davis, D.A.; Zhang, C. Replacement of fish meal with Bacillus pumillus SE5 and Pseudozyma aphidis ZR1 fermented soybean meal in diets for Japanese seabass (Lateolabrax japonicus). Fish Shellfish Immunol. 2019, 84, 987–997. [Google Scholar] [CrossRef] [PubMed]
- Liu, G.; Zhou, M.; Wang, X.; Mao, X.; Long, X.; Xie, S.; Han, D.; Tan, Q. Effects of dietary cottonseed protein concentrate levels on growth performance, health status, flesh quality and intestinal microbiota of grass carp (Ctenopharyngodon idellus). Metabolites 2022, 12, 1046. [Google Scholar] [CrossRef]
- Pérez-Sánchez, T.; Mora-Sánchez, B.; Balcázar, J.L. Biological approaches for disease control in aquaculture: Advantages, limitations and challenges. Trends Microbiol. 2018, 26, 896–903. [Google Scholar] [CrossRef]
- Dawood, M.A.O.; Koshio, S.; Abdel-Daim, M.M.; Van Doan, H. Probiotic application for sustainable aquaculture. Rev. Aquac. 2019, 11, 907–924. [Google Scholar] [CrossRef]
- Hasan, M.T.; Jang, W.J.; Kim, H.; Lee, B.J.; Kim, K.W.; Hur, S.W.; Lim, S.G.; Bai, S.C.; Kong, I.S. Synergistic effects of dietary Bacillus sp. SJ-10 plus β-glucooligosaccharides as a synbiotic on growth performance, innate immunity and streptococcosis resistance in olive flounder (Paralichthys olivaceus). Fish Shellfish Immunol. 2018, 82, 544–553. [Google Scholar] [CrossRef] [PubMed]
- Gobi, N.; Vaseeharan, B.; Chen, J.C.; Rekha, R.; Vijayakumar, S.; Anjugam, M.; Iswarya, A. Dietary supplementation of probiotic Bacillus licheniformis Dahb1 improves growth performance, mucus and serum immune parameters, antioxidant enzyme activity as well as resistance against Aeromonas hydrophila in tilapia Oreochromis mossambicus. Fish Shellfish Immunol. 2018, 74, 501–508. [Google Scholar] [CrossRef]
- Liu, Y.; Chen, Z.; Dai, J.; Yang, P.; Xu, W.; Ai, Q.; Zhang, W.; Zhang, Y.; Zhang, Y.; Mai, K. Sodium butyrate supplementation in high-soybean meal diets for turbot (Scophthalmus maximus L.): Effects on inflammatory status, mucosal barriers and microbiota in the intestine. Fish Shellfish Immunol. 2019, 88, 65–75. [Google Scholar] [CrossRef]
- Wang, A.; Ran, C.; Wang, Y.; Zhang, Z.; Ding, Q.; Yang, Y.; Olsen, R.E.; Ringø, E.; Bindelle, J.; Zhou, Z. Use of probiotics in aquaculture of China—A review of the past decade. Fish Shellfish Immunol. 2019, 86, 734–755. [Google Scholar] [CrossRef]
- Ringø, E.; Van Doan, H.; Lee, S.H.; Soltani, M.; Hoseinifar, S.H.; Harikrishnan, R.; Song, S.K. Probiotics, lactic acid bacteria and bacilli: Interesting supplementation for aquaculture. J. Appl. Microbiol. 2020, 129, 116–136. [Google Scholar] [CrossRef] [PubMed]
- Zhang, X.; Fu, L.; Deng, B.; Liang, Q.; Zheng, J.; Sun, J.; Zhu, H.; Peng, L.; Wang, Y.; Wenying, S.; et al. Bacillus subtilis SC02 supplementation causes alterations of the microbial diversity in grass carp water. World J. Microbiol. Biotechnol. 2013, 29, 1645–1653. [Google Scholar] [CrossRef] [PubMed]
- Amit; Pandey, A.; Khairnar, S.O.; Tyagi, A. Effect of dietary supplementation of probiotic bacteria (Lactobacillus plantarum) on growth and proximate composition of Cyprinus carpio fingerlings. Natl. Acad. Sci. Lett. 2021, 44, 495–502. [Google Scholar] [CrossRef]
- Guimarães, M.C.; da Silva Guimarães, A.I.C.; Natori, M.M.; Alarcon, M.F.F.; Dias, D.D.C.; Ishikawa, C.M.; Tapia-Paniagua, S.; Moriñigo, M.Á.; Moyano, F.J.; Tachibana, L. Oral administration of Bacillus subtilis and Lactobacillus plantarum modulates the gut microbiota and increases the amylase activity of Nile tilapia (Oreochromis niloticus). Aquac. Int. 2021, 29, 91–104. [Google Scholar] [CrossRef]
- de Oliveira, N.S.; Ha, N.; da Cunha, L.; Cipriani, L.A.; Neto, A.T.; Skoronski, E.; Gisbert, E.; Perez Fabregat, T.E.H. Fermentation of soybean meal with Lactobacillus acidophilus allows greater inclusion of vegetable protein in the diet and can reduce Vibrionacea in the intestine of the South American catfish (Rhamdia quelen). Animals 2022, 12, 690. [Google Scholar] [CrossRef]
- Wang, C.; Hu, X.; Tang, H.; Ge, W.; Di, L.; Zou, J.; Cui, Z.; Zhou, A. Multiple effects of dietary supplementation with Lactobacillus reuteri and Bacillus subtilis on the growth, immunity, and metabolism of largemouth bass (Micropterus salmoides). Dev. Comp. Immunol. 2024, 160, 105241. [Google Scholar] [CrossRef]
- Cha, J.H.; Rahimnejad, S.; Yang, S.Y.; Kim, K.W.; Lee, K.J. Evaluations of Bacillus spp. as dietary additives on growth performance, innate immunity and disease resistance of olive flounder (Paralichthys olivaceus) against Streptococcus iniae and as water additives. Aquaculture 2013, 402, 50–57. [Google Scholar] [CrossRef]
- Liu, H.; Li, Z.; Tan, B.; Lao, Y.; Duan, Z.; Sun, W.; Dong, X. Isolation of a putative probiotic strain S12 and its effect on growth performance, non-specific immunity and disease-resistance of white shrimp, Litopenaeus vannamei. Fish Shellfish Immunol. 2014, 41, 300–307. [Google Scholar] [CrossRef]
- Cao, H.; Yu, R.; Zhang, Y.; Hu, B.; Jian, S.; Wen, C.; Kajbaf, K.; Kumar, V.; Yang, G. Effects of dietary supplementation with β-glucan and Bacillus subtilis on growth, fillet quality, immune capacity, and antioxidant status of Pengze crucian carp (Carassius auratus var. Pengze). Aquaculture 2019, 508, 106–112. [Google Scholar] [CrossRef]
- Kuebutornye, F.K.; Abarike, E.D.; Lu, Y. A review on the application of Bacillus as probiotics in aquaculture. Fish Shellfish Immunol. 2019, 87, 820–828. [Google Scholar] [CrossRef]
- Liu, H.; Wang, S.; Cai, Y.; Guo, X.; Cao, Z.; Zhang, Y.; Liu, S.; Yuan, W.; Zhu, W.; Zheng, Y.; et al. Dietary administration of Bacillus subtilis HAINUP40 enhances growth, digestive enzyme activities, innate immune responses and disease resistance of tilapia, Oreochromis niloticus. Fish Shellfish Immunol. 2017, 60, 326–333. [Google Scholar] [CrossRef] [PubMed]
- Fan, Y.; Liu, L.; Zhao, L.; Wang, X.; Wang, D.; Huang, C.; Zhang, J.; Ji, C.; Ma, Q. Influence of Bacillus subtilis ANSB060 on growth, digestive enzyme and aflatoxin residue in Yellow River carp fed diets contaminated with aflatoxin B1. Food Chem. Toxicol. 2018, 113, 108–114. [Google Scholar] [CrossRef] [PubMed]
- Kong, W.; Huang, C.; Tang, Y.; Zhang, D.; Wu, Z.; Chen, X. Effect of Bacillus subtilis on Aeromonas hydrophila-induced intestinal mucosal barrier function damage and inflammation in grass carp (Ctenopharyngodon idella). Sci. Rep. 2017, 7, 1588. [Google Scholar] [CrossRef] [PubMed]
- Shi, F.; Zi, Y.; Lu, Z.; Li, F.; Yang, M.; Zhan, F.; Li, Y.; Li, J.; Zhao, L.; Lin, L.; et al. Bacillus subtilis H2 modulates immune response, fat metabolism and bacterial flora in the gut of grass carp (Ctenopharyngodon idellus). Fish Shellfish Immunol. 2020, 106, 8–20. [Google Scholar] [CrossRef] [PubMed]
- Zhang, Y.; Qian, Z.; Ding, Y.; Ji, J.; Ning, X.; Yin, S.; Zhang, K. Isolation and characterization of a strain Clostridium butyricum B3 from the intestine of Pelteobagrus fulvidraco and its potential probiotic roles. Aquaculture 2025, 595, 741590. [Google Scholar] [CrossRef]
- Li, T.; Ke, F.; Gui, J.F.; Zhou, L.; Zhang, X.J.; Zhang, Q.Y. Protective effect of Clostridium butyricum against Carassius auratus herpesvirus in gibel carp. Aquac. Int. 2019, 27, 905–914. [Google Scholar] [CrossRef]
- Li, H.; Zhou, Y.; Ling, H.; Luo, L.; Qi, D.; Feng, L. The effect of dietary supplementation with Clostridium butyricum on the growth performance, immunity, intestinal microbiota and disease resistance of tilapia (Oreochromis niloticus). PLoS ONE 2019, 14, e0223428. [Google Scholar] [CrossRef]
- Nueno-Palop, C.; Narbad, A. Probiotic assessment of Enterococcus faecalis CP58 isolated from human gut. Int. J. Food Microbiol. 2011, 145, 390–394. [Google Scholar] [CrossRef]
- Reda, R.M.; Selim, K.M.; El-Sayed, H.M.; El-Hady, M.A. In vitro selection and identification of potential probiotics isolated from the gastrointestinal tract of Nile tilapia, Oreochromis niloticus. Probiotics Antimicrob. Proteins 2018, 10, 692–703. [Google Scholar] [CrossRef]
- Kong, Y.; Gao, C.; Du, X.; Zhao, J.; Li, M.; Shan, X.; Wang, G. Effects of single or conjoint administration of lactic acid bacteria as potential probiotics on growth, immune response and disease resistance of snakehead fish (Channa argus). Fish Shellfish Immunol. 2020, 102, 412–421. [Google Scholar] [CrossRef]
- Li, H.; Luo, L.; Zhou, Y.; Ling, H.; Yang, Q.; Qi, D. Dietary administration of Enterococcus faecalis affects the growth, disease resistance and immune function of tilapia (Oreochromis niloticus). Aquac. Rep. 2020, 18, 100440. [Google Scholar] [CrossRef]
- Suphoronski, S.A.; de Souza, F.P.; Chideroli, R.T.; Mantovani Favero, L.; Ferrari, N.A.; Ziemniczak, H.M.; Gonçalves, D.D.; Lopera Barrero, N.M.; Pereira, U.D.P. Effect of Enterococcus faecium as a water and/or feed additive on the gut microbiota, hematologic and immunological parameters, and resistance against Francisellosis and Streptococcosis in Nile tilapia (Oreochromis niloticus). Front. Microbiol. 2021, 12, 743957. [Google Scholar] [CrossRef] [PubMed]
- Tilwani, Y.M.; Sivagnanavelmurugan, M.; Lakra, A.K.; Jha, N.; Arul, V. Enhancement of growth, innate immunity, and disease resistance by probiotic Enterococcus faecium MC-5 against Aeromonas hydrophila in Indian major carp Cirrhinus mrigala. Vet. Immunol. Immunopathol. 2022, 253, 110503. [Google Scholar] [CrossRef] [PubMed]
- Assan, D.; Kuebutornye, F.K.A.; Hlordzi, V.; Chen, H.; Mraz, J.; Mustapha, U.F.; Abarike, E.D. Effects of probiotics on digestive enzymes of fish (finfish and shellfish); status and prospects: A mini review. Comp. Biochem. Physiol. B Biochem. Mol. Biol. 2022, 257, 110653. [Google Scholar] [CrossRef]
- Solovyev, M.; Kashinskaya, E.; Gisbert, E. A meta-analysis for assessing the contributions of trypsin and chymotrypsin as the two major endoproteases in protein hydrolysis in fish intestine. Comp. Biochem. Physiol. A Mol. Integr. Physiol. 2023, 278, 111372. [Google Scholar] [CrossRef]
- Soltani, M.; Badzohreh, G.; Mirzargar, S.; Farhangi, M.; Shekarabi, P.H.; Lymbery, A. Growth Behavior and Fatty Acid Production of Probiotics, Pediococcus acidilactici and Lactococcus lactis, at Different Concentrations of Fructooligosaccharide: Studies Validating Clinical Efficacy of Selected Synbiotics on Growth Performance of Caspian Roach (Rutilus frisii kutum) Fry. Probiotics Antimicrob. Proteins 2019, 11, 765–773. [Google Scholar]
- Tian, L.; Zhou, X.Q.; Jiang, W.D.; Liu, Y.; Wu, P.; Jiang, J.; Kuang, S.Y.; Tang, L.; Tang, W.N.; Zhang, Y.A.; et al. Sodium butyrate improved intestinal immune function associated with NF-κB and p38MAPK signalling pathways in young grass carp (Ctenopharyngodon idella). Fish Shellfish Immunol. 2017, 66, 548–563. [Google Scholar] [CrossRef]
- Peng, D.; Liang, X.F.; Wang, Y.; Tang, S. Introduction of Artemia nauplii during Chinese perch (Siniperca chuatsi) first feeding: Effects on larvae growth, survival, gene expression and activity of critical digestive enzymes. Aquaculture 2023, 573, 739619. [Google Scholar] [CrossRef]
- Wang, S.; Cai, M.; Wang, Y.; Zhong, L.; Hu, Y.; Fu, G. Dietary Clostridium butyricum metabolites mitigated the disturbances in growth, immune response and gut health status of Ctenopharyngodon idella subjected to high cottonseed and rapeseed meal diet. Fish Shellfish Immunol. 2024, 154, 109934. [Google Scholar] [CrossRef]
- Liu, C.H.; Chiu, C.H.; Wang, S.W.; Cheng, W. Dietary administration of the probiotic, Bacillus subtilis E20, enhances the growth, innate immune responses, and disease resistance of the grouper, Epinephelus coioides. Fish Shellfish Immunol. 2012, 33, 699–706. [Google Scholar] [CrossRef]
- Li, C.; Ren, Y.; Jiang, S.; Zhou, S.; Zhao, J.; Wang, R.; Li, Y. Effects of dietary supplementation of four strains of lactic acid bacteria on growth, immune-related response and genes expression of the juvenile sea cucumber Apostichopus japonicus Selenka. Fish Shellfish Immunol. 2018, 74, 69–75. [Google Scholar] [CrossRef]
- Huang, L.; Shui, X.; Wang, H.; Qiu, H.; Tao, C.; Yin, H.; Wang, P. Effects of Bacillus halophilus on growth, intestinal flora and metabolism of Larimichthys crocea. Biochem. Biophys. Rep. 2023, 35, 101546. [Google Scholar] [CrossRef] [PubMed]
- Li, Z.; Bao, N.; Ren, T.; Han, Y.; Jiang, Z.; Bai, Z.; Hu, Y.; Ding, J. The effect of a multi-strain probiotic on growth performance, non-specific immune response, and intestinal health of juvenile turbot, Scophthalmus maximus L. Fish Physiol. Biochem. 2019, 45, 1393–1407. [Google Scholar] [CrossRef] [PubMed]
- Xia, Y.; Lu, M.; Chen, G.; Cao, J.; Gao, F.; Wang, M.; Liu, Z.; Zhang, D.; Zhu, H.; Yi, M. Effects of dietary Lactobacillus rhamnosus JCM1136 and Lactococcus lactis subsp. lactis JCM5805 on the growth, intestinal microbiota, morphology, immune response and disease resistance of juvenile Nile tilapia, Oreochromis niloticus. Fish Shellfish Immunol. 2018, 76, 368–379. [Google Scholar] [CrossRef] [PubMed]
- Xu, C.; Zhong, X.Q.; Li, X.F.; Shi, H.J.; Liu, W.B. Regulation of growth, intestinal microflora composition and expression of immune-related genes by dietary supplementation of Streptococcus faecalis in blunt snout bream (Megalobrama amblycephala). Fish Shellfish Immunol. 2020, 105, 195–202. [Google Scholar] [CrossRef]
- Lee, S.; Katya, K.; Park, Y.; Won, S.; Seong, M.; Bai, S.C. Comparative evaluation of dietary probiotics Bacillus subtilis WB60 and Lactobacillus plantarum KCTC3928 on the growth performance, immunological parameters, gut morphology and disease resistance in Japanese eel. Anguilla japonica. Fish Shellfish Immunol. 2017, 61, 201–210. [Google Scholar] [CrossRef]
- Yin, Z.; Liu, Q.; Liu, Y.; Gao, S.; He, Y.; Yao, C.; Huang, W.; Gong, Y.; Mai, K.; Ai, Q. Early life intervention using probiotic Clostridium butyricum improves intestinal development, immune response, and gut microbiota in large yellow croaker (Larimichthys crocea) larvae. Front. Immunol. 2021, 12, 640767. [Google Scholar] [CrossRef]
- Li, P.; Hou, D.; Zhao, H.; Wang, H.; Peng, K.; Cao, J. Dietary Clostridium butyricum improves growth performance and resistance to ammonia stress in yellow catfish (Pelteobagrus fulvidraco). Aquac. Nutr. 2022, 2022, 6965174. [Google Scholar] [CrossRef]
- Li, P.; Chen, X.; Hou, D.; Chen, B.; Peng, K.; Huang, W.; Cao, J.; Zhao, H. Positive effects of dietary Clostridium butyricum supplementation on growth performance, antioxidant capacity, immunity and viability against hypoxic stress in largemouth bass. Front. Immunol. 2023, 14, 1190592. [Google Scholar] [CrossRef]
- Sun, X.; Xu, H.; Song, Y.; Long, J.; Yan, C.; Qi, X.; Wang, L.; Jin, Y.; Liu, H. Effect of host-derived Enterococcus faecium L6 on growth performance, intestinal health and antibacterial activities of juvenile grass carp. Aquaculture 2025, 596, 741879. [Google Scholar] [CrossRef]
- Zhang, M.; Dong, B.; Lai, X.; Chen, Z.; Hou, L.; Shu, R.; Huang, Y.; Shu, H. Effects of Clostridium butyricum on growth, digestive enzyme activity, antioxidant capacity and gut microbiota in farmed tilapia (Oreochromis niloticus). Aquac. Res. 2021, 52, 1573–1584. [Google Scholar] [CrossRef]
- Zaineldin, A.I.; Hegazi, S.; Koshio, S.; Ishikawa, M.; Bakr, A.; El-Keredy, A.M.S.; Dawood, M.A.O.; Dossou, S.; Wang, W.; Yukun, Z. Bacillus subtilis as probiotic candidate for red sea bream: Growth performance, oxidative status, and immune response traits. Fish Shellfish Immunol. 2018, 79, 303–312. [Google Scholar] [CrossRef]
- Liaqat, R.; Fatima, S.; Komal, W.; Minahal, Q.; Kanwal, Z.; Suleman, M.; Carter, C.G. Effects of Bacillus subtilis as a single strain probiotic on growth, disease resistance and immune response of striped catfish (Pangasius hypophthalmus). PLoS ONE 2024, 19, e0294949. [Google Scholar] [CrossRef]
- Li, Y.; Yang, Y.; Song, L.; Wang, J.; Hu, Y.; Yang, Q.; Cheng, P.; Li, J. Effects of dietary supplementation of Lactobacillus plantarum and Bacillus subtilis on growth performance, survival, immune response, antioxidant capacity and digestive enzyme activity in olive flounder (Paralichthys olivaceus). Aquac. Fish. 2021, 6, 283–288. [Google Scholar] [CrossRef]
- Park, Y.; Moniruzzaman, M.; Lee, S.; Hong, J.; Won, S.; Lee, J.M.; Yun, H.; Kim, K.W.; Ko, D.; Bai, S.C. Comparison of the effects of dietary single and multi-probiotics on growth, non-specific immune responses and disease resistance in starry flounder, Platichthys stellatus. Fish Shellfish Immunol. 2016, 59, 351–357. [Google Scholar] [CrossRef] [PubMed]
- Xue, J.; Shen, K.; Hu, Y.; Hu, Y.; Kumar, V.; Yang, G.; Wen, C. Effects of dietary Bacillus cereus, B. subtilis, Paracoccus marcusii, and Lactobacillus plantarum supplementation on the growth, immune response, antioxidant capacity, and intestinal health of juvenile grass carp (Ctenopharyngodon idellus). Aquac. Rep. 2020, 17, 100387. [Google Scholar] [CrossRef]
- Neissi, A.; Heidarieh, M.; Shahhosseini, G.; Zahed, H.M.; Kalantari-Hesari, A. Improvement of the immunological and antioxidant capacity of rainbow trout (Oncorhynchus mykiss) by using the paraprobiotic Bacillus subtilis subsp. spizizenii. Aquac. Rep. 2024, 38, 102304. [Google Scholar] [CrossRef]
- Akter, T.; Haque, M.N.; Ehsan, R.; Paul, S.I.; Foysal, M.J.; Tay, A.C.Y.; Islam, M.T.; Rahman, M.M. Virulence and antibiotic-resistance genes in Enterococcus faecalis associated with streptococcosis disease in fish. Sci. Rep. 2023, 13, 1551. [Google Scholar] [CrossRef]
- Su, Q.; Peng, X.; Zhang, Z.; Xiong, Z.; He, B.; Chu, P.; Zhu, C. Isolation, characterization of Bacillus subtilis and Bacillus amyloliquefaciens and validation of the potential probiotic efficacy on growth, immunity, and gut microbiota in hybrid sturgeon (Acipenser baerii ♀ × Acipenser schrenckii ♂). Fish Shellfish Immunol. 2025, 157, 110081. [Google Scholar] [CrossRef]
- Ji, Z.; Zhu, C.; Zhu, X.; Ban, S.; Yu, L.; Tian, J.; Dong, L.; Wen, H.; Lu, X.; Jiang, M. Dietary host-associated Bacillus subtilis supplementation improves intestinal microbiota, health and disease resistance in Chinese perch (Siniperca chuatsi). Anim. Nutr. 2023, 13, 197–205. [Google Scholar] [CrossRef]
- Meng, X.; Wu, S.; Hu, W.; Zhu, Z.; Yang, G.; Zhang, Y.; Qin, C.; Yang, L.; Nie, G. Clostridium butyricum improves immune responses and remodels the intestinal microbiota of common carp (Cyprinus carpio L.). Aquaculture 2021, 530, 735753. [Google Scholar] [CrossRef]
- Ji, C.; Zhang, J.; Lin, X.; Han, J.; Dong, X.; Yang, S.; Yan, X.; Zhu, B. Metaproteomic analysis of microbiota in the fermented fish, Siniperca chuatsi. LWT 2017, 80, 479–484. [Google Scholar] [CrossRef]
- Ni, J.; Yan, Q.; Yu, Y.; Zhang, T. Factors influencing the grass carp gut microbiome and its effect on metabolism. FEMS Microbiol. Ecol. 2014, 87, 704–714. [Google Scholar] [CrossRef]
- Shin, N.R.; Whon, T.W.; Bae, J.W. Proteobacteria: Microbial signature of dysbiosis in gut microbiota. Trends Biotechnol. 2015, 33, 496–503. [Google Scholar] [CrossRef]
- Deusch, S.; Camarinha-Silva, A.; Conrad, J.; Beifuss, U.; Rodehutscord, M.; Seifert, J. A structural and functional elucidation of the rumen microbiome influenced by various diets and microenvironments. Front. Microbiol. 2017, 8, 1605. [Google Scholar] [CrossRef]
- Ding, X.Y.; Wei, C.Y.; Liu, Z.Y.; Yang, H.L.; Han, F.; Sun, Y.Z. Autochthonous Bacillus subtilis and Enterococcus faecalis improved liver health, immune response, mucosal microbiota and red-head disease resistance of yellow drum (Nibea albiflora). Fish Shellfish Immunol. 2023, 134, 108575. [Google Scholar] [CrossRef]
- Yang, Y.; Jiang, G.; Tian, Y. Biological activities and applications of exopolysaccharides produced by lactic acid bacteria: A mini-review. World J. Microbiol. Biotechnol. 2023, 39, 155. [Google Scholar] [CrossRef] [PubMed]
- Feng, T.; Wang, J. Oxidative stress tolerance and antioxidant capacity of lactic acid bacteria as probiotic: A systematic review. Gut Microbes 2020, 12, 1801944. [Google Scholar] [CrossRef]
- Amoah, K.; Tan, B.; Zhang, S.; Chi, S.; Yang, Q.; Liu, H.; Yang, Y.; Zhang, H.; Dong, X. Host gut-derived Bacillus probiotics supplementation improves growth performance, serum and liver immunity, gut health, and resistive capacity against Vibrio harveyi infection in hybrid grouper (♀Epinephelus fuscoguttatus × ♂Epinephelus lanceolatus). Anim. Nutr. 2023, 14, 163–184. [Google Scholar] [CrossRef]
- Qi, X.; Zhang, Y.; Zhang, Y.; Luo, F.; Song, K.; Wang, G.; Ling, F. Vitamin B12 produced by Cetobacterium somerae improves host resistance against pathogen infection through strengthening the interactions within gut microbiota. Microbiome 2023, 11, 135. [Google Scholar] [CrossRef]
- Karmakar, S.; Sen Gupta, P.; Bhattacharya, S.; Sarkar, A.; Rahaman, A.; Mandal, D.P.; Bhattacharjee, S. Vitamin B12 alleviates malathion-induced toxicity in zebra fish by regulating cytochrome P450 and PgP expressions. Toxicol. Mech. Methods 2023, 33, 364–377. [Google Scholar] [CrossRef] [PubMed]

Disclaimer/Publisher’s Note: The statements, opinions and data contained in all publications are solely those of the individual author(s) and contributor(s) and not of MDPI and/or the editor(s). MDPI and/or the editor(s) disclaim responsibility for any injury to people or property resulting from any ideas, methods, instructions or products referred to in the content. |
© 2025 by the authors. Licensee MDPI, Basel, Switzerland. This article is an open access article distributed under the terms and conditions of the Creative Commons Attribution (CC BY) license (https://creativecommons.org/licenses/by/4.0/).