


Influence of Inhibitors Generated in Lignocellulosic Hydrolysates from Group of Acids on the Growth of Strains TG1 and Tuner of Escherichia coli


 , ,
, ,  , and
, and 
Abstract
1. Introduction
2. Materials and Methods
2.1. Microorganisms and Inocula Preparation
2.2. Preparation of SelecTEcoli’s Mineral Media (SMM)
2.3. Fermentation
2.4. Analysis
2.5. Calculations
2.6. Statistical Analysis
3. Results and Discussion
3.1. Growth Evaluation
3.1.1. TG1 Strain
3.1.2. Tuner Strain
3.2. Sugar Consumption
3.3. Biomass Yield
3.4. Generation of Products
3.4.1. Studies with Acetic Acid Inhibitor (AI)
3.4.2. Studies with Formic Acid Inhibitor (FI)
4. Conclusions
Author Contributions
Funding
Institutional Review Board Statement
Informed Consent Statement
Data Availability Statement
Acknowledgments
Conflicts of Interest
References
- Rubin, E.M. Genomics of cellulosic biofuels. Nature 2008, 454, 841–845. [Google Scholar] [CrossRef] [PubMed]
- Binod, P.; Sindhu, R.; Singhania, R.R.; Vikram, S.; Devi, L.; Nagalakshmi, S.; Kurien, N.; Sukumaran, R.K.; Pandey, A. Bioethanol production from rice straw: An overview. Bioresour. Technol. 2010, 101, 4767–4774. [Google Scholar] [CrossRef] [PubMed]
- Fernandes, M.C.; Ferro, M.D.; Paulino, A.F.C.; Mendes, J.A.S.; Gravitis, J.; Evtuguin, D.V.; Xavier, A.M.R.B. Enzymatic sac-charification and bioethanol production from Cynara cardunculus pretreated by steam explosion. Bioresour. Technol. 2015, 186, 309–315. [Google Scholar] [CrossRef] [PubMed]
- Brosowski, A.; Krause, T.; Mantau, U.; Mahro, B.; Noke, A.; Richter, F.; Raussen, T.; Bischof, R.; Hering, T.; Blanke, C.; et al. How to measure the impact of biogenic residues, wastes and by-products: Development of a national re-source monitoring based on the example of Germany. Biomass Bioenergy 2019, 127, 105275. [Google Scholar] [CrossRef]
- Zhang, Y.-H.P. Reviving the carbohydrate economy via multi-product lignocellulose biorefineries. J. Ind. Microbiol. Biotechnol. 2008, 35, 367–375. [Google Scholar] [CrossRef]
- Antar, M.; Lyu, D.; Nazari, M.; Shah, A.; Zhou, X.; Smith, D.L. Biomass for a sustainable bioeconomy: An overview of world biomass production and utilization. Renew. Sustain. Energy Rev. 2021, 139, 110691. [Google Scholar] [CrossRef]
- Carvalheiro, F.; Duarte, L.C.; Gírio, F.M. Hemicellulose biorefineries: A review on biomass pretreatments. J. Sci. Ind. Res. 2008, 67, 849–864. [Google Scholar]
- Fernandes, M.C.; Torrado, I.; Carvalheiro, F.; Dores, V.; Guerra, V.; Lourenço, P.M.L.; Duarte, L.C. Bioethanol production from extracted olive pomace: Dilute acid hydrolysis. Bioethanol 2016, 2, 103–111. [Google Scholar] [CrossRef]
- Ferro, M.D.; Fernandes, M.C.; Paulino, A.F.; Prozil, S.O.; Gravitis, J.; Evtuguin, D.V.; Xavier, A.M. Bioethanol production from steam explosion pretreated and alkali extracted Cistus ladanifer (rockrose). Biochem. Eng. J. 2015, 104, 98–105. [Google Scholar] [CrossRef]
- Gírio, F.M.; Carvalheiro, F.; Duarte, L.C.B.-L.R. Deconstruction of the Hemicellulose Fraction from Lignocellulosic Materials into Simple Sugars; D-Xylitol—Fermentative Production, Application and Commercialization; Springer: Berlin/Heidelberg, Germany, 2012; pp. 3–37. [Google Scholar]
- Lopes da Silva, T.; Marques, S.; Alves, L.; Roseiro, J.C. The simultaneous utilization of kinetic analysis and flow cytometry in the assessment of Lactobacillus rhamnosus ATCC 7469 physiological states produced by increasing oxygen limitation levels and lactic acid accumulation. Biochem. Eng. J. 2013, 74, 54–59. [Google Scholar] [CrossRef]
- Wu, Y.; Shen, X.; Yuan, Q.; Yan, Y. Metabolic Engineering Strategies for Co-Utilization of Carbon Sources in Microbes. Bioengineering 2016, 3, 10. [Google Scholar] [CrossRef] [PubMed]
- Günerken, E.; D’Hondt, E.; Eppink, M.; Garcia-Gonzalez, L.; Elst, K.; Wijffels, R. Cell disruption for microalgae biorefineries. Biotechnol. Adv. 2015, 33, 243–260. [Google Scholar] [CrossRef] [PubMed]
- Dixon, C.; Wilken, L.R. Green microalgae biomolecule separations and recovery. Bioresour. Bioprocess. 2018, 5, 14. [Google Scholar] [CrossRef]
- Hu, F.; Ragauskas, A. Pretreatment and Lignocellulosic Chemistry. BioEnergy Res. 2012, 5, 1043–1066. [Google Scholar] [CrossRef]
- Kim, D. Physico-chemical conversion of lignocellulose: Inhibitor effects and detoxification strategies: A mini review. Molecules 2018, 23, 309. [Google Scholar] [CrossRef]
- Kumar, R.; Singh, S.; Singh, O.V. Bioconversion of lignocellulosic biomass: Biochemical and molecular perspectives. J. Ind. Microbiol. Biotechnol. 2008, 35, 377–391. [Google Scholar] [CrossRef]
- Perez-Pimienta, J.A.; Poggi-Varaldo, H.M.; Ponce-Noyola, T.; Ramos-Valdivia, A.C.; Chavez-Carvayar, J.A.; Stavila, V.; Simmons, B.A. Fractional pretreatment of raw and calcium oxalate-extracted agave bagasse using ionic liquid and alkaline hydrogen peroxide. Biomass Bioenergy 2016, 91, 48–55. [Google Scholar] [CrossRef]
- Martin, C.; Alriksson, B.; Sjöde, A.; Nilvebrant, N.-O.; Jönsson, L.J. Dilute sulfuric acid pretreatment of agricultural and agro-industrial residues for ethanol production. Appl. Biochem. Biotechnol. 2007, 137–140, 339–352. [Google Scholar] [CrossRef]
- Zabed, H.M.; Akter, S.; Yun, J.; Zhang, G.; Awad, F.N.; Qi, X.; Sahu, J. Recent advances in biological pretreatment of microalgae and lignocellulosic biomass for biofuel production. Renew. Sustain. Energy Rev. 2019, 105, 105–128. [Google Scholar] [CrossRef]
- Walter, A.; Gutknecht, J. Monocarboxylic acid permeation through lipid bilayer membranes. J. Membr. Biol. 1984, 77, 255–264. [Google Scholar] [CrossRef]
- García-Aparicio, M.P.; Ballesteros, I.; González, A.; Oliva, J.M.; Ballesteros, M.; Negro, M.J. Effect of inhibitors released during steam-explosion pretreatment of barley straw on enzymatic hydrolysis. Appl. Biochem. Biotechnol. 2006, 129, 278–288. [Google Scholar] [CrossRef] [PubMed]
- Zaldivar, J.; Ingram, L.O. Effect of organic acids on the growth and fermentation of ethanologenic Escherichia coli LY01. Biotechnol. Bioeng. 1999, 66, 203–210. [Google Scholar] [CrossRef]
- Jönsson, L.J.; Alriksson, B.; Nilvebrant, N.-O. Bioconversion of lignocellulose: Inhibitors and detoxification. Biotechnol. Biofuels 2013, 6, 16. [Google Scholar] [CrossRef] [PubMed]
- Jönsson, L.J.; Martín, C. Pretreatment of lignocellulose: Formation of inhibitory by-products and strategies for minimizing their effects. Bioresour. Technol. 2016, 199, 103–112. [Google Scholar] [CrossRef]
- Kumar, G.; Cheon, H.-C.; Kim, S.-H. Effects of 5-hydromethylfurfural, levulinic acid and formic acid, pretreatment byproducts of biomass, on fermentative H2 production from glucose and galactose. Int. J. Hydrogen Energy 2014, 39, 16885–16890. [Google Scholar] [CrossRef]
- Monlau, F.; Sambusiti, C.; Barakat, A.; Quéméneur, M.; Trably, E.; Steyer, J.-P.; Carrère, H. Do furanic and phenolic compounds of lignocellulosic and algae biomass hydrolyzate inhibit anaerobic mixed cultures? A comprehensive review. Biotechnol. Adv. 2014, 32, 934–951. [Google Scholar] [CrossRef]
- Orencio-Trejo, M.; Flores, N.; Escalante, A.; Hernández-Chávez, G.; Bolívar, F.; Gosset, G.; Martinez, A. Metabolic regulation analysis of an ethanologenic Escherichia coli strain based on RT-PCR and enzymatic activities. Biotechnol. Biofuels 2008, 1, 8. [Google Scholar] [CrossRef]
- Ingram, L.O.; Aldrich, H.C.; Borges, A.C.C.; Causey, T.B.; Martinez, A.; Morales, F.; Saleh, A.; Underwood, S.A.; Yomano, L.P.; York, S.W.; et al. Enteric bacterial catalysts for fuel ethanol production. Biotechnol. Prog. 1999, 15, 855–866. [Google Scholar] [CrossRef]
- Vinuselvi, P.; Kim, M.-K.; Lee, S.-K.; Ghim, C.-M. Rewiring carbon catabolite repression for microbial cell factory. BMB Rep. 2012, 45, 59–70. [Google Scholar] [CrossRef]
- Fernández-Sandoval, M.T.; Huerta-Beristain, G.; Trujillo-Martinez, B.; Bustos, P.; González, V.; Bolivar, F.; Gosset, G.; Martinez, A. Laboratory metabolic evolution improves acetate tolerance and growth on acetate of ethanologenic Escherichia coli under non-aerated conditions in glucose-mineral medium. Appl. Microbiol. Biotechnol. 2012, 96, 1291–1300. [Google Scholar] [CrossRef]
- Klinke, H.B.; Thomsen, A.B.; Ahring, B.K. Inhibition of ethanol-producing yeast and bacteria by degradation products produced during pre-treatment of biomass. Appl. Microbiol. Biotechnol. 2004, 66, 10–26. [Google Scholar] [CrossRef] [PubMed]
- Nicolaou, S.A.; Gaida, S.M.; Papoutsakis, E.T. A comparative view of metabolite and substrate stress and tolerance in microbial bioprocessing: From biofuels and chemicals, to biocatalysis and bioremediation. Metab. Eng. 2010, 12, 307–331. [Google Scholar] [CrossRef] [PubMed]
- Li, Z.; Huang, Z.; Gu, P. Response of Escherichia coli to Acid Stress: Mechanisms and Applications—A Narrative Review. Microorganisms 2024, 12, 1774. [Google Scholar] [CrossRef]
- Zhang, Z.; Chu, R.; Wei, W.; Song, W.; Ye, C.; Chen, X.; Wu, J.; Liu, L.; Gao, C. Systems engineering of Escherichia coli for high-level glutarate production from glucose. Nat. Commun. 2024, 15, 1032. [Google Scholar] [CrossRef] [PubMed]
- Elbing, K.; Brent, R. Media Preparation and Bacteriological Tools. Curr. Protoc. Mol. Biol. 2002, 59. [Google Scholar] [CrossRef]
- Martinez, A.; Grabar, T.B.; Shanmugam, K.T.; Yomano, L.P.; York, S.W.; Ingram, L.O. Low salt medium for lactate and ethanol production by recombinant Escherichia coli B. Biotechnol. Lett. 2006, 29, 397–404. [Google Scholar] [CrossRef]
- Shadomy, S.; Espinel Ingroff, A. Susceptibility Testing with Antifungal Drugs. In Manual of Clinical Microbiology, 3rd ed.; Lennete, E.H., Balos, A., Hausler, W.J., Jr., Eds.; American Society for Microbiology: Washington, DC, USA, 1980; pp. 647–653. [Google Scholar]
- Veríssimo, A.; Morais, P. MICROBIOLOGIA—Medição do Crescimento de E. Coli. Departamento de Zoologia da Universidade de Coimbra. pp. 1-5. Available online: https://silo.tips/download/departamento-de-zoologia-da-universidade-de-coimbra-8 (accessed on 2 December 2024).
- Alves-Ferreira, J.; Carvalheiro, F.; Duarte, L.C.; Ferreira, A.R.; Martinez, A.; Pereira, H.; Fernandes, M. D-Lactic acid production from Cistus ladanifer residues: Co-fermentation of pentoses and hexoses by Escherichia coli JU15. Ind. Crops Prod. 2022, 177, 114519. [Google Scholar] [CrossRef]
- Parra-Ramírez, D.; Martinez, A.; Cardona, C.A. Technical and economic potential evaluation of the strain Escherichia coli MS04 in the ethanol production from glucose and xylose. Biochem. Eng. J. 2018, 140, 123–129. [Google Scholar] [CrossRef]
- Utrilla, J.; Vargas-Tah, A.; Trujillo-Martínez, B.; Gosset, G.; Martinez, A. Production of D-lactate from sugarcane bagasse and corn stover hydrolysates using metabolic engineered Escherichia coli strains. Bioresour. Technol. 2016, 220, 208–214. [Google Scholar] [CrossRef]
- Utrilla, J.; Licona-Cassani, C.; Marcellin, E.; Gosset, G.; Nielsen, L.K.; Martinez, A. Engineering and adaptive evolution of Escherichia coli for d-lactate fermentation reveals GatC as a xylose transporter. Metab. Eng. 2012, 14, 469–476. [Google Scholar] [CrossRef]
- Dos Santos, J.L.C.; Fernandes, M.; Lourenço, P.; Duarte, L.; Carvalheiro, F.; Crespo, J. Removal of inhibitory compounds from olive stone auto-hydrolysis liquors by nanofiltration. Desalination Water Treat. 2011, 27, 90–96. [Google Scholar] [CrossRef]
- Laopaiboon, P.; Thani, A.; Leelavatcharamas, V.; Laopaiboon, L. Acid hydrolysis of sugarcane bagasse for lactic acid production. Bioresour. Technol. 2010, 101, 1036–1043. [Google Scholar] [CrossRef] [PubMed]
- Parajó, J.C.; Domínguez, H.; Domínguez, J. Biotechnological production of xylitol. Part 3: Operation in culture media made from lignocellulose hydrolysates. Bioresour. Technol. 1998, 66, 25–40. [Google Scholar] [CrossRef]
- Tucker, M.P.; Farmer, J.D.; Keller, F.A.; Schell, D.J.; Nguyan, Q.A. Comparison of yellow poplar pretreatment between NREL digester and sunds hydrolyzer. Appl. Biochem. Biotechnol. 1998, 70–72, 25–35. [Google Scholar] [CrossRef]
- Luli, G.W.; Strohl, W.R. Comparison of growth, acetate production, and acetate inhibition of Escherichia coli strains in batch and fed-batch fermentations. Appl. Environ. Microbiol. 1990, 56, 1004–1011. [Google Scholar] [CrossRef]
- Roe, A.J.; McLaggan, D.; Davidson, I.; O’byrne, C.; Booth, I.R. Perturbation of anion balance during inhibition of growth of Escherichia coli by weak acids. J. Bacteriol. 1998, 180, 767–772. [Google Scholar] [CrossRef]
- Fenske, J.J.; Griffin, D.A.; Penner, M.H. Comparison of aromatic monomers in lignocellulosic biomass prehydrolysates. J. Ind. Microbiol. Biotechnol. 1998, 20, 364–368. [Google Scholar] [CrossRef]
- Dien, B.S.; Cotta, M.A.; Jeffries, T.W. Bacteria engineered for fuel ethanol production: Current status. Appl. Microbiol. Biotechnol. 2003, 63, 258–266. [Google Scholar] [CrossRef]
- Vargas-Tah, A.; Moss-Acosta, C.L.; Trujillo-Martinez, B.; Tiessen, A.; Lozoya-Gloria, E.; Orencio-Trejo, M.; Gosset, G.; Martinez, A. Non-severe thermochemical hydrolysis of stover from white corn and sequential enzymatic saccharification and fermentation to ethanol. Bioresour. Technol. 2015, 198, 611–618. [Google Scholar] [CrossRef]
- Kazan, D.; Çamurdan, A.; Hortaçsu, A. The effect of glucose concentration on the growth rate and some intracellular components of a recombinant E. coli culture. Process. Biochem. 1995, 30, 269–273. [Google Scholar] [CrossRef]
- Parra-Ramírez, D.; Martinez, A.; Cardona, C.A. Lactic acid production from glucose and xylose using the lactogenic Escherichia coli strain JU15: Experiments and techno-economic results. Bioresour. Technol. 2018, 273, 86–92. [Google Scholar] [CrossRef] [PubMed]
- Huerta-Beristain, G.; Utrilla, J.; Hernández-Chávez, G.; Bolívar, F.; Gosset, G.; Martinez, A. Specific ethanol production rate in ethanologenic Escherichia coli Strain KO11 is limited by pyruvate decarboxylase. Microb. Physiol. 2008, 15, 55–64. [Google Scholar] [CrossRef] [PubMed]
- Duarte, L.C.; Carvalheiro, F.; Neves, I.; Girio, F.M. Effects of Aliphatic Acids, Furfural, and Phenolic Compounds on Debaryomyces hansenii CCMI 941. Appl. Biochem. Biotechnol. 2005, 121–124, 413–425. [Google Scholar] [CrossRef] [PubMed]
- Zaldivar, J.; Martinez, A.; Ingram, L.O. Effect of alcohol compounds found in hemicellulose hydrolysate on the growth and fermentation of ethanologenic Escherichia coli. Biotechnol. Bioeng. 2000, 68, 524–530. [Google Scholar] [CrossRef]
- Deniz, I.; Imamoglu, E.; Vardar-Sukan, F. Aeration-enhanced bioethanol production. Biochem. Eng. J. 2014, 92, 41–46. [Google Scholar] [CrossRef]
- Caspeta, L.; Caro-Bermúdez, M.A.; Ponce-Noyola, T.; Martinez, A. Enzymatic hydrolysis at high-solids loadings for the conversion of agave bagasse to fuel ethanol. Appl. Energy 2014, 113, 277–286. [Google Scholar] [CrossRef]
- Abdel-Rahman, M.A.; Xiao, Y.; Tashiro, Y.; Wang, Y.; Zendo, T.; Sakai, K.; Sonomoto, K. Fed-batch fermentation for enhanced lactic acid production from glucose/xylose mixture without carbon catabolite repression. J. Biosci. Bioeng. 2015, 119, 153–158. [Google Scholar] [CrossRef]
- Duarte, L.C.; Carvalheiro, F.; Lopes, S.; Marques, S.; Parajó, J.C.; Gírio, F.M. Comparison of Two Posthydrolysis Processes of Brewery’s Spent Grain Autohydrolysis Liquor to Produce a Pentose-Containing Culture Medium. Appl. Biochem. Biotechnol. 2004, 115, 1041–1058. [Google Scholar] [CrossRef]
- Rios-González, L.J.; Morales-Martínez, T.K.; Rodríguez-Flores, M.F.; la Garza, J.A.R.-D.; Castillo-Quiroz, D.; Castro-Montoya, A.J.; Martinez, A. Autohydrolysis pretreatment assessment in ethanol production from agave bagasse. Bioresour. Technol. 2017, 242, 184–190. [Google Scholar] [CrossRef]
- Abdel-Rahman, M.A.; Tashiro, Y.; Sonomoto, K. Lactic acid production from lignocellulose-derived sugars using lactic acid bacteria: Overview and limits. J. Biotechnol. 2011, 156, 286–301. [Google Scholar] [CrossRef]
 ), Xylose (●), Acetic Acid (
 ), Formic Acid (
 ), Ethanol (*).
), Xylose (●), Acetic Acid (), Formic Acid (), Ethanol (*).
), Ethanol (*).
), Xylose (●), Acetic Acid (), Formic Acid (), Ethanol (*).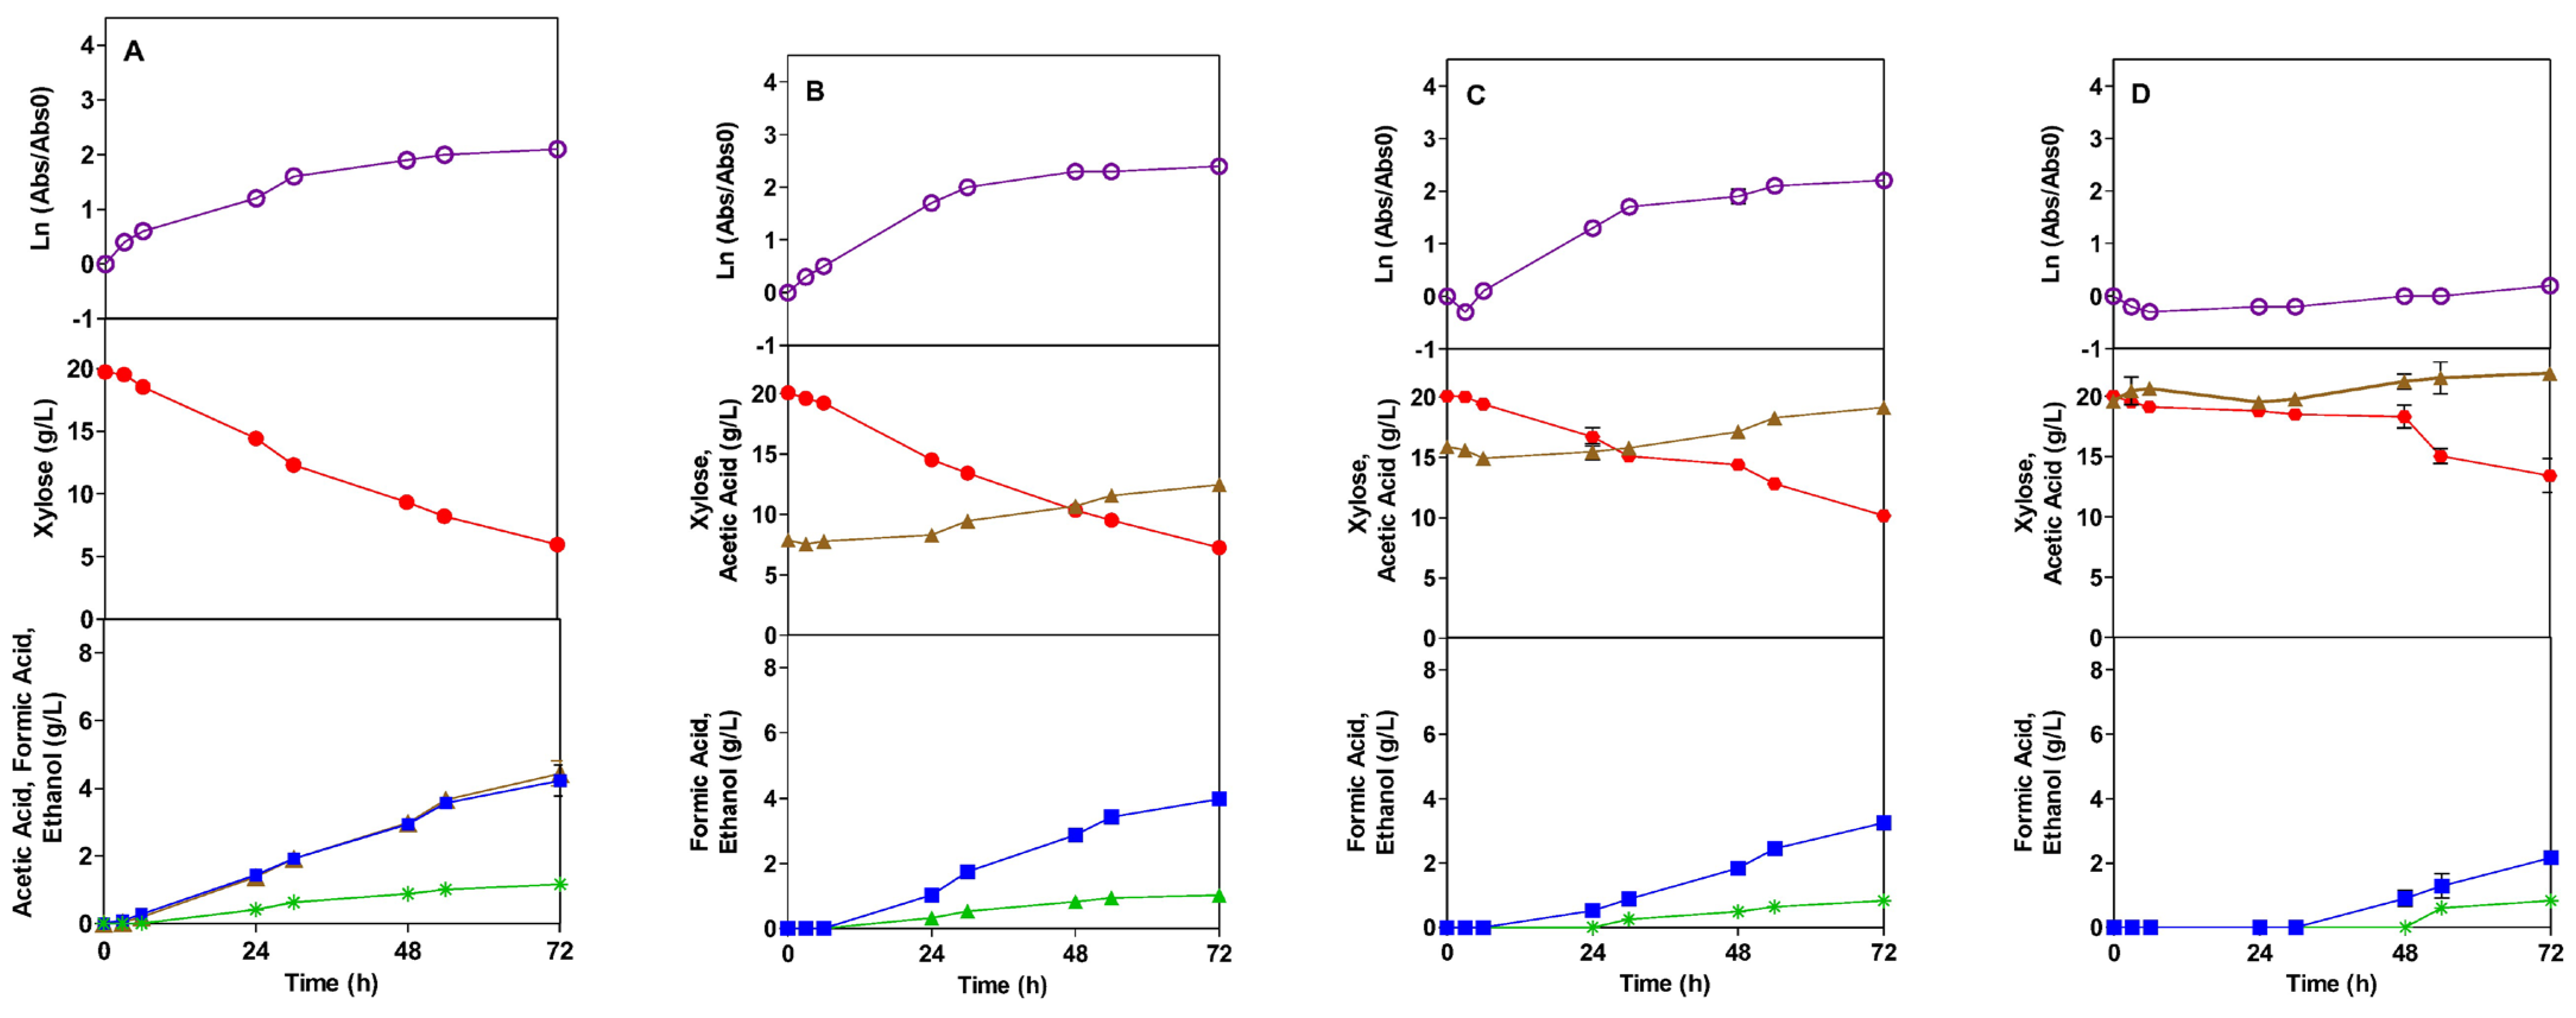
 ), Xylose (●), Acetic Acid (
 ), Formic Acid (
 ), Ethanol (*), Lactic Acid (
 ).
), Xylose (●), Acetic Acid (), Formic Acid (), Ethanol (*), Lactic Acid ().
).
), Xylose (●), Acetic Acid (), Formic Acid (), Ethanol (*), Lactic Acid ().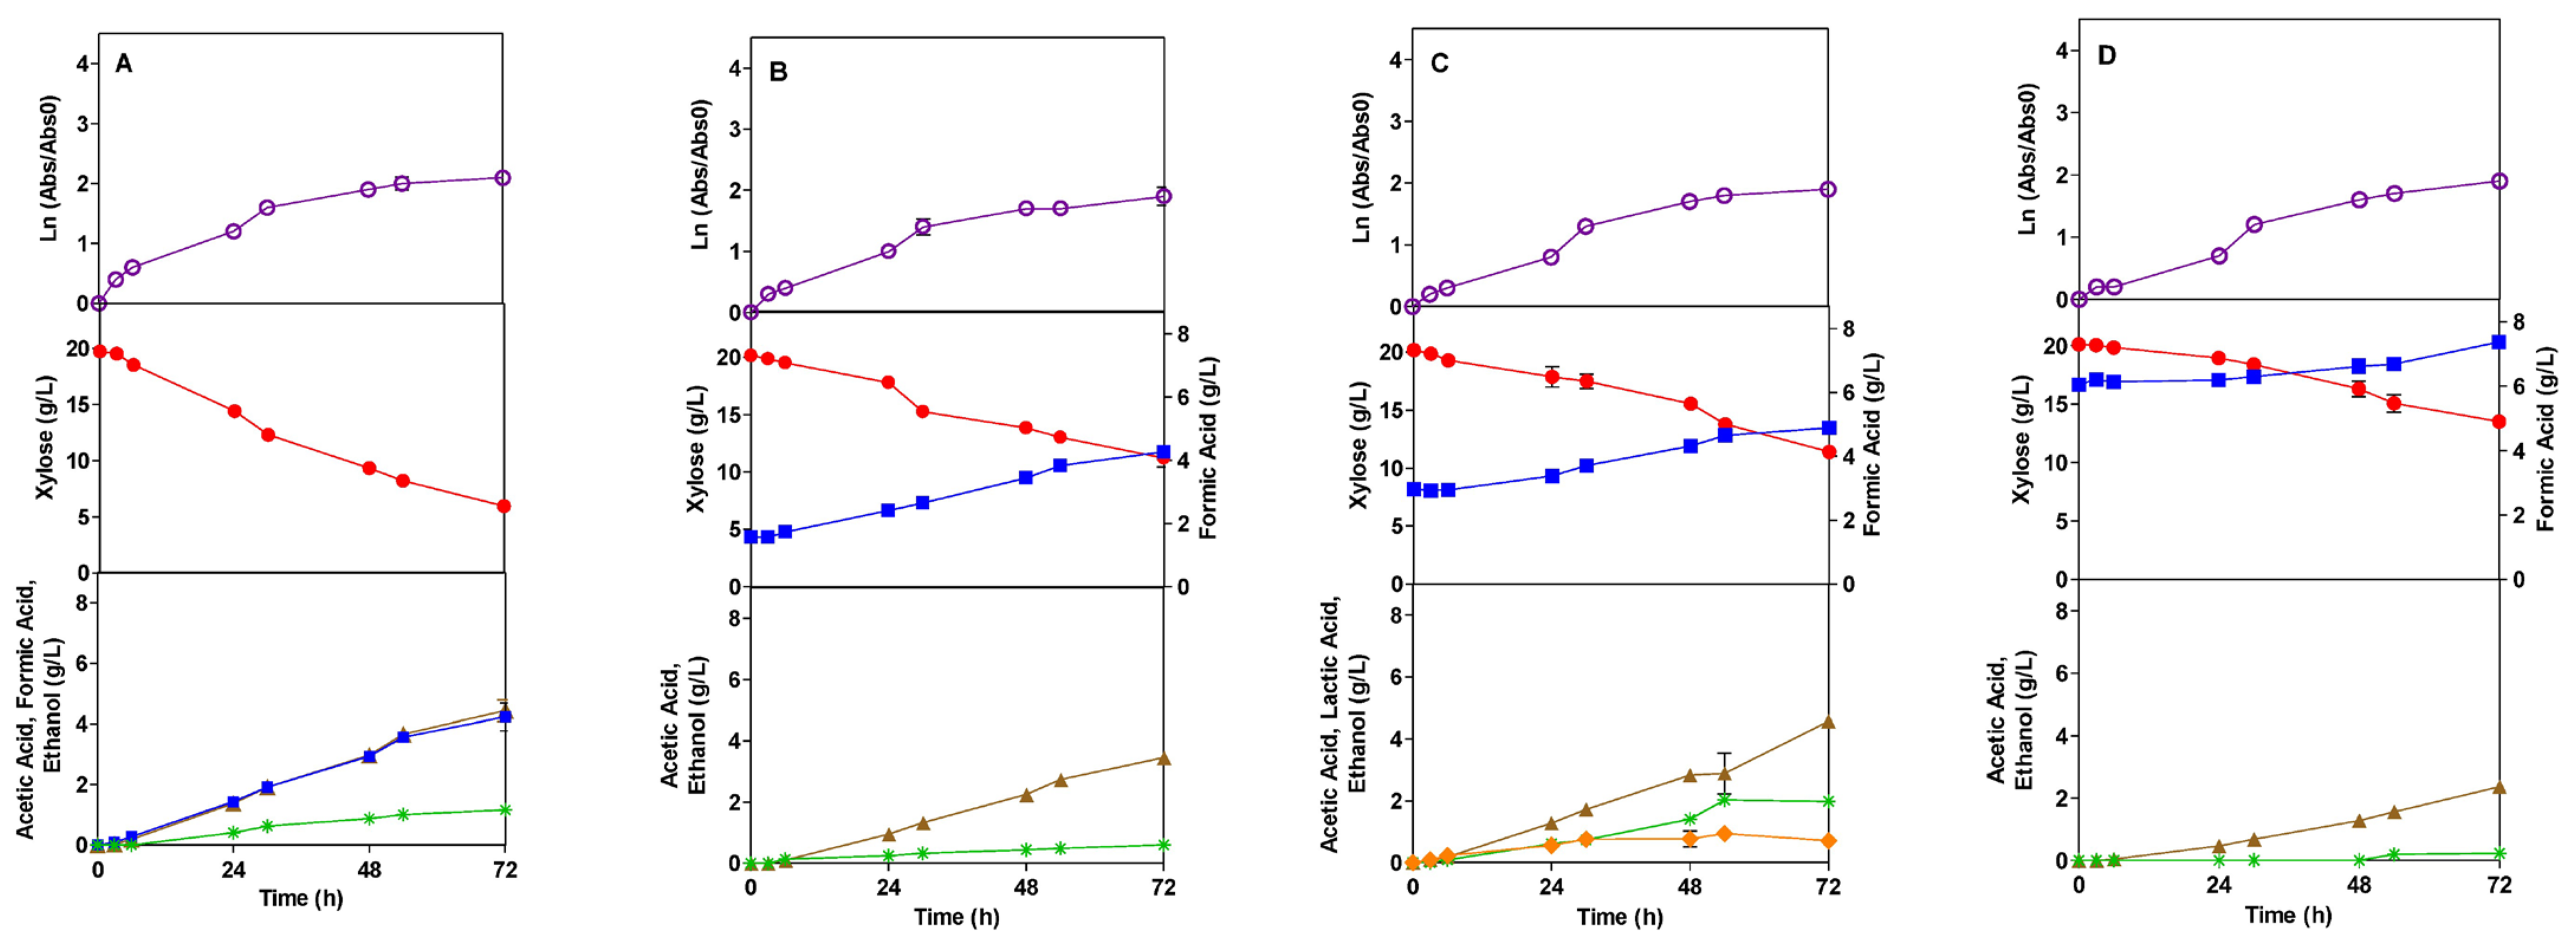
 ), Xylose (●), Acetic Acid (
 ), Formic Acid (
 ), Ethanol (*), Lactic Acid (
 ).
), Xylose (●), Acetic Acid (), Formic Acid (), Ethanol (*), Lactic Acid ().
).
), Xylose (●), Acetic Acid (), Formic Acid (), Ethanol (*), Lactic Acid ().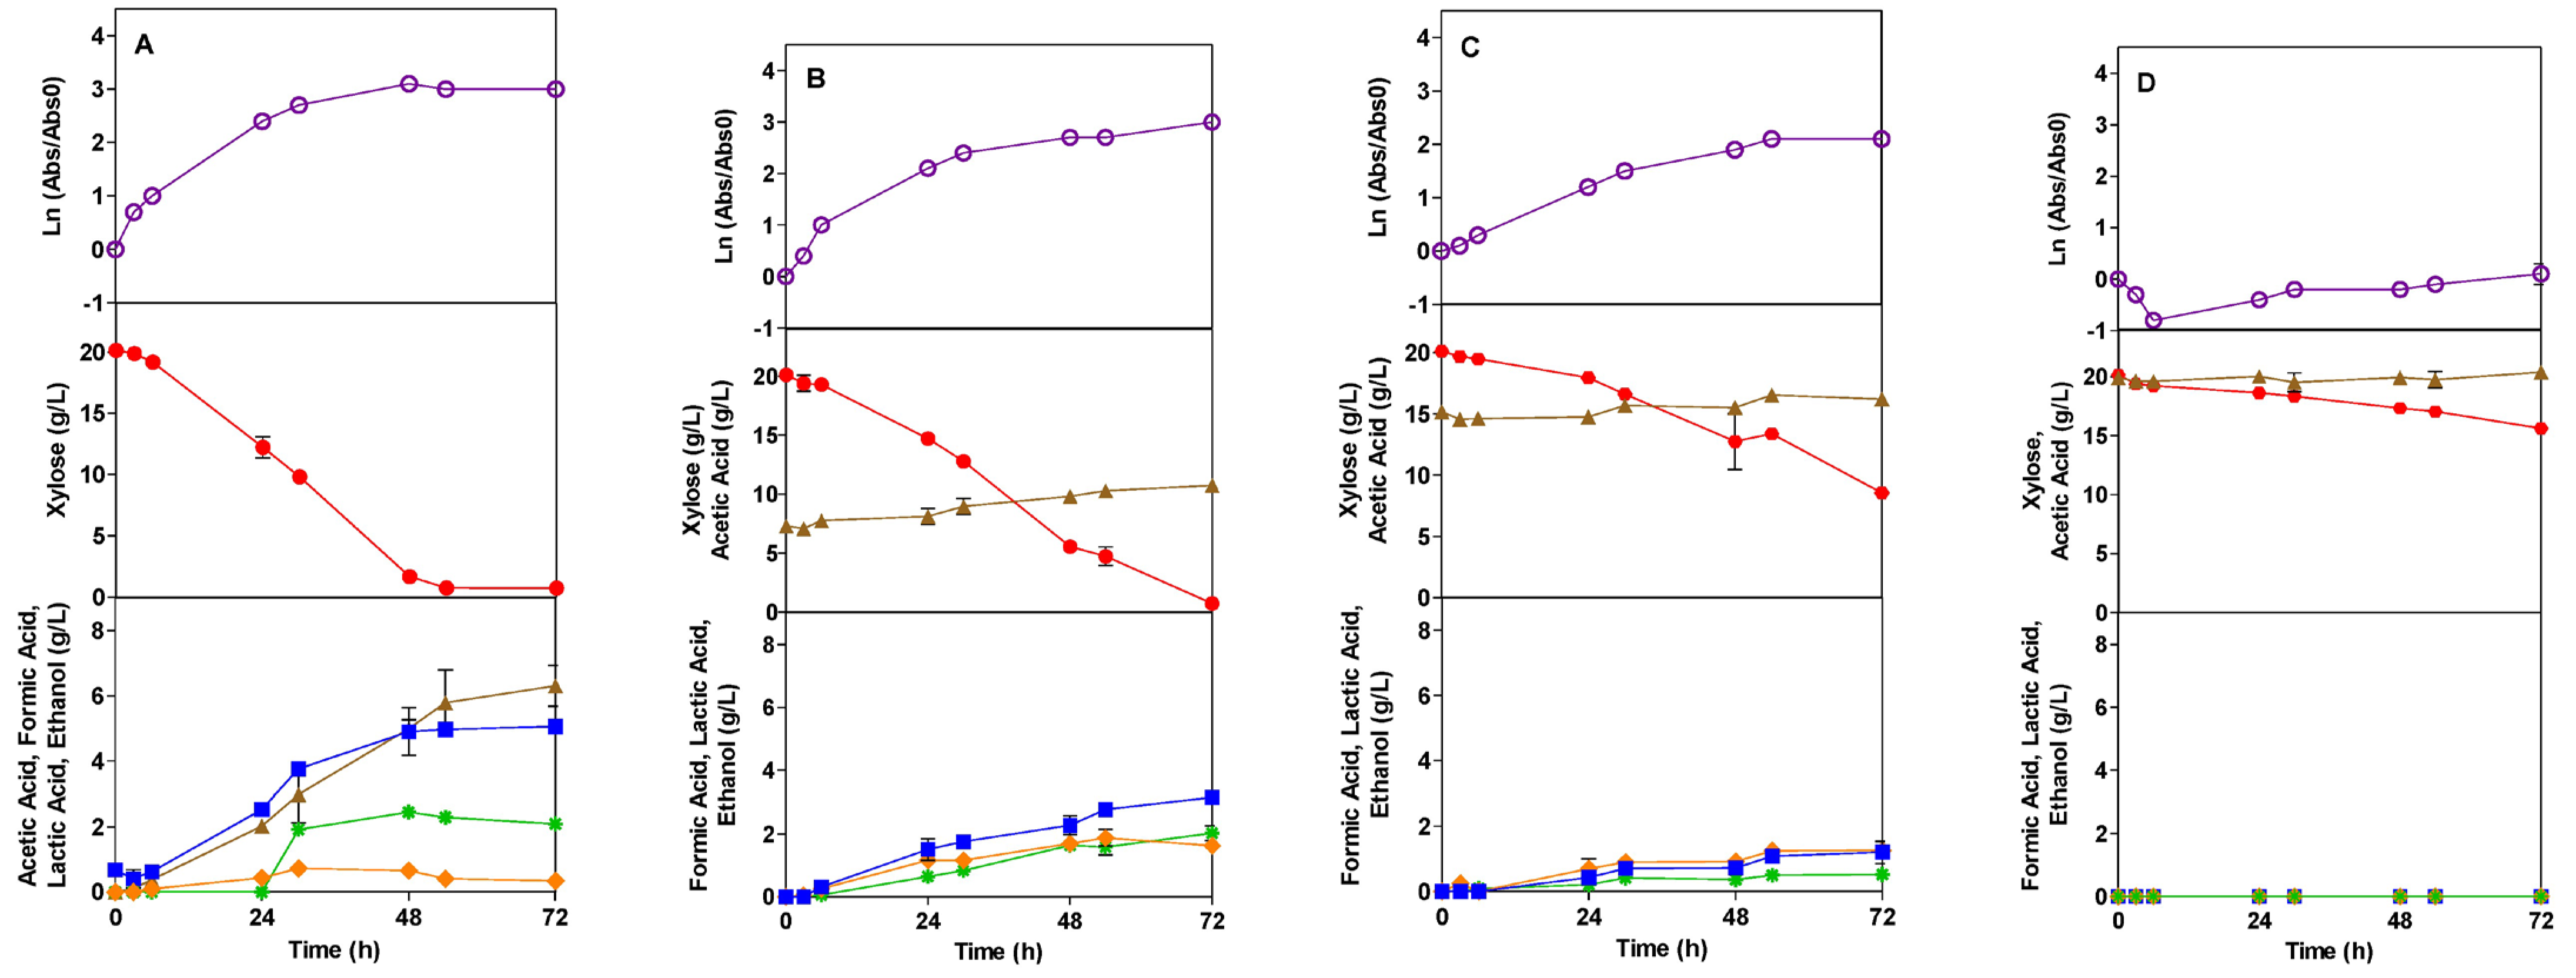
 ), Xylose (●), Acetic Acid (
 ), Formic Acid (
 ), Ethanol (*), Lactic Acid (
 ).
), Xylose (●), Acetic Acid (), Formic Acid (), Ethanol (*), Lactic Acid ().
).
), Xylose (●), Acetic Acid (), Formic Acid (), Ethanol (*), Lactic Acid ().

| Component | Formula | mM | |
|---|---|---|---|
| Xylose | C5H10O5 | 133.21 | |
| Diammonium hydrogen phosphate | (NH4)2HPO4 | 19.91 | |
| Ammonium dihydrogen phosphate | NH4H2PO4 | 7.56 | |
| Potassium dihydrogen phosphate | KH2PO4 | 28.29 | |
| Dipotassium hydrogen phosphate | K2HPO4 | 71.70 | |
| Magnesium sulfate heptahydrate | MgSO4·7H2O | 1.19 | |
| Potassium hydroxide | KOH | 0.99 | |
| Vitamin solution | Betaine | C5H10NO2 | 1.32 |
| Biotin | C10H16N2O3S | 0.004 | |
| Thiamine | C12H17N4OS | 0.019 | |
| Proline | C5H9NO2 | 1.99 | |
| Trace element solution | Ferric chloride hexahydrate | FeCl3·6H2O | 0.004 |
| Cobalt chloride hexahydrate | CoCl2·6H2O | 0.0007 | |
| Copper chloride dihydrate | CuCl2·2H2O | 0.0001 | |
| Zinc chloride | ZnCl2·4H2O | 0.002 | |
| Sodium molybdate dihydrate | Na2MoO4 | 0.0004 | |
| Boric acid | H3BO3 | 0.001 | |
| Manganese chloride tetrahydrate | MnCl2·4H2O | 0.22 |
| Variable | Strain (S) | Acetic Acid Inhibitor (AI) Concentration (g/L) | ANOVA | ||||
|---|---|---|---|---|---|---|---|
| 0 (Ctrl) | 8 | 16 | 20 | ||||
| Specific growth rate (μ, 1/h) a | Tuner | 0.174 a | 0.160 a | 0.051 c | 0.013 c | S AI S × AI | ** *** *** |
| TG1 | 0.102 b | 0.099 b | 0.104 b | 0.014 c | |||
| Xylose consumption (%) | Tuner | 96.4 a | 96.3 a | 57.3 bc | 22.5 d | S AI S × AI | *** *** *** |
| TG1 | 69.8 b | 63.8 bc | 49.4 c | 50.6 c | |||
| Qxyl (g/L h) a | Tuner | 0.270 a | 0.269 a | 0.160 bc | 0.063 d | S AI S × AI | *** *** *** |
| TG1 | 0.191 b | 0.178 bc | 0.138 c | 0.141 c | |||
| YX/S | Tuner | 0.071 a | 0.067 a | 0.042 b | 0.002 d | S AI S × AI | *** *** *** |
| TG1 | 0.031 c | 0.038 bc | 0.044 b | 0.002 d | |||
| YP/S acetic acid | Tuner | 0.324 a | 0.178 b | 0.092 b | 0.102 b | S AI S × AI | *** *** ** |
| TG1 | 0.322 a | 0.357 a | 0.327 a | 0.227 ab | |||
| YP/S formic acid | Tuner | 0.226 bc | 0.163 cd | 0.104 d | NP | S AI S × AI | *** *** ** |
| TG1 | 0.307 ab | 0.311 ab | 0.328 a | 0.214 bc | |||
| YP/S ethanol | Tuner | 0.107 a | 0.104 a | 0.045 b | NP | S AI S × AI | *** *** *** |
| TG1 | 0.084 a | 0.080 a | 0.084 a | 0.081 a | |||
| YP/S lactic acid | Tuner | 0.018 a | 0.084 b | 0.110 a | NP | S AI S × AI | *** *** *** |
| TG1 | NP | NP | NP | NP | |||
| Variable | Strain (S) | Formic Acid Inhibitor (FI) Concentration (g/L) | ANOVA | ||||
|---|---|---|---|---|---|---|---|
| 0 (Ctrl) | 1.5 | 3 | 6 | ||||
| Specific growth rate (μ, 1/h) a | Tuner | 0.174 a | 0.143 ab | 0.134 ab | 0.114 b | S FI S × FI | *** *** NS |
| TG1 | 0.102 b | 0.061 c | 0.049 c | 0.034 c | |||
| Xylose consumption (%) | Tuner | 96.4 a | 96.3 a | 91.1 a | 56.3 bc | S FI S × FI | *** *** ** |
| TG1 | 69.8 b | 44.4 cd | 43.5 cd | 32.9 d | |||
| Qxyl (g/L h) a | Tuner | 0.270 a | 0.270 a | 0.256 a | 0.158 bc | S FI S × FI | *** *** ** |
| TG1 | 0.191 b | 0.124 cd | 0.122 cd | 0.092 d | |||
| YX/S | Tuner | 0.071 a | 0.067 a | 0.065 a | 0.072 a | S FI S × FI | *** * * |
| TG1 | 0.031 c | 0.038 bc | 0.038 bc | 0.047 b | |||
| YP/S acetic acid | Tuner | 0.324 ab | 0.246 b | 0.248 b | 0.288 ab | S FI S × FI | *** NS * |
| TG1 | 0.322 ab | 0.388 a | 0.327 ab | 0.359 ab | |||
| YP/S formic acid | Tuner | 0.226 b | 0.200 b | 0.162 bc | 0.092 c | S FI S × FI | *** *** NS |
| TG1 | 0.307 a | 0.303 a | 0.219 b | 0.201 b | |||
| YP/S ethanol | Tuner | 0.107 ab | 0.118 a | 0.107 ab | 0.101 ab | S FI S × FI | *** *** ** |
| TG1 | 0.084 bc | 0.067 cd | 0.048 de | 0.035 e | |||
| YP/S lactic acid | Tuner | 0.018 c | 0.030 bc | 0.039 b | 0.060 a | S FI S × FI | *** ** ** |
| TG1 | NP | NP | NP | NP | |||
Disclaimer/Publisher’s Note: The statements, opinions and data contained in all publications are solely those of the individual author(s) and contributor(s) and not of MDPI and/or the editor(s). MDPI and/or the editor(s) disclaim responsibility for any injury to people or property resulting from any ideas, methods, instructions or products referred to in the content. |
© 2025 by the authors. Licensee MDPI, Basel, Switzerland. This article is an open access article distributed under the terms and conditions of the Creative Commons Attribution (CC BY) license (https://creativecommons.org/licenses/by/4.0/).
Share and Cite
Gaspar, S.S.; Alves-Ferreira, J.; Moniz, P.; Silva-Fernandes, T.; Silvestre, A.I.R.; Torrado, I.; Pesce, G.R.; Carvalheiro, F.; Duarte, L.C.; Fernandes, M.C. Influence of Inhibitors Generated in Lignocellulosic Hydrolysates from Group of Acids on the Growth of Strains TG1 and Tuner of Escherichia coli. Microorganisms 2025, 13, 605. https://doi.org/10.3390/microorganisms13030605
Gaspar SS, Alves-Ferreira J, Moniz P, Silva-Fernandes T, Silvestre AIR, Torrado I, Pesce GR, Carvalheiro F, Duarte LC, Fernandes MC. Influence of Inhibitors Generated in Lignocellulosic Hydrolysates from Group of Acids on the Growth of Strains TG1 and Tuner of Escherichia coli. Microorganisms. 2025; 13(3):605. https://doi.org/10.3390/microorganisms13030605
Chicago/Turabian StyleGaspar, Suelen S., Júnia Alves-Ferreira, Patrícia Moniz, Talita Silva-Fernandes, Adriana I. R. Silvestre, Ivone Torrado, Gaetano R. Pesce, Florbela Carvalheiro, Luís C. Duarte, and Maria C. Fernandes. 2025. "Influence of Inhibitors Generated in Lignocellulosic Hydrolysates from Group of Acids on the Growth of Strains TG1 and Tuner of Escherichia coli" Microorganisms 13, no. 3: 605. https://doi.org/10.3390/microorganisms13030605
APA StyleGaspar, S. S., Alves-Ferreira, J., Moniz, P., Silva-Fernandes, T., Silvestre, A. I. R., Torrado, I., Pesce, G. R., Carvalheiro, F., Duarte, L. C., & Fernandes, M. C. (2025). Influence of Inhibitors Generated in Lignocellulosic Hydrolysates from Group of Acids on the Growth of Strains TG1 and Tuner of Escherichia coli. Microorganisms, 13(3), 605. https://doi.org/10.3390/microorganisms13030605