Abstract
To investigate the effects of long-term elevated atmospheric CO2 (eCO2) on the distribution and stability of soil aggregates and microbial characteristics in wetland soils and to reveal the mechanisms by which eCO2 influences soil organic carbon (SOC) sequestration, a multi-temporal-scale eCO2 control experiment was conducted in the Sanjiang Plain wetland with treatments at ambient CO2 concentration (AC), 550 ppm, and 700 ppm CO2. Soil aggregate fractionation, phospholipid fatty acid (PLFA) analysis, and redundancy analysis (RDA) were used to analyze changes in aggregate size distribution, stability indices (MWD, GMD), microbial biomass, and community structure. The results showed that eCO2 significantly affected aggregate size distribution. Both short- and long-term exposure to low-concentration eCO2 reduced the proportion of large aggregates. Over time, the proportion of silt and clay particles increased, while microaggregates decreased. Although CO2 concentration did not directly affect MWD and GMD, long-term eCO2 significantly reduced soil aggregate stability. Microbial biomass and diversity were not sensitive to CO2 concentration but decreased significantly with prolonged exposure. In contrast, microbial community structure was significantly affected by both CO2 level and exposure duration. RDA indicated that, under short-term eCO2, aggregate fractions were positively correlated with microbial biomass, whereas, under medium- and long-term treatments, they were positively correlated with soil physicochemical properties. Macroaggregates were positively correlated with aggregate stability, while microaggregates and silt–clay fractions were negatively correlated—a relationship that strengthened with longer eCO2 exposure. Thus, long-term eCO2 altered soil aggregate structure and microbial communities, ultimately influencing SOC stability. These findings provide data and theoretical support for predicting soil carbon stability and ecosystem functioning in wetlands under climate change.
1. Introduction
Since the Industrial Revolution, human activities—including large-scale fossil fuel combustion and land use changes—have caused a nearly 50% increase in atmospheric carbon dioxide (CO2) concentration from 280 ppm in 1750 to approximately 416 ppm in 2022 [1]. According to the report of the Intergovernmental Panel on Climate Change (IPCC), the greenhouse gas emissions—primarily CO2—already caused global temperatures to rise by 0.8–1.2 °C above pre-industrial levels by 2017 [2]. Under current emission trends, global warming is projected to reach 1.5 °C between 2030 and 2052. Such changes are expected to intensify risks to natural and human systems and introduce new threats. Limiting temperature rise to 1.5 °C has thus become an urgent global priority. Addressing this challenge requires a dual approach: reducing greenhouse gas emissions—especially CO2—to directly curb atmospheric concentrations, and enhancing ecosystem carbon sinks to mitigate atmospheric CO2 levels and slow global warming.
Soil aggregates are fundamental units of soil structure [3,4]. In particular, macroaggregates (>0.25 mm) play a crucial role in protecting soil organic carbon (SOC) from microbial degradation, representing a key mechanism for SOC stabilization [5,6]. The stability of soil aggregates directly affects the soil carbon cycling process [7]. Elevated atmospheric CO2 (eCO2) significantly affects the distribution and stability of soil aggregates, though responses vary across ecosystems. For instance, in farmland ecosystems, long-term eCO2 exposure (9 years) has been shown to promote the breakdown of macroaggregates and the formation of microaggregates [8]. In contrast, studies on Mollisol indicated that eCO2 may enhance aggregate stability [9]. ECO2 has the potential to enhance the structural stability of Mollisol aggregates. These discrepancies may originate from the intrinsic soil properties: the decomposition process of organic matter in paddy soil is comparatively slow under flooded conditions, whereas Mollisol possesses a high organic matter and aggregation potential.
Soil microorganisms are essential to the formation and stabilization of soil aggregates. Through hyphal entanglement (e.g., by arbuscular mycorrhizal fungi), secretion of extracellular polymeric substances (e.g., polysaccharides and glycoproteins), and metabolic by-products such as organic acids, microbes facilitate the binding of soil particles into stable micro- and macroaggregates [10]. Conversely, aggregates provide physical protection for microorganisms, offering refuge from predation and desiccation, and creating niches enriched in organic matter and nutrients [11]. This reciprocal relationship—where microbes promote aggregation and aggregates influence microbial community composition—underpins critical soil processes including carbon sequestration, nutrient cycling, and overall ecosystem sustainability. A deeper understanding of these interactions is essential for predicting soil responses to global change.
ECO2 generally enhances microbial activity and aggregate stability by altering carbon dynamics in plant–soil systems [12]. On the one hand, high CO2 concentrations typically stimulate plant photosynthesis, augment the input of root exudates and litter, thereby offering a more abundant carbon source and energy for soil microorganisms. This response is particularly pronounced in C3 plants, which dominate temperate wetlands and exhibit photosynthetic enhancement of 20–50% under eCO2 due to reduced photorespiration [13,14]. The dominant species in this study, Deyeuxia angustifolia, is a C3 plant [15]; unlike C4 species (e.g., Spartina in coastal marshes wetland) that show minimal CO2 fertilization at current levels, C3 D. Angustifolia likely sustains elevated root exudation and biomass allocation under 550–700 ppm, driving microbial proliferation and aggregate formation in the anaerobic rhizosphere. This C3-specific CO2 sensitivity provides a strong mechanistic rationale for expecting robust plant–soil feedbacks in Sanjiang wetlands, distinguishing them from C4-dominated systems. This stimulates their activity and biomass (particularly that of mycorrhizal fungi associated with the carbon cycle) and may lead to changes in the microbial community structure [16]. On the other hand, the enhanced microbial activity and the growth of fungal mycelium generate more microbial by-products (such as glomalin-related soil protein, GRSP) and extracellular polymers. These substances, serving as crucial “glue” materials, can effectively bind soil particles together, facilitate the formation of large aggregates, and improve their stability [17]. Although previous research has reported that eCO2 promotes the formation of macroaggregates (particle size > 0.25 mm) in forest, farmland, and wetland ecosystems [18,19,20], other studies have indicated that eCO2 can reduce the proportion and stability of macroaggregates in wetlands [21,22]. This finding suggests that the response mechanism of the “soil aggregate-microorganism” system remains poorly understood. Therefore, it is imperative to investigate the specific patterns and mechanisms underlying the “carbon protection” function of this system in the wetland of the Sanjiang Plain.
The Sanjiang Plain Wetland is a critical ecological region in Northeast Asia, with significant roles in biodiversity conservation and carbon sequestration. However, rising atmospheric CO2 and other climate-change factors threaten this ecosystem, potentially leading to biodiversity loss, increased greenhouse gas emissions, and soil nutrient depletion. Although eCO2 effects on aggregate dynamics have been examined in agricultural [18,19] and forest [20] systems, wetlands of the Sanjiang Plain differ fundamentally in hydrology, redox regime, and organic-matter quality. Seasonal waterlogging (July–August) creates persistent anaerobic microsites that favor methanogenesis and Fe/Al-mediated organo-mineral complexation rather than the aerobic, tillage-driven turnover typical of croplands or the deep litter inputs of forests. These conditions decouple plant-C inputs from rapid microbial oxidation, potentially shifting long-term C protection from physical (aggregate occlusion) to chemical (mineral association) mechanisms—a transition rarely captured in short-term or non-wetland studies. The 14-year chronosequence (1-, 9-, and 14-year open-top chambers exposures) spanning short- to long-term eCO2 (550 and 700 ppm) therefore provides a rare temporal gradient to test whether aggregate-microbial feedbacks follow the linear stimulation observed in uplands or exhibit threshold responses under prolonged anaerobiosis and nutrient limitation. By integrating wet-sieving, PLFA profiling, and RDA across this gradient, we reveal stage-specific shifts from microbial-driven macroaggregation (short-term) to mineral-driven fine-fraction stabilization (long-term)-insights that refine wetland-specific C models and inform conservation under rising CO2.
This study investigated the effects of eCO2 on the structure, stability of soil aggregates, and the composition of the soil microbial community in a typical D. angustifolia wetland in the Sanjiang Plain. By using open-top chambers (OTCs) to simulate eCO2 conditions, this research tested two hypotheses: (1) eCO2 altered the structure and stability of soil aggregates, and (2) eCO2 modified the soil microbial community. The findings provide significant insight into potential impacts of future climate change on wetland soil and support the development of effective conservation strategies for the wetland.
2. Materials and Methods
2.1. Study Site and Experimental Setup
The research was conducted at the Sanjiang Plain Wetland Ecosystem Research Station of the Institute of Natural and Ecological Research, Heilongjiang Academy of Sciences (47°35′ N, 133°31′ E). The altitude of this research station ranges from 55 to 65 m above sea level. The average temperature is approximately 1.9 °C. The effective accumulated temperature above 10 °C lies between 2165 and 2624 °C. The lowest temperature in January reaches −20.4 °C, and the highest temperature in July is 21.6 °C. The mean annual precipitation is 585 mm, concentrated from July to September, and the mean annual evaporation is 1166 mm. D. angustifolia is the dominant species in this area. The soil is classified as swamp peat soil and meadow swamp soil, featuring seasonal waterlogging in July and August [23]. The experiment simulating atmospheric eCO2 was carried out using open-top chambers (OTCs). The device was built with an octagonal ring structure with a height of 1.8 m, covering a total plot area of ca 10.78 m2 covered with a polycarbonate plate (90% light transmittance). We supplied carbon dioxide to the chambers through a pipe with pinholes connected to industrial CO2 tanks outside the chambers. We adjusted the CO2 supply in accordance with wind speed and CO2 concentrations by taking constant measurements with an infrared gas analyzer. The 27 OTCs were established following a randomized complete block design across a homogeneous 1.2-ha plot. The site was pre-surveyed for micro-topography, soil texture, and initial SOC; three spatial blocks (separated by >15 m buffers) were delineated to capture subtle hydrological gradients. Each block contained one full set of the nine treatment combinations, yielding true replication (n = 3) and minimizing spatial pseudo-replication.
The chambers, installed over a 14-year period, were used to represent a chronosequence of exposure durations, long-term (LT, 14 years), medium-term (MT, 9 years), and short-term (ST, 1 year), and the details of experiment design are shown in Table S1. Each exposure group was subjected to three CO2 treatments: ambient CO2 (AC), 550 ppm (EC1), and 700 ppm (EC2). Microclimate was continuously monitored using infrared CO2 sensors (GMT222, Vaisala, Vantaa, Finland) and temperature–humidity probes (HMP155, Vaisala) logging at 30 min intervals. CO2 targets (550 ± 30 ppm; 700 ± 40 ppm) were maintained >95% of the time; interior temperatures were 0.8–1.3 °C above ambient, and relative humidity 2–4% higher. The treatments were as follows: (1) short-term AC treatment; (2) short-term EC1 treatment; (3) short-term EC2 treatment; (4) medium-term AC treatment; (5) medium-term EC1 treatment; (6) medium-term EC2 treatment; (7) long-term AC treatment; (8) long-term EC1 treatment; and (9) long-term EC2 treatment.
2.2. Soil Sample Collection
In mid-July 2023, soil samples were collected from the 0–20 cm depth in each OTC. Five random sampling points were selected per chamber, and the soils were homogenized into one composite sample per chamber. A total of 27 soil samples were obtained. Samples from five randomly selected sampling points within each OTC gas chamber were thoroughly blended. After removing visible debris, plant residues, and gravel, all blended samples were partitioned into two portions. One portion was placed within a sterile bag inside an insulated box equipped with ice packs and subsequently transported to the laboratory. The sterile bag was stored at 4 °C for the measurement of various indicators, including soil microbial biomass, and the relevant experiments were concluded within a week. The other portion of the sample was naturally air-dried for the assessment of soil properties and sieving of soil aggregates.
2.3. Soil Aggregate Fractionation and Stability Indices
To minimize slaking artifacts, air-dried samples were pre-wetted by capillary action: 100 g of field-moist equivalent soil (adjusted to ~10% gravimetric water content) was placed on tension tables at −0.3 kPa for 30 min until uniformly moistened. The same mixed soil samples were first moistened. Subsequently, distilled water was slowly added, and the samples were allowed to stand for 10 min before undergoing the wet-sieving operation in the aggregate analyzer. The sample was subjected for 15 min to an amplitude of 3 cm and a frequency of 30 times per minute. Aggregates of different particle sizes, particularly those >2 mm (large macroaggregates), 0.25–2 mm (small macroaggregates), 0.053–0.25 mm (microaggregates), and <0.053 mm (silt and clay particles), were separately collected in aluminum boxes. After the water-stable aggregates were dried at 105 °C for 12 h, the mass of each particle size fraction was calculated.
The mean weight diameter (MWD, mm) and geometric mean diameter (GMD, mm) were calculated using Equations (1) and (2) [5] as follows:
where and Wi represent the average diameter (mm) and the weight percentage of water-stable aggregates, respectively, for each observed particle size.
2.4. Soil Sample Analyses
Total nitrogen (TN) and SOC contents were determined using an elemental analyzer (Model 2400; PerkinElmer, Shelton, CT, USA). Soil pH was measured using a pH meter (Mettler-Toledo, Columbus, OH, USA) at a soil-to-water ratio of 1:2.5 (w/v). Nitrate nitrogen [24] and ammonium nitrogen [25] contents were determined using colorimetry 48 h after extraction. The available nitrogen (AN) content was calculated as the sum of these two forms of nitrogen (N). Total soil P(TP) and available P (AP) contents were determined using the sodium hydroxide fusion-Mo-Sb anti-colorimetric method and 0.5 mol·L−1 sodium bicarbonate extraction-Mo-Sb anti-colorimetric method, respectively [26]. Dissolved organic C (DOC) was extracted using 0.5 mol·L−1 potassium sulfate at a soil-to-solution ratio of 1:4 (w/v) and measured with a total organic C (TOC) analyzer (Vario TOC, Elementar, Langenselbold, Germany). The permanganate-oxidizable organic carbon (PPOC) was measured using the method proposed by Logninow et al. [27], while the acid-hydrolyzable organic carbon (AHOC) was measured according to the method described by Rovira and Vallejo (2002) [28]. Soil microbial biomass C (MBC), microbial biomass N (MBN), and microbial biomass P contents were determined using the fumigation–extraction method [29].
2.5. Phospholipid Fatty Acid Analysis (PLFA Analysis)
We selected PLFA analysis because it provides quantitative estimates of viable microbial biomass and broad community composition, is cost-effective for large sample sets, and allows direct comparison with decades of prior CO2-enrichment studies that used the same method [19,20]. Although 16S/ITS sequencing offers higher taxonomic resolution, PLFA remains superior for biomass quantification and detecting physiologically relevant shifts in major groups under long-term treatments. The PLFAs were extracted and identified following the protocols [30,31]. Briefly, freeze-dried and sieved (2 mm) soil samples (2 g) were extracted twice with a single-phase chloroform–methanol–citrate buffer mixture (1:2:0.8 v/v/v, 0.15 mol∙L−1, pH 4.0). Approximately 2 g of the soil samples were subjected to two extractions using 22.8 mL of a single-phase mixture of chloroform–methanol–citrate buffer (1:2:0.8 v/v/v, 0.15 mol L−1, pH 4.0). Subsequently, the phospholipids were separated from neutral lipids and glycolipids using a silica gel column (Supelco, Bellefonte, PA, USA). Nonadecanoic acid methyl ester fatty acid (19:0) was added as an internal standard for the quantification of the phospholipid concentration prior to further analysis. Following the methylation of the phospholipids, the PLFA methyl esters were separated and identified via gas chromatography (GC; N6890, Agilent, Santa Clara, CA, USA) equipped with MIDI Sherlock microbial identification software (Version 4.5, MIDI, Newark, DE, USA). The 19:0 methyl ester was employed as an internal standard to guarantee accurate quantification. The following PLFAs were used as markers for specific microbial groups: i14:0, i15:0, a15:0, i16:0, i17:0, and a17:0 for Gram-positive bacteria; 16:1ω5c, 17:1ω8c, cy17:0, and cy19:0 for Gram-negative bacteria. Among these PLFAs, 18:1ω9c and 10Me16:0 PLFAs served as biomarkers for fungi, while 10Me17:0 and 10Me18:0 PLFAs functioned as biomarkers for actinomycetes. Non-specific (general) PLFAs were characterized by straight-chain acids, including 14:0, 15:0, 16:0, 17:0, and 18:0.
2.6. Statistical Analyses
We assessed the normality of variable distributions, applying a log10 transformation where necessary. One-way analysis of variance (One-way ANOVA) and Tukey’s test were utilized to examine the differences in aggregate mass ratio, aggregate stability, soil properties, microbial mass, and microbial diversity under varying eCO2 concentrations and different time treatments. Pearson correlation analysis was applied to ascertain the correlation between the aggregate mass ratio and aggregate stability indicators. Redundancy analysis (RDA) was utilized to discern the correlations among soil physical and chemical properties, microbial properties, and the mass ratios of aggregates with varying particle sizes. The analysis was executed using the Vegan package and the rdacca. pH package, and the plots were generated using the ggplot2 package. The RDA and plot generation were conducted using R v.4.3.0 software (https://www.r-project.org/).
3. Results
3.1. Particle Size Distribution of Soil Aggregates
The effects of eCO2 on the size distribution of soil aggregates varied across treatments (Figure 1). Compared to ambient CO2 (AC), both ST and LT exposure to low-concentration eCO2(EC1) significantly reduced the proportion of large macroaggregates (>2 mm) (Figure 1a, p < 0.01). Short-term EC1 also significantly decreased the proportion of small macroaggregates (Figure 1b, p < 0.05), while significantly increasing the proportion of microaggregates (0.053–0.25 mm) (p < 0.01; Figure 1c). Changes in the silt and clay fraction (<0.053 mm) were divergent. Specifically, the proportion of silt and clay particles increased significantly under short-term high-concentration eCO2(EC2) but exhibited a significant downward trend under long-term low-concentration eCO2 (Figure 1d, p < 0.05).
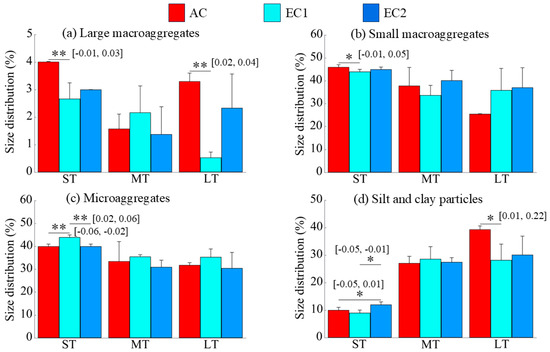
Figure 1.
Changes in particle size distribution under eCO2. ST, MT, and LT denote short-, medium-, and long-term treatments, respectively. The “*” and “**” indicate significance levels with p < 0.05 and p < 0.01, respectively. The values in brackets are the 95% confidence intervals.
The duration of eCO2 exposure exerted a more consistent influence on different particle sizes of soil aggregates. Under the EC1 and EC2, prolonged exposure led to a significant increase in the silt and clay fraction (p < 0.01; Figure 2d) and a significant decrease in microaggregates (p < 0.05; Figure 2c), while the proportions of large and small macroaggregates generally declined (Figure 2a,b).
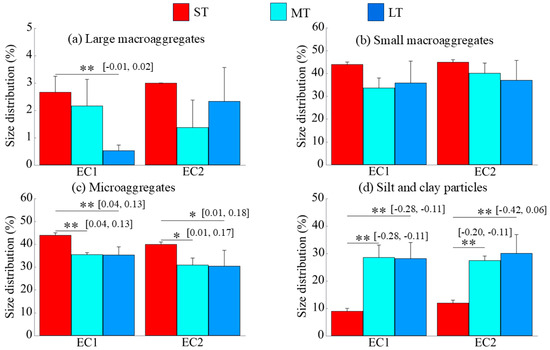
Figure 2.
Changes in particle size distribution over the duration of eCO2. EC1 and EC2 denote the treatments with eCO2 at 550 ppm and 700 ppm, respectively. The “*” and “**” indicate significance levels with p < 0.05 and p < 0.01, respectively. The values in brackets are the 95% confidence intervals.
3.2. Soil Aggregate Stability
Compared to the AC treatment, eCO2 did not induce statistically significant changes in mean weight diameter (MWD) or geometric mean diameter (GMD)—key indicators of aggregate stability—across short-, medium-, or long-term exposures (p > 0.05; Figure 3a). However, the duration of eCO2 exposure significantly influenced aggregate stability, as evidenced by a gradual decline in both MWD and GMD with increasing exposure time (p < 0.05; Figure 3b).
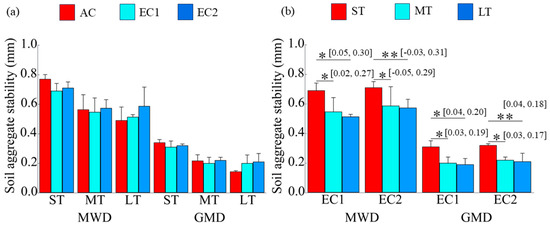
Figure 3.
Changes in soil aggregate stability under eCO2 and the duration of eCO2. MWD denotes mean weight diameter, and GMD denotes geometric mean diameter. The “*” and “**” indicate significance levels with p < 0.05 and p < 0.01, respectively. The values in brackets are the 95% confidence intervals.
3.3. Soil Microbial PLFAs, Composition, and Diversity
Phospholipid fatty acid (PLFA) analysis revealed that eCO2 concentration alone did not significantly alter total microbial biomass, bacterial biomass, fungal biomass, or the fungal-to-bacterial ratio (F/B) within any exposure period (p > 0.05; Table 1). In contrast, exposure duration had a pronounced effect. Total PLFAs, bacterial PLFAs, fungal PLFAs, and the F/B ratio all increased significantly over time under eCO2 (p < 0.05; Table 2). This temporal increase was particularly evident under EC1. Under EC2, microbial biomass parameters showed no significant difference between short-term (ST) and medium-term (MT) exposures but were significantly higher in the long-term (LT) treatment (p < 0.05; Table 2).

Table 1.
PLFA concentrations (nmol g−1) and microbial community composition under eCO2.
Table 2.
PLFA concentrations (nmol g−1) and microbial community composition under duration of eCO2.
Analysis of alpha diversity indicated that the Shannon diversity index was not significantly affected by CO2 concentration (p > 0.05). However, the ACE index, a measure of microbial richness, decreased significantly under long-term eCO2 exposure (p < 0.05; Table 1). The response of the ACE index to exposure duration varied with concentration: it increased over time under EC1 but peaked at medium-term and was lowest in the long-term under EC2 (p < 0.05; Table 2). Permutational multivariate analysis of variance (PERMANOVA) confirmed that both CO2 concentration and exposure duration significantly influenced overall microbial community structure (Figure S1, p < 0.05).
3.4. Influencing Factors of Soil Aggregates
RDA revealed significant associations between aggregate fractions and soil microbial and physicochemical properties (Figure 4). Under short-term eCO2 (ST), a positive correlation was observed between aggregate distribution and microbial biomass (total, bacterial, and fungal PLFAs), along with the F/B ratio. In medium-term (MT) and long-term (LT) treatments, aggregate fractions were strongly associated with soil physicochemical properties, including permanganate-oxidizable carbon (PPOC), total nitrogen (TN), total phosphorus (TP), pH, SOC, available nitrogen (AN), microbial biomass phosphorus (MBP), dissolved organic carbon (DOC), acid-hydrolyzable organic carbon (AHOC), and microbial alpha diversity indices (Shannon and ACE).
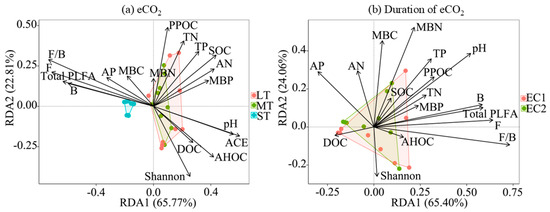
Figure 4.
Influencing factors of soil aggregate fractions under eCO2 and duration of eCO2. RDA axes 1 and 2 accounted for 65.77% and 22.81% of the variation, respectively, under eCO2 at different times (a) and for 65.40% and 24.06%, respectively, with duration under different CO2 levels (b). The arrows represent explanatory variables; the length of an environmental arrow represents the strength of its influence on the soil aggregate composition. Furthermore, the cosine of the angle between any two arrows approximates their correlation, with acute, obtuse, and right angles indicating positive, negative, and no correlation, respectively. The arrows represent the explanatory variables, whereas the colored dots denote the distribution of data points for the soil aggregate fractions. The length of an arrow indicates the strength of its influence on the composition, and the angle between arrows reflects their correlation: acute, obtuse, and right angles indicate positive, negative, and no correlation, respectively. pH, soil acidity or alkalinity; SOC, soil organic carbon; TN, total soil nitrogen; TP, total phosphorus; DOC, dissolved organic carbon; PPOC, permanganate-oxidizable organic carbon; AHOC, acid-hydrolyzable organic carbon; AP, available phosphorus; AN, available nitrogen; MBC, microbial biomass carbon; MBN, microbial biomass nitrogen; MBP, microbial biomass phosphorus; Shannon, alpha diversity index; and ACE, microbial richness index.
Regarding the influence of eCO2 treatment time, the association patterns between soil aggregate fractions and microbial and physicochemical properties under low-concentration (EC1) and high-concentration (EC2) eCO2 conditions were fundamentally consistent. Specifically, they were significantly correlated with indicators such as total PLFAs, bacterial PLFAs, fungal PLFAs, F/B, pH, MBN, MBC, and AP (Figure 4).
3.5. The Relationship Between Aggregate Components and Stability
Across all eCO2 exposure periods, large and small macroaggregates were consistently positively correlated with aggregate stability (i.e., MWD and GMD), whereas microaggregates and the silt–clay fraction were negatively correlated (Table 3). As exposure duration increased under both EC1 and EC2, the positive correlation of macroaggregates and the negative correlation of the silt–clay fraction with stability were reinforced.
Table 3.
Correlation between aggregate stability indices and the proportion of aggregates.
4. Discussion
4.1. Changes in Soil Aggregate Distribution
In accordance with our first hypothesis, both short- and long-term eCO2 significantly reduced the proportion of large macroaggregates (>2 mm), whereas prolonged exposure under both 550 and 700 ppm markedly increased the silt+clay fraction (<0.053 mm) at the expense of microaggregates. This pattern suggests initial disruption of macroaggregates followed by progressive fragmentation over time. Enhanced root exudation under eCO2 likely stimulated microbial turnover of binding agents, accelerating the breakdown of large aggregates in the early stage, while cumulative carbon inputs and changing redox conditions favored the accumulation of fine particles in the long term. This process was markedly intensified under high-concentration eCO2 (EC2), which led to a 23.44% decrease in silt–clay content and a 45.20% increase in small macroaggregates—likely driven by enhanced root secretion and microbial activity that promoted the production of organic cementing agents [32]. Second, soil microorganisms, particularly fungi, were positively linked to aggregate evolution. Fungal PLFAs showed a significant positive correlation with the proportion of small macroaggregates (p < 0.05), supporting the known role of hyphal entanglement and glomalin secretion in aggregate formation [33]. These trends are consistent with molecular studies across ecosystems. For example, 16S rRNA sequencing in wetland systems revealed eCO2-induced enrichment of Actinobacteria and Acidobacteria and a decline in Proteobacteria, linked to increased rhizodeposition [34]. ITS profiling in temperate bogs showed increased Basidiomycota under eCO2, correlating with macroaggregate stability [35]. Metagenomic evidence further indicated upregulation of fungal polysaccharide synthesis genes under eCO2, reinforcing the role of fungal activity in cementing aggregates [36]. While these molecular insights align with and extend our PLFA-based trends, they also highlight a key limitation of our approach: the inability to resolve taxonomic or functional gene-level mechanisms. Future studies should integrate metagenomic and transcriptomic tools to directly link microbial functional traits with aggregate dynamics under eCO2. Such work would help clarify the causal—not just correlative—pathways through which eCO2 reshapes soil structure and carbon cycling.
4.2. Changes in Soil Aggregate Stability
Contrary to some upland studies, prolonged eCO2 did not increase aggregate stability in this wetland system (Figure 3a); instead, both MWD and GMD declined significantly with exposure duration (Figure 3b), even under ambient CO2. This consistent temporal decrease primarily reflects natural structural aging caused by repeated freeze–thaw cycles, root turnover, and redox fluctuations typical of wetland soils. The lack of a significant CO2 × duration interaction indicates that eCO2 accelerates, rather than initiates, this aging process. The observed reduction in stability aligns with the decreasing proportion of macroaggregates and increasing silt + clay fraction under long-term eCO2 (Table 3). Aggregate stability is closely tied to the abundance of macroaggregates (>0.25 mm), which provide physical protection for SOC [37,38,39,40,41,42]. In contrast to terrestrial ecosystems where eCO2 often strengthens microbe–mineral interactions and promotes stable aggregates [18,19], prolonged eCO2 here intensified microbial metabolism and nutrient limitation under anaerobic conditions, leading to aggregate breakdown and the mineralization of previously protected carbon.
Elevated CO2 also significantly influences the chemical composition and spatial distribution of soil organic carbon (SOC). Under long-term eCO2, SOC within microaggregates becomes structurally simpler and less diverse [43]. Synchrotron-based infrared microspectroscopy reveals that organic components in microaggregates distribute more homogeneously and interact strongly with clay mineral hydroxyl groups (O–H), thereby enhancing SOC stability [44]. However, in coarse-textured soils such as calcareous types, mineral–carbon associations weaken, potentially compromising physical protection mechanisms [45]. Moreover, eCO2 can substantially reduce both particulate organic carbon (POC) and mineral-associated organic carbon (MAOC), particularly in deeper soil layers (20–40 cm) [46]. Pyrolysis–GC/MS further indicates a decline in the diversity of organic compounds within MAOC under eCO2, reducing its chemical stability and influencing soil carbon persistence [47,48].
These duration-dependent, nonlinear effects reveal a staged aggregate–microorganism feedback: short-term stimulation of microbial binding agents is overtaken by longer-term nutrient limitation, microbial succession, and enhanced decomposition under fluctuating redox conditions. The rising silt + clay fraction indicates a shift from physical occlusion within macroaggregates to stronger chemical protection via organo-mineral complexes with reduced Fe/Al (hydr)oxides—a dominant stabilization pathway in wetlands. Thus, although wetland carbon inputs may increase under rising CO2, sequestration quality and long-term stability could decline unless mineral-association mechanisms are explicitly incorporated into future models.
4.3. Changes in Soil Microbial Community Structure
PLFA analysis revealed that eCO2 concentration alone exerted minimal influence on microbial biomass or richness within any exposure period. Instead, microbial biomass (total, bacterial, and fungal PLFAs) and the fungal–bacterial ratio increased significantly from short- to medium/long-term exposures, reflecting cumulative plant-derived carbon inputs from the dominant C3 vegetation (Table 1 and Table 2). In contrast, microbial richness (ACE index) and overall community structure responded strongly to the interaction of CO2 level and duration: long-term high-concentration eCO2 (700 ppm) caused the most pronounced decline in richness and the largest compositional shifts (p < 0.05). These changes were driven primarily by indirect effects rather than direct CO2 toxicity. Progressive soil acidification (Table S1) and depletion of total nitrogen and phosphorus created conditions favoring acid-tolerant, oligotrophic taxa such as Actinobacteria while suppressing more sensitive groups [49,50,51,52,53]. This is consistent with global CO2-enrichment experiments showing that sustained plant uptake without fertilization leads to progressive nutrient limitation, reduced diversity, and a shift toward slower-cycling microbial communities [53,54]. Although short-term eCO2 stimulated microbial biomass through enhanced rhizodeposition [55], prolonged exposure transitioned the regulatory mechanism from direct carbon stimulation to indirect control via altered soil chemistry and stoichiometry. The resulting community restructuring—particularly the enrichment of taxa capable of degrading recalcitrant carbon—may accelerate SOC mineralization under long-term high eCO2 [56], potentially weakening the carbon sink strength of unmanaged wetlands despite initial productivity gains.
Regarding the time effect, this study demonstrated that the duration of continuous exposure to eCO2 was a crucial environmental factor that affected the structure of soil microbial communities. This suggests that, as the duration of eCO2 exposure lengthened, the influencing mechanism of eCO2 gradually changes from directly stimulating biomass in the initial stage to indirectly regulating the structure of the microbial community by modifying the chemical properties of soil organic matter and nutrient cycling. A recent meta-analysis confirmed that eCO2 enhances the activity of carbon-degrading enzymes (e.g., cellulase, ligninase), correlating with increased SOC—highlighting time-dependent functional microbial responses [57], but enzyme activity or gene expression was not assessed here. Future work should use qPCR or metatranscriptomics to test whether PLFA increases reflect elevated C-degradation capacity.
While PLFA biomarkers effectively track shifts in major microbial groups (e.g., Gram-positive/negative bacteria, fungi, actinomycetes), they offer limited taxonomic resolution at the genus or species level and do not reflect functional gene abundance, expression, or enzyme activity [58]. For example, the observed increase in fungal PLFAs under long-term eCO2 is consistent with enhanced hyphal biomass but does not confirm specific roles in glomalin production or C decomposition. Similarly, changes in bacterial PLFA ratios may indicate community restructuring but cannot identify key taxa (e.g., Streptomyces or methanotrophs) driving aggregate dynamics. Future studies integrating high-throughput sequencing (16S rRNA, ITS) and metagenomics/transcriptomics are recommended to resolve functional microbial responses to eCO2 in this wetland system.
A key limitation of this chronosequence design is the potential confounding of exposure duration with inter-annual climate variability and initial site conditions. The ST, MT, and LT (OTCs) were established in different years across a homogeneous 1.2-ha plot, but subtle differences in weather (e.g., precipitation, temperature extremes) and pre-installation soil/vegetation states cannot be fully excluded despite randomized block design and pre-surveys. For instance, the LT cohort experienced 14 growing seasons, including extreme events (e.g., 2013 flood), while ST chambers saw only one. Such variability may contribute to observed microbial richness decline or aggregate shifts independently of eCO2 duration. While microclimate monitoring showed consistent OTC warming (+0.8–1.3 °C) and CO2 control (>95% target fidelity; Table S2), legacy effects remain unquantified. Thus, duration-related patterns should be interpreted as associational trends within a realistic field chronosequence, not strict causal outcomes of exposure time. True replication across multiple staggered sites would be needed to isolate duration effects—a logistical challenge for decadal eCO2 studies. Future work should pair chronosequences with continuous flux towers and isotopic (13C) labeling to disentangle climate, legacy, and eCO2 signals.
5. Conclusions
Prolonged elevated CO2 induces a nonlinear, stage-specific restructuring of soil aggregates and microbial communities in a temperate freshwater wetland. Short-term stimulation gives way to long-term aggregate fragmentation and a shift toward mineral-mediated SOC stabilization. These findings refine predictions of wetland carbon persistence under future atmospheric CO2 concentrations and highlight the need to incorporate duration-dependent microbial and mineral protection mechanisms into Earth system models.
Supplementary Materials
The following supporting information can be downloaded at https://www.mdpi.com/article/10.3390/microorganisms13122776/s1, Table S1. Experimental design. Table S2. Characteristics of basic environmental factors of soil under eCO2 conditions. Table S3. Characteristics of basic environmental factors of soil under the duration of eCO2 conditions. Table S4. Influencing factors of soil aggregate fractions under eCO2 and duration of eCO2. Figure S1. Changes in soil microbial community structure. ST, MT, and LT denote short-term, medium-term, and long-term treatments respectively; AC, EC1, and EC2 denote treatments under ambient CO2 concentration, 550 ppm CO2 concentration, and 700 ppm CO2 concentration respectively. Figure S2. Changes in particle size structure under eCO2 and the duration of eCO2. ST, MT, and LT denote short-term, medium-term, and long-term treatments respectively; AC, EC1, and EC2 denote treatments under ambient CO2 concentration, 550 ppm CO2 concentration, and 700 ppm CO2 concentration respectively.
Author Contributions
L.S.: writing—review and editing, writing—original draft, data curation, conceptualization. H.C.: software, methodology, data curation. R.Z.: software, data curation. H.Z.: methodology, investigation. Y.L.: conceptualization, investigation, methodology. J.W.: investigation, methodology. D.Z.: investigation, supervision. L.L.: investigation, supervision. H.N.: conceptualization, methodology, funding acquisition, data curation. All authors have read and agreed to the published version of the manuscript.
Funding
This research was funded by the Scientific Research Business Expenses Project of Scientific Research Institutes Affiliated to Heilongjiang Province (No. CZKYF2021-2-A005) and the Natural Science Foundation of Heilongjiang Province (No. LH2023D020), and the Special Project for Capacity Improvement of Institutes of Heilongjiang Academy of Sciences (No. YSTS2025ZR01).
Institutional Review Board Statement
Not applicable.
Informed Consent Statement
Not applicable.
Data Availability Statement
The original contributions presented in this study are included in the article/Supplementary Material. Further inquiries can be directed to the corresponding authors.
Acknowledgments
We express our gratitude to Baihui Biotechnology Co., Ltd. in Chengdu, China, for determining the biological necromass and to Huabiaoce Testing Technology Co., Ltd. in Sichuan, China, for detecting the soil physical and chemical properties.
Conflicts of Interest
The authors declare no conflicts of interest.
References
- Lindsey, R. Climate Change: Atmospheric Carbon Dioxide, 2022. Available online: https://www.climate.gov/news-features/understanding-climate/climate-change-atmospheric-carbon-dioxide (accessed on 1 January 2024).
- Adak, S.; Mandal, N.; Mukhopadhyay, A.; Maity, P.P.; Sen, S. Current State and Prediction of Future Global Climate Change and Variability in Terms of CO2 Levels and Temperature. In Enhancing Resilience of Dryland Agriculture Under Changing Climate: Interdisciplinary and Convergence Approaches; Naorem, A., Machiwal, D., Eds.; Springer Nature: Singapore, 2023; pp. 15–43. [Google Scholar]
- Yang, C.; Liu, N.; Zhang, Y. Soil aggregates regulate the impact of soil bacterial and fungal communities on soil respiration. Geoderma 2019, 337, 444–452. [Google Scholar] [CrossRef]
- Freeman, C.; Kim, S.-Y.; Lee, S.-H.; Kang, H.J.J.O.M. Effects of elevated atmospheric CO2 concentrations on soil microorganisms. J. Microbiol. 2004, 42, 267–277. [Google Scholar] [PubMed]
- Wang, Y.; Wu, P.; Qiao, Y.; Li, Y.; Liu, S.; Gao, C.; Liu, C.; Shao, J.; Yu, H.; Zhao, Z.; et al. The potential for soil C sequestration and N fixation under different planting patterns depends on the carbon and nitrogen content and stability of soil aggregates. Sci. Total Environ. 2023, 897, 165430. [Google Scholar] [CrossRef]
- Gao, L.; Becker, E.; Liang, G.; Houssou, A.A.; Wu, H.; Wu, X.; Cai, D.; Degré, A. Effect of different tillage systems on aggregate structure and inner distribution of organic carbon. Geoderma 2017, 288, 97–104. [Google Scholar] [CrossRef]
- Verchot, L.V.; Dutaur, L.; Shepherd, K.D.; Albrecht, A. Organic matter stabilization in soil aggregates: Understanding the biogeochemical mechanisms that determine the fate of carbon inputs in soils. Geoderma 2011, 161, 182–193. [Google Scholar] [CrossRef]
- Yang, X.; Meng, J.; Lan, Y.; Chen, W.; Yang, T.; Yuan, J.; Liu, S.; Han, J. Effects of maize stover and its biochar on soil CO2 emissions and labile organic carbon fractions in Northeast China. Agric. Ecosyst. Environ. 2017, 240, 24–31. [Google Scholar] [CrossRef]
- Wei, S.; Zhang, X.; Mclaughlin, N.B.; Liang, A.; Jia, S.; Chen, X.; Chen, X. Effect of soil temperature and soil moisture on CO2 flux from eroded landscape positions on black soil in Northeast China. Soil Tillage Res. 2014, 144, 119–125. [Google Scholar] [CrossRef]
- Costa, O.Y.A.; Raaijmakers, J.M.; Kuramae, E.E. Microbial Extracellular Polymeric Substances: Ecological Function and Impact on Soil Aggregation. Front. Microbiol. 2018, 9, 1636. [Google Scholar] [CrossRef]
- Gupta, V.V.S.R.; Germida, J.J. Soil aggregation: Influence on microbial biomass and implications for biological processes. Soil Biol. Biochem. 2015, 80, A3–A9. [Google Scholar] [CrossRef]
- Zak, D.R.; Pregitzer, K.S.; King, J.S.; Holmes, W.E. Elevated atmospheric CO2, fine roots and the response of soil microorganisms: A review and hypothesis. New Phytol. 2000, 147, 201–222. [Google Scholar] [CrossRef]
- Ainsworth, E.A.; Long, S.P. What have we learned from 15 years of free-air CO2 enrichment (FACE)? A meta-analytic review of the responses of photosynthesis, canopy properties and plant production to rising CO2. New Phytol. 2005, 165, 351–372. [Google Scholar] [CrossRef] [PubMed]
- Leakey, A.D.B.; Ainsworth, E.A.; Bernacchi, C.J.; Rogers, A.; Long, S.P.; Ort, D.R. Elevated CO2 effects on plant carbon, nitrogen, and water relations: Six important lessons from FACE. J. Exp. Bot. 2009, 60, 2859–2876. [Google Scholar] [CrossRef] [PubMed]
- Xu, M.Y.; Wang, A.X.; Ni, H.W. Effect of elevated CO2 concentration on leaf photosynthesis in Sanjiang-Deyeuxia angustifolia. Adv. Mater. Res. 2013, 726, 305–309. [Google Scholar] [CrossRef]
- Drigo, B.; Kowalchuk, G.A.; Van Veen, J.A. Climate change goes underground: Effects of elevated atmospheric CO2 on microbial community structure and activities in the rhizosphere. Biol Fertil Soils 2008, 44, 667–679. [Google Scholar] [CrossRef]
- De Goede, S.P.C.; Hannula, S.E.; Jansen, B.; Morriën, E. Fungal-mediated soil aggregation as a mechanism for carbon stabilization. ISME J. 2025, 19, wraf074. [Google Scholar] [CrossRef]
- Hoosbeek, M.R.; Scarascia-Mugnozza, G.E. Increased litter build up and soil organic matter stabilization in a poplar plantation after 6 years of atmospheric CO2 enrichment (FACE): Final results of POP-EuroFACE compared to other forest FACE experiments. Ecosystems 2009, 12, 220–239. [Google Scholar] [CrossRef]
- Rao, K.K.; Dwivedi, S.K.; Kumar, S.; Samal, S.K.; Singh, N.R.; Mishra, J.S.; Prakash, V.; Choubey, A.K.; Kumar, M.; Bhatt, B.P. Impact of simultaneous increase in CO2 and temperature on soil aggregates, associated organic carbon, and nutritional quality of rice–wheat grains. J. Plant Nutr. Soil Sci. 2024, 187, 470–483. [Google Scholar] [CrossRef]
- Xiong, L.; Liu, X.; Vinci, G.; Sun, B.; Drosos, M.; Li, L.; Piccolo, A.; Pan, G. Aggregate fractions shaped molecular composition change of soil organic matter in a rice paddy under elevated CO2 and air warming. Soil Biol. Biochem. 2021, 159, 108289. [Google Scholar] [CrossRef]
- Wu, Q.; Zhang, C.; Yu, Z.; Zhang, J.; Zhu, C.; Zhao, Z.; Xiong, J.; Chen, J. Effects of elevated CO2 and nitrogen addition on organic carbon and aggregates in soil planted with different rice cultivars. Plant Soil 2018, 432, 245–258. [Google Scholar] [CrossRef]
- Ma, H.L.; Zhu, J.G.; Xie, Z.B.; Liu, G.; Zeng, Q. Effects of increased residue biomass under elevated CO2 on carbon and nitrogen in soil aggregate size classes (rice-wheat rotation system, China). Can. J. Soil Sci. 2009, 89, 567–577. [Google Scholar] [CrossRef]
- Wu, Y.; Wang, H.; Xu, N.; Li, J.; Xing, J.; Zou, H. Effects 10 years elevated atmospheric CO2 on soil bacterial community structure in Sanjiang Plain, Northeastern China. Plant Soil 2022, 471, 73–87. [Google Scholar] [CrossRef]
- Verdouw, H.; Van Echteld, C.J.A.; Dekkers, E.M.J. Ammonia determination based on indophenol formation with sodium salicylate. Water Res. 1978, 12, 399–402. [Google Scholar] [CrossRef]
- Doane, T.A.; Horwáth, W.R. Spectrophotometric Determination of Nitrate with a Single Reagent. Anal. Lett. 2003, 36, 2713–2722. [Google Scholar] [CrossRef]
- Olsen, S.R. Estimation of available phosphorus in soils by extraction with sodium bicarbonate. In Miscellaneous Paper Institute for Agricultural Research Samaru; US Dept. of Agriculture: Washington, DC, USA, 1954. [Google Scholar]
- Logninow, W.; Wisniewski, W.; Strony, W.M. Fractionation of organic carbon based on susceptibility to oxidation. Pol. J. Soil Sci. 1987, 20, 47–52. [Google Scholar]
- Rovira, P.; Vallejo, V.R. Labile and recalcitrant pools of carbon and nitrogen in organic matter decomposing at different depths in soil: An acid hydrolysis approach. Geoderma 2002, 107, 109–141. [Google Scholar] [CrossRef]
- Brookes, P.C.; Landman, A.; Pruden, G.; Jenkinson, D.S. Chloroform fumigation and the release of soil nitrogen: A rapid direct extraction method to measure microbial biomass nitrogen in soil. Soil Biol. Biochem. 1985, 17, 837–842. [Google Scholar] [CrossRef]
- Buyer, J.S.; Teasdale, J.R.; Roberts, D.P.; Zasada, I.A.; Maul, J.E. Factors affecting soil microbial community structure in tomato cropping systems. Soil Biol. Biochem. 2010, 42, 831–841. [Google Scholar] [CrossRef]
- Yuan, H.; Zhu, Z.; Liu, S.; Ge, T.; Jing, H.; Li, B.; Liu, Q.; Lynn, T.M.; Wu, J.; Kuzyakov, Y. Microbial utilization of rice root exudates: 13C labeling and PLFA composition. Biol. Fertil. Soils 2016, 52, 615–627. [Google Scholar] [CrossRef]
- Nie, M.; Bell, C.; Wallenstein, M.D.; Pendall, E. Increased plant productivity and decreased microbial respiratory C loss by plant growth-promoting rhizobacteria under elevated CO2. Sci. Rep. 2015, 5, 9212. [Google Scholar] [CrossRef]
- Fan, X.; Pan, H.; Ping, Y.; Jin, G.; Song, F. The Underlying Mechanism of Soil Aggregate Stability by Fungi and Related Multiple Factor: A Review. Eurasian Soil Sci. 2022, 55, 242–250. [Google Scholar] [CrossRef]
- Drigo, B.; Kowalchuk, G.A.; Knapp, B.A.; Pijl, A.S.; Boschker, H.T.S.; van Veen, J.A. Impacts of 3 years of elevated atmospheric CO2 on rhizosphere carbon flow and microbial community dynamics. Glob. Change Biol. 2013, 19, 621–636. [Google Scholar] [CrossRef]
- Asemaninejad, A.; Thorn, R.G.; Branfireun, B.A.; Lindo, Z. Climate change favours specific fungal communities in boreal peatlands. Soil Biol. Biochem. 2018, 120, 28–36. [Google Scholar] [CrossRef]
- Xiao, K.Q.; Ge, T.D.; Wu, X.H.; Peacock, C.L.; Zhu, Z.K.; Peng, J.; Bao, P.; Wu, J.S.; Zhu, Y.G. Metagenomic and 14C tracing evidence for autotrophic microbial CO2 fixation in paddy soils. Environ. Microbiol. 2021, 23, 924–933. [Google Scholar] [CrossRef]
- Lan, J.; Long, Q.; Huang, M.; Jiang, Y.; Hu, N. Afforestation-induced large macroaggregate formation promotes soil organic carbon accumulation in degraded karst area. For. Ecol. Manag. 2022, 505, 119884. [Google Scholar] [CrossRef]
- Li, H.; Zhu, H.; Liang, C.; Wei, X.; Yao, Y. Soil erosion significantly decreases aggregate-associated OC and N in agricultural soils of Northeast China. Agric. Ecosyst. Environ. 2022, 323, 107677. [Google Scholar] [CrossRef]
- Morris, E.K.; Morris, D.J.P.; Vogt, S.; Gleber, S.C.; Bigalke, M.; Wilcke, W.; Rillig, M.C. Visualizing the dynamics of soil aggregation as affected by arbuscular mycorrhizal fungi. ISME J. 2019, 13, 1639–1646. [Google Scholar] [CrossRef]
- Zheng, J.Y.; Zhao, J.S.; Shi, Z.H.; Wang, L. Soil aggregates are key factors that regulate erosion-related carbon loss in citrus orchards of southern China: Bare land vs. grass-covered land. Agric. Ecosyst. Environ. 2021, 309, 107254. [Google Scholar] [CrossRef]
- Ren, C.; Liu, K.; Dou, P.; Shao, X.; Zhang, D.; Wang, K.; Liu, X.; Li, J.; Wang, K. Soil Nutrients Drive Microbial Changes to Alter Surface Soil Aggregate Stability in Typical Grasslands. J. Soil Sci. Plant Nutr. 2022, 22, 4943–4959. [Google Scholar] [CrossRef]
- Wu, Y.; Wang, Q.; Wang, H.; Wang, W.; Zhong, Z.; Di, G. Effects of Poplar Shelterbelt Plantations on Soil Aggregate Distribution and Organic Carbon in Northeastern China. Forests 2022, 13, 2156. [Google Scholar] [CrossRef]
- Tariq, M.; Liu, Y.; Rizwan, A.; Shoukat, C.A.; Aftab, Q.; Lu, J.; Zhang, Y. Impact of elevated CO2 on soil microbiota: A meta-analytical review of carbon and nitrogen metabolism. Sci. Total Environ. 2024, 950, 175354. [Google Scholar] [CrossRef] [PubMed]
- Xue, B.; Huang, L.; Li, X.; Lu, J.; Gao, R.; Kamran, M.; Fahad, S. Effect of clay mineralogy and soil organic carbon in aggregates under straw incorporation. Agronomy 2022, 12, 534. [Google Scholar] [CrossRef]
- Ni, S.; Wen, H.; Wilson, G.V.; Cai, C.; Wang, J. A simulated study of surface morphological evolution on coarse-textured soils under intermittent rainfall events. Catena 2022, 208, 105767. [Google Scholar] [CrossRef]
- Wang, K.; Ma, Z.; Qin, W.; Li, X.; Shi, H.; Hasi, B.; Liu, X. Soil nutrients and pH modulate carbon dynamics in particulate and mineral-associated organic matter during restoration of a Tibetan alpine grassland. Ecol. Eng. 2025, 212, 107522. [Google Scholar] [CrossRef]
- Hu, Y.; Ao, G.; Feng, J.; Chen, X.; Zhu, B. The patterns of forest soil particulate and mineral associated organic carbon characteristics with latitude and soil depth across eastern China. For. Ecosyst. 2025, 12, 100291. [Google Scholar] [CrossRef]
- Kang, H.; Kim, S.Y.; Fenner, N.; Freeman, C. Shifts of soil enzyme activities in wetlands exposed to elevated CO2. Sci. Total Environ. 2005, 337, 207–212. [Google Scholar] [CrossRef]
- Xu, Q.; Wang, X.; Tang, C. The effects of elevated CO2 and nitrogen availability on rhizosphere priming of soil organic matter under wheat and white lupin. Plant Soil 2018, 425, 375–387. [Google Scholar] [CrossRef]
- Jin, J.; Krohn, C.; Franks, A.E.; Wang, X.; Wood, J.L.; Petrovski, S.; McCaskill, M.; Batinovic, S.; Xie, Z.; Tang, C. Elevated atmospheric CO2 alters the microbial community composition and metabolic potential to mineralize organic phosphorus in the rhizosphere of wheat. Microbiome 2022, 10, 12. [Google Scholar] [CrossRef]
- Rousk, J.; Bååth, E.; Brookes, P.C.; Lauber, C.L.; Lozupone, C.; Caporaso, J.G.; Knight, R.; Fierer, N. Soil bacterial and fungal communities across a pH gradient in an arable soil. ISME J. 2010, 4, 1340–1351. [Google Scholar] [CrossRef]
- Zak, D.R.; Holmes, W.E.; Finzi, A.C.; Norby, R.J.; Schlesinger, W.H. Soil nitrogen cycling under elevated CO2: A synthesis of forest FACE experiments. Ecol. Appl. 2003, 13, 1508–1514. [Google Scholar] [CrossRef]
- Zhong, Y.; Yan, W.; Canisares, L.P.; Wang, S.; Brodie, E.L. Alterations in soil pH emerge as a key driver of the impact of global change on soil microbial nitrogen cycling: Evidence from a global meta-analysis. Glob. Ecol. Biogeogr. 2023, 32, 145–165. [Google Scholar] [CrossRef]
- Yang, Y.; Li, T.; Wang, Y.; Cheng, H.; Chang, S.X.; Liang, C.; An, S. Negative effects of multiple global change factors on soil microbial diversity. Soil Biol. Biochem. 2021, 156, 108229. [Google Scholar] [CrossRef]
- Shen, F.F.; Liu, Y.; Luo, C.T.; Liu, W.F.; Duan, H.; Liao, Y.; Wu, C.; Fan, H. Research progress on response and adaptation of plant and soil microbial community diversity to global change in terrestrial ecosystem. Ecol. Environ. Sci. 2019, 28, 2129–2140. [Google Scholar]
- Jin, J.; Krohn, C.; Davis, R.; Franks, A.E.; Wang, X.; Wood, J.L.; Tang, C. Clarifying the role of microbial communities in carbon loss from rhizosphere priming of contrasting crop species under elevated atmospheric CO2. Plant Soil 2025, 515, 1047–1063. [Google Scholar] [CrossRef]
- Fan, C.Q.; Chen, J.; Zhang, Y.X.; Xiang, X.J.; Zhang, F. Effects of elevated CO2 concentration on soil carbon degrading enzyme activity and soil organic carbon. Acta Ecol. Sin. 2025, 45, 3192–3203. [Google Scholar]
- Frostegård, Å.; Tunlid, A.; Bååth, E. Use and misuse of PLFA measurements in soils. Soil Biol. Biochem. 2011, 43, 1621–1625. [Google Scholar] [CrossRef]


Disclaimer/Publisher’s Note: The statements, opinions and data contained in all publications are solely those of the individual author(s) and contributor(s) and not of MDPI and/or the editor(s). MDPI and/or the editor(s) disclaim responsibility for any injury to people or property resulting from any ideas, methods, instructions or products referred to in the content. |
© 2025 by the authors. Licensee MDPI, Basel, Switzerland. This article is an open access article distributed under the terms and conditions of the Creative Commons Attribution (CC BY) license (https://creativecommons.org/licenses/by/4.0/).