Abstract
Exserohilum rostratum is a causal agent of severe maize leaf spot, posing a threat to maize production. Carbohydrate esterase (CE) can catalyze the removal of acyl modifications from plant cell wall polysaccharides, thereby promoting polysaccharide hydrolysis. A total of 87 CE genes were identified in the E. rostratum ER1 genome. In this study, we conducted a comprehensive analysis of the E. rostratum CE (ErCE) genes, including physicochemical properties, structural features, promoter cis-acting regulatory elements, and functional analysis. Subcellular localization analysis revealed that more than half of ErCEs were located extracellular. ErCEs contain abundant conserved domains, indicating functional diversity of these proteins. The promoter region of ErCE genes contains a rich variety of cis-acting regulatory elements related to plant hormone regulation, stress response, and developmental processes. Functional enrichment analysis indicated that ErCE genes are predominantly involved in metabolic pathways. In addition, the expression pattern revealed significant changes in ErCE genes during E. rostratum infection, indicating that they play an important role in pathogen invasion and lesion expansion. Overall, this study elucidated the structural characteristics and expression patterns of the CE genes in E. rostratum, providing conditions for further exploration of their roles in fungal pathogenesis and laying the foundation for the improvement of sustainable agricultural systems using related genes.
1. Introduction
Carbohydrates are the primary energy source required for sustaining life activities and play a central role in the physiology of living organisms [1]. Based on sequence characteristics, carbohydrate-active enzymes (CAZymes) in the CAZy database are divided into six categories: glycoside hydrolases (GHs), glycosyltransferases (GTs), carbohydrate esterases (CEs), polysaccharide lyases (PLs), carbohydrate-binding modules (CBMs), and auxiliary activities (AAs). As an important member of the CAZyme family, CEs play essential roles in diverse biological processes [2]. CEs catalyze the removal of ester modifications from polysaccharides, thereby enhancing the efficiency of glycoside hydrolases in degrading complex polysaccharides [3,4,5]. CEs have significant structural diversity and can catalyze the deacetylation of various polysaccharides, including chitin and plant hemicellulose [3].
The most abundant polysaccharides in nature are cellulose and hemicelluloses, which constitute plant cell walls, and chitin, which is distributed in fungal cell walls and arthropod exoskeletons [6,7,8,9,10]. These macromolecular polysaccharides provide structural support to cell walls and form a physical defense barrier, thereby enabling organisms to resist infection by external pathogenic microorganisms [11,12]. In plant cell wall polysaccharides, CEs hydrolyze O-acetyl modifications, thereby increasing the accessibility of these polymers to enzymatic degradation [3,13]. Pathogens can breach the multilayered structural barrier of plant cell walls and achieve invasion through deacetylation and cell wall-degrading enzymes that hydrolyze polysaccharide components such as cellulose, pectin, and xylan [9].
Maize is one of the three major staple crops worldwide and plays a vital role in ensuring global food security [14,15,16,17,18,19]. E. rostratum can infect a wide range of crops, and the maize leaf spot it causes is destructive in major production areas [20,21]. Surprisingly, this fungus has also been reported as an opportunistic human and animal pathogen [22,23,24]. At present, effectively controlling the damage caused by E. rostratum remains a major challenge. Biological and genetic control strategies, owing to their safety and efficiency, offer promising options for agricultural disease management [25,26,27]. Analysis of pathogenic factors associated with E. rostratum can provide valuable targets for the development of safe and efficient novel control agents, while also establishing a theoretical basis for breeding disease-resistant maize varieties.
In this study, we identified all ErCE genes in the E. rostratum ER1 genome and analyzed their physicochemical properties. Phylogenetic analysis was conducted based on the ErCE protein sequences, and their structural characteristics were further studied using bioinformatics methods. To explore the potential functions of ErCE genes, we analyzed the cis-acting regulatory elements in the promoter regions of these genes and further analyzed their expression patterns during fungal infection. These integrated analyses provide a foundation for further elucidation of the biological functions of ErCE genes in pathogen–host interactions.
2. Materials and Methods
2.1. Identification and Analysis of ErCE Genes
To identify CE family genes in E. rostratum ER1, we retrieved its genome (GenBank accession number: JAHUAD000000000), with detailed annotation results available in a public repository (https://zenodo.org/deposit/5386693, accessed on 5 August 2025). CE proteins in the E. rostratum ER1 genome were identified using the CAZy database with an E-value < 1 × 10⁻⁵ [2,28]. The physicochemical properties of ErCE proteins were subsequently predicted using the ExPASy ProtParam tool (https://web.expasy.org/protparam/, accessed on 5 August 2025) [29]. To further predict the potential subcellular localization of these proteins, we used the PSORT prediction server (https://wolfpsort.hgc.jp, accessed on 5 August 2025).
2.2. Multiple Sequence Alignment and Phylogenetic Analysis
To analyze the evolutionary relationships of ErCE proteins, all sequences were aligned using MAFFT [30]. The resulting alignment was then imported into PhyloSuite v1.2.3 [31] for Maximum Likelihood (ML) phylogenetic tree reconstruction. The ModelFinder module was used to select the best-fit substitution model. ML reconstruction was performed using WAG + I + G4 model with 1000 bootstrap replicates to assess branch support. The phylogenetic tree was subsequently uploaded to the Evolview platform (https://evolgenius.info//evolview-v2/, accessed on 7 August 2025) for visualization and refinement [32].
2.3. Gene Structure and Protein Domain Analysis
The gene structures of ErCE genes were predicted and visualized using the Gene Structure Display Server (GSDS) [33]. This analysis provided a clear illustration of exon numbers and intron distribution features of each ErCE gene. To identify the motifs in ErCE proteins, their amino acid sequences were analyzed using the Multiple Em for Motif Elicitation (MEME) Suite online platform [34], with the number of motifs set to 10 in the parameter settings. The conserved domains of the protein sequences were predicted using the NCBI Conserved Domain Database (CDD) via the CD-Search tool (https://www.ncbi.nlm.nih.gov/Structure/bwrpsb/bwrpsb.cgi, accessed on 7 August 2025) with default parameters and subsequently visualized using TBtools-II v2.326 [35,36].
2.4. Promoter Region Analysis and Gene Ontology (Go) Annotation
The 2000 bp upstream sequences of ErCE genes were extracted using TBtools-II (v2.326). Cis-acting regulatory elements (CAREs) within these upstream sequences were predicted using PlantCARE [37] and subsequently visualized with TBtools-II (v2.326). To further investigate the functional characteristics of ErCE genes, GO enrichment analysis was performed using the OmicShare bioinformatics platform [38].
2.5. Analysis of ErCE Expression Patterns
Based on previous studies, we conducted the detached leaf assay for evaluating transcriptome changes during infection [21,39]. Leaves of healthy 3-week-old maize plants (B73 inbred line) were cut into fragments of approximately 3–4 cm and placed in Petri dishes lined with sterile filter paper moistened with sterile distilled water to maintain high humidity. Leaf fragments were inoculated with a conidial suspension (1 × 10⁵ conidia/μL). After 24 h of pathogen inoculation, the hyphae of the pathogen mainly invade through stomata. After 48 h, the mycelium has penetrated the host cell, causing structural damage, tissue browning, and widespread necrosis. After 72 h, dense lesions appeared on the leaves and sheaths, indicating severe disease progression (unpublished data). The samples collected at 0 h served as the spore control, while infected samples were harvested at 24, 48, and 72 h post-inoculation for further analysis. Inoculated samples were incubated in a controlled growth chamber at 25 °C under a 12 h light/12 h dark photoperiod with relative humidity ≥ 90%. Three biological replicates were included for each time point. After collection, samples were immediately frozen in liquid nitrogen and sent to Novogene Co., Ltd. (Beijing, China) for total RNA extraction and transcriptome sequencing. Differential expressions of ErCE genes were visualized by generating heatmaps based on FPKM values using TBtools-II (v2.326), thereby illustrating their expression patterns.
2.6. RT-qPCR
Total RNA was extracted from the spore and the maize leaf samples collected at 24, 48, and 72 h after spore inoculation using the RC411-01 Total RNA Extraction Kit (Vazyme, Nanjing, China). First-strand complementary DNA (cDNA) was synthesized using the HiScript IV RT SuperMix for qPCR (+gDNA wiper) (Vazyme, Nanjing, China), according to the manufacturer’s instructions. Primers were designed using the Primer3Plus online tool (https://primer3plus.com, accessed on 10 August 2025), with product lengths set to 150–250 bp and other parameters at default values. Primer specificity and potential dimer formation were assessed using TBtools-II (v2.326). The final primer sequences were provided in Supplementary Table S4. Quantitative PCR (qPCR) was performed using ChamQ Blue Universal SYBR qPCR Master Mix (Vazyme, Nanjing, China) in a 20 μL reaction system containing 10 μL of 2× SYBR Green Master Mix, 0.4 μL each of forward and reverse primers (10 μM), 2 μL of diluted cDNA template, and 7.2 μL of RNase-free water. The amplification program consisted of an initial denaturation at 95 °C for 30 s, followed by 40 cycles of 95 °C for 10 s and 60 °C for 30 s (annealing/extension). Three biological replicates were conducted for each sample, with three technical replicates per biological replicate. Relative expression levels were calculated using the 2−ΔΔCt method [40], and the results were visualized with GraphPad Prism 10.5.
3. Results
3.1. Identification and Physicochemical Property Analysis of Carbohydrate Esterase Genes
A total of 87 ErCE genes were identified in the E. rostratum ER1 genome (designated ErCE1–ErCE87), and their physicochemical properties were evaluated. The detailed characteristics were provided in Table 1. ErCE proteins belong to 12 different superfamilies, with 26 ErCE proteins belonging to CE10, 22 belonging to CE1, and 15 belonging to CE5. The molecular weights of these proteins ranged from 20.48 kDa (ErCE16) to 155.35 kDa (ErCE49). The length of these proteins ranged from 206 to 1399 amino acid. The predicted isoelectric points (pI) of these proteins ranged from 4.95 (ErCE31) to 9.51 (ErCE64), comprising 46 acidic proteins (pI < 6.5), 32 basic proteins (pI > 7.5), and 9 neutral proteins (6.5 < pI < 7.5). The grand average of hydropathicity (GRAVY) values ranged from −0.63 (ErCE63) to 0.32 (ErCE16), with 72 proteins predicted to be hydrophilic (GRAVY ≤ 0) and 15 predicted to be hydrophobic (GRAVY > 0). Subcellular localization analysis revealed that ErCE proteins were predominantly distributed in the extracellular space (45), cytoplasm (19), and mitochondria (15). Collectively, these results indicate that the CE proteins in E. rostratum exhibit complex composition and diverse physicochemical properties, suggesting their potential roles in fungal growth, development, and pathogenicity.

Table 1.
Predicted physicochemical characteristics and subcellular localization of ErCE proteins in E. rostratum.
3.2. Phylogenetic Analysis
To investigate the evolutionary relationships among 87 ErCE proteins, a phylogenetic tree was constructed using the ML method in PhyloSuite v1.2.3. As shown in Figure 1, the ErCE proteins were divided into six groups, with most members distributed in Group I and Group II. Group I contained the largest number of members (34), followed by Group II (29), while Group VI had the fewest members (1). The distribution of ErCE proteins among different groups reflects the sequence diversity within the CE family. ErCE sequences located in the same group have closer evolutionary relationships, while ErCE sequences located in different groups have farther evolutionary relationships.
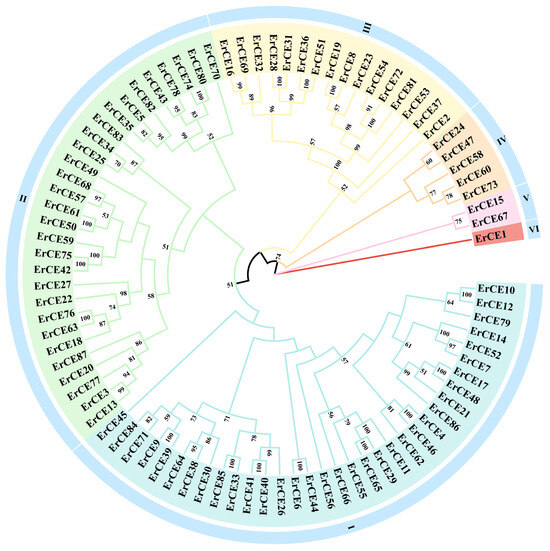
Figure 1.
Maximum likelihood phylogenetic tree based on ErCE protein sequences. “Er” denotes E. rostratum. The bootstrap values below 50% have been cut off. Based on the phylogenetic tree, all ErCE proteins were classified into six groups, designated as Group I to Group VI.
3.3. Structural Analysis of ErCEs
The results of gene structural analysis showed that ErCE30 and ErCE25 each contained six introns, whereas 30 ErCE genes lacked introns (Figure 2A). Genes lacking introns may exhibit higher transcriptional efficiency [41], while genes containing a greater number of introns may play important roles in splicing regulation, thereby increasing protein diversity and complexity [42]. This variation among ErCE genes suggests potential intron loss and gain events during the evolutionary trajectory of the family, which may contribute to functional divergence. To further analyze the characteristics of ErCE proteins, the domain analyses were conducted. ErCE proteins were found to contain a wide range of conserved superfamily domains, mainly including the Abhydrolase superfamily (35), SGNH_hydrolase superfamily (10), LpqC superfamily (7), and others (Figure 2B). Notably, the Abhydrolase superfamily was widely distributed among the family members, suggesting its potential importance in plant cell wall degradation.
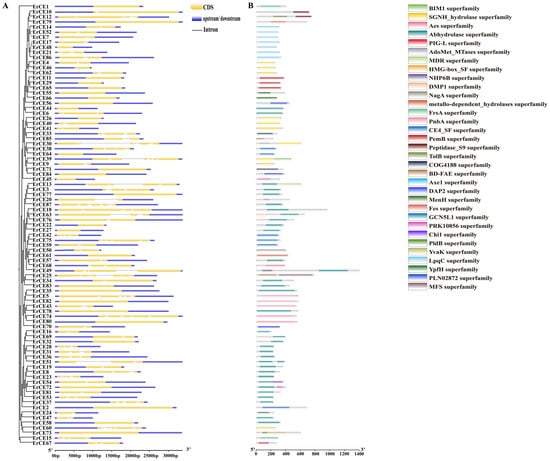
Figure 2.
Gene structure and domain analysis of ErCEs. (A) Exon–intron structures of ErCEs. Blue boxes represent untranslated regions (UTRs); yellow boxes represent exons; black lines represent introns. (B) Domain organization of ErCE proteins. Colored rectangles indicate superfamily domains of ErCEs.
To further investigate conserved motifs of ErCE proteins, the analysis was carried out using the MEME tool, and 10 distinct motifs were identified (Figure 3 and Figure S1; Table S1). The results revealed that the number and arrangement of motifs in the ErCE proteins were different. Sixty-two ErCE proteins contained motif 1 and thirty-one contained motif 5, indicating that these two motifs are highly conserved within the family and may constitute core functional regions of the proteins. Proteins sharing similar motif compositions generally exhibited closer evolutionary relationships and may possess similar functional characteristics.
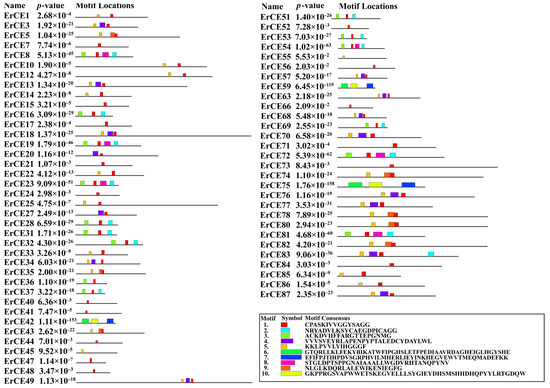
Figure 3.
Motif prediction of ErCEs using MEME. Boxes in different colors represent distinct motifs that vary in size and sequence.
3.4. Analysis of Promoter Regulatory Elements of ErCEs
CARE analysis of the 2000 bp upstream promoter regions of ErCE genes was performed using PlantCARE. The results revealed that the promoters of ErCE genes harbor numerous CAREs associated with plant hormonal regulation, light responsiveness, defense, and stress responses (Figure 4 and Figure S2; Table S2). Light-responsive elements included G-box (399), Sp1 (97), TCT-motif (68), GT1-motif (54), GATA-motif (31), Box 4 (24), and ATCT-motif (10), suggesting that light signaling may be associated with ErCE genes. Plant hormone-related CAREs were also abundant, particularly ABRE (335) related to abscisic acid (ABA), as well as CGTCA-motif (346) and TGACG-motif (346) related to methyl jasmonate (MeJA), suggesting these ErCE genes may be involved in ABA- and MeJA-mediated signaling pathways. Other plant hormone-responsive elements included the auxin-responsive TGA-element (100) and AuxRR-core (16), the gibberellin-responsive P-box (42) and GARE-motif (19), and the salicylic acid–responsive TCA-element (32), implying that ErCE genes may participate in multiple plant hormone signaling networks. Several stress-related CAREs were also identified, including ARE (107) and GC-motif (61) associated with anaerobic induction, LTR (67) related to low-temperature responsiveness, MBS (81) involved in drought inducibility, and TC-rich repeats (18) connected to broad-spectrum stress and defense responses. These findings suggest that ErCE genes may play critical regulatory roles in mediating the responses of E. rostratum to diverse environmental stresses. In addition, development- and metabolism-related CAREs were detected, including CAT-box (78) related to meristem expression, CCAAT-box (105) serving as a binding site for MYB transcription factors, and O2-site (71) associated with zein metabolism regulation, suggesting that these ErCE genes may function in specific tissues or developmental stages.
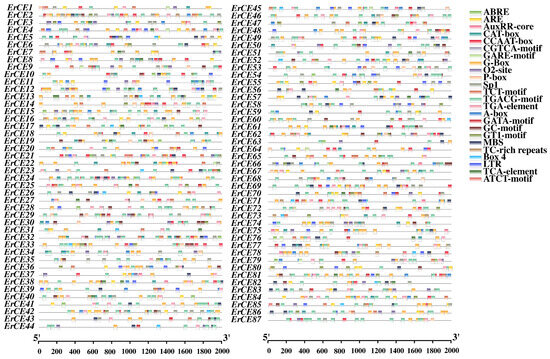
Figure 4.
Cis-acting regulatory element (CARE) analysis in promoter regions of ErCE genes. Colored boxes represent different CAREs and their corresponding positions.
3.5. GO Enrichment Analysis of ErCE Genes
GO enrichment analysis revealed that ErCE genes were primarily enriched in metabolic process (GO:0008152), cellular component organization or biogenesis (GO:0071840), localization (GO:0051179), cellular process (GO:0009987), and biological process (GO:0008150) (Figure 5; Table S3). Among these, the most genes were significantly enriched in metabolic process (GO:0008152), suggesting that the ErCE genes mainly take part in metabolic regulation.
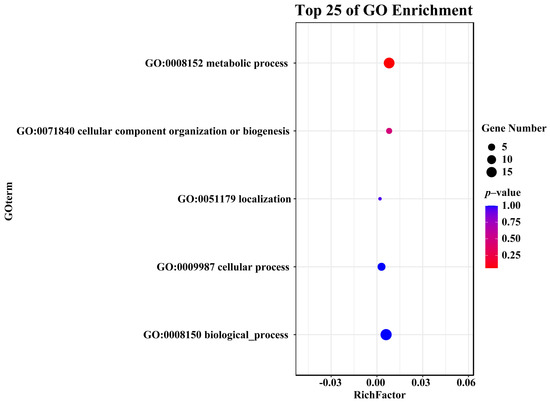
Figure 5.
Gene ontology enrichment analysis of ErCE genes.
3.6. Expression Pattern Analysis of ErCE Genes
We analyzed the expression pattern of ErCE genes at different times (0, 24, 48 and 72 h) during the infection process. ErCE genes were grouped into five clusters (Clusters I–V) based on their expression changes (Figure 6). Genes in Cluster I exhibited high expression at 0 and 24 h, suggesting their potential roles mainly focus on fungal growth, development, and early adhesion. Genes in Cluster II showed high expression at 0 h, indicating the function of these genes is primarily associated with fungal growth and development. Genes in Cluster III were significantly upregulated at 24 h, implying these genes were involved in the early stages of host infection and pathogen colonization. Genes in Cluster IV displayed pronounced upregulation at 48 h, suggesting their function was associated with pathogen expansion in host tissues during the biotrophic stage. Genes in Cluster V were highly expressed at 72 h, indicating their potential function was involved in late-stage lesion development. To validate the transcriptome data, ten ErCE genes were randomly selected, and specific primers were designed for RT-qPCR (Table S4). GAPDH was used as the internal reference gene to normalize the RT-qPCR data. The expression patterns obtained from RT-qPCR were consistent with the transcriptome data, confirming the reliability of RNA-seq data (Figure 7). Collectively, the differential expression of ErCE genes at distinct time points suggests that their functions have shown a clear differentiation, including host penetration, maintenance of essential physiological activities, and late-stage lesion development.
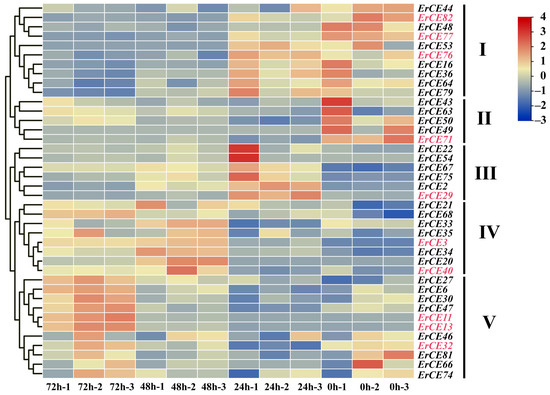
Figure 6.
Expression pattern of ErCE genes based on RNA-seq data. Red and blue indicate high and low expression levels of ErCEs, respectively. Genes with no detectable expression are not shown. These ErCE genes were grouped into five clusters (I–V) based on the expression pattern.
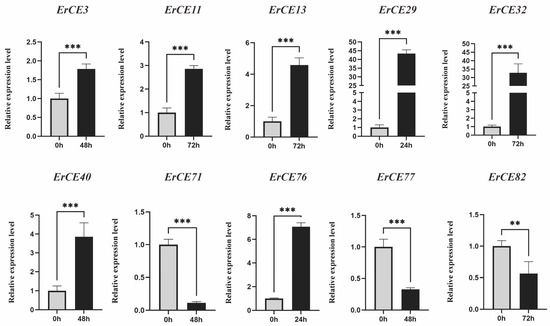
Figure 7.
RT-qPCR validation of ErCE expressions. Bar charts represent the mean ± standard error (SE) of three technical replicates (** p < 0.01,*** p < 0.001).
4. Discussion
CEs play an important role in the degradation of plant cell walls and promote the invasion of pathogens into plant tissues [13]. Therefore, the systematic identification and functional analysis of CE genes in E. rostratum can not only provide insights into the mechanism of plant cell wall disruption mediated by CEs but also establish a foundation for identifying potential targets for disease management.
In this study, a total of 87 ErCEs were identified in this study. Compared with another corn pathogenic fungus, Colletotrichum graminicola, the total number of CE genes in E. rostratum is significantly reduced. According to a previous report, there are 128 CE genes in C. graminicola [28], and the difference in the number of CE genes between the two corn pathogenic fungi may be closely related to their different taxonomic positions. All ErCEs were classified into different superfamilies. Among them, CE1, CE5, and CE10 had the most members, which were capable of degrading diverse substrates and thereby contributing to plant cell wall degradation and pathogen invasion [43,44]. Most ErCE proteins exhibited hydrophilic and acidic properties. Subcellular localization analysis indicated that these proteins were localized at different positions, suggesting functional diversification across different cellular compartments. Specifically, 45 ErCE proteins were predicted to be secreted into the extracellular space, where they are likely involved in plant cell wall degradation and infection. This observation is consistent with the known functions of CEs, which primarily act on cell walls and play critical roles in plant tissue invasion [13]. In addition, 15 ErCE proteins were predicted to localize to mitochondria. As essential organelles in eukaryotic cells, mitochondria are responsible for ATP production and participate in multiple key physiological processes [45]. Previous studies have demonstrated that fungal energy demand increases significantly during infection, and that mitochondrial function is crucial for fungal pathogenicity [46,47,48]. Therefore, these mitochondria-localized ErCE proteins may contribute to metabolic regulation and enhance the capability of infection and environmental adaptability by modulating energy supply.
The number of introns varied substantially among ErCE genes. For example, ErCE30 and ErCE25 contained six introns, whereas 30 ErCE genes lacked introns. Genes with fewer introns mean more compact structures that are generally associated with higher transcriptional efficiency [41,49], whereas ErCE genes with a larger number of introns may play important roles in the regulation of alternative splicing [42]. All differentially expressed ErCE genes were assigned to 10 different subfamilies, exhibiting remarkable structural and functional diversity. The subfamily diversity indicates that ErCEs may cooperate through diverse metabolic pathways or substrate recognition mechanisms to facilitate infection and host adaptation. In addition, six differentially expressed genes encode proteins with two different structural domains, indicating that these genes may have multifunctional properties and may play a broader role in the interaction between pathogens and plants. This structural diversity likely reflects functional divergence within the ErCE genes, and this is worthy of in-depth research.
Because protein motifs are closely associated with biological functions, they are likely to participate in processes such as pathogenicity, cell wall degradation, and immunity [50]. Motif analysis of ErCE proteins revealed that proteins in the same group generally shared similar motifs, suggesting that they may perform similar functions. GO enrichment analysis showed that 17 ErCE genes were enriched in metabolic processes. Eleven protein sequences encoded by these genes contained motif 1, indicating that motif 1 may be related to metabolic function. It is worth noting that among the 40 differentially expressed gene-encoded protein sequences, 29 contain motif 1, indicating that this motif may be closely related to the pathogenicity of fungi. In addition, ErCE proteins were found to possess diverse domains, with the Abhydrolase superfamily being the most prevalent. Previous studies have shown that the Abhydrolase superfamily was closely related to pathogenicity, and its knockout results in a significant reduction in virulence [51]. The widespread distribution of the Abhydrolase superfamily among ErCE proteins suggests that this domain may contribute to plant cell wall degradation and pathogen infection [9]. Nearly half of the differentially expressed genes encode protein sequences containing the Abhydrolase superfamily domain, indicating their potential involvement in host cell wall degradation and adaptation to host defense mechanisms.
CAREs in promoter regions generally exert a significant influence on gene function [52,53]. Numerous studies have demonstrated that CAREs play critical roles in regulating gene expression [54,55,56]. For instance, deletion of light-responsive elements has been shown to reduce fungal pathogenicity [57], suggesting that these elements may influence virulence by regulating gene expression. In this study, a large number of light-responsive elements were identified, revealing that photoperiod may contribute to the regulation of ErCE expressions. Fungi can also secrete proteins that target plant hormones to facilitate infection [58]. Therefore, the abundance of plant hormone-related elements identified in this study may help fungi influence host defense mechanisms. In addition, CAREs associated with hypoxia, drought, defense, and low-temperature responses were detected. Collectively, the identified CAREs provide valuable insights into the mechanisms of how pathogens regulate growth and development, respond to stress, and adapt to external environments.
Based on subcellular localization analysis, six genes enriched in metabolic processes are located in the cytoplasm, indicating that they may mainly participate in intracellular metabolic activities, while seven genes are extracellular, indicating that they may act as secretory enzymes on the host plant cell wall. Moreover, gene function is often correlated with expression levels [59,60,61]. For example, maize pathogen Cochliobolus heterostrophus, genes associated with asexual development and virulence were identified through infection-specific transcriptional patterns [39]. In this study, we tested the expression profiles of ErCE genes throughout the infection process. Some ErCE genes were highly expressed at 24 h, whereas others were upregulated at 72 h, implying different expression patterns involved in the early stage of infection and lesion expansion. The differential expression of ErCE genes across infection stages further revealed the functional diversity of the gene family. Among the proteins encoded by differentially expressed genes, 19 proteins were located in the extracellular space, 9 proteins were located in the cytoplasm, and 8 proteins were located in the mitochondria. They might play different roles in the process of pathogen invasion of the host. For example, extracellular localized ErCE32 might be secreted to participate in pathogen invasion, while mitochondrial ErCE76 might be involved in energy metabolism or stress response. In addition, ErCE13 contained domains belonging to the Abhydrolase superfamily and MDR (multidrug resistance) superfamily, located in the cytoplasm, indicating that it might be primarily involved in metabolic regulation, intracellular signal transduction, and protein processing.
In recent years, the interactions between maize and major pathogenic fungi have attracted considerable attention. The systematic study of the ErCE genes not only deepens our understanding of the pathogenic mechanism of E. rostratum but also provides conditions for the development of targeted biopesticides and the improvement of sustainable agricultural systems using related genes. Through bioinformatics analysis, we characterized the composition and physicochemical properties of the ErCE genes and performed a preliminary functional assessment. However, the current conclusions are primarily derived from bioinformatics predictions and lack direct experimental validation. Future studies should focus on identifying key pathogenicity-related genes and verifying their functions through gene knockout or overexpression. In addition, elucidating the relationship between the ErCE genes and maize immune responses will be critical for uncovering the regulatory networks underlying the infection process.
5. Conclusions
In this study, we conducted a comprehensive analysis of the ErCE genes during E. rostratum infection in maize. A total of 87 ErCE genes were identified, and their physicochemical properties as well as subcellular localization were predicted. The various structural domains included in ErCE protein sequences indicated that their functions might be diverse. The promoter regions of the ErCE genes contain abundant CAREs, which are often associated with growth and development, pathogenicity, and biotic and abiotic stress. GO enrichment analysis indicated that ErCE genes play key roles in metabolic processes. Transcriptome analysis demonstrated that ErCE genes exhibited distinct expression patterns across different infection stages, implying they were involved in multiple phases of the infection process. Collectively, this study not only deepens our understanding of the ErCE genes but also provides conditions for the development of biopesticides and the improvement of sustainable agricultural systems.
Supplementary Materials
The following supporting information can be downloaded at: https://www.mdpi.com/article/10.3390/microorganisms13112588/s1, Table S1. ErCE genomic, CDS, protein and promoter sequences. Table S2. Cis-acting regulatory elements are present in the ErCE gene promoter regions. Table S3. Gene ontology enrichment analysis of ErCE genes. Table S4. The primers used in this study. Figure S1. Sequence logo conserved motif of ErCE proteins. Figure S2. The numbers of predicted CAREs in the ErCE promoter regions.
Author Contributions
H.-L.L. and Y.-F.W. designed and directed the research. Z.-M.W., Z.-Q.W., H.-X.Y., M.-J.L., C.C. and J.-G.K. performed the experiments. Z.-M.W. and Z.-Q.W. wrote the original draft. Y.-F.W. and H.-L.L. revised and polished the manuscript. All authors have read and agreed to the published version of the manuscript.
Funding
This study was supported by the Key Research and Development Project of Henan Province (231111111100); National Key Research and Development Program of China (2023YFD1401500); Henan Province Corn Industry Technology System Plant Protection Post Scientists Research Special Project (HARS-22-02-G3).
Institutional Review Board Statement
Not applicable.
Informed Consent Statement
Not applicable.
Data Availability Statement
The original contributions presented in this study are included in the article/Supplementary Materials. Further inquiries can be directed to the corresponding authors.
Conflicts of Interest
The authors declare no conflicts of interest.
References
- Kiely, L.J.; Hickey, R.M. Characterization and analysis of food-sourced carbohydrates. Methods Mol. Biol. 2022, 2370, 67–95. [Google Scholar]
- Cantarel, B.L.; Coutinho, P.M.; Rancurel, C.; Bernard, T.; Lombard, V.; Henrissat, B. The carbohydrate-active enzymes database (CAZy): An expert resource for glycogenomics. Nucleic Acids Res. 2009, 37, D233–D238. [Google Scholar] [CrossRef] [PubMed]
- Sista Kameshwar, A.K.; Qin, W. Understanding the structural and functional properties of carbohydrate esterases with a special focus on hemicellulose deacetylating acetyl xylan esterases. Mycology 2018, 9, 273–295. [Google Scholar] [CrossRef] [PubMed]
- Sista Kameshwar, A.K.; Qin, W. Structural and functional properties of pectin and lignin–carbohydrate complexes de-esterases: A review. Bioresour. Bioprocess. 2018, 5, 43–58. [Google Scholar] [CrossRef]
- Liu, Y.; Li, T.; Zhu, H.; Cao, L.; Liang, L.; Liu, D.; Shen, Q. Methionine inducing carbohydrate esterase secretion of Trichoderma harzianum enhances the accessibility of substrate glycosidic bonds. Microb. Cell Fact. 2024, 23, 120–136. [Google Scholar] [CrossRef] [PubMed]
- Caffall, K.H.; Mohnen, D. The structure, function, and biosynthesis of plant cell wall pectic polysaccharides. Carbohydr. Res. 2009, 344, 1879–1900. [Google Scholar] [CrossRef]
- Sandhu, A.P.S.; Randhawa, G.S.; Dhugga, K.S. Plant cell wall matrix polysaccharide biosynthesis. Mol. Plant 2009, 2, 840–850. [Google Scholar] [CrossRef]
- Ahmad, S.I.; Ahmad, R.; Khan, M.S.; Kant, R.; Shahid, S.; Gautam, L.; Hasan, G.M.; Hassan, M.I. Chitin and its derivatives: Structural properties and biomedical applications. Int. J. Biol. Macromol. 2020, 164, 526–539. [Google Scholar] [CrossRef] [PubMed]
- Wan, J.; He, M.; Hou, Q.; Zou, L.; Yang, Y.; Wei, Y.; Chen, X. Cell wall associated immunity in plants. Stress Biol. 2021, 1, 3–17. [Google Scholar] [CrossRef]
- Municio-Diaz, C.; Muller, E.; Drevensek, S.; Fruleux, A.; Lorenzetti, E.; Boudaoud, A.; Minc, N. Mechanobiology of the cell wall—Insights from tip-growing plant and fungal cells. J. Cell Sci. 2022, 135, jcs259208–jcs259221. [Google Scholar] [CrossRef]
- Vorwerk, S.; Somerville, S.; Somerville, C. The role of plant cell wall polysaccharide composition in disease resistance. Trends Plant Sci. 2004, 9, 203–209. [Google Scholar] [CrossRef]
- Swaminathan, S.; Lionetti, V.; Zabotina, O.A. Plant cell wall integrity perturbations and priming for defense. Plants 2022, 11, 3539. [Google Scholar] [CrossRef]
- Fries, M.; Ihrig, J.; Brocklehurst, K.; Shevchik, V.E.; Pickersgill, R.W. Molecular basis of the activity of the phytopathogen pectin methylesterase. EMBO J. 2007, 26, 3879–3887. [Google Scholar] [CrossRef]
- Shiferaw, B.; Prasanna, B.M.; Hellin, J.; Bänziger, M. Crops that feed the world 6. past successes and future challenges to the role played by maize in global food security. Food Secur. 2011, 3, 307–327. [Google Scholar] [CrossRef]
- Rouf Shah, T.; Prasad, K.; Kumar, P. Maize—A potential source of human nutrition and health: A review. Cogent Food Agric. 2016, 2, 1166995. [Google Scholar] [CrossRef]
- Cheng, A.; Mayes, S.; Dalle, G.; Demissew, S.; Massawe, F. Diversifying crops for food and nutrition security—A case of teff. Biol. Rev. 2017, 92, 188–198. [Google Scholar] [CrossRef] [PubMed]
- Mueller, D.S.; Wise, K.A.; Sisson, A.J.; Allen, T.W.; Bergstrom, G.C.; Bissonnette, K.M.; Bradley, C.A.; Byamukama, E.; Chilvers, M.I.; Collins, A.A.; et al. Corn yield loss estimates due to diseases in the United States and Ontario, Canada, from 2016 to 2019. Plant Health Prog. 2020, 21, 238–247. [Google Scholar] [CrossRef]
- Aman, M. Genetic Variability, Heritability and association of quantitative traits in maize (Zea mays L.) genotypes: Review paper. EAS J. Biotechnol. Genet. 2021, 3, 38–46. [Google Scholar] [CrossRef]
- Peng, Q.; Shen, R.; Li, X.; Ye, T.; Dong, J.; Fu, Y.; Yuan, W. A twenty-year dataset of high-resolution maize distribution in China. Sci. Data 2023, 10, 658–675. [Google Scholar] [CrossRef]
- Li, Q.; Li, M.; Jiang, Y.; Wang, S.; Xu, K.; Liang, X.; Niu, J.; Wang, C. Assessing genetic resistance in wheat to black point caused by six fungal species in the yellow and huai wheat area of China. Plant Dis. 2020, 104, 3131–3134. [Google Scholar] [CrossRef]
- Onwunali, M.R.O.; Mabagala, R.B. First report of leaf blight of maize (Zea mays L.) caused by Exserohilum rostratum in Tanzania. Eur. J. Appl. Physiol. 2022, 10, 476–481. [Google Scholar]
- Katragkou, A.; Pana, Z.D.; Perlin, D.S.; Kontoyiannis, D.P.; Walsh, T.J.; Roilides, E. Exserohilum infections: Review of 48 cases before the 2012 United States outbreak. Med. Mycol. 2014, 52, 376–386. [Google Scholar] [CrossRef]
- Saint-Jean, M.; St-Germain, G.; Laferrière, C.; Tapiero, B. Hospital-acquired phaeohyphomycosis due to Exserohilum rostratum in a child with leukemia. Can. J. Infect. Dis. Med. Microbiol. 2007, 18, 200–202. [Google Scholar] [CrossRef][Green Version]
- Conti Díaz, I.A.; Vargas, R.; Apolo, A.; Moraña, J.A.; Pedrana, G.; Cardozo, E.; Almeida, E. Mycotic bovine nasal granuloma. Rev. Inst. Med. Trop. Sao Paulo 2003, 45, 163–166. [Google Scholar] [CrossRef] [PubMed]
- Lahlali, R.; Ezrari, S.; Radouane, N.; Kenfaoui, J.; Esmaeel, Q.; El Hamss, H.; Belabess, Z.; Barka, E.A. Biological control of plant pathogens: A global perspective. Microorganisms 2022, 10, 596. [Google Scholar] [CrossRef]
- Liu, C.; Kogel, K.-H.; Ladera-Carmona, M. Harnessing RNA interference for the control of Fusarium species: A critical review. Mol. Plant Pathol. 2024, 25, e70011–e70017. [Google Scholar] [CrossRef] [PubMed]
- Imran, M.; Feng, X.; Sun, Z.; Al Omari, H.; Zhang, G.; Zhu, J.; Aldayel, M.F.; Li, C. Nanotechnology-driven gene silencing: Advancements in SIGS–dsRNA technology for sustainable disease management. Chem. Biol. Technol. Agric. 2025, 12, 31–53. [Google Scholar] [CrossRef]
- Zhu, W.; Wang, L.; Li, H.; Shi, Y.; Chang, J.; Wang, S.; Liu, X.; Ma, P.; Zhao, J.; Liu, Y.; et al. Whole-Genome Identification and Analysis of Carbohydrate Esterase Gene Family in Colletotrichum graminicola. Agriculture 2025, 15, 781. [Google Scholar] [CrossRef]
- Wilkins, M.R.; Gasteiger, E.; Bairoch, A.; Sanchez, J.C.; Williams, K.L.; Appel, R.D.; Hochstrasser, D.F. Protein identification and analysis tools in the ExPASy server. Methods Mol. Biol. 1999, 112, 531–552. [Google Scholar] [PubMed]
- Katoh, K.; Rozewicki, J.; Yamada, K.D. MAFFT online service: Multiple sequence alignment, interactive sequence choice and visualization. Brief Bioinform. 2019, 20, 1160–1166. [Google Scholar] [CrossRef]
- Xiang, C.Y.; Gao, F.; Jakovlić, I.; Lei, H.P.; Hu, Y.; Zhang, H.; Zou, H.; Wang, G.T.; Zhang, D. Using PhyloSuite for molecular phylogeny and tree-based analyses. Imeta 2023, 2, e87–e128. [Google Scholar] [CrossRef]
- Subramanian, B.; Gao, S.; Lercher, M.J.; Hu, S.; Chen, W.H. Evolview v3: A webserver for visualization, annotation, and management of phylogenetic trees. Nucleic Acids Res. 2019, 47, W270–W275. [Google Scholar] [CrossRef] [PubMed]
- Hu, B.; Jin, J.; Guo, A.-Y.; Zhang, H.; Luo, J.; Gao, G. GSDS 2.0: An upgraded gene feature visualization server. Bioinformatics 2015, 31, 1296–1297. [Google Scholar] [CrossRef] [PubMed]
- Bailey, T.L.; Boden, M.; Buske, F.A.; Frith, M.; Grant, C.E.; Clementi, L.; Ren, J.; Li, W.W.; Noble, W.S. MEME suite: Tools for motif discovery and searching. Nucleic Acids Res. 2009, 37, W202–W208. [Google Scholar] [CrossRef]
- Marchler-Bauer, A.; Bo, Y.; Han, L.; He, J.; Lanczycki, C.J.; Lu, S.; Chitsaz, F.; Derbyshire, M.K.; Geer, R.C.; Gonzales, N.R.; et al. CDD/SPARCLE: Functional classification of proteins via subfamily domain architectures. Nucleic Acids Res. 2017, 45, D200–D203. [Google Scholar] [CrossRef]
- Chen, C.; Wu, Y.; Li, J.; Wang, X.; Zeng, Z.; Xu, J.; Liu, Y.; Feng, J.; Chen, H.; He, Y.; et al. TBtools-II: A “one for all, all for one” bioinformatics platform for biological big-data mining. Mol. Plant 2023, 16, 1733–1742. [Google Scholar] [CrossRef] [PubMed]
- Lescot, M.; Déhais, P.; Thijs, G.; Marchal, K.; Moreau, Y.; Van de Peer, Y.; Rouzé, P.; Rombauts, S. PlantCARE, a database of plant cis–acting regulatory elements and a portal to tools for in silico analysis of promoter sequences. Nucleic Acids Res. 2002, 30, 325–327. [Google Scholar] [CrossRef] [PubMed]
- Mu, H.; Chen, J.; Huang, W.; Huang, G.; Deng, M.; Hong, S.; Ai, P.; Gao, C.; Zhou, H. OmicShare tools: A zero-code interactive online platform for biological data analysis and visualization. Imeta 2024, 3, e228. [Google Scholar] [CrossRef]
- Yu, H.; Zhang, J.; Fan, J.; Jia, W.; Lv, Y.; Pan, H.; Zhang, X. Infection-specific transcriptional patterns of the maize pathogen Cochliobolus heterostrophus unravel genes involved in asexual development and virulence. Mol. Plant Pathol. 2024, 25, e13413. [Google Scholar] [CrossRef]
- Livak, K.J.; Schmittgen, T.D. Analysis of relative gene expression data using real-time quantitative PCR and the 2−ΔΔCT method. Methods 2001, 25, 402–408. [Google Scholar] [CrossRef]
- Roy, S.W.; Penny, D. Patterns of intron loss and gain in plants: Intron loss–dominated evolution and genome-wide comparison of O. sativa and A. thaliana. Mol. Biol. Evol. 2007, 24, 171–181. [Google Scholar] [CrossRef]
- Aviña-Padilla, K.; Ramírez-Rafael, J.A.; Herrera-Oropeza, G.E.; Muley, V.Y.; Valdivia, D.I.; Díaz-Valenzuela, E.; García-García, A.; Varela-Echavarría, A.; Hernández-Rosales, M. Evolutionary perspective and expression analysis of intronless genes highlight the conservation of their regulatory role. Front. Genet. 2021, 12, 654256–654273. [Google Scholar] [CrossRef] [PubMed]
- De Vries, S.; De Vries, J. A global survey of carbohydrate esterase families 1 and 10 in Oomycetes. Front. Genet. 2020, 11, 756–771. [Google Scholar] [CrossRef] [PubMed]
- Novy, V.; Carneiro, L.V.; Shin, J.H.; Larsbrink, J.; Olsson, L. Phylogenetic analysis and in-depth characterization of functionally and structurally diverse CE5 cutinases. J. Biol. Chem. 2021, 297, 101302–101314. [Google Scholar] [CrossRef]
- Sandor, S.; Zhang, Y.; Xu, J. Fungal mitochondrial genomes and genetic polymorphisms. Appl. Microbiol. Biotechnol. 2018, 102, 9433–9448. [Google Scholar] [CrossRef]
- Li, H.; Liu, Y.; Wang, D.; Wang, Y.-H.; Sheng, R.-C.; Kong, Z.-Q.; Klosterman, S.-J.; Chen, J.-Y.; Subbarao, K.-V.; Chen, F.-M.; et al. The 24-kDa subunit of mitochondrial complex i regulates growth, microsclerotia development, stress tolerance, and virulence in Verticillium dahliae. BMC Biol. 2024, 22, 289–308. [Google Scholar] [CrossRef]
- Hu, Q.-L.; Zhong, H.; Wang, X.-R.; Han, L.; Ma, S.-S.; Li, L.; Wang, Y. Mitochondrial phosphate carrier plays an important role in virulence of Candida albicans. Mycology 2025, 16, 369–381. [Google Scholar] [CrossRef]
- Ni, Y.; Gao, X. Uncovering the role of mitochondrial genome in pathogenicity and drug resistance in pathogenic fungi. Front. Cell. Infect. Microbiol. 2025, 15, 1576485–1576496. [Google Scholar] [CrossRef] [PubMed]
- William Roy, S.; Gilbert, W. The evolution of spliceosomal introns: Patterns, puzzles and progress. Nat. Rev. Genet. 2006, 7, 211–221. [Google Scholar] [CrossRef]
- Calia, G.; Porracciolo, P.; Chen, Y.; Kozlowski, D.; Schuler, H.; Cestaro, A.; Quentin, M.; Favery, B.; Danchin, E.G.J.; Bottini, S. Identification and characterization of specific motifs in effector proteins of plant parasites using MOnSTER. Commun. Biol. 2024, 7, 850–863. [Google Scholar] [CrossRef]
- Dong, B.Z.; Zhu, X.Q.; Fan, J.; Guo, L.Y. The cutinase bdo_10846 play an important role in the virulence of Botryosphaeria dothidea and in inducing the wart symptom on apple plant. Int. J. Mol. Sci. 2021, 22, 1910. [Google Scholar] [CrossRef]
- Hernandez-Garcia, C.M.; Finer, J.J. Identification and validation of promoters and cis-acting regulatory elements. Plant Sci. 2014, 217–218, 109–119. [Google Scholar] [CrossRef]
- Xuan, C.; Feng, M.; Li, X.; Hou, Y.; Wei, C.; Zhang, X. Genome-wide identification and expression analysis of chitinase genes in watermelon under abiotic stimuli and Fusarium oxysporum Infection. Int. J. Mol. Sci. 2024, 25, 638. [Google Scholar] [CrossRef]
- Wang, L.; Zhang, Y.; Fu, X.; Zhang, T.; Ma, J.; Zhang, L.; Qian, H.; Tang, K.; Li, S.; Zhao, J. Molecular cloning, characterization, and promoter analysis of the isochorismate synthase (aaics1) gene from Artemisia annua. J. Zhejiang Univ. Sci. B 2017, 18, 662–673. [Google Scholar] [CrossRef]
- Pu, J.; Li, M.; Mao, P.; Zhou, Q.; Liu, W.; Liu, Z. Genome-wide identification of the Q-Type C2H2 transcription factor family in Alfalfa (Medicago sativa) and expression analysis under different abiotic stresses. Genes 2021, 12, 1906. [Google Scholar] [CrossRef]
- Li, L.; Tang, J.; Wu, A.; Fan, C.; Li, H. Genome-wide identification and functional analysis of the GUX gene family in Eucalyptus grandis. Int. J. Mol. Sci. 2024, 25, 8199. [Google Scholar] [CrossRef]
- Pérez-Lara, G.; Olivares-Yañez, C.; van Bakel, H.; Larrondo, L.F.; Canessa, P. Genome-wide characterization of light-regulated gene expression in Botrytis cinerea reveals underlying complex photobiology. Int. J. Mol. Sci. 2023, 24, 8705. [Google Scholar] [CrossRef] [PubMed]
- Patkar, R.N.; Naqvi, N.I. Fungal manipulation of hormone-regulated plant defense. PLoS Pathog. 2017, 13, e1006334. [Google Scholar] [CrossRef] [PubMed]
- Zhang, C.Q.; Xu, Y.; Lu, Y.; Yu, H.X.; Gu, M.H.; Liu, Q.Q. The WRKY transcription factor OsWRKY78 regulates stem elongation and seed development in rice. Planta 2011, 234, 541–554. [Google Scholar] [CrossRef] [PubMed]
- Li, W.; Wang, H.; Yu, D. Arabidopsis WRKY transcription factors WRKY12 and WRKY13 oppositely regulate flowering under short-day conditions. Mol. Plant 2016, 9, 1492–1503. [Google Scholar] [CrossRef]
- Yu, Y.; Liu, Z.; Wang, L.; Kim, S.; Seo, P.J.; Qiao, M.; Wang, N.; Li, S.; Cao, X.; Park, C.; et al. WRKY 71 accelerates flowering via the direct activation of FLOWERING LOCUS T and LEAFY in Arabidopsis thaliana. Plant J. 2016, 85, 96–106. [Google Scholar] [CrossRef] [PubMed]
Disclaimer/Publisher’s Note: The statements, opinions and data contained in all publications are solely those of the individual author(s) and contributor(s) and not of MDPI and/or the editor(s). MDPI and/or the editor(s) disclaim responsibility for any injury to people or property resulting from any ideas, methods, instructions or products referred to in the content. |
© 2025 by the authors. Licensee MDPI, Basel, Switzerland. This article is an open access article distributed under the terms and conditions of the Creative Commons Attribution (CC BY) license (https://creativecommons.org/licenses/by/4.0/).