Abstract
Functional bowel disorders (FBDs) are chronic gastrointestinal conditions characterized by recurrent symptoms associated with gut microbiota dysbiosis. Although accumulating evidence suggests that probiotics can improve symptoms in patients with FBD, the underlying mechanisms remain to be fully elucidated. In this randomized, double-blind, placebo-controlled clinical trial, 38 adults meeting the Rome IV diagnostic criteria of functional constipation (FC) and functional diarrhea (FD) received either a multi-strain probiotic complex or placebo for 8 weeks. Clinical outcomes were evaluated using the Irritable Bowel Syndrome Severity Scoring System (IBS-SSS), bowel habits questionnaire, and IBS Quality of Life (IBS-QoL) instrument. Fecal samples were collected at baseline and at week 8 for gut microbiota profiling via 16S rRNA gene sequencing and metabolomic analysis using gas chromatography–mass spectrometry. Probiotic supplementation significantly reduced the severity of abdominal bloating and its interference with quality of life, and improved the body image domain of the IBS-QoL. Beta diversity analysis showed significant temporal shifts in the probiotic group, while 16S rRNA sequencing revealed an increased relative abundance of Faecalibacterium prausnitzii and Blautia stercoris. Fecal metabolomic analysis further indicated elevated levels of metabolites implicated in the gut–brain axis. Multi-strain probiotic supplementation alleviated gastrointestinal symptoms and improved aspects of psychosocial well-being in adults with FBDs, potentially through modulation of the human gut microbiome.
1. Introduction
Functional bowel disorders (FBDs) are chronic gastrointestinal disorders with chronic functional symptoms, which are categorized into irritable bowel syndrome (IBS), functional constipation (FC), functional diarrhea (FD), functional abdominal bloating and distension and unspecified FBD [1]. Epidemiological studies estimate that FBDs affect approximately 11–20% of the global population, resulting in significant impairments of quality of life and increased healthcare utilization [2]. Patients usually present with recurrent abdominal pain, bloating, altered bowel habits, and psychosocial distress, imposing substantial burdens on both individuals and society [3]. Accumulating evidence underscores the pivotal role of the gut microbiota in maintaining gastrointestinal homeostasis and modulating host immune and neural pathways [4,5,6]. In contrast, dysbiosis, which is an imbalance of commensal gut microbiota, has been implicated in the pathophysiology of FBDs [7].
Briefly, the representative dysbiosis are can be summarized as follows: (1) reduced diversity of gut bacteria, (2) an altered ratio of Firmicutes to Bacteroides (e.g., gut inflammation), and (3) decreased levels of beneficial bacteria (e.g., Bifidobacterium and Lactobacillus) accompanied by increased levels of harmful bacteria (e.g., gas-producing Clostridium) [1]. These perturbations lead to significant dysfunctions, including impaired bile acid metabolism causing diarrhea, altered gut metabolite metabolism causing abdominal bloating, and compromised tight junction integrity resulting in electrolyte loss and subsequent constipation [4,8]. Furthermore, disruption of the gut microbiota can impair the gut–brain axis, a bidirectional communication network involving the central nervous system, neuroendocrine system, immune system, and gut-derived neuroactive metabolites [8,9]. Such impairment may exacerbate visceral hypersensitivity, motility disturbances, and psychosocial symptoms commonly observed in FBDs [10].
Probiotics, defined as live microorganisms that confer health benefits to the host when administered in adequate amounts [11], have received considerable attention as a prevention and treatment agent for gastrointestinal disorders. Evidence from clinical trials indicated that probiotics alleviate FBD symptoms by restoring microbial balance, enhancing intestinal barrier integrity, and modulating immune responses [12,13,14]. However, the heterogeneity in probiotic strains, dosing regimens, and study designs have resulted in inconsistent results, thereby limiting the generalizability of these findings [15]. Moreover, mechanistic studies integrating multi-omics data with clinical outcomes are still limited.
In this study, we aimed to evaluate the clinical efficacy of a multi-strain probiotic complex in adults with FBDs and elucidate its potential mechanisms of action through comprehensive gut microbiota and metabolome profiling.
2. Materials and Methods
2.1. Ethical Considerations
This clinical trial was conducted at the Inha University Hospital (Incheon, Republic of Korea) between December 2023 and March 2024, in full compliance with the ethical principles outlined in the Declaration of Helsinki and the International Conference on Harmonization Good Clinical Practice (ICH-GCP) guidelines. The study protocol was approved by the Institutional Review Board of Inha University Hospital (Approval No. 2023-10-016) and was registered in the Clinical Research Information Service (CRIS) database (Registration No. KCT0011004), to ensure transparency and ethical oversight throughout the study period. Prior to enrollment, all prospective participants were clearly informed about the objectives of the study, potential therapeutic benefits, possible risks, including unforeseen adverse events, and all relevant study procedures. Written informed consent was obtained from each participant prior to initiation of any study-related procedures to ensure their autonomy and understanding.
2.2. Study Participants and Design
Participants were recruited based on strict inclusion and exclusion criteria to ensure the selection of a homogeneous study population representative of individuals suffering from FBDs. Eligible participants were adults aged 19–70 years who fulfilled the Rome IV diagnostic criteria for at least one subtype of FBD, namely functional constipation (FC), functional diarrhea (FD), or functional abdominal bloating and distension (FABD). The exclusion criteria were as follows: comprehensive and included the presence of acute gastrointestinal infections, history of peptic ulcer disease, uncontrolled chronic systemic illnesses, prior gastrointestinal surgeries (excluding appendectomy or cesarean section), and recent use (within 2 weeks) of medications known to influence gastrointestinal motility. Additionally, pregnant or breastfeeding women, individuals with known hypersensitivity to any component of the investigational product, and patients with significant psychiatric conditions, such as major depressive disorder or schizophrenia, were excluded. To avoid potential confounding factors, those with a recent diagnosis (within 2 years) of inflammatory bowel disease, including ulcerative colitis, Crohn’s disease, or colorectal malignancy, were also excluded, as were individuals who had participated in any other clinical trial within the preceding 3 months.
This study employed a randomized, double-blind, placebo-controlled, parallel-group design to minimize bias and ensure the validity of the outcomes. A computer-generated randomization sequence was used to assign participants in a 1:1 ratio to either the probiotic intervention or placebo group. Both groups received capsules that were indistinguishable in appearance, size, color, and packaging to maintain the blinding of participants, clinicians, and data analysts. To further ensure scientific rigor and minimize potential bias, all investigators, participants, and outcome assessors were blinded to group allocation throughout the trial. Each probiotic capsule contained a blend of eight strains, including Lacticaseibacillus rhamnosus IDCC 3201 (40%), Bifidobacterium lactis IDCC 4301 (15%), Lacticaseibacillus plantarum IDCC 3501 (15%), Limosilactobacillus reuteri IDCC 3701 (6%), Bifidobacterium breve IDCC 4401 (6%), Lacticaseibacillus casei IDCC 3451 (6%), Streptococcus thermophilus IDCC 2201 (6%), and Lactobacillus helveticus IDCC 3801 (6%), with a minimum total viable count of 1 × 10¹⁰ CFU per capsule. The active blend accounted for part of a capsule (the remainder comprised excipients: corn starch, maltodextrin, silicon dioxide, and magnesium stearate). The participants were instructed to ingest one capsule orally per day for 8 consecutive weeks. Follow-up assessments were scheduled at three time points: baseline (week 0), mid-intervention (week 4), and at the end of the intervention period (week 8). Compliance was carefully monitored by counting the remaining capsules at each visit. Participants who demonstrated an adherence rate of ≥80% were classified as compliant for the per-protocol analysis.
2.3. Clinical Assessments
To evaluate the effects of the intervention comprehensively, participants completed validated questionnaires at each study visit. Bowel habits were assessed using a 12-item structured questionnaire that captured data on the weekly frequency of bowel movements, average defecation time, stool quantity and consistency, incidence of irritant bowel movements, feelings of incomplete evacuation, episodes of abdominal pain associated with defecation, severity of abdominal discomfort, flatulence, and postdefecation discomfort. The severity of gastrointestinal symptoms was quantified using the Irritable Bowel Syndrome Severity Scoring System (IBS-SSS), which includes parameters such as the intensity and frequency of abdominal pain, degree of abdominal bloating, dissatisfaction with bowel habits, and impact of symptoms on quality of life. Each parameter was measured using a Visual Analog Scale (VAS) ranging from 0 (no symptoms) to 10 (most severe) to ensure nuanced quantification of symptom severity. Health-related quality of life (QoL) was assessed using a 34-item questionnaire specifically designed to evaluate QoL impairments attributable to bowel dysfunction across the following eight domains: dysphoria, interference with daily activities, body image concerns, health-related anxieties, food avoidance behaviors, social interactions, sexual health, and interpersonal relationships.
2.4. Fecal Sample Collection and Storage
Fecal samples were collected at baseline and at weeks 4 and 8 using a standardized AccuStool Collection Kit (AccuGene, Incheon, Republic of Korea). Each kit provided participants with two collection tubes (AccuGene, Incheon, Republic of Korea): one containing a DNA stabilization buffer for microbiota analysis and the other containing an empty sterile tube for metabolomic profiling. Participants were instructed to collect fecal samples within 24 h prior to each study visit and store them at −20 °C until transportation. Upon arrival at the study site, samples were immediately stored at −80 °C for long-term preservation until subsequent analyses.
2.5. Microbiome Profiling
For microbiome profiling, genomic DNA was extracted from approximately 250 mg of fecal material using the DNeasy PowerSoil Pro Kit (Qiagen, Hilden, Germany), following the manufacturer’s protocol. DNA concentration and purity were assessed using the Quant-IT PicoGreen dsDNA Assay Kit (Invitrogen, Carlsbad, CA, USA). The full-length 16S rRNA gene (V1–V9 regions) was amplified using barcoded universal primers (27F/1492R) and sequenced using a PacBio Sequel IIe platform (Pacific Biosciences, Menlo Park, CA, USA). Sequencing libraries were prepared with the SMRTbell Express Template Prep Kit 3.0, and high-fidelity reads were generated using the SMRT Link software (v11.0). After quality filtering to remove chimeric and low-quality sequences, taxonomic classification was performed using a curated long-read reference database, enabling species-level resolution. Diversity analyses included alpha diversity indices (Shannon index, Simpson index, and observed species richness) and beta diversity metrics (Bray–Curtis dissimilarity and UniFrac distances), with visualizations generated via principal coordinate analysis and hierarchical clustering using QIIME (v1.9.0) and R software (v4.0.3).
2.6. Metabolomic Profiling
For untargeted metabolomic analysis, approximately 20 mg of fecal sample was homogenized in deionized water and methanol (Sigma-Aldrich, St. Louis, MO, USA), followed by centrifugation and filtration. The resulting extracts were derivatized using methoxyamine hydrochloride (Sigma-Aldrich, St. Louis, MO, USA) and N,O-bis (trimethylsilyl)trifluoroacetamide (BSTFA) (Sigma-Aldrich, St. Louis, MO, USA) and analyzed using a Thermo Trace 1310 gas chromatograph (Thermo Fisher Scientific, Waltham, MA, USA) coupled with a Thermo ISQ LT mass spectrometer (Thermo Fisher Scientific, Waltham, MA, USA). Chromatographic separation was achieved using a DB-5MS capillary column (Agilent, Santa Clara, CA, USA) under an optimized temperature gradient. Metabolite identification was performed by matching the spectra against the NIST library and MS-DIAL databases. The data were normalized to the total ion current for subsequent statistical analyses.
2.7. Safety Evaluations
Safety monitoring included systematic assessment of adverse events, vital signs (heart rate, respiratory rate, blood pressure, and body temperature), and comprehensive hematological and biochemical laboratory tests. Blood samples were analyzed for complete blood count, liver and renal function markers, electrolytes, and high-sensitivity C-reactive protein to detect inflammatory responses.
2.8. Statistical Analysis
All statistical analyses were performed using GraphPad Prism (v10.2.1) and R (v4.0.3). The normality of the data distribution was assessed using the Shapiro–Wilk test. Between-group comparisons of continuous variables were conducted using independent t-tests or Mann–Whitney U tests, while within-group changes were evaluated using paired t-tests or Wilcoxon signed-rank tests, as appropriate. Categorical variables were analyzed using the chi-square or Fisher’s exact tests. Multivariate analyses of metabolomic data were conducted using MetaboAnalyst 6.0 (https://www.metaboanalyst.ca/ (accessed on 4 March 2025)), and a p-value < 0.05 was considered statistically significant.
3. Results
3.1. Baseline Characteristics
A total of 39 individuals were screened for eligibility, and, after excluding one participant due to withdrawal of consent prior to randomization, 38 participants were successfully enrolled and randomized in a 1:1 ratio into either the probiotic intervention group (n = 19) or the placebo group (n = 19). These participants constituted the full analysis set (FA), as illustrated in the CONSORT flow diagram (Figure 1). During the intervention phase, attrition was observed in both groups, with four participants in the probiotic group and five participants in the placebo group discontinuing treatment for reasons such as intake of prohibited medications, newly confirmed pregnancy, voluntary consent withdrawal, protocol violations, or investigator-determined study termination. Consequently, 15 participants in the probiotic group and 14 in the placebo group completed all study visits and were included in the per-protocol analysis.
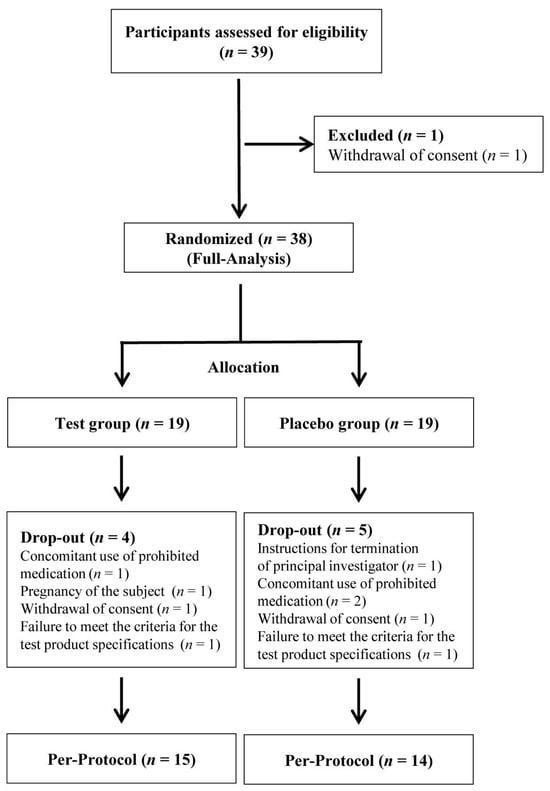
Figure 1.
Flow diagram of participant progression through the study. Thirty-nine individuals were screened for eligibility; 1 was excluded due to withdrawal of consent, and 38 participants were randomized into probiotic and placebo groups. During the study, nine participants discontinued for reasons including prohibited medication use and protocol deviations. A total of 15 participants in the probiotic group and 14 in the placebo group completed the trial and were included in the per-protocol analysis. n refers to the sample size.
Baseline demographic and clinical characteristics, including age, sex, body mass index, smoking and alcohol consumption habits, physical activity levels, sleep duration, and vital signs such as systolic and diastolic blood pressure, were well balanced between the groups, with no statistically significant differences (Table 1). The baseline laboratory parameters did not show any significant differences between the groups.

Table 1.
General characteristics of the study groups.
Treatment adherence, measured as the proportion of capsules consumed relative to the total number provided, was remarkably high in both groups, exceeding 90% at all scheduled visits. None of the participants were excluded because of low compliance (<80%). Importantly, no severe adverse events were reported throughout the study period, and no clinically significant abnormalities were detected in hematological or biochemical safety parameters at any time point in either group.
3.2. Questionnaire-Based Outcomes
3.2.1. IBS Symptom Severity (IBS-SSS)
Probiotic intervention significantly improved multiple domains of the IBS-SSS compared to the placebo. At week 8, participants receiving the probiotic complex exhibited a marked reduction in abdominal bloating severity and interference with QoL compared to placebo (p = 0.039 and p = 0.020, respectively; Figure 2 and Table 2). In within-group analyses, significant decreases were observed in abdominal pain severity (p = 0.004), bloating severity (p = 0.007), and interference with daily life (p = 0.042), highlighting the potential efficacy of the probiotic in alleviating core gastrointestinal symptoms associated with functional bowel disorders (Table 3).
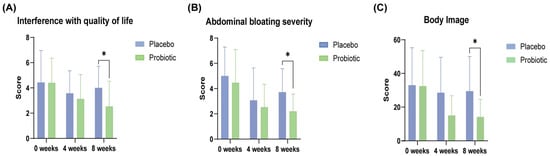
Figure 2.
Improvements in gastrointestinal symptoms and quality of life in the probiotic group during the 8-week intervention. (A) Interference with quality of life and (B) abdominal bloating severity were measured using the IBS-SSS, whereas (C) the body image domain score was derived from the IBS-QOL. Data are presented as mean ± SD at baseline, week 4, and week 8. Significant differences between the probiotic and placebo groups are indicated (* p < 0.05; Mann–Whitney U test).
Table 2.
Changes in gastrointestinal symptom severity assessed by the IBS Symptom Severity Scale (IBS-SSS).
Table 3.
Within-group changes in gastrointestinal symptom severity assessed by the IBS Symptom Severity Scale (IBS-SSS).
3.2.2. Quality of Life (IBS-QoL)
The probiotic group demonstrated superior improvements in the QoL assessment compared with placebo, particularly in the body image domain at week 8 (p = 0.033; Table 4). Within-group comparisons revealed significant enhancements across multiple domains, including dysphoria (p = 0.011), interference with activity (p = 0.010), interpersonal relations (p = 0.025), food avoidance behaviors (p = 0.004), social reactions (p = 0.009), body image (p = 0.002), and health-related concerns (p = 0.008), suggesting a comprehensive benefit of the probiotic complex, not only in physical symptoms, but also in psychosocial well-being (Table 5).
Table 4.
Changes in quality of life assessed by the IBS Quality of Life (IBS-QOL) questionnaire.
Table 5.
Within-group changes in quality of life assessed by the IBS Quality of Life (IBS-QOL) questionnaire.
3.2.3. Bowel Habit Questionnaire
Although significant improvement in bowel activity in the probiotic group was not observed, compared to the placebo group (Table 6), significant improvements within the probiotic group were observed in bowel function parameters (Table 7). For example, reductions were observed in the frequency of irritant bowel movements (p = 0.027), sensation of incomplete evacuation (p < 0.001), abdominal pain during defecation (p = 0.010), gas production (p = 0.012), and postdefecation discomfort (p = 0.033).
Table 6.
Changes in bowel activity assessed by the bowel activity questionnaire.
Table 7.
Within-group changes in bowel activity assessed by the bowel activity questionnaire.
3.3. Gut Microbiome Composition
To assess the effect of probiotic supplementation on gut microbial ecology, we analyzed alpha and beta diversity at baseline, week 4, and week 8 in both the placebo and probiotic groups. Alpha diversity metrics, including Chao1 richness and Shannon and Simpson indices, showed no significant temporal changes within or between groups, indicating that probiotic supplementation did not substantially affect the overall microbial richness or evenness. The preservation of alpha diversity suggests that the intervention exerted targeted effects without disrupting overall ecological complexity at the individual level (Figure 3A). Beta diversity, assessed by Non-metric Multidimensional Scaling based on Bray–Curtis dissimilarity, indicated temporal modulation of the microbial community composition in the probiotic group. While baseline profiles were comparable across groups and no clear separation was observed between treatment arms, samples from weeks 4 and 8 in the probiotic group progressively diverged from the baseline, indicating a time-dependent modulation of community structure. In contrast, microbial communities in the placebo group remained relatively stable (Figure 3B).
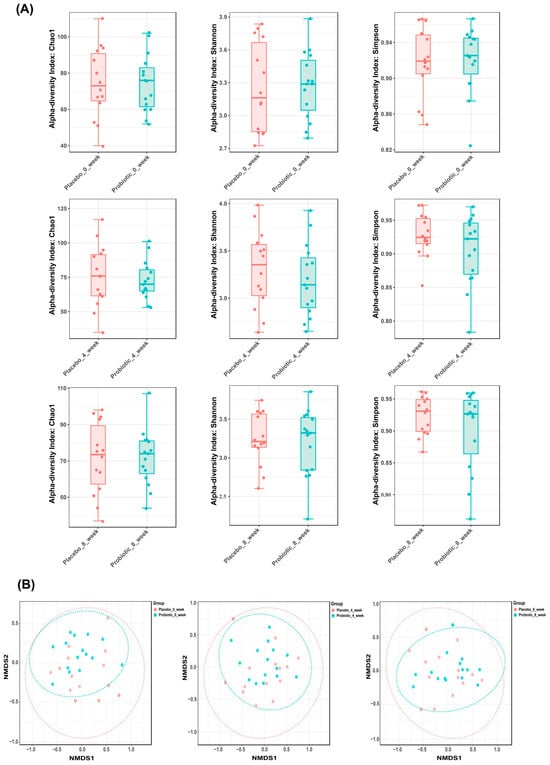
Figure 3.
Gut microbiota diversity dynamics in placebo and probiotic groups over time. (A) Alpha diversity indices (Chao1, Shannon, Simpson) remained stable across groups. Panels correspond to week 0, 4, and 8 (top to bottom). (B) Beta diversity was visualized using Non-metric Multidimensional Scaling plots based on Bray–Curtis dissimilarity. Each point represents the microbial community of an individual participant; closer points indicate higher similarity. Plots correspond to week 0, 4, and 8 (left to right), with temporal clustering observed in the probiotic group, reflecting changes in microbial composition.
Together, these results demonstrate that probiotic administration induced significant compositional remodeling of the gut microbiota over time, reflected in altered beta diversity, while maintaining stable within-sample diversity throughout the intervention period.
Species-level analysis of the gut microbiota composition revealed significant temporal shifts in several bacterial taxa between the placebo and probiotic groups over the 8-week intervention period (Figure 4). Notably, the relative abundance of Blautia stercoris was significantly elevated in the probiotic group at week 4 compared to the placebo group (p = 0.035), suggesting an early ecological response to supplementation. Similarly, Faecalibacterium prausnitzii, a well-established butyrate-producing commensal with anti-inflammatory properties, exhibited a significant increase in abundance at week 8 in the probiotic group versus placebo (p = 0.049). These microbial shifts align with the observed clinical improvements and support the potential role of probiotic formulations in enhancing gut microbial resilience and anti-inflammatory capacity.
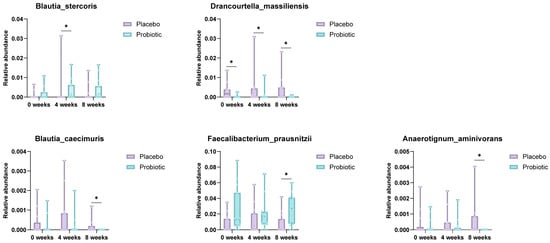
Figure 4.
Species-level comparison of gut microbiota between placebo and probiotic groups. Box plots illustrate significantly different species abundances at week 4 and week 8. Blautia stercoris and F. prausnitzii were notably increased in the probiotic group, suggesting enhanced anti-inflammatory potential (* p < 0.05; Mann–Whitney U test).
Conversely, the relative abundance of Drancourtella massiliensis was consistently higher in the placebo group at baseline, week 4, and week 8 (p = 0.048 and 0.016), suggesting suppression of opportunistic species in response to the probiotic intervention. Blautia caecimuris also showed a significantly lower abundance in the probiotic group at week 8, potentially reflecting competitive exclusion dynamics within the gut ecosystem. Furthermore, Anaerotignum aminivorans levels were elevated in the placebo group at week 8 (p = 0.017), whereas this trend was not observed in the probiotic group.
Collectively, these findings indicate that multi-strain probiotic supplementation leads to selective enrichment of beneficial commensals, such as F. prausnitzii and B. stercoris, while concurrently suppressing or stabilizing the abundance of less favorable taxa. These microbial alterations may contribute to physiological and psychological benefits in individuals with functional bowel disorders.
3.4. Fecal Metabolomic Profiles Differ Significantly Between Placebo and Probiotic Groups
Principal component analysis (PCA) was conducted to assess the global variance in fecal metabolite profiles between the placebo and probiotic groups at baseline and at 4 and 8 weeks. At week 4, partial separation was observed between the two groups along PC1 (15.2%) and PC2 (8.9%), and a similar degree of separation was maintained at week 8 (PC1: 13.5%, PC2: 7.4%). Although overlapping was present, the clustering trend suggested that probiotic intervention contributed to a gradual shift in metabolic composition over time (Figure 5A). PLS-DA was performed to enhance class discrimination. At week 4, the model achieved a clear separation between the placebo and probiotic groups along components 1 (9.9%) and 2 (8.7%). A comparable degree of separation was maintained at week 8, with components 1 and 2 accounting for 8.4% and 8.8% of the variation, respectively (Figure 5B). These results indicate that probiotic supplementation led to significant alterations in fecal metabolite patterns compared to the placebo. Variable Importance in Projection (VIP) analysis from the PLS-DA model identified the most discriminatory metabolites between groups. At week 4, glucose, daidzein, desaminotyrosine and lactic acid exhibited VIP scores > 2.4, indicating strong contributions to group separation. At week 8, metabolites such as lysine (VIP > 4.0), nonanoic acids, and 2-aminobutyric acid were the most influential variables (Figure 5C). These results highlight amino acid metabolism as a key pathway influenced by probiotic intake. Hierarchical clustering heatmaps were used to visualize metabolite abundance across samples. At week 4, the probiotic group exhibited relatively higher levels of short-chain fatty acids compared to placebo. By week 8, more pronounced differences were evident, with metabolites such as L-lysine, nonanoic acid, and serotonin showing differential expression patterns between the groups (Figure 5D). These findings suggest time-dependent modulation of the gut metabolite composition by probiotic treatment. Volcano plots were generated to identify statistically and biologically significant metabolic changes. At week 4, a total of 18 metabolites were significantly altered (log2FC > 1 or <−1, p < 0.05), including upregulation of L-lactic acid and N-acetyl-L-leucine and downregulation of Gondoic acid in the probiotic group. At week 8, 24 metabolites showed significant changes, with notable increases in L-alanine, 2,4-diaminobutyric acid (DABA), L-norvaline, nonanoic acid, and serotonin, and decreased levels of L-lysine and decanoic acid (Figure 5E and Figure 6).
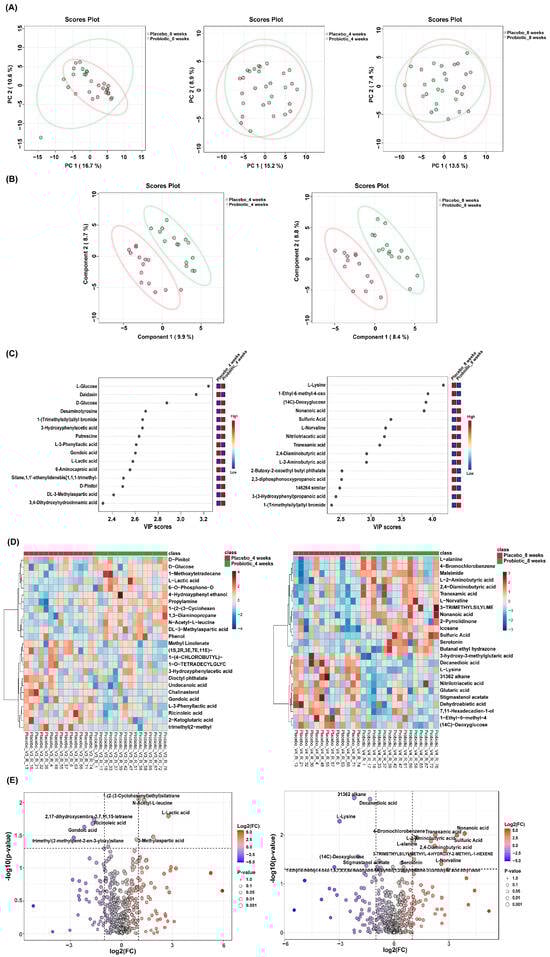
Figure 5.
Distinct fecal metabolomic signatures between placebo and probiotic groups. (A) PCA and (B) PLS-DA showed group separation at weeks 4 and 8. (C) VIP plots identified key discriminatory metabolites. (D) Heatmaps and (E) volcano plots highlighted significantly altered metabolites, with red and blue dots indicating increased and decreased levels in the probiotic group, respectively.
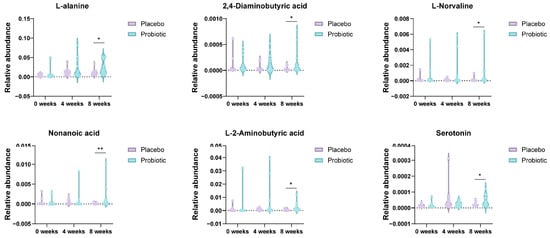
Figure 6.
Enrichment of neuroactive and immunomodulatory metabolites in the probiotic group at week 8. Violin plots depict relative abundances of L-alanine, DABA, L-norvaline, nonanoic acid, L(+)-2-aminobutyric acid, and serotonin levels. These metabolites are implicated in gut–brain axis signaling and immune modulation. Significance was determined using the Mann–Whitney U test (* p < 0.05; ** p < 0.01).
4. Discussion
This double-blind, randomized, placebo-controlled trial demonstrated that an 8-week supplementation of multi-species probiotics significantly alleviated core gastrointestinal symptoms and improved the QoL in individuals with FBDs. These findings were reinforced by microbial and metabolic shifts in the gut environment, underscoring the mechanistic plausibility of this multi-strain probiotic as a gut–brain axis modulator.
The reduction in abdominal pain and bloating observed in the probiotic group is in line with prior reports that multi-strain probiotics outperform mono-strain interventions in ameliorating IBS-related symptoms [12,13,14]. Notably, our within-group comparisons showed statistically significant improvements in IBS-SSS domains, such as abdominal discomfort and interference with daily activities, supporting the therapeutic potential of probiotics in rebalancing the dysbiotic gut ecosystem often implicated in FBD pathophysiology [15]. These improvements mirror findings in other randomized controlled trials, where specific probiotic formulations reduced visceral hypersensitivity and modulated gut motility [16,17].
The observed benefits extend beyond gastrointestinal parameters to include psychosocial domains, as evidenced by significant improvements in QoL metrics such as dysphoria and interpersonal relations. This underscores the involvement of the gut–brain axis, which is increasingly recognized as a critical pathway through which the gut microbiota influences central nervous system processes [18]. Similar outcomes have been reported in meta-analyses, suggesting that specific probiotic strains can act as psychobiotics to improve mood and cognitive performance in patients with IBS [19].
Microbiome profiling revealed enrichment of Faecalibacterium prausnitzii, a butyrate-producing commensal bacterium renowned for its anti-inflammatory properties and association with gut barrier integrity [20,21]. Restoration of F. prausnitzii is particularly promising because diminished levels of this bacterium have been linked to Crohn’s disease and ulcerative colitis pathogenesis [22]. Additionally, the increased abundance of Blautia species, which are known producers of acetate and other SCFAs, indicates a beneficial ecological shift that favors intestinal homeostasis [23]. Although no significant changes were observed in overall diversity metrics, the selective enrichment of beneficial taxa such as F. prausnitzii and B. stercoris is likely to have contributed to the observed clinical improvements. Consistent with our findings, previous clinical trials have reported that probiotic supplementation frequently induces taxa-specific shifts without altering microbial diversity, and such results have been associated with functional benefits [24,25]. These results suggest that strain- or taxa-specific modulation, rather than community-wide restructuring, may be sufficient to elicit clinically meaningful effects.
Metabolomic analyses further revealed significant elevations in neuroactive compounds, such as serotonin and L-norvaline, which are central to gut–brain axis communication. Approximately 90% of serotonin is produced in the gastrointestinal tract and regulates both enteric motility and central mood states [26]. The increased fecal serotonin concentrations in the probiotic group align with previous findings showing that microbial metabolites can stimulate enterochromaffin cells and enhance serotonergic signaling [27]. L-Norvaline, an arginase inhibitor, has been implicated in the modulation of immune responses and maintenance of intestinal homeostasis in experimental models [28].
Importantly, the increase in DABA observed in this study supports the hypothesis that probiotic intake can modulate gamma-aminobutyric acidergic signaling pathways, potentially attenuating stress-induced visceral pain [29,30]. The interplay between these metabolites and gut microbial taxa highlights the intricate mechanisms by which probiotics exert systemic effects.
In line with these findings, the relative abundance of Faecalibacterium prausnitzii has been consistently linked to key human health outcomes, including metabolic syndrome and inflammatory bowel disease. Preclinical evidence indicates that F. prausnitzii may attenuate inflammation and normalize mucosal serotonergic (5-HT) signaling [31]. Moreover, prospective cohort studies have demonstrated that higher citrus intake is associated with increased F. prausnitzii abundance, accompanied by favorable shifts in monoamine-related markers such as 5-HT and GABA [32]. However, because the present trial did not directly assess metabolite–microbiota relationships, these findings should be considered hypothesis-generating. Future studies with strain-level resolution and mechanistic approaches are required to clarify species- and strain-specific effects. Compared to previous trials, this study uniquely integrated high-resolution microbiome sequencing and untargeted metabolomics to provide mechanistic insights into probiotic actions. Moreover, by assessing psychosocial parameters alongside biological markers, it addresses the multifactorial nature of FBDs more comprehensively than earlier studies [16,19,33].
This study has several limitations that should be considered. First, the relatively small sample size and short intervention period may have limited the statistical power, the generalizability of the findings, and the ability to evaluate long-term durability. Second, because a multi-strain probiotic was used without examining the contribution of each strain separately, and because analyses were based on 16S rRNA sequencing rather than strain-level methods, we were unable to attribute the effects to individual taxa or confirm their persistence. Third, host biomarkers such as cytokines, intestinal permeability, or stress-related indices, as well as objective outcomes including stool transit time or abdominal girth, were not assessed, which constrains mechanistic interpretation and clinical robustness. In addition, the absence of an active comparator arm prevents direct contextualization of probiotic-specific effects, and subgroup analyses by FBD subtype or sex were not feasible given the limited sample size. Lastly, correlations between microbial taxa and metabolite profiles, or ex vivo functional validation, were not performed, limiting causal inference.
Despite these limitations, the present trial provides important evidence that a multi-strain probiotic can improve gastrointestinal symptoms and enhance quality of life in patients with functional bowel disorders, suggesting therapeutic relevance in clinical settings. Beyond symptomatic improvements, the integration of microbiome and metabolomic data revealed consistent shifts in microbial composition and metabolic activity, offering plausible mechanistic explanations for the observed benefits. Taken together, these results provide a valuable foundation for future large-scale and longer-term studies, and highlight the potential of probiotics as microbiota-targeted interventions in functional bowel disorders.
5. Conclusions
This randomized, double-blind, placebo-controlled trial demonstrated that 8-week supplementation with a multi-strain probiotic complex and multi-species probiotics significantly alleviated core gastrointestinal symptoms and improved psychosocial well-being in adults with FBDs. The probiotic group showed notable reductions in abdominal pain and bloating as well as enhancements in quality-of-life domains, including emotional and social functioning.
Gut microbiome analysis revealed an increased abundance of beneficial taxa, such as Faecalibacterium prausnitzii and Blautia stercoris, which are both associated with short-chain fatty acid production and anti-inflammatory effects. Although alpha diversity remained stable, beta diversity indicated temporal shifts in the microbial composition of the probiotic group. Fecal metabolomics further identified elevations in serotonin, L-norvaline, and DABA, suggesting modulation of the gut–brain axis and neuroimmune pathways.
These findings highlight the potential of multispecies probiotics as microbiota-targeted interventions to improve both gastrointestinal and psychological symptoms in FBDs. Future studies with larger cohorts and longer follow-up periods are warranted to validate our results and explore their long-term clinical relevance.
Author Contributions
Conceptualization, M.S., J.S.M., J.S. and J.Y.; methodology, W.Y.B., H.K., H.B.L. and D.K.; formal analysis, M.S. and W.Y.B.; investigation, M.S. and J.S.; data curation, W.Y.B., H.K., H.B.L. and D.K.; writing—original draft preparation, W.Y.B. and J.S.M.; writing—review and editing, M.S., Y.H.J. and J.Y.; visualization, W.Y.B., H.K., H.B.L. and D.K.; supervision, J.S.M., J.S. and J.Y.; project administration, J.S.; funding acquisition, J.Y. All authors have read and agreed to the published version of the manuscript.
Funding
This study was supported by Ildong Bioscience and the Korea Institute of Planning and Evaluation for Technology in Food, Agriculture, Forestry, and Fisheries (IPET, RS-2025-02216704).
Institutional Review Board Statement
This clinical trial was conducted at the Inha University Hospital (Incheon, Republic of Korea) between December 2023 and March 2024, in full compliance with the ethical principles outlined in the Declaration of Helsinki and the International Conference on Harmonization Good Clinical Practice (ICH-GCP) guidelines. The study protocol was approved by the Institutional Review Board of Inha University Hospital (Approval No. 2023-10-016, Approval Date: 4 December 2023) and was prospectively registered in the Clinical Research Information Ser-vice (CRIS) database (Registration No. KCT0011004, Registration Date: 25 July 2025), to ensure transparency and ethical oversight throughout the study period.
Informed Consent Statement
Prior to enrollment, all prospective participants were clearly informed about the objectives of the study, potential therapeutic benefits, possible risks, including unforeseen adverse events, and all relevant study procedures. Written informed consent was obtained from each participant prior to initiation of any study-related procedures to ensure their autonomy and understanding.
Data Availability Statement
The original contributions presented in this study are included in the article. Further inquiries can be directed to the corresponding author.
Acknowledgments
This study was supported by Ildong Bioscience and the Korea Institute of Planning and Evaluation for Technology in Food, Agriculture, Forestry, and Fisheries (RS-2025-02216704).
Conflicts of Interest
W.Y.B., H.K., H.B.L., and J.S.M. were employed by the company ILDONG Bioscience. The remaining authors declare that the research was conducted in the absence of any commercial or financial relationships that could be construed as a potential conflict of interest.
Abbreviations
The following abbreviations are used in this manuscript:
| FBDs | Functional bowel disorders |
| IBS | Irritable bowel syndrome |
| FC | Functional constipation |
| FD | Functional diarrhea |
| FABD | Functional abdominal bloating and distension |
| IBS-QoL | Irritable Bowel Syndrome Quality of Life |
| IBS-SSS | Irritable Bowel Syndrome Severity Scoring System |
| VAS | Visual Analog Scale |
| QoL | Quality of Life |
| ICH-GCP | International Conference on Harmonization Good Clinical Practice |
| CRIS | Clinical Research Information Service |
| CFU | Colony-forming units |
| DNA | Deoxyribonucleic acid |
| rRNA | Ribosomal ribonucleic acid |
| PCA | Principal component analysis |
| PC | Principal component |
| PLS-DA | Partial least squares discriminant analysis |
| VIP | Variable Importance in Projection |
| BSTFA | N,O-bis(trimethylsilyl)trifluoroacetamide |
| NIST | National Institute of Standards and Technology |
| MS-DIAL | Mass Spectrometry–Data Independent AnaLysis |
| CRP | C-reactive protein |
| FA | Full analysis set |
| PP | Per-protocol |
| SCFAs | Short-chain fatty acids |
| DABA | 2,4-Diaminobutyric acid |
References
- Hod, K.; Ringel, Y. Probiotics in functional bowel disorders. Best Pract. Res. Clin. Gastroenterol. 2016, 30, 89–97. [Google Scholar] [CrossRef]
- Chang, J.Y.; Locke, R.G., III; McNally, M.A.; Halder, S.L.; Schleck, C.D.; Zinsmeister, A.R.; Talley, N.J. Impact of functional gastrointestinal disorders on survival in the community. Am. J. Gastroenterol. 2010, 105, 822–832. [Google Scholar] [CrossRef] [PubMed]
- Saito, Y.A.; Petersen, G.M.; Locke, G.R., III; Talley, N.J. The genetics of irritable bowel syndrome. Clin. Gastroenterol. Hepatol. 2005, 3, 1057–1065. [Google Scholar] [CrossRef] [PubMed][Green Version]
- Camilleri, M. Physiological underpinnings of irritable bowel syndrome: Neurohormonal mechanisms. J. Physiol. 2014, 592, 2967–2980. [Google Scholar] [CrossRef] [PubMed]
- Cryan, J.F.; Dinan, T.G. Mind-altering microorganisms: The impact of the gut microbiota on brain and behaviour. Nat. Rev. Neurosci. 2012, 13, 701–712. [Google Scholar] [CrossRef]
- Schwille-Kiuntke, J.; Enck, P.; Zendler, C.; Krieg, M.; Polster, A.V.; Klosterhalfen, S.; Autenrieth, I.B.; Zipfel, S.; Frick, J.S. Postinfectious irritable bowel syndrome: Follow-up of a patient cohort of confirmed cases of bacterial infection with Salmonella or Campylobacter. Neurogastroenterol. Motil. 2011, 23, e479–e488. [Google Scholar] [CrossRef]
- Schaper, S.J.; Stengel, A. Emotional stress responsivity of patients with IBS—A systematic review. J. Psychosom. Res. 2022, 153, 110694. [Google Scholar] [CrossRef]
- Ishaque, S.M.; Khosruzzaman, S.M.; Ahmed, D.S.; Sah, M.P. A randomized placebo-controlled clinical trial of a multi-strain probiotic formulation (Bio-Kult®) in the management of diarrhea-predominant irritable bowel syndrome. BMC Gastroenterol. 2018, 18, 71. [Google Scholar] [CrossRef]
- Waller, P.A.; Gopal, P.K.; Leyer, G.J.; Ouwehand, A.C.; Reifer, C.; Stewart, M.E.; Miller, L.E. Dose-response effect of Bifidobacterium lactis HN019 on whole gut transit time and functional gastrointestinal symptoms in adults. Scand. J. Gastroenterol. 2011, 46, 1057–1064. [Google Scholar] [CrossRef]
- Brenner, D.M.; Moeller, M.J.; Chey, W.D.; Schoenfeld, P. The utility of probiotics in the treatment of irritable bowel syndrome: A systematic review. Am. J. Gastroenterol. 2009, 104, 1033–1049. [Google Scholar] [CrossRef]
- Moayyedi, P.; Ford, A.C.; Talley, N.J.; Cremonini, F.; Foxx-Orenstein, A.E.; Brandt, L.J.; Quigley, E.M.M. The efficacy of probiotics in the treatment of irritable bowel syndrome: A systematic review. Gut 2010, 59, 325–332. [Google Scholar] [CrossRef] [PubMed]
- Lewis, E.D.; Antony, J.M.; Crowley, D.C.; Piano, A.; Bhardwaj, R.; Tompkins, T.A.; Evans, M. Efficacy of Lactobacillus paracasei HA-196 and Bifidobacterium longum R0175 in alleviating symptoms of irritable bowel syndrome (IBS): A randomized, placebo-controlled study. Nutrients 2020, 12, 1159. [Google Scholar] [CrossRef] [PubMed]
- Martoni, C.J.; Srivastava, S.; Leyer, G.J. Lactobacillus acidophilus DDS-1 and Bifidobacterium lactis UABla-12 improve abdominal pain severity and symptomology in irritable bowel syndrome: Randomized controlled trial. Nutrients 2020, 12, 363. [Google Scholar] [CrossRef]
- Sabaté, J.M.; Iglicki, F. Effect of Bifidobacterium longum 35624 on disease severity and quality of life in patients with irritable bowel syndrome. World J. Gastroenterol. 2022, 28, 732–742. [Google Scholar] [CrossRef] [PubMed]
- Oh, C.K.; Park, J.K.; Kim, Y.J.; Kim, J.B. Efficacy and safety of human gut-derived multi-strain probiotics in patients with irritable bowel syndrome: A prospective open-label observation study. Medicine 2023, 102, e34899. [Google Scholar] [CrossRef]
- Sen, P.; Sherwin, E.; Sandhu, K.; Bastiaanssen, T.F.; Moloney, G.M.; Golubeva, A.; Fitzgerald, P.; Da Silva, A.P.V.; Chruścicka-Smaga, B.; Olavarría-Ramírez, L.; et al. The live biotherapeutic Blautia stercoris MRx0006 attenuates social deficits, repetitive behaviour, and anxiety-like behaviour in a mouse model relevant to autism. Brain Behav. Immun. 2022, 106, 115–126. [Google Scholar] [CrossRef]
- Louis, P.; Flint, H.J. Diversity, metabolism and microbial ecology of butyrate-producing bacteria from the human large intestine. FEMS Microbiol. Lett. 2009, 294, 1–8. [Google Scholar] [CrossRef]
- Clemente, J.C.; Ursell, L.K.; Parfrey, L.W.; Knight, R. The impact of the gut microbiota on human health: An integrative view. Cell 2012, 148, 1258–1270. [Google Scholar] [CrossRef]
- He, X.; Zhao, S.; Li, Y. Faecalibacterium prausnitzii: A next-generation probiotic in gut disease improvement. Can. J. Infect. Dis. Med. Microbiol. 2021, 2021, 6666114. [Google Scholar] [CrossRef]
- Varela, E.; Manichanh, C.; Gallart, M.; Torrejón, A.; Borruel, N.; Casellas, F.; Guarner, F.; Antolin, M. Colonisation by Faecalibacterium prausnitzii and maintenance of clinical remission in patients with ulcerative colitis. Aliment. Pharmacol. Ther. 2013, 38, 151–161. [Google Scholar] [CrossRef]
- Machiels, K.; Joossens, M.; Sabino, J.; De Preter, V.; Arijs, I.; Eeckhaut, V.; Van Immerseel, F.; Verbeke, K.; Ferrante, M.; Verhaegen, J.; et al. A decrease of the butyrate-producing species Roseburia hominis and Faecalibacterium prausnitzii defines dysbiosis in patients with ulcerative colitis. Gut 2014, 63, 1275–1283. [Google Scholar] [CrossRef] [PubMed]
- Miquel, S.; Leclerc, M.; Martin, R.; Chain, F.; Lenoir, M.; Raguideau, S.; Hudault, S.; Bridonneau, C.; Northen, T.; Bowen, B.; et al. Identification of metabolic signatures linked to anti-inflammatory effects of Faecalibacterium prausnitzii. mBio 2015, 6, e00300-15. [Google Scholar] [CrossRef] [PubMed]
- Tiran, A.; Gruber, H.J.; Graier, W.F.; Wagner, A.H.; Van Leeuwen, E.B.; Tiran, B. Aspirin inhibits Chlamydia pneumoniae–induced nuclear factor-κB activation, cytokine expression, and bacterial development in human endothelial cells. Arterioscler. Thromb. Vasc. Biol. 2002, 22, 1075–1080. [Google Scholar] [CrossRef] [PubMed][Green Version]
- Phan, J.; Nair, D.; Jain, S.; Smith, L.; Williams, A. Alterations in Gut Microbiome Composition and Function in Irritable Bowel Syndrome Subjects Supplemented with Synbiotics. Microorganisms 2021, 6, e01215-21. [Google Scholar][Green Version]
- Shin, J.; Noh, J.; Lim, S.; Kim, H.; Park, Y.; Lee, J. Compositional Changes in the Gut Microbiota of Responders and Non-responders to Probiotic Treatment Among Patients with Diarrhea-Predominant Irritable Bowel Syndrome: A Post Hoc Analysis of a Randomized Clinical Trial. Microorganisms 2022, 28, 589–603. [Google Scholar] [CrossRef]
- Spencer, N.J.; Hu, H. Enteric nervous system: Sensory transduction, neural circuits and gastrointestinal motility. Nat. Rev. Gastroenterol. Hepatol. 2020, 17, 338–351. [Google Scholar] [CrossRef]
- Dev Kumar, G.; Mis Solval, K.; Mishra, A.; Macarisin, D. Antimicrobial efficacy of pelargonic acid micelles against Salmonella varies by surfactant, serotype and stress response. Sci. Rep. 2020, 10, 10287. [Google Scholar] [CrossRef]
- Zhu, Q.; Zai, H.; Zhang, K.; Zhang, X.; Luo, N.; Li, X.; Hu, Y.; Wu, Y. L-norvaline affects the proliferation of breast cancer cells based on the microbiome and metabolome analysis. J. Appl. Microbiol. 2022, 133, 1014–1026. [Google Scholar] [CrossRef]
- Wang, Z.; Yuan, X.; Zhu, Z.; Pang, L.; Ding, S.; Li, X.; Song, X. Multiomics analyses reveal microbiome–gut–brain crosstalk centered on aberrant gamma-aminobutyric acid and tryptophan metabolism in drug-naïve patients with first-episode schizophrenia. Schizophr. Bull. 2024, 50, 187–198. [Google Scholar] [CrossRef]
- Coker, O.O.; Liu, C.; Wu, W.K.K.; Wong, S.H.; Jia, W.; Sung, J.J.; Yu, J. Altered gut metabolites and microbiota interactions are implicated in colorectal carcinogenesis and can be non-invasive diagnostic biomarkers. Microbiome 2022, 10, 35. [Google Scholar] [CrossRef]
- Reigstad, C.S.; Salmonson, C.E.; Rainey, J.F., III; Szurszewski, J.H.; Linden, D.R.; Sonnenburg, J.L.; Farrugia, G.; Kashyap, P.C. Gut Microbes Promote Colonic Serotonin Production through an Effect of Short-Chain Fatty Acids on Enterochromaffin Cells. FASEB J. 2015, 29, 1395–1403. [Google Scholar] [CrossRef]
- Martín, R.; Miquel, S.; Chain, F.; Natividad, J.M.; Jury, J.; Lu, J.; Sokol, H.; Theodorou, V.; Bercik, P.; Verdu, E.F.; et al. Faecalibacterium prausnitzii Prevents Physiological Damages in a Chronic Low-Grade Inflammation Murine Model. BMC Microbiol. 2015, 15, 67. [Google Scholar] [CrossRef]
- Ge, C.; Lu, Y.; Shen, Z.; Lu, Y.; Liu, X.; Zhang, M.; Zhao, Y.; Liu, Y.; Wu, X.; Chen, H.; et al. Machine learning and metabolomics identify biomarkers associated with the disease extent of ulcerative colitis. J. Crohn’s Colitis 2025, 19, jjaf020. [Google Scholar] [CrossRef]
Disclaimer/Publisher’s Note: The statements, opinions and data contained in all publications are solely those of the individual author(s) and contributor(s) and not of MDPI and/or the editor(s). MDPI and/or the editor(s) disclaim responsibility for any injury to people or property resulting from any ideas, methods, instructions or products referred to in the content. |
© 2025 by the authors. Licensee MDPI, Basel, Switzerland. This article is an open access article distributed under the terms and conditions of the Creative Commons Attribution (CC BY) license (https://creativecommons.org/licenses/by/4.0/).