Abstract
Mycoplasma spp. are facultative pathogens that contribute to the pathogenesis of multiple bovine diseases, including the bovine respiratory disease complex, and have been shown to form biofilms. Biofilm formation is associated with increased antibiotic resistance in many organisms, but accurate determination of antimicrobial susceptibility in biofilms is challenging. In Mycoplasma spp., antimicrobial susceptibility is routinely determined using metabolic pH-dependent color change. However, biofilm formation can lead to reduced metabolism, making interpretation of metabolic readouts difficult. Therefore, we developed and optimized a new flow cytometry-based method for antimicrobial susceptibility testing in biofilm-forming Mycoplasma, termed the live/dead antimicrobial susceptibility test (LD-AST). The LD-AST measures the proportion of live bacteria upon exposure to antibiotics, works robustly with both planktonic and biofilm cultures, and enables the determination of the minimum bactericidal concentration (MBC) for a given antibiotic. We used two strains of Mycoplasma bovis (Donetta PG45 and Madison) and two clinical Mycoplasma bovoculi isolates (MVDL1 and MVDL2) to determine the impact of biofilm growth on antimicrobial susceptibility for gentamicin, enrofloxacin, or tetracycline. All Mycoplasma strains were susceptible to all antibiotics when cultured as planktonic cells, with MBCs in the expected range. However, three out of four strains (Donetta PG45, MVDL1, and MVDL2) were completely resistant to all three antibiotics when newly adhered biofilms were analyzed, whereas M. bovis Madison gave variable results. For mature biofilms that were cultured for 4–5 days before antibiotic exposure, results also were variable, with some strains showing an increased resistance with certain antibiotics and a decreased resistance with others. Overall, these results are consistent with earlier reports that biofilms can exhibit increased antimicrobial resistance.
1. Introduction
Mycoplasma spp. are common facultative pathogens in cattle and other livestock species, where they contribute to significant diseases of the respiratory tract and of other organ systems. In domestic cattle, Mycoplasma bovis is considered a key pathogen that significantly contributes to the bovine respiratory disease complex, which causes significant economic losses to the cattle industry globally [1,2]. M. bovis is well established as an important cause of pneumonia, mastitis, and arthritis, but has also been associated with ocular infections, otitis media, meningitis, endocarditis, and reproductive disorders [3,4,5,6,7,8]. Clinical signs among cattle infected with M. bovis are often inconsistent and unspecific, making infections difficult to identify and control [3,4]. Importantly, studies have shown that M. bovis has developed increased levels of resistance to a wide range of antimicrobial classes, including aminocyclitols (spectinomycin), fluoroquinolones (enrofloxacin), lincosamides (clindamycin and lincomycin), macrolides (erythromycin, gamithromycin, tilmicosin, tulathromycin, and tylosin), pleuromutilins (tiamulin), and tetracyclines (oxytetracycline). [9,10,11,12,13,14,15,16]. A second species, Mycoplasma bovovuli, is a frequent isolate of the bovine eye [17] and is associated with both bovine conjunctivitis and keratoconjunctivitis [18,19,20,21]. While conjunctivitis has been observed in herds infected with M. bovoculi alone [22], M. bovovuli has been found to enhance keratoconjunctivitis caused by Moraxella bovis [23,24]. Notably, related Mycoplasma species have been shown to contribute to similar respiratory diseases in pigs (Mycoplasma hyopneumoniae), sheep (Mycoplasma ovipneumoniae), and goats (Mycoplasma ovipneumoniae and Mycoplasma arginini) [25,26,27] and to conjunctivitis in pigs (Mycoplasma hyorhinitis), birds (Mycoplasma gallisepticum), and cats (Mycoplasma felis) [28,29,30].
Antibiotic susceptibility testing (AST) of bacterial isolates is commonly performed in vitro, with results expressed either as the minimum inhibitory concentration (MIC) or the minimum bactericidal concentration (MBC) [31]. The first metric, MIC, is the antibiotic concentration where the growth of the organism is inhibited. The inhibition of an organism’s growth can have clinical relevance, as slowing the spread of the infection can allow for the host immune response to clear the infection. The second metric, MBC, is commonly defined as the minimum concentration of an antibiotic that can kill 99.9% of the viable organisms [31]. The bactericidal effect of the antibiotic can also be interesting clinically, because rather than just inhibiting growth, this can give insight into whether the antibiotic alone can kill the infecting organism. These two metrics can also allow for the comparison between organisms and isolates in vitro, to determine the relative differences in susceptibility to treatment.
There is a need for improved diagnostic methods for Mycoplasma spp., specifically in regard to Mycoplasma biofilms. To date, there has only been limited research into the effect that biofilm formation has on both the pathogenicity and the antimicrobial resistance of Mycoplasma spp. The current method for MIC determination recommended by the International Research Program on Comparative Mycoplasmology (IRPCM) for antimicrobial susceptibility testing (AST) of veterinary Mycoplasma spp. utilizes a metabolic assay, termed color change assay, that is based on pH-dependent color change of culture media in a microtiter plate over the course of 7–14 d [32]. Some Mycoplasma spp. can produce acid as they metabolize nutrients and grow. When an antibiotic inhibits growth, no acid production and hence no color change occurs in the culture. However, the color change assay can be difficult to interpret, due to the variability of acid production between different Mycoplasma strains and under different culture conditions. In particular, metabolic differences between laboratory-adapted Mycoplasma strains and clinical isolates can result in variations in acid production [33]. While all planktonic bovine Mycoplasma spp. analyzed in our laboratory caused a color change that correlated with growth, others have reported that some Mycoplasma spp. do not acidify their media [34]. Previously developed assays to determine the MBC for Mycoplasma spp. have been based on the growth rate of the organism or time-kill assays. These methods also rely on a color change by the pH indicator in broth media [35,36,37] or on colony counts on plates [38], which is not always feasible depending on the Mycoplasma spp. These issues with the current methods for both MIC and MBC determination point to a need for alternative AST methods.
Biofilm formation is a defense strategy employed by a variety of microorganisms, where the adherence of the cells to a surface and the formation of an extracellular polymeric matrix (EPM) commonly results in both immune evasion and antibiotic resistance [39,40,41]. The increased resistance of biofilms to normal defense mechanisms employed by the host may enable chronic colonization, leading to persistent carrier animals that pose a significant transmission risk to other animals in the population [42,43,44]. In other bacterial species, biofilm formation has been associated with increased antibiotic resistance and negative outcomes in livestock health [45,46]. Biofilm formation by M. bovis [43,47] and by other Mycoplasma spp. [43,48,49] has been documented in previous studies. However, a recent review by Andrés-Lasheras et al. identified significant knowledge gaps in livestock biofilm research [50]. Specifically, effects of Mycoplasma biofilm formation on antimicrobial resistance needs to be addressed due to their potential implications on treatment decisions.
One common feature of biofilms, including those formed by other Mycoplasma spp., is a significantly reduced bacterial metabolism, as some bacteria in the biofilm structure enter a dormant metabolic state [51,52,53]. This metabolic dormancy could also lead to a decrease in acid production by M. bovis, which could skew the results of the metabolic-based AST method. Due to potential differences in metabolic state and antibiotic susceptibility between planktonic bacteria and biofilm-forming bacteria, antibiotic concentrations may need to be adapted to effectively treat bacterial biofilms. The potential inaccuracy of using the color change assay [32] as well as the rising need for susceptibility information necessitates new approaches to the development of sensitive and rapid AST methods to compare both planktonic Mycoplasma spp. as well as Mycoplasma biofilms. Therefore, as there are no currently published biofilm-specific methods to address antibiotic susceptibilities for Mycoplasma biofilms, we have developed a new method of antimicrobial susceptibility testing. This method, termed the live/dead AST (LD-AST), is based on the quantification of live and dead bacteria in disaggregated biofilms by flow cytometry.
Due to the lack of a cell wall, Mycoplasma spp. have an inherent resistance to common antibiotics such as beta-lactams and glycopeptides [54]. Antibiotics utilizing different mechanisms such as inhibiting protein synthesis (tetracyclines and aminoglycosides), or DNA synthesis (fluoroquinolones) have been used to successfully treat Mycoplasma infections [54,55]. Therefore, we have selected the antibiotics tetracycline, gentamicin (aminoglycoside), and enrofloxacin (fluoroquinolone), which have been approved for use in clinical practice to treat both bovine respiratory infections (tetracycline and enrofloxacin) and bovine conjunctivitis (gentamicin) [56,57,58,59] to validate the new LD-LST.
2. Materials and Methods
2.1. Growth Media
Broth media consisted of Mycoplasma PPLO Broth Base (19.5 mg/mL) (Becton Dickinson, Franklin Lakes, NJ, USA) supplemented with L-cysteine hydrochloride monohydrate (8.7 × 10⁻² mg/mL) (Thermo Fisher Scientific, Waltham, MA, USA), beta-nicotinamide adenine dinucleotide (NAD) (8.7 × 10⁻² mg/mL) (Thermo Fisher Scientific), dextrose (2.6 mg/mL) (Thermo Fisher Scientific), thallium acetate (0.43 mg/mL) (Acros Organics, Fair Lawn, NJ, USA), porcine serum (6.5%) (Quad Five, Rygate, MT, USA), horse serum (6.5%) (Quad Five), and phenol red (2.1 × 10⁻² mg/mL) (Sigma Aldrich, St. Louis, MO, USA) as a pH indicator.
2.2. Bacterial Isolates
Mycoplasma isolates (Table 1) were obtained from either the American Type Culture Collection (ATCC, Manassas, VA, USA) or the Montana Veterinary Diagnostic Laboratory (MVDL, Bozeman, MT, USA). The M. bovoculi isolates were identified by whole genome sequencing with Illumina MiSeq (Wyoming State Veterinary Laboratory, Laramie, WY, USA). The M. bovis PG45 isolate (ATCC, 25523) was used as the reference strain and as a baseline for method development. The resulting optimized methods were then applied to the additional isolates with minimal adjustments.

Table 1.
Characteristics of bovine Mycoplasma isolates used in this study.
2.3. Culture Methods
Each strain was grown for 2 days (d) in the growth media described above at 37 °C and 5% CO2, which were considered the standard conditions for incubation. The culture was incubated in either a polystyrene 96-well or 6-well plate (Table S1). Mycoplasma spp. typically do not adhere well to polystyrene, so these were considered planktonic cultures. To stimulate formation of biofilms, the Mycoplasma spp. were incubated in a 96-well glass-bottom plate (Cellvis, Product Number: P96-1.5H-N, Mountain View, CA, USA) under the same conditions as above.
2.4. Biofilm Image Analysis
Mycoplasma biofilm growth over time was determined by inoculating 200 µL of culture at a concentration of 1 × 10⁴ cells/mL into a 96-well glass-bottom plate. The plate was incubated for 6 d under standard conditions. Brightfield images of each well were taken daily using a Keyence BZ-X 810 microscope (Keyence, Itasca, IL, USA). Images were then analyzed using FIJI software (v2.14.0) [60] to assess structure size and confluency of adhered cells. To measure structure size, the images were set to scale in the FIJI software and manually measured using the measurement tool. For confluency analysis of the biofilm, images were analyzed with FIJI software (v2.14.0) [60] using methods adapted from Busschots et al. with some slight modifications. Briefly, the rolling ball radius was reduced until only the background was removed, the threshold was reduced so that only the biofilm was selected, and instead of counting cells, only the area fraction was used [61].
2.5. Acid Production Assay
To assess acid production by Mycoplasma biofilms, new broth media were placed on the mature biofilms and incubated at standard conditions for 2 d. This was compared to planktonic cultures that were incubated at standard conditions for 2 d. These wells were then imaged to assess visible color change. Acid production by M. bovis PG45 was further investigated over a total of 6 d by performing the following experiment: A standard curve of pH values was created to estimate the pH in each well using a SpectraMax ABS Plus plate reader (Molecular Devices, San Jose, CA, USA). The samples and the standard curve were read at 620 nm and 700 nm, and the pH of the sample was calculated based on the standard curve. Each well was then examined for visual signs of contamination or debris, and any wells that were obviously contaminated or contained debris were excluded from the data set.
2.6. Quantification of Cells with Flow Cytometry
The ZE5™ Cytometer (Bio-Rad, Hercules, CA, USA) was used for cell quantification of cells, so that standardized concentrations of inoculum could be used. Briefly, 10 µL of ~4 µm Countbright Plus Absolute Counting Beads (Reference Number: C36995, Invitrogen, Waltham, MA, USA) were added to 200 µL of FACS buffer and 100 µL of Myoplasma sp. sample. FACS buffer was made using phosphate buffered saline (PBS) (Cytiva, Logan, UT, USA), FBS (2%) (SeraPrime, Fort Collins, CO, USA), and sodium azide (0.1%) (Aqua Solutions Inc., Deer Park, TX, USA). One thousand bead events were collected and then analyzed with the Everest analysis software (v3.2.12.0, Bio-Rad) [62]. The overall concentration for the sample was then calculated with the equation below.
2.7. Biofilm Disruption
To analyze M. bovis PG45 biofilms using imaging cytometry, the media were removed from the mature biofilms and replaced with 0.2 µm filtered, degassed PBS (Cytiva). The biofilms were then scraped from the bottom of a glass-bottom well with a mini cell scraper (United Biosystems, Herndon, VA, USA) and exposed to either 6 min sonication, 10 min sonication, or Tween 20 (Fisher Scientific) treatment. After scraping, the biofilm suspension was transferred to 1.5 mL microcentrifuge tube (Fisherbrand, Pittsburgh, PA, USA). Using a protocol modified from Totten et al. [63], sonication samples were treated for either 6 min or 10 min at 45 kHz (VWR Scientific, Aquasonic Model 550T, Radnor, PA, USA). Briefly, Mycoplasma cultures were sonicated for a longer period using a higher frequency sonicating water bath than was performed by the previous authors. Biofilm disruption with 0.01% Tween 20 was performed for 15 min at room temperature, following a protocol modified from Alsharif and Godfrey [64]. Briefly, Tween 20 was substituted as an alternative for Pluronic F-68 as suggested by the authors. Samples were then stained with SYTO9 (Invitrogen) at a final concentration of 1.36 µM for 15 min at 4 °C and analyzed by imaging cytometry.
2.8. Imaging Cytometry Analysis
Imaging cytometry was performed with the Cytek Amnis ImagestreamX MkII Imaging flow cytometer (Cytek, Fremont, CA, USA). The particle images were obtained with the 20 × objective so that the field would capture the widest range of particle sizes. Due to the lower limit of size measurement capabilities of the device, the particles were compared by utilizing relative fluorescent units (RFU) following manufacturer recommendations for small particle analysis. Each sample was run on the instrument for 2 min and subsequently analyzed with Amnis IDEAS® 6.2 software. For the analysis, first the samples were gated for a 2 min runtime to ensure consistency, and then the samples were gated for focus in the fluorescent channel. After these first steps were completed, a built-in machine learning module for counting the spots on each image was trained to identify images with multiple particles for removal from the dataset. At this point, the in-focus single particle image fluorescent intensity feature for each particle was exported to a *.csv file for analysis with the R statistical software (v4.3.3, R core Team) [65].
2.9. Small Particle Analysis with Flow Cytometry
The disruption method that was determined to be successful by imaging cytometry analysis in Section 2.8 was then analyzed via flow cytometry with the ZE5™ Cytometer (Bio-Rad) utilizing the 405 nm small particle laser. Briefly, the M. bovis PG45 culture biofilms were sonicated for 10 min, stained with a 1:6000 dilution of SYBR Safe DNA gel stain (Thermo Fisher), and compared to untreated biofilm and planktonic samples. To determine the specific size of the disrupted particles, a Flow Cytometry Sub-micron Particle Size Reference Kit (Invitrogen) was used. The resulting data were then analyzed with FlowJo software (BD, v. 10.10.0).
2.10. Live/Dead Percentage Quantification
To quantify cell death using flow cytometry, 2 d Mycoplasma spp. planktonic or biofilms grown in 96-well plates as described above were collected for analysis. The biofilm was collected by removing the medium on top of the biofilm and replacing it with 200 µL of FACS buffer. A mini cell scraper was then used to scrape the bottom of each well and remove the adherent biofilm from the glass-bottom plate. For the planktonic cells 100 µL of the culture was added to 100 µL of FACS buffer and transferred to a capless 1.5 mL microcentrifuge tube (Research Products International, Mt Prospect, IL, USA) and covered with foil (Kirkland Signature, Seattle, WA, USA). Additional disruption treatments were applied after this step as described below. The suspensions of cells and FACS buffer from each tube were individually transferred to the wells of a polystyrene 96-well plate (Greiner, Kremsmünster, Austria) and stained with SYTO9 at a final concentration of 1.36 µM and propidium iodide (PI) at a final concentration of 8 µM, according to methods described by Assunção et al. [66]. A ZE5™ Cytometer (Bio-Rad) was used to analyze 50 µL of each sample. The cell concentration for each sample was then calculated based upon this known volume instead of using the counting beads mentioned above. Data were analyzed using Bio-Rad Everest software (v3.2.12.0) [62] and FlowJo software (v10.10.0). Gates for live and dead cells were applied using the fluorescent intensity of SYTO9 versus PI (Figure 1), as described by Assunção et al. [66]. Separate populations were then visualized for live (Figure 1A) and dead (Figure 1B) bacteria after treating the various Mycoplasma spp. with 0.01% Triton X-100 [67] to create a positive control for dead cells (Figure 1B).
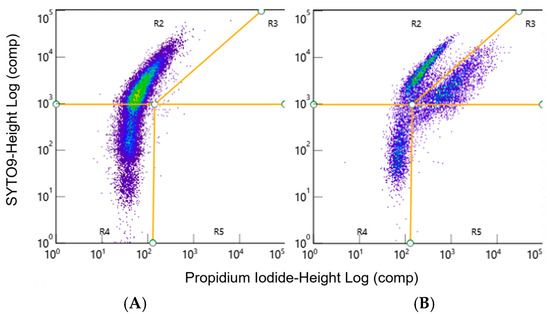
Figure 1.
Representative FACS dot plots of live and dead M. bovis samples. The live/dead stain was visualized as the log intensity of SYTO9 versus the log intensity of the PI (A) Live cells were gated as SYTO9-positive, PI-negative cells in gate R2. (B) TritonX-100 treatment was used to kill a proportion of the M. bovis to create a positive control. Dead cells are found as SYTO9-positive, PI-positive cells in gate R3. Representative data from one experiment.
2.11. Disruption Survival Determination
To ensure that the biofilm disruption treatment which was most successful in reducing the particle size did not result in a decrease in cell viability, 2 d planktonic M. bovis PG45 cultures were filtered with a 0.45 µm low protein-binding syringe filter to remove any aggregates. These filtered cells were either left untreated or sonicated for 10 min, as previously described. The cells were then live/dead stained and quantified with both flow cytometry and imaging cytometry.
2.12. Cell Adhesion Rate for Newly Adhered Biofilms
To determine the rate at which M. bovis PG45 cells adhere to glass, 200 µL of culture were inoculated at a concentration of 2 × 10⁴ cells/mL into the wells of a 96-well glass-bottom plate. After 1, 2.5, or 4 h, the media were removed and replaced with 200 µL of FACS buffer. The cells were then disrupted with a mini cell scraper, transferred to a 1.5 mL microcentrifuge tube (Fisherbrand), and sonicated for 10 min at 45 kHz. These removed cells were then stained with SYTO9, and the cell concentration was determined via flow cytometry.
2.13. Broth Microdilutions
Broth microdilutions were made with the growth media mentioned above, but without penicillin and were instead made with either gentamicin (IBISCI, Dubuque, IA, USA), enrofloxacin (Sigma Aldrich, St. Louis, MO, USA), or tetracycline (Sigma Aldrich, St. Louis, MO, USA). Each antibiotic was used with two technical replicates per plate and was diluted with 2-fold serial dilutions into 9 wells. Broth media without antibiotics were used as a growth control. Gentamicin concentrations were 2-fold dilutions from 128–0.5 µg/mL, enrofloxacin from 10–0.039 µg/mL, and tetracycline from 16–0.0625 µg/mL. While both gentamicin and enrofloxacin are considered bactericidal, tetracycline is typically considered bacteriostatic, but bactericidal activity also has been described for certain bacteria [68].
2.14. LD-AST Assays for Planktonic Mycoplasma spp., Newly Adhered and Mature Biofilm
For planktonic growth, the microdilutions described above were prepared, and planktonic culture quantified with flow cytometry was inoculated at 200 µL of 1 × 10⁴ cells/mL per well of a polystyrene 96-well plate as recommended by Hannan et al. [32]. The interior wells were inoculated, with the outer edge filled with 1X PBS (Cytiva) to reduce evaporation of the sample wells. Plates were incubated using standard culture conditions for 2 d and then quantified using the LD-AST.
For newly adhered biofilm growth, 200 µL of 2 × 10⁴ cells/mL of planktonic culture was inoculated into the interior wells of a 96-well glass-bottom plate, with the outer edge filled with 1× PBS to reduce evaporation of the sample wells. This plate was then incubated for 1 h at standard conditions so that the adhered cells would fall into the range of 103–105 cells/mL suggested by Hannan et al. [32]. To ensure that the cells were in range, three wells grown for concentration verification were scraped with a mini cell scraper, sonicated for 10 min, and quantified with flow cytometry as described above. The medium on the rest of the newly adhered cells was removed and the prepared antibiotic microdilutions described above were added. Plates were incubated using standard culture conditions for 2 d and then quantified using the LD-AST.
For mature biofilms, 200 µL of 1 × 10⁴ cells/mL of planktonic culture was inoculated into the interior wells of a 96-well glass-bottom plate, with the outer edge filled with 1× PBS to reduce evaporation of the sample wells. This plate was then incubated for 4 d at standard conditions to produce a mature biofilm. The wells were then observed microscopically to ensure consistency of biofilm formation. The media were removed from all sample wells, and newly prepared antibiotic microdilutions as described above were added to the mature biofilms.
2.15. Statistical Analysis
All analyses were performed using R Statistical Software (v4.3.3; R Core Team 2024) [65]. Data were processed into data structures with the tidyverse package (v2.0.0) [69]. Linear mixed-models were performed with the nlme package (v3.1.164) [70], generalized linear mixed-models were performed with the lme4 package (v1.1.35.1) [71], and the diagnostic fit was assessed using the ggResidPanel package (v0.3.0) [72]. Mixed model tables were generated with the sjPlot package (v2.8.1.5) [73]. Imaging cytometry particle size data were processed and combined with the purr package (v1.0.2) [74] and stringr package (v1.5.1) [75]. The disruption method survival statistics were performed with the rstatix package (v0.7.2) [76]. All figure plots were made with the ggplot2 package (v3.5.0) [77], ggthemes package (v5.1.0) [78], and ggpubr package (v0.6.0) [79]. For all tests, significance was considered at an α < 0.05.
When determining the maturity of the biofilm described in Section 2.4, we quantified both the largest structure size and the confluence. The effect of incubation times on largest structure size was tested with a separate means mixed model with the day post-inoculation as a fixed effect and the technical replicate as a random effect according to the following:
where i represents the observation level and m represents the technical replicate.
The effect of incubation time on biofilm confluence was tested with a separate means mixed model with the day post-inoculation as a fixed effect and the technical replicate as a random effect according to the following:
where i represents the observation level and m represents the technical replicate.
The timepoint post-inoculation that was observed to have the largest mean was set as the baseline and compared to all other timepoints post-inoculation.
For the acid production assay described in Section 2.5, a mixed model was applied with an interaction between the inoculation state (uninoculated controls or M. bovis PG45) and the antibiotic concentration as the fixed effects and the individual plate variance as a random effect according to the following:
where i represents the observation level, m represents the different 96-well plate blocks, and j represents the biofilm percentage.
For the disrupted biofilm data obtained by imaging cytometry described in Section 2.7 and Section 2.8, the percentage of the population ≤1.75 × 10³ RFU for each replicate was calculated and a separate means mixed model was performed, with the treatment as a fixed effect and the replicate culture as a random effect according to the following:
where i represents the observation level and m represents the biological replicate.
For the small particle 10 min sonication data obtained with the 405 nm small particle laser described in Section 2.9, a generalized linear model was performed, with the treatment as a fixed effect according to the following:
where i represents the individual observation, and IG refers to the inverse Gaussian distribution.
For the experiments performed, to assess the impact of biofilm disruption on cell viability described in Section 2.11, we wanted to determine whether the treatment resulted in a decrease in live cells. A one-sided Welch’s t-test was performed to compare the untreated samples to their paired samples that were sonicated for 10 min. To determine whether there were significant differences between imaging cytometry and flow cytometry, a two-sided Welch’s t-test was performed to compare the flow cytometry samples at each treatment to their paired samples analyzed with the imaging cytometer.
For the AST assay described in Section 2.14, we defined the MBC as the lowest dilution that resulted in a significant decrease in live cell percentage that was ≥5%, which we notated as MBC≥5%. To determine the MBC≥5%, a separate means mixed model was performed for each organism state and antibiotic combination, with concentration as a fixed effect and the biological replicate as a random effect, according to the following:
where i represents the observation level and m represents the biological replicate.
3. Results
3.1. Biofilm Maturity Determination
First, we confirmed that all four Mycoplasma strains produced biofilms following adherence to glass-bottom plates. As shown in Figure 2, adhered bacterial aggregates were visible after 6 days of incubation for all strains, although aggregate sizes varied. Next, we sought to define the point at which the Mycoplasma biofilms reached their maximum size and thus could be considered mature based on both the area of the plate covered by the biofilm (confluence) and the size of individual aggregates (structure size). We used digital image analysis to quantify the percent confluence and the diameter of the largest structure after 0–6 d of culture (Figure 3). For M. bovis PG45, biofilm confluence peaked after 4 d with a mean of 10.42 ± 1.89% coverage of the culture plate (Figure 3A, Table 2). Biofilm confluence at 4 d showed moderate to strong evidence for a difference (Wald’s test, p < 0.05) compared to all other days post-inoculation. Structure size peaked at 6 d with a mean size of 29.50 ± 8.10 µm (Figure 3B, Table 2), with no evidence of differences between any of the time points analyzed (Wald’s test, p > 0.05). Based on these results, we considered M. bovis PG45 biofilms cultured for 4 d to be mature, since a longer culture did not lead to an increase in biofilm mass. When determining maturity for the additional isolates (Table 2), we found that the M. bovis Madison strain had significantly higher confluence (Wald’s Test, p < 0.001) at 5 d, with no significant difference in the largest structure size between the other days (Wald’s Test, p > 0.05). Therefore, the Madison strain was considered mature after 5 d of incubation. For the M. bovoculi MVDL1 isolate, the highest level of confluence was found at 5 d, when it was significantly greater than all other days except 4 d (Wald’s Test, p < 0.001), and the largest structure size were present at 3 d, when they were significantly larger than all the other days (Wald’s Test, p < 0.001). Therefore, MVDL1 biofilms were considered mature after 4 d. For the M. bovoculi MVDL2 isolate, we observed the highest level of confluence at 5 d that was significantly higher than all the other days (Wald’s Test, p < 0.001), and we observed the largest structure size at 2 d that was only significantly different than the 3 d and 6 d observations (Wald’s Test, p < 0.05). Therefore, MVDL2 biofilms were considered mature after 5 d.
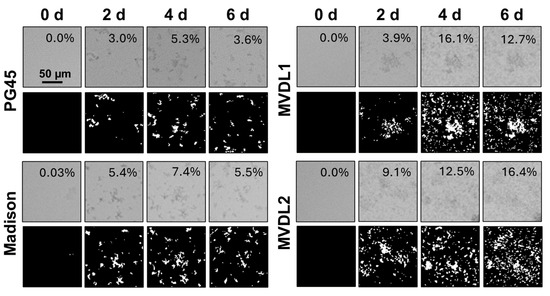
Figure 2.
Brightfield images of Mycoplasma biofilm formation on glass-bottom plates over 6 d. Top rows: phase contrast images; bottom rows: thresholded images used to estimate the percent confluence of the biofilm in the field of view. Data are representative of one experiment with 18 technical replicates.
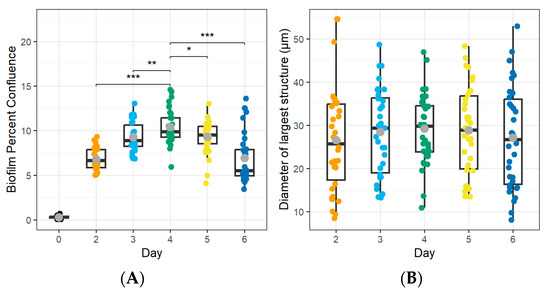
Figure 3.
Maturation of M. bovis PG45 biofilms over time. Biofilm maturity was assessed based on the percent confluence of the cells and the largest structure diameter observed. (A) Biofilm confluence peaked at 4 d, which showed strong evidence of a difference (Wald’s Test, p < 0.01) compared to all other days post-inoculation. (B) The diameter of the largest biofilm structure did not vary across the different days (Wald’s test, p > 0.05). The boxplot displays the median and quartiles of the population, the grey point indicates the mean. Representative of two experiments, each with 16–18 technical replicates. * p < 0.05, ** p < 0.01, *** p < 0.001.
Table 2.
The peak maturity metrics observed over 6 days of growth.
3.2. Acid Production
We first tested the hypothesis that the standard color change assay is not suitable to assess growth and antimicrobial susceptibility of our selected Mycoplasma spp. biofilms (Figure 4A). Indeed, while a color change of the media was clearly visible for cultured planktonic Mycoplasma spp. compared to the uninoculated control media, no color change was seen in the media of mature Mycoplasma spp. biofilms after 2 days. It is interesting to note that variation in acidification was observed between the different organisms. Moreover, additional pH measurements performed with mature M. bovis PG45 biofilms over 6 d of incubation showed no evidence (Wald’s test, p > 0.05) for a difference in the pH after accounting for the variation by plate (Figure 4B). These data confirm the need for alternative assays to measure antimicrobial effects in M. bovis biofilm cultures.
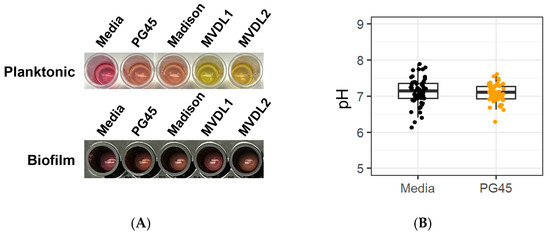
Figure 4.
Standard color change assay is inappropriate for measuring Mycoplasma spp. biofilm growth. (A) A color change due to acid production is visible for planktonic cells (top, grown for 2 d on a clear polystyrene plate), but not for mature biofilms (bottom, incubated with new media for 2 d after biofilm formation on a glass-bottom plate with black polystyrene wells). (B) Quantification of medium pH for M. bovis PG45 grown as a biofilm for 6 d. No significant difference in pH between the media control and PG45 (Student’s t-test, p > 0.05). Representative of one experiment with 60 technical replicates.
3.3. Particle Size Standardization
Having observed that the pH did not change after incubation of a mature biofilm, we developed an innovative flow cytometry-based assay to assess biofilm growth and survival. This assay, termed the live/dead antimicrobial susceptibility test (LD-AST), involves the analysis of disrupted biofilms on a flow cytometer or imaging cytometer. First, we sought to standardize the particle size of the disrupted biofilms as the staining of large cellular aggregates can cause intra-assay variability. M. bovis PG45 biofilms were scraped from the plate (untreated control) and then underwent either sonication or detergent treatment with Tween 20 to break up aggregates.
The fluorescence intensity distribution of the planktonic and differentially treated biofilm samples, which correlates with particle size, was measured using imaging cytometry (Figure 5). We observed a bimodal size distribution for planktonic M. bovis PG45 (Figure 5A) that we used to define our threshold for large and small particles. The separation occurred at 1.75 × 10³ RFU which corresponded to particles with a diameter of 5.05 ± 0.74 µm (A). Based on this definition, planktonic M. bovis samples contained 55.01 ± 12.32% of small particles. In contrast, the percentage of small particles in untreated biofilms was 22.32 ± 6.52%. Sonication treatment resulted in a moderate increase in small particles to 25.69 ± 6.33% after 6 min, and a significant increase to 31.20 ± 4.52% (Wald’s test, p = 0.015) after 10 min of sonication, whereas Tween 20 treatment resulted a decrease in small particles to 13.45 ± 1.69% (B).
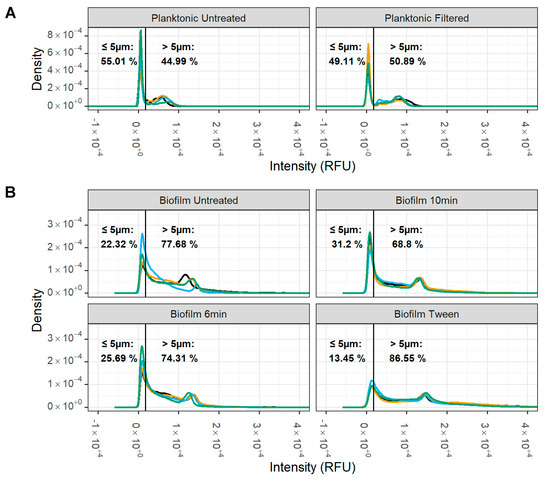
Figure 5.
Impact of biofilm disruption treatment on M. bovis particle size. Particle size of disrupted M. bovis biofilms was determined using SYTO9 stained cells with an imaging cytometer. (A) Two populations for the planktonic cells were noted, with a natural division observed at 1.75 × 10⁵ RFU, which corresponds with a particle diameter of approximately 5 µm. (B) For the disrupted biofilms, the 10 min sonication had strong evidence (Wald’s test, p = 0.015) for an increase in small particles compared to the untreated biofilms The percentage of particles above and below 5 µm was calculated for each treatment and compared. Representative of one experiment with two replicate cultures, each with two technical replicates (represented by different colored lines). Each technical replicate had ~5 × 10⁴–8 × 10⁴ particles/biofilm replicate and ~8 × 10³–16 × 103 particles/planktonic replicate.
3.4. Small Particle Analysis
Due to the technical limitations of imaging cytometry to quantify both large and small particles at the same time, a second method was used to obtain accurate data on particle size of biofilms treated with 10 min sonication: a flow cytometer equipped with a 405 nm small particle laser and size calibration beads with a range between 0.2 and 2 µm. Single M. bovis cells have an expected size range between 0.2 and 1 µm [80,81]. The flow cytometry method revealed that the planktonic M. bovis samples had a right skewed distribution with a peak corresponding to approximately 0.5 µm particles (Figure 6A). The untreated biofilm had a bimodal distribution, with the first peak corresponding to ~0.5 µm and the second peak corresponding to 1.0–2.0 µm particles, likely corresponding to aggregated cells (Figure 6B). The 10 min sonicated biofilms had a single peak corresponding to 0.5–1.0 µm particles (Figure 6C).
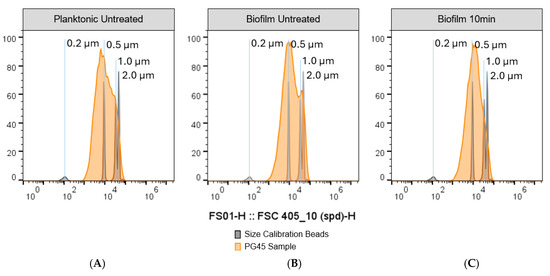
Figure 6.
Impact of 10 min of sonication on the particle size of M. bovis PG45 biofilms. The particle size of disrupted biofilms was further analyzed by observing the forward scatter from a 405 nm small particle laser and comparing it to size calibration beads. (A) Planktonic M. bovis PG45 culture. (B) Untreated M. bovis PG45 biofilm. (C) M. bovis PG45 biofilm after 10 min sonication. Representative graphs were generated by randomly selecting and concatenating 1 × 10⁶ particles from each technical replicate. Representative of one experiment with 4 technical replicates.
Consistent with these observations, mean fluorescence values corresponding to size observed were lowest for the planktonic samples, higher for the sonicated biofilms, and highest for the untreated biofilms (Figure 7), with a significant 9.37 ± 0.57% decrease (Wald’s Test, p < 0.001) in mean fluorescence after 10 min of sonication compared to the untreated biofilm (Figure 7). Similar findings were obtained with the other Mycoplasma isolates.
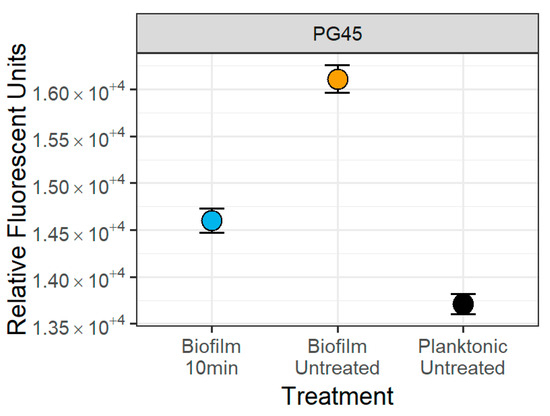
Figure 7.
Impact of 10 min of sonication on the mean fluorescence of the M. bovis PG45 particles. There was a 9.37 ± 0.57% decrease (Wald’s Test, p < 0.001) in mean particle size between the untreated biofilm and the 10 min sonicated biofilm. The point is the estimated mean and the 95% confidence interval from the separate means model. Representative of one experiment with four technical replicates.
3.5. Disaggregation Method Survival
Having demonstrated that a 10 min sonication increased the proportion of small particles in the M. bovis PG45 biofilms, we next assessed whether the cells survived the sonication treatment. We also sought to ensure that there were no significant differences between measurements obtained using flow cytometry and imaging cytometry. The percentage of live cells (Figure 8A) was generally high, with >90% live bacteria detected with both methods. There was no difference between the untreated and the sonication-treated biofilms (one-sided Welch’s t-test, p > 0.05), and between measurements obtained using the imaging cytometry and flow (two-sided Welch’s t-test, p > 0.05).
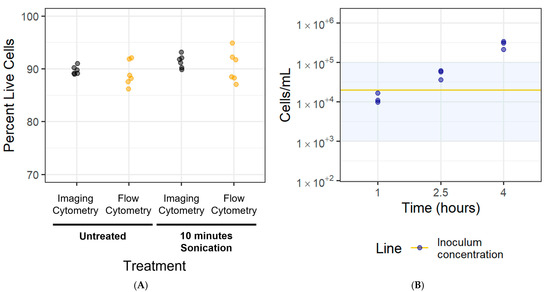
Figure 8.
Analysis of cell viability and density for the LD-AST. (A) The survival of filtered cells exposed to 10 min of sonication and the rate of cell adherence was assessed. Filtered planktonic cells were sonicated for 10 min to determine if the treatment would lead to a decrease in live cells. The imaging and flow cytometry results were compared. Representative of one experiment with six technical replicates. (B) Cells inoculated at 2 × 10⁴/mL were imaged at 1, 2.5, and 4 h intervals to determine the rate of adhesion to the glass-bottom plate. The line represents the inoculum concentration while the shaded area represents the 103–105 cells/mL target range. Representative of one experiment with three technical replicates.
3.6. Cell Adhesion Rate for Newly Adhered Biofilms
To standardize cell counts for the newly adhered biofilm-based assay, the rate at which the cells adhered to the glass-bottom plate was investigated over 1–4 h. Our goal was to achieve a cell concentration of 103–105 cells/mL, which is used in color change MIC assays for Mycoplasma [32]. We considered these newly adherent cells as our newly adhered biofilm. M. bovis PG45 cells were inoculated at 2 × 10⁴ cells/mL into the wells, incubated for 1–4 h, and then were recovered and analyzed. The mean concentration of adhered cells was 1.26 × 10⁴ ± 3.76 × 10³ cells/mL after 1 h of incubation, 5.19 × 10⁴ ± 1.39 × 10⁴ cells/mL after 2.5 h of incubation, and 2.87 × 10⁵ ± 6.89 × 10⁴ cells/mL after 4 h (Figure 8B). Based on these results, we selected an incubation time of 1 h for the newly adhered M. bovis PG45 biofilms to achieve a cell concentration in the required 103–105 cells/mL range. When repeating this for the M. bovis Madison strain and the M. bovoculi MVDL1 and MVDL2 clinical isolates, an incubation time of 30 min was sufficient for reaching the desired cell concentration.
3.7. Antimicrobial Susceptibility Testing
We next integrated the optimized culture and disruption methods for Mycoplasma biofilms into our novel flow cytometry-based LD-AST protocol to measure antibiotic susceptibility of Mycoplasma biofilms. The metric defined for MBC≥5% is the lowest concentration that led to a ≥5% decrease in the proportion of live cells. Based on this definition, we observed an MBC≥5% for M. bovis PG45 exposed to enrofloxacin of 0.156 µg/mL for the planktonic cells, >10 µg/mL for newly adhered biofilms, and 0.078 µg/mL for mature biofilms (Figure 9A and Table 3). This represents a >64-fold increase in resistance with the newly adhered biofilms compared to the planktonic cells, but a 2-fold decrease in the resistance for the mature biofilm. The MBC≥5% for gentamicin with M. bovis PG45 was 4 µg/mL for planktonic cells, >128 µg/mL for newly adhered biofilms, and 8 µg/mL for mature biofilms (Figure 9B and Table 3). This represents a >32-fold and a 2-fold increase in antibiotic resistance for both the newly adhered biofilm and mature biofilms, respectively. The MBC≥5% for M. bovis PG45 exposed to tetracycline was 0.125 µg/mL for planktonic cells and increased by >128-fold to >16 µg/mL for newly adhered biofilms, and by 2-fold to 0.25 µg/mL for the mature biofilm (Figure 9C and Table 3). Paradoxically, at the highest concentrations of enrofloxacin (10 µg/mL) and tetracycline (16 µg/mL), the mature biofilm showed an increase in live cells compared to baseline levels, representing resistance to treatment.
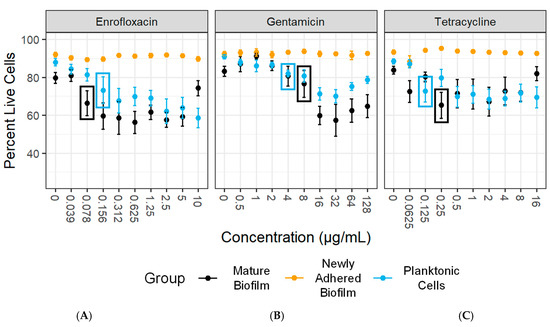
Figure 9.
The LD-AST reveals increased MBCs for M. bovis PG45 biofilms compared to planktonic bacteria. Minimum bactericidal concentration of a decrease in live cells ≥ 5% (MBC ≥ 5%) data showing the percentage of live cells compared to (A) enrofloxacin, (B) gentamicin, and (C) tetracycline concentrations for each of the organism states. The colored boxes correspond to the lowest antibiotic concentration that resulted in a significant drop in the percentage of live cells. The mean and SEM are shown for each group. Representative of three independent experiments with 2 technical replicates.
Table 3.
MBC≥5% concentration in µg/mL by organism state (planktonic, newly adhered biofilms, mature biofilm).
When we performed the LD-AST with the additional Mycoplasma isolates, we observed that the M. bovis Madison strain exposed had no change in susceptibility to enrofloxacin between the planktonic, newly adhered biofilm, and mature biofilm (Table 3). For gentamicin we observed a 2-fold increase in antibiotic resistance between the planktonic cells and newly adhered biofilm, but a 4-fold decrease in resistance with the mature biofilm (Table 3). We also observed that for tetracycline, M. bovis Madison had a >2-fold decrease in resistance for both the newly adhered and mature biofilms compared to planktonic cells (Table 3).
For the M. bovoculi MVDL1 isolate exposed to enrofloxacin, we observed a >256-fold increase in resistance for the newly adhered biofilms and >8-fold resistance for the mature biofilm compared to the planktonic cells. For gentamicin, we observed that the MVDL1 isolate had >64-fold increase in resistance for the newly adhered biofilm and a >8-fold increase in resistance for the mature biofilm. With tetracycline exposure, the MVDL1 isolate had a >256-fold increase in resistance for the newly adhered biofilm and a >8-fold increase in resistance for the mature biofilm (Table 3). These results show a general trend of large increases in resistance for both the newly adhered biofilms and the mature biofilms for the MVDL1 isolate.
For the M. bovoculi MVDL2 isolate exposed to enrofloxacin, we observed a >256-fold increase in resistance for the newly adhered biofilm and no change for the mature biofilm compared to the planktonic cells. For gentamicin, we observed >8-fold increase in resistance with the newly adhered biofilms, and a >4-fold decrease in resistance for the mature biofilms. For tetracycline, we observed a >128-fold increase in resistance for the newly adhered biofilm and >2-fold decrease in resistance for the mature biofilm (Table 3).
3.8. Statistical Diagnostics Assessment
The model fit for the separate means mixed models was assessed for both linearity and normality of the residuals and no severe violations were noted for the linearity, but some of the live percentage separate means mixed models had severe violations of normality. Mixed-effect models, however, are robust to violations of normality, with the resulting effect of these violations being a larger uncertainty estimate [82]. The Welch’s t-tests that were performed on the disruption survival data were determined to be appropriate as there were no severe violations of the normality assumption.
4. Discussion
In this study, we developed an innovative method for antimicrobial susceptibility testing in Mycoplasma biofilms. For the culture conditions and Mycoplasma strains used here, the pH color change was suitable to monitor growth of planktonic cells (Figure 4A), albeit with variable acidification observed with different Mycoplasma strains and isolates. This pH dependent color change, however, was unsuitable for biofilms, since biofilm cultures of bovine Mycoplasma spp. did not cause a color change of the culture media upon growth, as we showed. The lack of color change in the media found in our experiment was likely related to either the changes in biofilm metabolism and the metabolic dormancy in the biofilm formation reported for various bacterial species including Mycoplasma, or the physical barrier of the EPM altering the diffusion of metabolites [42,51,52,53,83,84,85].
We demonstrated here an innovative AST for Mycoplasma biofilms using flow cytometry with live/dead staining with disaggregated Mycoplasma biofilms. The application of flow cytometry for the analysis of antimicrobial effects on Mycoplasma spp. has been described previously, but only with planktonic organisms [86,87]. Our study sought to standardize methods for utilizing this technique for biofilm-forming Mycoplasma spp. Importantly, results for planktonic M. bovis PG45 analyzed with our LD-AST (MBC≥5% values) matched previously published values for MIC, at 4 µg/mL for gentamicin [33,88] 0.16 µg/mL for enrofloxacin [88], and 0.125 µg/mL for tetracycline [33]. Interestingly however, no antibiotic concentration was able to reduce the mean percentage of live cells to <45% for any of the tested organisms. This might be due to autoaggregation of the cells, as evidenced from our imaging cytometry data where the population of planktonic cells was 44.99 ± 12.32% larger than 5 µm. Autoaggregation has also been shown to be part of the biofilm formation cycle, and has been previously associated with increases in antibiotic resistance with other organisms, even when not attached to a surface [89,90].
What is interesting about these results generally is that the newly adhered biofilm led to increased resistance in all the tested isolates and antibiotics except for M. bovis Madison exposed to enrofloxacin or gentamicin. This phenomenon of biofilms able to withstand increased concentrations of antibiotics has also been termed “tolerance” in several studies [91,92], since decreased susceptibility to antibiotics in biofilms is thought to be caused by the expression of wild-type genes rather than due to genetic mutation or antimicrobial resistance gene acquisition [93]. However, we use the term “resistance”, based on the general definition that resistance is the “development of the ability to withstand the previously destructive effect of a drug by microorganisms” [94] and previous usage of the term “resistance” by other studies to describe this innate antimicrobial resistance by biofilm formation [48,50,95,96]. For newly adhered biofilms, we observed increases in resistance for all three antibiotics in the M. bovis PG45, M. bovoculi MVDL1, and MVDL2 isolates. For the remaining isolate M. bovis Madison, we observed an increase in resistance to gentamicin. These differences in observed susceptibility between the planktonic cells and the biofilm states match previous studies on increased antimicrobial resistance in biofilms formed by other bacteria [49,97].
Data were more variable for mature biofilms. We observed a 2-fold decrease in enrofloxacin resistance for mature biofilms of M. bovis PG45, and no change in susceptibility for mature biofilms of M. bovis Madison and M. bovoculi MVDL2. This might be due to the inhibition of nuclease synthesis by enrofloxacin, as extracellular DNA (eDNA) is important in adherence of other Mycoplasma biofilms [98]. The M. bovis Madison strain and M. bovoculi MVDL2 isolate are also interesting, as both organisms saw a ≥2-fold decrease in susceptibility for both gentamicin and tetracycline. As both organisms took longer to reach peak biofilm maturity (5 d) compared to the other isolates (4 d), and as peak biofilm confluence for M. bovis Madison was low (8.99 ± 0.81%), the differential results obtained with the different strains might reflect differences in their ability to form biofilms. For M. bovis PG45 and M. bovoculi MVDL1, 2-fold and 8-fold increases in resistance, respectively, were observed for both gentamicin and tetracycline MBC≥5% compared to the planktonic cells. The EPM and eDNA of the mature biofilm in these organisms likely provided resistance from gentamicin [97,98,99].
Interestingly, we observed that mature biofilms of M. bovis PG45 were completely resistant to the bactericidal effects of the highest concentration of enrofloxacin (10 µg/mL). Similar observations were made for mature biofilms of M. bovis PG45, M. bovis Madison, and M. bovoculi MVDL2 treated with tetracycline, where the highest concentration (16 µg/mL) failed to kill the bacteria, but lower concentrations led to significantly decreased viability. This decrease in efficacy of enrofloxacin in the mature biofilms at the highest concentrations may represent the “paradoxical” or “Eagle effect” [31,100]. The Eagle effect is a phenomenon where higher drug concentrations can result in increased resistance by the organism, while it shows susceptibility to lower drug concentrations [31]. This effect has been seen in both bacterial and fungal biofilms, where increases in antimicrobial concentrations resulted in increased cellular survival in the biofilm [41,101].
Notably, a previous study by McAuliffe et al. [43] investigated M. bovis biofilms and found no difference in antimicrobial susceptibility upon biofilm formation. However, the color change assay was used in their study, which cannot accurately determine biofilm growth. Moreover, we showed that the effect of biofilm formation on antibiotic resistance was highly variable and depended on the Mycoplasma isolate and the time after biofilm formation, with a strong reduction in antimicrobial susceptibility seen with newly adhered biofilms only. In McAuliffe’s study, biofilms were cultured for 24 h before antibiotics were added [43], whereas we exposed biofilms to antibiotics after 1 h or 4–5 d of growth.
Our results support the hypothesis that Mycoplasma biofilms have increased resistance to antibiotics, which may be due to several biofilm-associated mechanisms. First, the EPM can act as a physical barrier to antibiotic diffusion, slowing or preventing interaction of the antibiotics with their cellular targets [102]. Enrofloxacin is a fluoroquinolone antibiotic that inhibits nucleic acid synthesis by disrupting the DNA gyrase and topoisomerase IV enzymes [103]. Resistance to fluoroquinolones has been positively correlated with the bacterial SOS response, which is a series of proteins produced during cellular distress to maintain DNA integrity [104]. This SOS response has been observed as a likely cause of fluoroquinolone resistance in Mycoplasma gallisepticum biofilms [105], and genes for the SOS system have been described in M. bovis [106]. The second antibiotic we tested, gentamicin, is an aminoglycoside antibiotic that inhibits protein synthesis by causing conformational changes to the 16S ribosomal RNA component of the 30S ribosome subunit, which results in the mistranslation of proteins [99]. Biofilm resistance to aminoglycosides may be partially due to the negative charge of the EPM and the positive charge of the antibiotic, which limits penetration [98]. The eDNA component of the EPM also can contribute to resistance, as even low concentrations in biofilms have been shown to chelate cations and lead to fluoroquinolone resistance [107]. Mycoplasma biofilms in other species have both negatively charged EPM as well as eDNA [48,108], which supports a role for both the EPM and the eDNA in the resistance of M. bovis biofilms to gentamicin. The third antibiotic that we tested, tetracycline, inhibits protein synthesis by preventing attachment of aminoacyl-tRNA to the ribosomal A acceptor site [109]. In many organisms, expression of efflux pumps that remove antibiotics such as tetracycline from the organism is associated with resistance [98]. Efflux pumps have also been associated with general biofilm formation, as they can contribute to biofilm formation by the secretion of EPM components [110]. Efflux pump-associated genes have also been observed in M. bovis, which may help explain our observed resistance to tetracycline by M. bovis PG45 [111].
The CLSI states that while the minimal concentration needed to kill 99.9% of the cells is the most common estimation of MBC, this definition is arbitrary and may lack biological relevance [31]. Notably, the MBC≥5% determined with our assay matched the published MIC values obtained by the standard microdilution assay for planktonic M. bovis PG45 for all the antibiotics tested, supporting the validity of our approach [33,88].
Glass often allows for the formation of biofilms and M. bovis biofilm formation on glass has been previously described [43], as well as for other Mycoplasma spp. [108,112]. This informed our choice to use glass-bottom plates in both the newly adhered and mature biofilms. For the newly adhered biofilms, the determination of the cell adherence rate of M. bovis was crucial for allowing us to obtain the same starting concentration as our planktonic cells. This approach allowed us to directly compare the new LD-AST to the standard colorimetric assay, as the cell concentration was in the same range when the antibiotics were added.
For the mature biofilms, we wanted to define experimental conditions that were in line with the current understanding of the biofilm life cycle, which involves cell attachment, maturation, and dispersion [50]. Unfortunately, the biofilm formation cycle for Mycoplasma spp. is not well described. A few studies have worked to address this in various Mycoplasma spp. by characterizing the adhesion, aggregation, and percentage of area covered [113,114], the extracellular matrix composition [108], and gene expression [114]. Even with these studies, a complete understanding of the specific cycle of formation and dispersion is not well understood, and so the application of knowledge from other bacterial species has been applied in this study. In the classical understanding of biofilm formation cycles by other bacteria, the development of a three-dimensional structure is associated with maturity, after which the bacteria disperse, which leads to both the spread of the organism and a decrease in the biofilm biomass [115]. This model matches our observation that the biofilm biomass peaked at 4–5 d, likely representing maturation, and decreased significantly afterwards, possibly reflecting dispersion.
When we investigated the particle size of the planktonic cells, an interesting trend was noted where the filtered cells still had a diameter larger than the 0.45 µm pore size for the syringe filter. The diameter for single M. bovis cells is between 0.2–1.0 µm [80,81], and our flow cytometry experiments confirmed that planktonic M. bovis was within the 0.5–1.0 µm range. In a study investigating filtration, soft particles were able to deform and translocate across filter pores that were smaller than the particles [116]. As Mycoplasma spp. lack a cell wall, the bacteria likely passed through the filter pores by deformation.
We are aware that this study still had some limitations, as we only utilized four Mycoplasma isolates, three antibiotics, and a limited number of disruption techniques. Our study also only performed a limited investigation into Mycoplasma biofilm maturity and did not investigate any mechanisms of resistance conferred by the formation of the biofilms. These are important factors for the understanding and characterization of both biofilms and resistance by M. bovis and should be explored further. Also, we did not validate our AST results with the gold standard color change assay, but instead relied on published MIC values. While these limitations do exist, the overall methodology should remain viable with minimal adaptation for other antibiotics, M. bovis and M. bovoculi strains, and Mycoplasma spp.
In summary, we utilized the LD-AST to directly compare the antibiotic susceptibilities of M. bovis biofilms and planktonic cells, with reproducible results. The MBC≥5% we observed for planktonic cells corresponded with the MIC values obtained with the standard microdilution method. We anticipate that the new LD-AST method will allow for further comparison of the resistive effects of biofilm formation by other Mycoplasma spp. and will better inform whether antibiotic treatments might be successful in treating infection.
Supplementary Materials
The following supporting information can be downloaded at: https://www.mdpi.com/article/10.3390/microorganisms12122650/s1, Table S1: Catalog numbers and manufacturers for the materials used; Table S2: Estimated pH model output; Table S3: Particle disruption model output; Table S4: Small particle (405 nm) model output; Table S5: PG45 maturity structure measurement model; Table S6: PG45 maturity confluence model; Table S7: Madison maturity structure measurement model; Table S8: Madison maturity confluence model; Table S9: MVDL1 maturity structure measurement model; Table S10: MVDL1 maturity confluence model; Table S11: MVDL2 maturity structure measurement model; Table S12: MVDL2 maturity confluence model; Table S13: Mature PG45 percent live model (PLM) for enrofloxacin; Table S14: Mature PG45 PLM for gentamicin; Table S15: Mature PG45 PLM for tetracycline; Table S16: NAB PG45 PLM for enrofloxacin; Table S17: NAB PG45 PLM for gentamicin; Table S18: NAB PG45 PLM for tetracycline; Table S19: Planktonic PG45 PLM for enrofloxacin; Table S20: Planktonic PG45 PLM for gentamicin; Table S21: Planktonic PG45 PLM for tetracycline; Table S22: Mature Madison PLM for enrofloxacin; Table S23: Mature Madison PLM for gentamicin; Table S24: Mature Madison PLM for tetracycline; Table S25: NAB Madison PLM for enrofloxacin; Table S26: NAB Madison PLM for gentamicin; Table S27: NAB Madison PLM for tetracycline; Table S28: Planktonic Madison PLM for enrofloxacin; Table S29: Planktonic Madison PLM for gentamicin; Table S30: Planktonic Madison PLM for tetracycline; Table S31: Mature MVDL1 PLM for enrofloxacin; Table S32: Mature MVDL1 PLM for gentamicin; Table S33: Mature MVDL1 PLM for tetracycline; Table S34: NAB MVDL1 PLM for enrofloxacin; Table S35: NAB MVDL1 PLM for gentamicin; Table S36: NAB MVDL1 PLM for tetracycline; Table S37: Planktonic MVDL1 PLM for enrofloxacin; Table S38: Planktonic MVDL1 PLM for gentamicin; Table S39: Planktonic MVDL1 PLM for tetracycline; Table S40: Mature MVDL2 PLM for enrofloxacin; Table S41: Mature MVDL2 PLM for gentamicin; Table S42: Mature MVDL2 PLM for tetracycline; Table S43: NAB MVDL2 PLM for enrofloxacin; Table S44: NAB MVDL2 PLM for gentamicin; Table S45: NAB MVDL2 PLM for tetracycline; Table S46: Planktonic MVDL2 PLM for enrofloxacin; Table S47: Planktonic MVDL2 PLM for gentamicin; Table S48: Planktonic MVDL2 PLM for tetracycline.
Author Contributions
Conceptualization, B.T.J., E.R.S., D.B. and J.D.-D.; methodology, B.T.J.; software, B.T.J., M.T. and C.C.; validation, J.D.-D., B.T.J. and E.T.S.; formal analysis, B.T.J., M.T. and C.C.; investigation, J.D.-D., B.T.J., E.T.S., M.Q., L.Z. and S.S.; resources, D.B. and B.T.J.; data curation, B.T.J., J.D.-D. and E.T.S.; writing—original draft preparation, B.T.J. and J.D.-D.; writing—review and editing, B.T.J., J.D.-D., D.B., E.R.S. and E.T.S.; visualization, B.T.J. and J.D.-D.; supervision, B.T.J. and D.B.; project administration, B.T.J. and D.B.; funding acquisition, D.B., B.T.J. and J.D.-D. All authors have read and agreed to the published version of the manuscript.
Funding
Funding for this research was provided by the USDA NIFA AFRI Animal Health & Disease Program (Grant no. 2022-67016-36503), (Equipment Grant no. 2023-70410-41180), the Montana Agricultural Experiment Station (MONB00450), USDA/NIFA Animal Health Funds, and the Johnson Family Foundation (to D.B.); by the National Institutes of Health Institute of Translational Health Sciences (UL1 TR002319) and a Predoctoral Fellowship from USDA NIFA (Grant no. 2023-67011-40356) (to B.T.J.); and by a MT INBRE Undergraduate Scholar Award (to J.D.).
Data Availability Statement
The data for the experiments described above can be found at: https://doi.org/10.5061/dryad.m905qfv8m.
Acknowledgments
The authors would like to thank Kaylee Shrader, Montana Veterinary Diagnostic Laboratory, for supporting the project through answering technical questions from B.T.J. and Michelle Cherne for her comprehensive feedback on our manuscript.
Conflicts of Interest
The authors declare no conflicts of interest.
References
- White, B.J.; Larson, B.L. Impact of bovine respiratory disease in U.S. beef cattle. Anim. Health Res. Rev. 2020, 21, 132–134. [Google Scholar] [CrossRef] [PubMed]
- Cusack, P. Evaluation of practices used to reduce the incidence of bovine respiratory disease in Australian feedlots (to November 2021). Aust. Vet. J. 2023, 101, 230–247. [Google Scholar] [CrossRef] [PubMed]
- Punyapornwithaya, V.; Fox, L.K.; Hancock, D.D.; Gay, J.M.; Alldredge, J.R. Association between an outbreak strain causing mycoplasma bovis mastitis and its asymptomatic carriage in the herd: A case study from Idaho, USA. Prev. Vet. Med. 2010, 93, 66–70. [Google Scholar] [CrossRef] [PubMed]
- Wilson, D.J.; Skirpstunas, R.T.; Trujillo, J.D.; Cavender, K.B.; Bagley, C.V.; Harding, R.L. Unusual history and initial clinical signs of Mycoplasma bovis mastitis and arthritis in first-lactation cows in a closed commercial dairy herd. J. Am. Vet. Med. Assoc. 2007, 230, 1519–1523. [Google Scholar] [CrossRef] [PubMed]
- Dudek, K.; Bednarek, D.; Lisiecka, U.; Kycko, A.; Reichert, M.; Kostro, K.; Winiarczyk, S. Analysis of the Leukocyte Response in Calves Suffered from Mycoplasma bovis Pneumonia. Pathogens 2020, 9, 407. [Google Scholar] [CrossRef]
- Bringhenti, L.; Pallu, M.; Silva, J.C.; Tomazi, T.; Tomazi, A.C.C.H.; Rodrigues, M.X.; Cruzado-Bravo, M.; Bilby, T.R.; Bicalho, R.C. Effect of treatment of pneumonia and otitis media with tildipirosin or florfenicol + flunixin meglumine on health and upper respiratory tract microbiota of preweaned Holstein dairy heifers. J. Dairy Sci. 2021, 104, 10291–10309. [Google Scholar] [CrossRef]
- Ayling, R.; Bashiruddin, S.; Nicholas, R. Mycoplasma species and related organisms isolated from ruminants in Britain between 1990 and 2000. Vet. Rec. 2004, 155, 413–416. [Google Scholar] [CrossRef]
- Dudek, K.; Nicholas, R.A.J.; Szacawa, E.; Bednarek, D. Mycoplasma bovis Infections—Occurrence, Diagnosis and Control. Pathogens 2020, 9, 640. [Google Scholar] [CrossRef]
- Bokma, J.; Gille, L.; De Bleecker, K.; Callens, J.; Haesebrouck, F.; Pardon, B.; Boyen, F. Antimicrobial Susceptibility of Mycoplasma bovis Isolates from Veal, Dairy and Beef Herds. Antibiotics 2020, 9, 882. [Google Scholar] [CrossRef]
- Liu, Y.; Xu, S.; Li, M.; Zhou, M.; Huo, W.; Gao, J.; Liu, G.; Kastelic, J.P.; Han, B. Molecular characteristics and antibiotic susceptibility profiles of Mycoplasma bovis associated with mastitis on dairy farms in China. Prev. Vet. Med. 2020, 182, 105106. [Google Scholar] [CrossRef]
- García-Galán, A.; Seva, J.; Gómez-Martín, Á.; Ortega, J.; Rodríguez, F.; García-Muñoz, Á.; De la Fe, C. Importance and Antimicrobial Resistance of Mycoplasma bovis in Clinical Respiratory Disease in Feedlot Calves. Animals 2021, 11, 1470. [Google Scholar] [CrossRef] [PubMed]
- Kinnear, A.; McAllister, T.A.; Zaheer, R.; Waldner, M.; Ruzzini, A.C.; Andrés-Lasheras, S.; Parker, S.; Hill, J.E.; Jelinski, M.D. Investigation of Macrolide Resistance Genotypes in Mycoplasma bovis Isolates from Canadian Feedlot Cattle. Pathogens 2020, 9, 622. [Google Scholar] [CrossRef] [PubMed]
- Ayling, R.D.; Baker, S.E.; Nicholas, R.A.J.; Peek, M.L.; Simon, A.J. Comparison of in vitro activity of danofloxacin, florfenicol, oxytetracycline, spectinomycin and tilmicosin against recent field isolates of Mycoplasma bovis. Vet. Rec. 2000, 146, 745–747. [Google Scholar] [CrossRef] [PubMed]
- Francoz, D.; Fortin, M.; Fecteau, G.; Messier, S. Determination of Mycoplasma bovis susceptibilities against six antimicrobial agents using the E test method. Vet. Microbiol. 2005, 105, 57–64. [Google Scholar] [CrossRef] [PubMed]
- Klein, U.; de Jong, A.; Youala, M.; El Garch, F.; Stevenin, C.; Moyaert, H.; Rose, M.; Catania, S.; Gyuranecz, M.; Pridmore, A.; et al. New antimicrobial susceptibility data from monitoring of Mycoplasma bovis isolated in Europe. Vet. Microbiol. 2019, 238, 108432. [Google Scholar] [CrossRef]
- Ayling, R.D.; Rosales, R.S.; Barden, G.; Gosney, F.L. Changes in antimicrobial susceptibility of Mycoplasma bovis isolates from Great Britain. Vet. Rec. 2014, 175, 486. [Google Scholar] [CrossRef]
- Barber, D.M.; Jones, G.E.; Wood, A. Microbial flora of the eyes of cattle. Vet. Rec. 1986, 118, 204–206. [Google Scholar] [CrossRef]
- Kahane, I.; Adoni, A. Rapid Diagnosis of Mycoplasmas; Springer: New York, NY, USA, 2012. [Google Scholar]
- Levisohn, S.; Garazi, S.; Gerchman, I.; Brenner, J. Diagnosis of a mixed mycoplasma infection associated with a severe outbreak of bovine pinkeye in young calves. J. Vet. Diagn. Invest. 2004, 16, 579–581. [Google Scholar] [CrossRef]
- Loy, J.D.; Clothier, K.A.; Maier, G. Component Causes of Infectious Bovine Keratoconjunctivitis—Non-Moraxella Organisms in the Epidemiology of Infectious Bovine Keratoconjunctivitis. Vet. Clin. Food Anim. Pract. 2021, 37, 295–308. [Google Scholar] [CrossRef]
- Midla, L. Infectious bovine keratoconjunctivitis: A practical yet evidence-based approach to treatment and prevention on dairy farms. In Proceedings of the 54th Annual Conference Proceedings of the American Library Association, New Orleans, LA, USA, 25–30 April 2021; pp. 80–83. [Google Scholar]
- Rosenbusch, R.; Knudtson, W. Bovine mycoplasmal conjunctivitis: Experimental reproduction and characterization of the disease. Cornell Vet. 1980, 70, 307–320. [Google Scholar]
- Friis, N.F.; Pedersen, K.B. Isolation of Mycoplasma bovoculi from cases of infectious bovine keratoconjunctivitis. Acta Vet. Scand. 1979, 20, 51–59. [Google Scholar] [CrossRef] [PubMed]
- Schnee, C.; Heller, M.; Schubert, E.; Sachse, K. Point prevalence of infection with Mycoplasma bovoculi and Moraxella spp. in cattle at different stages of infectious bovine keratoconjunctivitis. Vet. J. 2015, 203, 92–96. [Google Scholar] [CrossRef]
- Thacker, E.L. Mycoplasmal diseases. Dis. Swine 2006, 9, 701–717. [Google Scholar]
- Besser, T.E.; Levy, J.; Ackerman, M.; Nelson, D.; Manlove, K.; Potter, K.A.; Busboom, J.; Benson, M. A pilot study of the effects of Mycoplasma ovipneumoniae exposure on domestic lamb growth and performance. PLoS ONE 2019, 14, e0207420. [Google Scholar] [CrossRef] [PubMed]
- Goltz, J.P.; Rosendal, S.; McCraw, B.M.; Ruhnke, H.L. Experimental studies on the pathogenicity of Mycoplasma ovipneumoniae and Mycoplasma arginini for the respiratory tract of goats. Can. J. Vet. Res. 1986, 50, 59–67. [Google Scholar]
- Resende, T.P.; Pieters, M.; Vannucci, F.A. Swine conjunctivitis outbreaks associated with Mycoplasma hyorhinis. J. Vet. Diagn. Investig. 2019, 31, 766–769. [Google Scholar] [CrossRef]
- Dhondt, A.A.; States, S.L.; Dhondt, K.V.; Schat, K.A. Understanding the origin of seasonal epidemics of mycoplasmal conjunctivitis. J. Anim. Ecol. 2012, 81, 996–1003. [Google Scholar] [CrossRef]
- Baumworcel, N.; Soares, A.M.B.; Silva, S.B.; Almeida, N.K.O.; de Castro, T.X. Correlation between clinical signs of feline conjunctivitis and molecular detection of felid herpesvirus-1, feline calicivirus, Chlamydophila felis and Mycoplasma felis in cats from shelters in Rio de Janeiro. Braz. J. Vet. Res. Anim. Sci. 2017, 54, 18–26. [Google Scholar] [CrossRef]
- CLSI—Clinical and Laboratory Standards Institute. Methods for Determining Bactericidal Activity of Antimicrobial Agents; Approved Guideline; Clinical and Laboratory Standards Institute: Wayne, PA, USA, 1999. [Google Scholar]
- Hannan, P.C. Guidelines and recommendations for antimicrobial minimum inhibitory concentration (MIC) testing against veterinary mycoplasma species. International Research Programme on Comparative Mycoplasmology. Vet. Res. 2000, 31, 373–395. [Google Scholar] [CrossRef]
- Gütgemann, F.; Müller, A.; Churin, Y.; Kumm, F.; Braun, A.S.; Yue, M.; Eisenberg, T.; Entorf, M.; Peters, T.; Kehrenberg, C. Toward a Method for Harmonized Susceptibility Testing of Mycoplasma bovis by Broth Microdilution. J. Clin. Microbiol. 2023, 61, e01905-22. [Google Scholar] [CrossRef]
- Balish, M.F.; Chopra-Dewasthaly, R.; Pereyre, S.; Ramírez, A.S.; Viver, T.; Spergser, J. Mycoplasma. In Bergey’s Manual of Systematics of Archaea and Bacteria; Wiley: Hoboken, NJ, USA, 2024; pp. 1–101. [Google Scholar]
- Waites, K.B.; Crabb, D.M.; Duffy, L.B.; Jensen, J.S.; Liu, Y.; Paukner, S. In Vitro Activities of Lefamulin and Other Antimicrobial Agents against Macrolide-Susceptible and Macrolide-Resistant Mycoplasma pneumoniae from the United States, Europe, and China. Antimicrob. Agents Chemother. 2017, 61, e02008-16. [Google Scholar] [CrossRef] [PubMed]
- Waites, K.B.; Crabb, D.M.; Duffy, L.B. Inhibitory and bactericidal activities of gemifloxacin and other antimicrobials against Mycoplasma pneumoniae. Int. J. Antimicrob. Agents 2003, 21, 574–577. [Google Scholar] [CrossRef] [PubMed]
- Tavío, M.M.; Poveda, C.; Assunção, P.; Ramírez, A.S.; Poveda, J.B. In vitro activity of tylvalosin against Spanish field strains of Mycoplasma hyopneumoniae. Vet. Rec. 2014, 175, 539. [Google Scholar] [CrossRef] [PubMed]
- Zhu, H.; Cai, Y.; Slimmen, L.J.M.; de Bruijn, A.; van Rossum, A.M.C.; Folkerts, G.; Braber, S.; Unger, W.W.J. Galacto-Oligosaccharides as an Anti-Infective and Anti-Microbial Agent for Macrolide-Resistant and -Sensitive Mycoplasma pneumoniae. Pathogens 2023, 12, 659. [Google Scholar] [CrossRef] [PubMed]
- Sanchez, C.J., Jr.; Mende, K.; Beckius, M.L.; Akers, K.S.; Romano, D.R.; Wenke, J.C.; Murray, C.K. Biofilm formation by clinical isolates and the implications in chronic infections. BMC Infect. Dis. 2013, 13, 47. [Google Scholar] [CrossRef]
- Feng, C.; Huang, Y.; Yu, Y.; Duan, G.; Dai, Y.; Dongs, K.; Li, Q. Effects on quinolone resistance due to the biofilm formation activity in Ureaplasma urealyticum. Turk. J. Med. Sci. 2015, 45, 55–59. [Google Scholar] [CrossRef]
- Marchi, A.P.; Farrel Côrtes, M.; Vásconez Noguera, S.; Rossi, F.; Levin, A.S.; Figueiredo Costa, S.; Perdigão Neto, L.V. Chlorhexidine susceptibility and Eagle effect in planktonic cells and biofilm of nosocomial isolates. Eur. J. Clin. Microbiol. Infect. Dis. 2023, 42, 787–792. [Google Scholar] [CrossRef]
- Wood, T.K.; Knabel, S.J.; Kwan, B.W. Bacterial Persister Cell Formation and Dormancy. Appl. Environ. Microbiol. 2013, 79, 7116–7121. [Google Scholar] [CrossRef]
- McAuliffe, L.; Ellis, R.J.; Miles, K.; Ayling, R.D.; Nicholas, R.A.J. Biofilm formation by mycoplasma species and its role in environmental persistence and survival. Microbiology 2006, 152, 913–922. [Google Scholar] [CrossRef]
- Burki, S.; Frey, J.; Pilo, P. Virulence, persistence and dissemination of Mycoplasma bovis. Vet. Microbiol. 2015, 179, 15–22. [Google Scholar] [CrossRef]
- Jacques, M.; Aragon, V.; Tremblay, Y.D.N. Biofilm formation in bacterial pathogens of veterinary importance. Anim. Health Res. Rev. 2010, 11, 97–121. [Google Scholar] [CrossRef] [PubMed]
- Gomes, F.; Saavedra, M.J.; Henriques, M. Bovine mastitis disease/pathogenicity: Evidence of the potential role of microbial biofilms. Pathog. Dis. 2016, 74, ftw006. [Google Scholar] [CrossRef] [PubMed]
- Chen, S.; Hao, H.; Zhao, P.; Ji, W.; Li, M.; Liu, Y.; Chu, Y. Differential Immunoreactivity to Bovine Convalescent Serum Between Mycoplasma bovis Biofilms and Planktonic Cells Revealed by Comparative Immunoproteomic Analysis. Front. Microbiol. 2018, 9, 379. [Google Scholar] [CrossRef] [PubMed]
- Feng, M.; Schaff, A.C.; Balish, M.F. Mycoplasma pneumoniae biofilms grown in vitro: Traits associated with persistence and cytotoxicity. Microbiology 2020, 166, 629–640. [Google Scholar] [CrossRef]
- Kang, T.; Zhou, M.; Yan, X.; Song, S.; Yuan, S.; Yang, H.; Ding, H.; Jiang, H.; Zhang, D.; Bai, Y.; et al. Biofilm formation and correlations with drug resistance in Mycoplasma synoviae. Vet. Microbiol. 2023, 283, 109777. [Google Scholar] [CrossRef]
- Andrés-Lasheras, S.; Zaheer, R.; Jelinski, M.; McAllister, T.A. Role of biofilms in antimicrobial resistance of the bacterial bovine respiratory disease complex. Front. Vet. Sci. 2024, 11, 1353551. [Google Scholar] [CrossRef]
- Awadh, A.A.; Le Gresley, A.; Forster-Wilkins, G.; Kelly, A.F.; Fielder, M.D. Determination of metabolic activity in planktonic and biofilm cells of Mycoplasma fermentans and Mycoplasma pneumoniae by nuclear magnetic resonance. Sci. Rep. 2021, 11, 5650. [Google Scholar] [CrossRef]
- Carvalhais, V.; França, A.; Cerca, F.; Vitorino, R.; Pier, G.B.; Vilanova, M.; Cerca, N. Dormancy within Staphylococcus epidermidis biofilms: A transcriptomic analysis by RNA-seq. Appl. Microbiol. Biotechnol. 2014, 98, 2585–2596. [Google Scholar] [CrossRef]
- Kim, J.; Hahn, J.-S.; Franklin, M.J.; Stewart, P.S.; Yoon, J. Tolerance of dormant and active cells in Pseudomonas aeruginosa PA01 biofilm to antimicrobial agents. J. Antimicrob. Chemother. 2008, 63, 129–135. [Google Scholar] [CrossRef]
- Chernova, O.A.; Medvedeva, E.S.; Mouzykantov, A.A.; Baranova, N.B.; Chernov, V.M. Mycoplasmas and Their Antibiotic Resistance: The Problems and Prospects in Controlling Infections. Acta Naturae 2016, 8, 24–34. [Google Scholar] [CrossRef]
- Parray, O.R.; Haq, I.U.; Muhee, A.; Shaheen, M.; Yatoo, M.I. A mini-review on antimycoplasma antibiotics. Appl. Vet. Res. 2022, 1, e2022002. [Google Scholar] [CrossRef]
- Van Duijkeren, E.; Schwarz, C.; Bouchard, D.; Catry, B.; Pomba, C.; Baptiste, K.E.; Moreno, M.A.; Rantala, M.; Ružauskas, M.; Sanders, P.; et al. The use of aminoglycosides in animals within the EU: Development of resistance in animals and possible impact on human and animal health: A review. J. Antimicrob. Chemother. 2019, 74, 2480–2496. [Google Scholar] [CrossRef] [PubMed]
- Giguère, S.; Dowling, P.M. Fluoroquinolones. Antimicrob. Ther. Vet. Med. 2013, 295–314. [Google Scholar]
- Del Castillo, J.R. Tetracyclines. Antimicrob. Ther. Vet. Med. 2013, 257–268. [Google Scholar]
- Apley, M.D.; Coetzee, J.F. Antimicrobial drug use in cattle. Antimicrob. Ther. Vet. Med. 2013, 495–518. [Google Scholar]
- Schindelin, J.; Arganda-Carreras, I.; Frise, E.; Kaynig, V.; Longair, M.; Pietzsch, T.; Preibisch, S.; Rueden, C.; Saalfeld, S.; Schmid, B.; et al. Fiji: An open-source platform for biological-image analysis. Nat. Methods 2012, 9, 676–682. [Google Scholar] [CrossRef]
- Busschots, S.; O’Toole, S.; O’Leary, J.J.; Stordal, B. Non-invasive and non-destructive measurements of confluence in cultured adherent cell lines. MethodsX 2015, 2, 8–13. [Google Scholar] [CrossRef]
- Bio-Rad. Everest Software, 3.2.12.0; Bio-Rad: Hercules, CA, USA, 2024.
- Totten, A.H.; Xiao, L.; Crabb, D.M.; Ratliff, A.E.; Dybvig, K.; Waites, K.B.; Atkinson, T.P. Shaken or stirred?: Comparison of methods for dispersion of Mycoplasma pneumoniae aggregates for persistence in vivo. J. Microbiol. Methods 2017, 132, 56–62. [Google Scholar] [CrossRef]
- Alsharif, R.; Godfrey, W.; Bacterial Detection and Live/Dead Discrimination by Flow Cytometry. Microbial Cytometry Application Note. BD Biosciences, Immunocytometry Systems. 2002. Available online: https://www.technologynetworks.com/diagnostics/application-notes/bacterial-detection-and-livedead-discrimination-by-flow-cytometry-228589 (accessed on 23 July 2023).
- R Core Team. R: A Language and Environment for Statistical Computing; Foundation for Statistical Computing: Vienna, Austria, 2024. [Google Scholar]
- Assunção, P.; Diaz, R.; Comas, J.; de Galarreta, C.M.R.; González-Llamazares, O.R.; Poveda, J.B. Evaluation of Mycoplasma hyopneumoniae growth by flow cytometry. J. Appl. Microbiol. 2005, 98, 1047–1054. [Google Scholar] [CrossRef]
- Uenoyama, A.; Miyata, M. Gliding ghosts of Mycoplasma mobile. Proc. Natl. Acad. Sci. USA 2005, 102, 12754–12758. [Google Scholar] [CrossRef]
- Grossman, T.H. Tetracycline Antibiotics and Resistance. Cold Spring Harb. Perspect. Med. 2016, 6, a025387. [Google Scholar] [CrossRef] [PubMed]
- Wickham, H.; Averick, M.; Bryan, J.; Chang, W.; McGowan, L.D.A.; François, R.; Grolemund, G.; Hayes, A.; Henry, L.; Hester, J.; et al. Welcome to the tidyverse. J. Open Source Softw. 2019, 4, 1686. [Google Scholar] [CrossRef]
- Pinheiro, J.C.; Bates, D.M. Mixed-Effects Models in S and S-PLUS; Springer: Berlin/Heidelberg, Germany, 2000. [Google Scholar] [CrossRef]
- Bates, D.; Mächler, M.; Bolker, B.; Walker, S. Fitting Linear Mixed-Effects Models Using lme4. J. Stat. Softw. 2015, 67, 1–48. [Google Scholar] [CrossRef]
- Goode, K.; Rey, K. ggResidpanel: Panels and Interactive Versions of Diagnostic Plots Using ‘ggplot2’, R package version 0.3.0; Comprehensive R Archive Network: Online, 2019.
- Lüdecke, D. sjPlot: Data Visualization for Statistics in Social Science, R package version 2.8.15; Comprehensive R Archive Network: Online, 2023.
- Wickham, H.; Henry, L. purrr: Functional Programming Tools, R package version 1.0.2; Comprehensive R Archive Network: Online, 2023.
- Wickham, H. stringr: Simple, Consistent Wrappers for Common String Operations, R package version 1.5.1; Comprehensive R Archive Network: Online, 2023.
- Kassambara, A. rstatix: Pipe-Friendly Framework for Basic Statistical Tests, R package version 0.7.2; Comprehensive R Archive Network: Online, 2023.
- Wickham, H. ggplot2: Elegant Graphics for Data Analysis; Comprehensive R Archive Network: Online, 2016. [Google Scholar]
- Arnold, J.B. ggthemes: Extra Themes, Scales and Geoms for ‘ggplot2’; R Package Version 5.1.0; Comprehensive R Archive Network: Online, 2024. [Google Scholar]
- Kassambara, A. ggpubr: ‘ggplot2’ Based Publication Ready Plots; R Package Version 0.6.0; Comprehensive R Archive Network: Online, 2023. [Google Scholar]
- Kleinschmidt, S.; Spergser, J.; Rosengarten, R.; Hewicker-Trautwein, M. Long-term survival of Mycoplasma bovis in necrotic lesions and in phagocytic cells as demonstrated by transmission and immunogold electron microscopy in lung tissue from experimentally infected calves. Vet. Microbiol. 2013, 162, 949–953. [Google Scholar] [CrossRef]
- Maniloff, J.; Morowitz, H.J. Cell biology of the mycoplasmas. Bacteriol. Rev. 1972, 36, 263–290. [Google Scholar] [CrossRef]
- Schielzeth, H.; Dingemanse, N.J.; Nakagawa, S.; Westneat, D.F.; Allegue, H.; Teplitsky, C.; Réale, D.; Dochtermann, N.A.; Garamszegi, L.Z.; Araya-Ajoy, Y.G. Robustness of linear mixed-effects models to violations of distributional assumptions. Methods Ecol. Evol. 2020, 11, 1141–1152. [Google Scholar] [CrossRef]
- Dapore, Z. Hydrogen peroxide and the Mycoplasma pneumoniae biofilm. Master’s Thesis, Miami University, Oxford, OH, USA, 2022. [Google Scholar]
- Wang, Y.; Yi, L.; Zhang, F.; Qiu, X.; Tan, L.; Yu, S.; Cheng, X.; Ding, C. Identification of genes involved in Mycoplasma gallisepticum biofilm formation using mini-Tn4001-SGM transposon mutagenesis. Vet. Microbiol. 2017, 198, 17–22. [Google Scholar] [CrossRef]
- Stewart, P.S. Diffusion in biofilms. J. Bacteriol. 2003, 185, 1485–1491. [Google Scholar] [CrossRef]
- Soehnlen, M.K.; Kunze, M.E.; Karunathilake, K.E.; Henwood, B.M.; Kariyawasam, S.; Wolfgang, D.R.; Jayarao, B.M. In vitro antimicrobial inhibition of Mycoplasma bovis isolates submitted to the Pennsylvania Animal Diagnostic Laboratory using flow cytometry and a broth microdilution method. J. Vet. Diagn. Investig. 2011, 23, 547–551. [Google Scholar] [CrossRef]
- Assunção, P.; Antunes, N.T.; Rosales, R.S.; Poveda, C.; De La Fe, C.; Poveda, J.B.; Davey, H.M. Application of flow cytometry for the determination of minimal inhibitory concentration of several antibacterial agents on Mycoplasma hyopneumoniae. J. Appl. Microbiol. 2007, 102, 1132–1137. [Google Scholar] [CrossRef]
- Sulyok, K.M.; Kreizinger, Z.; Fekete, L.; Hrivnák, V.; Magyar, T.; Jánosi, S.; Schweitzer, N.; Turcsányi, I.; Makrai, L.; Erdélyi, K.; et al. Antibiotic susceptibility profiles of Mycoplasma bovis strains isolated from cattle in Hungary, Central Europe. BMC Vet. Res. 2014, 10, 256. [Google Scholar] [CrossRef] [PubMed]
- Trunk, T.; Khalil, H.S.; Leo, J.C. Bacterial autoaggregation. AIMS Microbiol. 2018, 4, 140–164. [Google Scholar] [CrossRef] [PubMed]
- Caceres Silvia, M.; Malcolm Kenneth, C.; Taylor-Cousar Jennifer, L.; Nichols David, P.; Saavedra Milene, T.; Bratton Donna, L.; Moskowitz Samuel, M.; Burns Jane, L.; Nick Jerry, A. Enhanced In Vitro Formation and Antibiotic Resistance of Nonattached Pseudomonas aeruginosa Aggregates through Incorporation of Neutrophil Products. Antimicrob. Agents Chemother. 2014, 58, 6851–6860. [Google Scholar] [CrossRef] [PubMed]
- Wirth, S.M.; Lowry, G.V.; Tilton, R.D. Natural Organic Matter Alters Biofilm Tolerance to Silver Nanoparticles and Dissolved Silver. Environ. Sci. Technol. 2012, 46, 12687–12696. [Google Scholar] [CrossRef]
- Folkesson, A.; Haagensen, J.A.J.; Zampaloni, C.; Sternberg, C.; Molin, S. Biofilm Induced Tolerance towards Antimicrobial Peptides. PLoS ONE 2008, 3, e1891. [Google Scholar] [CrossRef]
- Mah, T.-F. Biofilm-Specific Antibiotic Resistance. Future Microbiol. 2012, 7, 1061–1072. [Google Scholar] [CrossRef]
- Lynch, S.S. Tolerance and Resistance; Merck Manual Professional Version: Rahway, NJ, USA, 2022. [Google Scholar]
- Stewart, P.S.; William Costerton, J. Antibiotic resistance of bacteria in biofilms. Lancet 2001, 358, 135–138. [Google Scholar] [CrossRef]
- Singh, S.; Datta, S.; Narayanan, K.B.; Rajnish, K.N. Bacterial exo-polysaccharides in biofilms: Role in antimicrobial resistance and treatments. J. Genet. Eng. Biotechnol. 2021, 19, 140. [Google Scholar] [CrossRef]
- Høiby, N.; Bjarnsholt, T.; Givskov, M.; Molin, S.; Ciofu, O. Antibiotic resistance of bacterial biofilms. Int. J. Antimicrob. Agents 2010, 35, 322–332. [Google Scholar] [CrossRef]
- Venkatesan, N.; Perumal, G.; Doble, M. Bacterial resistance in biofilm-associated bacteria. Future Microbiol. 2015, 10, 1743–1750. [Google Scholar] [CrossRef]
- Krause, K.M.; Serio, A.W.; Kane, T.R.; Connolly, L.E. Aminoglycosides: An overview. Cold Spring Harb. Perspect. Med. 2016, 6, a027029. [Google Scholar] [CrossRef] [PubMed]
- Prasetyoputri, A.; Jarrad, A.M.; Cooper, M.A.; Blaskovich, M.A.T. The Eagle Effect and Antibiotic-Induced Persistence: Two Sides of the Same Coin? Trends Microbiol. 2019, 27, 339–354. [Google Scholar] [CrossRef] [PubMed]
- Walraven, C.J.; Bernardo, S.M.; Wiederhold, N.P.; Lee, S.A. Paradoxical antifungal activity and structural observations in biofilms formed by echinocandin-resistant Candida albicans clinical isolates. Med. Mycol. 2013, 52, 131–139. [Google Scholar] [CrossRef] [PubMed]
- Nahum, Y.; Gross, N.; Cerrone, A.; Matouš, K.; Nerenberg, R. Effect of biofilm physical characteristics on their susceptibility to antibiotics: Impacts of low-frequency ultrasound. npj Biofilms Microbiomes 2024, 10, 70. [Google Scholar] [CrossRef]
- Pham, T.D.M.; Ziora, Z.M.; Blaskovich, M.A.T. Quinolone antibiotics. MedChemComm 2019, 10, 1719–1739. [Google Scholar] [CrossRef]
- Maslowska, K.H.; Makiela-Dzbenska, K.; Fijalkowska, I.J. The SOS system: A complex and tightly regulated response to DNA damage. Environ. Mol. Mutagen. 2019, 60, 368–384. [Google Scholar] [CrossRef]
- Ma, X.; Wang, L.; Yang, F.; Li, J.; Guo, L.; Guo, Y.; He, S. Drug sensitivity and genome-wide analysis of two strains of Mycoplasma gallisepticum with different biofilm intensity. Front. Microbiol. 2023, 14, 1196747. [Google Scholar] [CrossRef]
- Li, Y.; Zheng, H.; Liu, Y.; Jiang, Y.; Xin, J.; Chen, W.; Song, Z. The Complete Genome Sequence of Mycoplasma bovis Strain Hubei-1. PLoS ONE 2011, 6, e20999. [Google Scholar] [CrossRef]
- Mulcahy, H.; Charron-Mazenod, L.; Lewenza, S. Extracellular DNA Chelates Cations and Induces Antibiotic Resistance in Pseudomonas aeruginosa Biofilms. PLOS Pathog. 2008, 4, e1000213. [Google Scholar] [CrossRef]
- Raymond, B.B.A.; Jenkins, C.; Turnbull, L.; Whitchurch, C.B.; Djordjevic, S.P. Extracellular DNA release from the genome-reduced pathogen Mycoplasma hyopneumoniae is essential for biofilm formation on abiotic surfaces. Sci. Rep. 2018, 8, 10373. [Google Scholar] [CrossRef]
- Chopra, I.; Roberts, M. Tetracycline Antibiotics: Mode of Action, Applications, Molecular Biology, and Epidemiology of Bacterial Resistance. Microbiol. Mol. Biol. Rev. 2001, 65, 232–260. [Google Scholar] [CrossRef] [PubMed]
- Alav, I.; Sutton, J.M.; Rahman, K.M. Role of bacterial efflux pumps in biofilm formation. J. Antimicrob. Chemother. 2018, 73, 2003–2020. [Google Scholar] [CrossRef] [PubMed]
- Ledger, L.; Eidt, J.; Cai, H.Y. Identification of Antimicrobial Resistance-Associated Genes through Whole Genome Sequencing of Mycoplasma bovis Isolates with Different Antimicrobial Resistances. Pathogens 2020, 9, 588. [Google Scholar] [CrossRef] [PubMed]
- Simmons, W.L.; Bolland, J.R.; Daubenspeck, J.M.; Dybvig, K. A stochastic mechanism for biofilm formation by Mycoplasma pulmonis. J. Bacteriol. 2007, 189, 1905–1913. [Google Scholar] [CrossRef] [PubMed]
- Barkhatova, O.I.; Andreevskaya, S.G.; Alekseeva, N.V.; Zhukhovitsky, V.G.; Rakovskaya, I.V. In vitro Biofilm Formation by the Respiratory Mycoplasmosis Pathogen Mycoplasma pneumonia. Mol. Genet. Microbiol. Virol. 2019, 34, 170–175. [Google Scholar] [CrossRef]
- Chen, H.; Yu, S.; Hu, M.; Han, X.; Chen, D.; Qiu, X.; Ding, C. Identification of biofilm formation by Mycoplasma gallisepticum. Vet. Microbiol. 2012, 161, 96–103. [Google Scholar] [CrossRef]
- Sauer, K.; Stoodley, P.; Goeres, D.M.; Hall-Stoodley, L.; Burmølle, M.; Stewart, P.S.; Bjarnsholt, T. The biofilm life cycle: Expanding the conceptual model of biofilm formation. Nat. Rev. Microbiol. 2022, 20, 608–620. [Google Scholar] [CrossRef]
- Hendrickson, G.R.; Lyon, L.A. Microgel Translocation through Pores under Confinement. Angew. Chem. Int. Ed. 2010, 49, 2193–2197. [Google Scholar] [CrossRef]


Disclaimer/Publisher’s Note: The statements, opinions and data contained in all publications are solely those of the individual author(s) and contributor(s) and not of MDPI and/or the editor(s). MDPI and/or the editor(s) disclaim responsibility for any injury to people or property resulting from any ideas, methods, instructions or products referred to in the content. |
© 2024 by the authors. Licensee MDPI, Basel, Switzerland. This article is an open access article distributed under the terms and conditions of the Creative Commons Attribution (CC BY) license (https://creativecommons.org/licenses/by/4.0/).