
Understanding Habitats and Environmental Conditions of White-Tailed Deer Population Density and Public Health Data to Aid in Assessing Human Tick-Borne Disease Risk
 , , ,
, , ,
Abstract
1. Introduction
1.1. Tick-Borne Diseases: Pathogens and Hosts
1.2. Assessment of Human TBD Risk
1.3. Deer Density and Tick-Borne Disease Risk
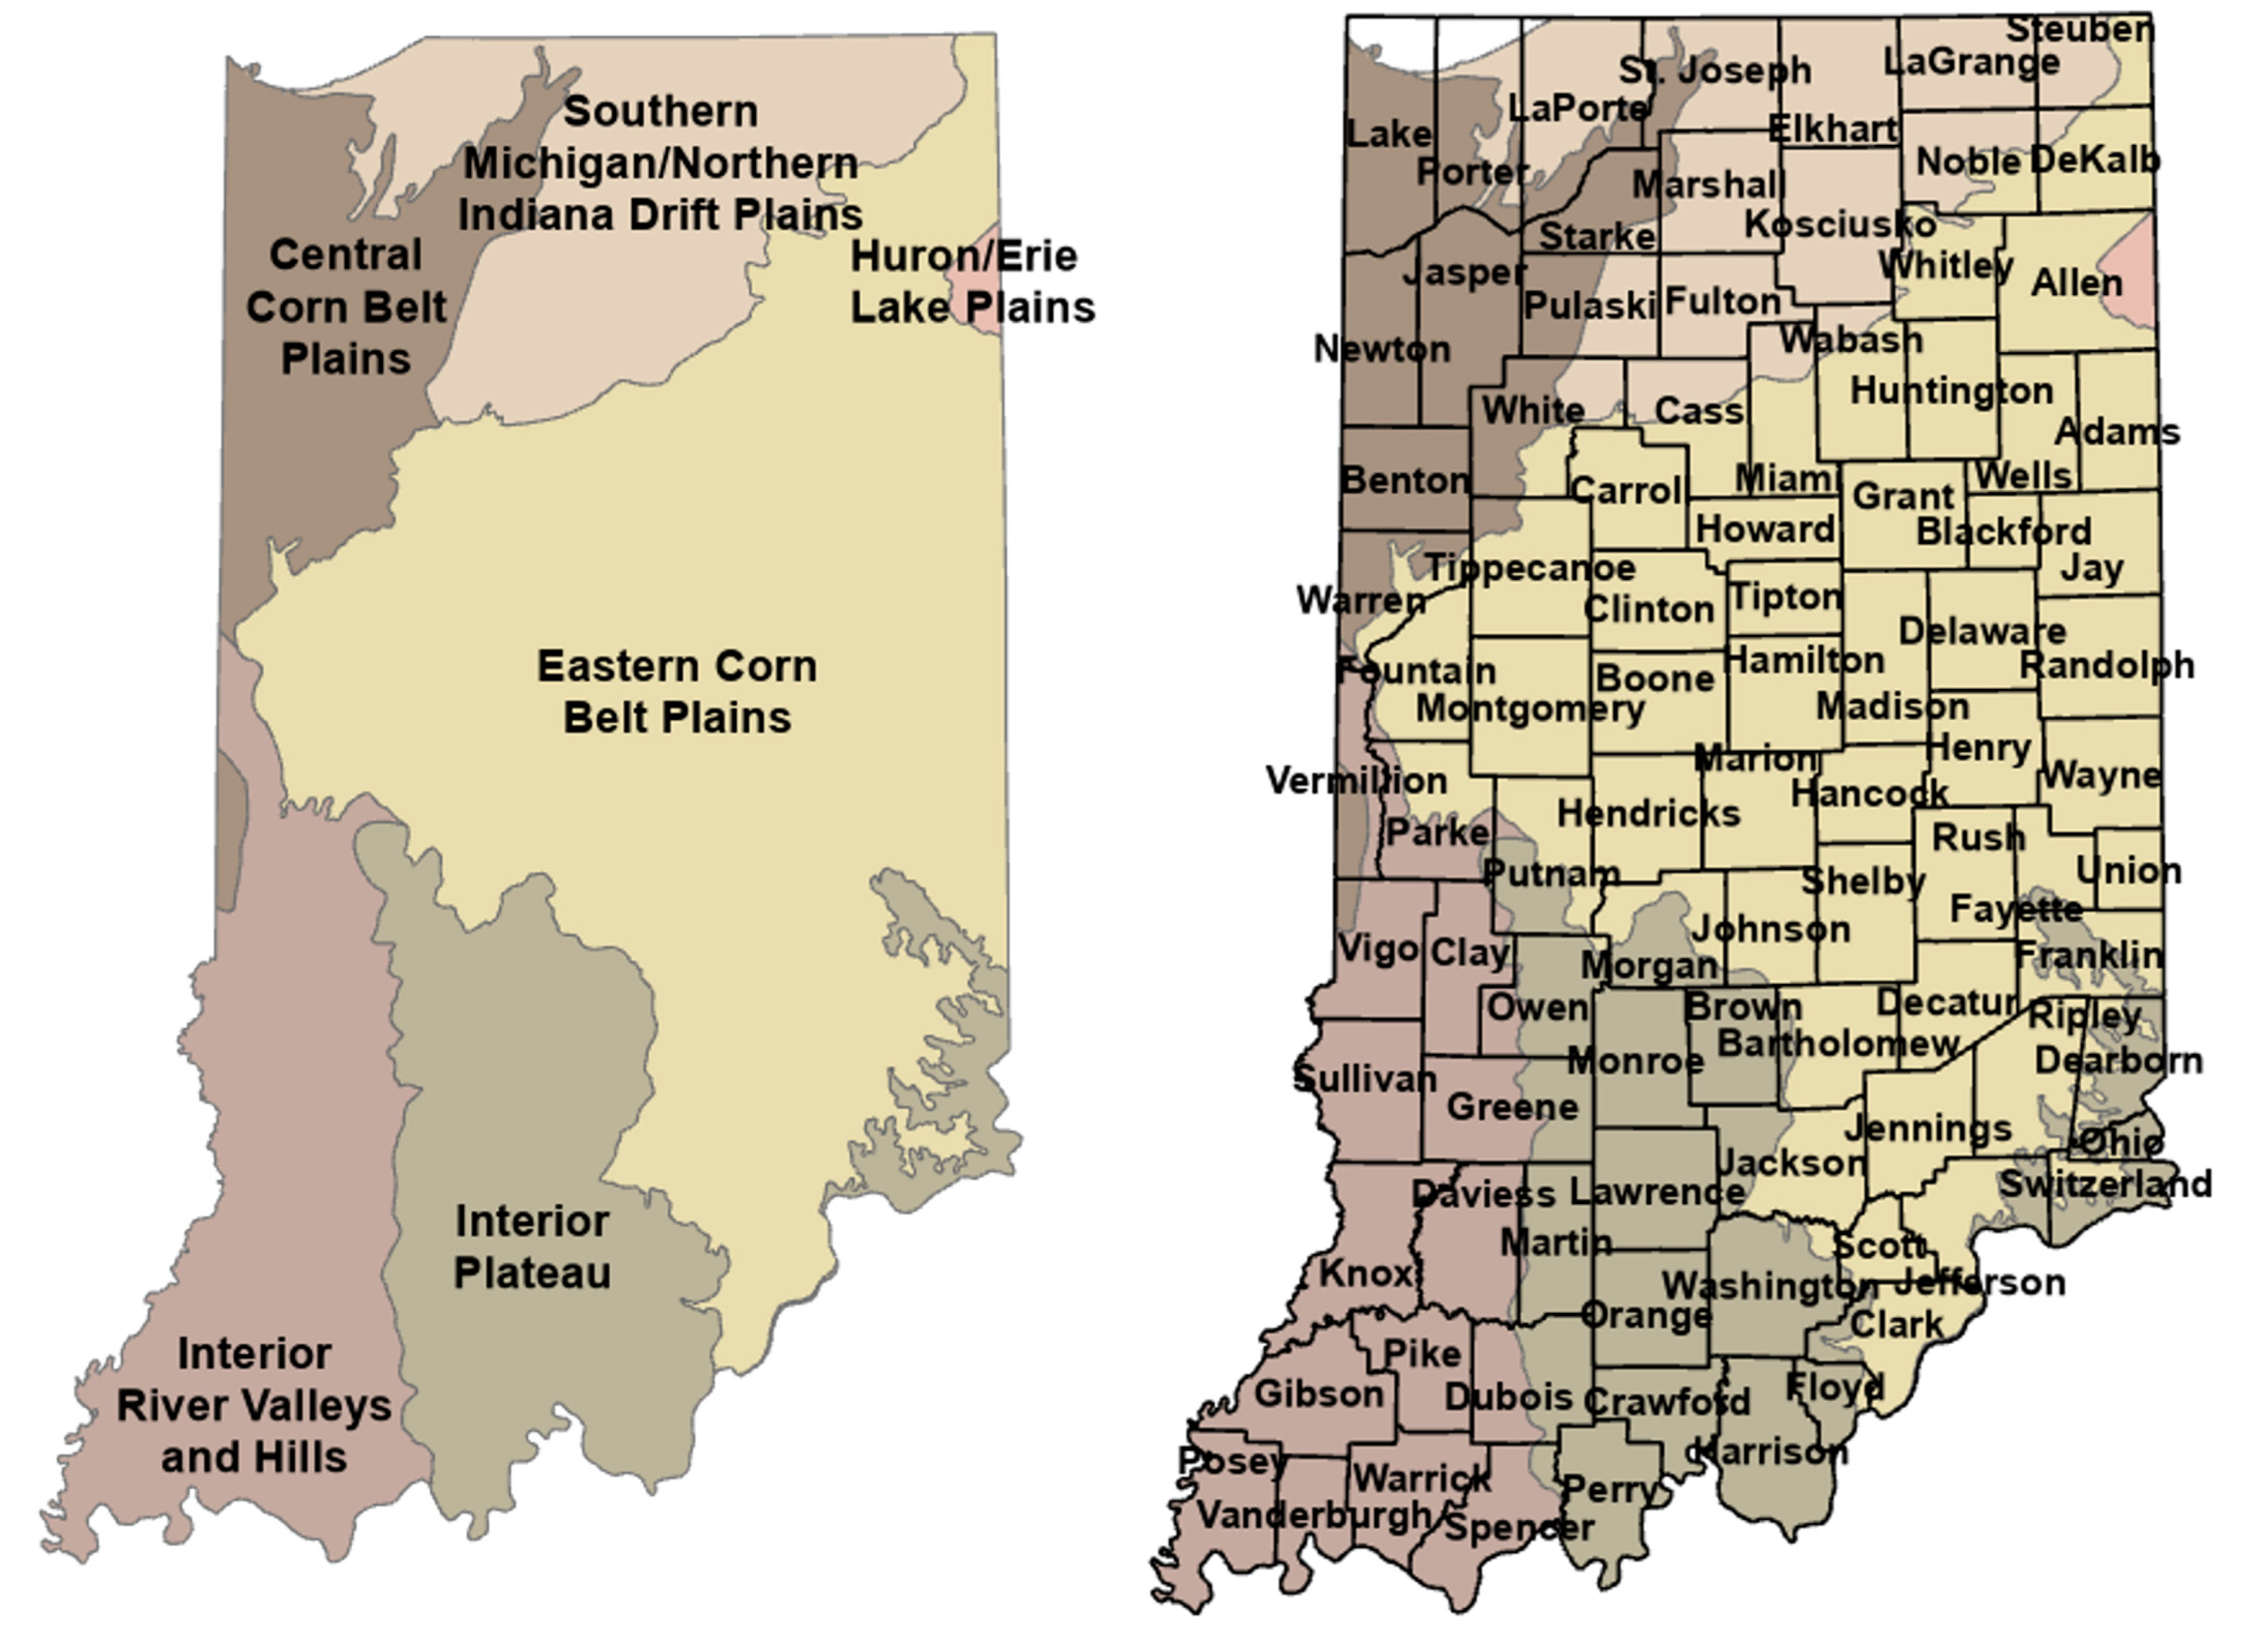
1.4. Indiana Ecosystems and Deer
2. Materials and Methods
2.1. Data Acquisition
- Human TBD Case Rates for Spotted Fever Rickettsiosis (SFR); Ehrlichiosis (EHR); Anaplasmosis (ANA); Ehrlichiosis or Anaplasmosis, indeterminate (EHRANA); and Lyme Disease (LD) as provided by the Indiana Department of Health (IDOH) via a data request.
- Canine TBD Case Rates for EHR; ANA; and LD, obtained from the Companion Animal Parasite Council’s (CAPC’s) online public data dashboard. The CAPC provides canine serological testing data online [38] via IDEXX Laboratories and IDEXX Diagnostics.
- Deer Population as reported by the Indiana Department of Natural Resources’ (IDNR’s) Annual Deer Reports. Two measures were used:
- (1)
- Deer Mortality is the official number of deer reported as killed (“harvested”) by hunters and vehicle collisions via the “CheckIN Game” (CING) system. Hunters are required to report deer harvest per state law. “Damage Permits” are also issued for hunting deer that are causing property or agricultural damage (e.g., eating crops).
- (2)
- Deer Observation is the rate of deer sightings per hour as estimated by the IDNR’s “Archer’s Index”, a systematic wildlife reporting protocol. These data are thus voluntarily reported by hunters, unlike Deer Mortality.
- Tick Infectivity data for the rate of Borrelia burgdoferi infection in adult and nymphal ticks, as provided by the IDOH via a data request.
- County-Level environmental, geographical, and population data obtained from official US reports, including the Decennial Census and the US Geological Survey.
2.2. Data Aggregation and Standardization
2.3. Statistical Analysis
2.4. Mapping and Visualization
3. Results
Spatial Mapping and Association
4. Discussion
Limitations
5. Conclusions
Author Contributions
Funding
Data Availability Statement
Conflicts of Interest
References
- MacDonald, A.J.; McComb, S.; Sambado, S. Linking Lyme disease ecology and epidemiology: Reservoir host identity, not richness, determines tick infection and human disease in California. Environ. Res. Lett. 2022, 17, 114041. [Google Scholar] [CrossRef]
- Lemery, J.; Balbus, J.; Sorensen, C.; Rublee, C.; Dresser, C.; Balsari, S.; Calvello Hynes, E. Training Clinical and Public Health Leaders in Climate and Health: Commentary explores training clinical and public health leaders in climate and health. Health Aff. 2020, 39, 2189–2196. [Google Scholar] [CrossRef] [PubMed]
- Moloney, M.E. Bitten: A Patient with Tickborne Disease Struggles to Find the Right Provider. Health Aff. 2016, 35, 169–173. [Google Scholar] [CrossRef]
- Pauly, M.V.; Sloan, F.A.; Sullivan, S.D. An Economic Framework for Preventive Care Advice. Health Aff. 2014, 33, 2034–2040. [Google Scholar] [CrossRef] [PubMed]
- Dennis, D.T.; Nekomoto, T.S.; Victor, J.C.; Paul, W.S.; Piesman, J. Forum: Reported Distribution of Ixodes scapularis and Ixodes pacificus (Acari: Ixodidae) in the United States. J. Med. Entomol. 1998, 35, 629–638. [Google Scholar] [CrossRef] [PubMed]
- Hahn, M.B.; Jarnevich, C.S.; Monaghan, A.J.; Eisen, R.J. Modeling the Geographic Distribution of Ixodes scapularis and Ixodes pacificus (Acari: Ixodidae) in the Contiguous United States. J. Med. Entomol. 2016, 53, 1176–1191. [Google Scholar] [CrossRef] [PubMed]
- Lockwood, B.H.; Stasiak, I.; Pfaff, M.A.; Cleveland, C.A.; Yabsley, M.J. Widespread distribution of ticks and selected tick-borne pathogens in Kentucky (USA). Ticks Tick-Borne Dis. 2018, 9, 738–741. [Google Scholar] [CrossRef]
- Thomas, K.; Brooks, C.; McNeely, C.L.; Maxwell, S.P. Tick-Borne Disease Risk and Exposure among Vulnerable Populations in Perceived Non-Endemic Regions. Zoonotic Dis. 2022, 2, 111–116. [Google Scholar] [CrossRef]
- Varela, A.S.; Stallknecht, D.E.; Yabsley, M.J.; Moore, V.A.; Howerth, E.W.; Davidson, W.R.; Little, S.E. Primary and Secondary Infection with Ehrlichia chaffeensis in White-Tailed Deer (Odocoileus virginianus). Vector-Borne Zoonotic Dis. 2005, 5, 48–57. [Google Scholar] [CrossRef]
- Huang, C.I.; Kay, S.C.; Davis, S.; Tufts, D.M.; Gaffett, K.; Tefft, B.; Diuk-Wasser, M.A. High burdens of Ixodes scapularis larval ticks on white-tailed deer may limit Lyme disease risk in a low biodiversity setting. Ticks Tick-Borne Dis. 2019, 10, 258–268. [Google Scholar] [CrossRef]
- Rogerson, A.G.; Lloyd, V.K. Lyme Disease Patient Outcomes and Experiences: A Retrospective Cohort Study. Healthcare 2020, 8, 322. [Google Scholar] [CrossRef] [PubMed]
- Jaarsma, R.I.; Sprong, H.; Takumi, K.; Kazimirova, M.; Silaghi, C.; Mysterud, A.; Rudolf, I.; Beck, R.; Földvári, G.; Tomassone, L.; et al. Anaplasma phagocytophilum evolves in geographical and biotic niches of vertebrates and ticks. Parasit. Vectors 2019, 12, 328. [Google Scholar] [CrossRef] [PubMed]
- Yabsley, M.J.; Varela, A.S.; Tate, C.M.; Dugan, V.G.; Stallknecht, D.E.; Little, S.E.; Davidson, W.R. Ehrlichia ewingii Infection in White-Tailed Deer (Odocoileus virginianus). Emerg. Infect. Dis. 2002, 8, 668–671. [Google Scholar] [CrossRef] [PubMed]
- Andersen, N.S.; Skarphédinsson, S.; Knudtzen, F.C.; Olesen, C.R.; Jensen, T.G.; Jensen, P.M. Reduction in human Lyme neuroborreliosis associated with a major epidemic among roe deer. Ticks Tick-Borne Dis. 2018, 9, 379–381. [Google Scholar] [CrossRef] [PubMed]
- Myczka, A.W.; Steiner-Bogdaszewska, Ż.; Filip-Hutsch, K.; Oloś, G.; Czopowicz, M.; Laskowski, Z. Detection of Anaplasma phagocytophilum in Wild and Farmed Cervids in Poland. Pathogens 2021, 10, 1190. [Google Scholar] [CrossRef] [PubMed]
- Rynkiewicz, E.C.; Hemmerich, C.; Rusch, D.B.; Fuqua, C.; Clay, K. Concordance of bacterial communities of two tick species and blood of their shared rodent host. Mol. Ecol. 2015, 24, 2566–2579. [Google Scholar] [CrossRef] [PubMed]
- Maxwell, S.P. The Elusive Understanding of Lyme Disease in Non-Endemic Geographic Areas: An Exploratory Survey of Patients with Chronic Symptoms in Texas. J. Patient Exp. 2020, 7, 1621–1626. [Google Scholar] [CrossRef]
- Rosenberg, R.; Lindsey, N.P.; Fischer, M.; Gregory, C.J.; Hinckley, A.F.; Mead, P.S.; Paz-Bailey, G.; Waterman, S.H.; Drexler, N.A.; Kersh, G.J.; et al. Vital Signs: Trends in Reported Vectorborne Disease Cases—United States and Territories, 2004–2016. MMWR Morb. Mortal. Wkly. Rep. 2018, 67, 496–501. [Google Scholar] [CrossRef]
- Brooks, C.; McNeely, C.L.; Maxwell, S.P.; Thomas, K.C. Assessing Tick-Borne Disease Risk and Surveillance: Toward a Multi-Modal Approach to Diagnostic Positioning and Prediction. Microorganisms 2022, 10, 832. [Google Scholar] [CrossRef]
- Rynkiewicz, E.C.; Clay, K. Tick community composition in Midwestern US habitats in relation to sampling method and environmental conditions. Exp. Appl. Acarol. 2014, 64, 109–119. [Google Scholar] [CrossRef]
- Gandy, S.; Kilbride, E.; Biek, R.; Millins, C.; Gilbert, L. No net effect of host density on tick-borne disease hazard due to opposing roles of vector amplification and pathogen dilution. Ecol. Evol. 2022, 12, e9253. [Google Scholar] [CrossRef] [PubMed]
- Jaenson, T.G.T.; Tälleklint, L. Incompetence of Roe Deer as Reservoirs of the Lyme Borreliosis Spirochete. J. Med. Entomol. 1992, 29, 813–817. [Google Scholar] [CrossRef] [PubMed]
- Moore, S.I.; Wilson, M.L.; Spielman, A.; Telford, S.R.; Mather, T.N. Incompetence of Deer as Reservoirs of the Lyme Disease Spirochete. Am. J. Trop. Med. Hyg. 1988, 39, 105–109. [Google Scholar] [CrossRef]
- Wojan, C.; Thrasher, T.; Lacey, E.; Clay, K. Distribution, Dynamics, and Diversity of Questing Ticks in the Lower Midwest. J. Med. Entomol. 2022, 59, 273–282. [Google Scholar] [CrossRef]
- Levi, T.; Kilpatrick, A.M.; Mangel, M.; Wilmers, C.C. Deer, predators, and the emergence of Lyme disease. Proc. Natl. Acad. Sci. USA 2012, 109, 10942–10947. [Google Scholar] [CrossRef]
- Rand, P.W.; Lubelczyk, C.; Lavigne, G.R.; Elias, S.; Holman, M.S.; Lacombe, E.H.; Smith, R.P. Deer Density and the Abundance of Ixodes scapularis (Acari: Ixodidae). J. Med. Entomol. 2003, 40, 179–184. [Google Scholar] [CrossRef]
- Roome, A.; Hill, L.; Al-Feghali, V.; Murnock, C.G.; Goodsell, J.A.; Spathis, R.; Garruto, R.M. Impact of white-tailed deer on the spread of Borrelia burgdorferi: White-tailed deer and B. burgdorferi. Med. Vet. Entomol. 2017, 31, 1–5. [Google Scholar] [CrossRef]
- VerCauteren, K. The Deer Boom: Discussions on Population Growth and Range Expansion of the White-Tailed Deer; USDA Wildlife Services-Staff Publications: Washington, DC, USA, 2003. [Google Scholar]
- Werden, L.; Barker, I.K.; Bowman, J.; Gonzales, E.K.; Leighton, P.A.; Lindsay, L.R.; Jardine, C.M. Geography, Deer, and Host Biodiversity Shape the Pattern of Lyme Disease Emergence in the Thousand Islands Archipelago of Ontario, Canada. PLoS ONE 2014, 9, e85640. [Google Scholar] [CrossRef]
- Wilson, M.L.; Ducey, A.M.; Litwin, T.S.; Gavin, T.A.; Spielman, A. Microgeographic distribution of immature Ixodes dammini ticks correlated with that of deer. Med. Vet. Entomol. 1990, 4, 151–159. [Google Scholar] [CrossRef]
- Wilson, M.L.; Levine, J.F.; Spielman, A. Effect of Deer Reduction on Abundance of the Deer Tick (Ixodes Dammini). Yale J. Biol. Med. 1984, 57, 697–705. [Google Scholar]
- Ostfeld, R.S.; Canham, C.D.; Oggenfuss, K.; Winchcombe, R.J.; Keesing, F. Climate, Deer, Rodents, and Acorns as Determinants of Variation in Lyme-Disease Risk. PLoS Biol. 2006, 4, e145. [Google Scholar] [CrossRef] [PubMed]
- Kugeler, K.J.; Jordan, R.A.; Schulze, T.L.; Griffith, K.S.; Mead, P.S. Will Culling White-Tailed Deer Prevent Lyme Disease? Zoonoses Public Health 2016, 63, 337–345. [Google Scholar] [CrossRef]
- Roden-Reynolds, P.; Kent, C.M.; Li, A.Y.; Mullinax, J.M. Patterns of white-tailed deer movements in suburban Maryland: Implications for zoonotic disease mitigation. Urban Ecosyst. 2022, 25, 1925–1938. [Google Scholar] [CrossRef]
- Kilpatrick, A.M.; Randolph, S.E. Drivers, dynamics, and control of emerging vector-borne zoonotic diseases. Lancet 2012, 380, 1946–1955. [Google Scholar] [CrossRef] [PubMed]
- Steiner, F.E.; Pinger, R.R.; Vann, C.N.; Abley, M.J.; Sullivan, B.; Grindle, N.; Clay, K.; Fuqua, C. Detection of Anaplasma phagocytophilum and Babesia odocoilei DNA in Ixodes scapularis (Acari: Ixodidae) Collected in Indiana. J. Med. Entomol. 2006, 43, 437–442. [Google Scholar] [CrossRef]
- Hill, C.A.; MacDonald, J.F. The Biology and Medical Importance of Ticks in Indiana. Available online: https://edustore.purdue.edu/ (accessed on 20 January 2023).
- CAPC Parasite Prevalence Maps. Available online: https://capcvet.org/maps#/2020/all-year/lyme-disease/dog/united-states (accessed on 15 December 2022).
- Swihart, R.K.; Caudell, J.N.; Brooke, J.M.; Ma, Z. A Flexible Model-based Approach to Delineate Wildlife Management Units. Wildl. Soc. Bull. 2020, 44, 77–85. [Google Scholar] [CrossRef]
- Maxwell, S.P.; McNeely, C.L.; Thomas, K.; Brooks, C. Tick-Borne Surveillance Patterns in Perceived Non-Endemic Geographic Areas: Human Tick Encounters and Disease Outcomes. Healthcare 2021, 9, 771. [Google Scholar] [CrossRef]
- Johnson, N.; Phipps, L.P.; Hansford, K.M.; Folly, A.J.; Fooks, A.R.; Medlock, J.M.; Mansfield, K.L. One Health Approach to Tick and Tick-Borne Disease Surveillance in the United Kingdom. Int. J. Environ. Res. Public. Health 2022, 19, 5833. [Google Scholar] [CrossRef]
- Inci, A.; Yildirim, A.; Duzlu, O.; Doganay, M.; Aksoy, S. Tick-Borne Diseases in Turkey: A Review Based on One Health Perspective. PLoS Negl. Trop. Dis. 2016, 10, e0005021. [Google Scholar] [CrossRef] [PubMed]
- Dantas-Torres, F.; Chomel, B.B.; Otranto, D. Ticks and tick-borne diseases: A One Health perspective. Trends Parasitol. 2012, 28, 437–446. [Google Scholar] [CrossRef]
- Gaines, D.N.; Operario, D.J.; Stroup, S.; Stromdahl, E.; Wright, C.; Gaff, H.; Broyhill, J.; Smith, J.; Norris, D.E.; Henning, T.; et al. Ehrlichia and Spotted Fever Group Rickettsiae Surveillance in Amblyomma americanum in Virginia Through Use of a Novel Six-Plex Real-Time PCR Assay. Vector-Borne Zoonotic Dis. 2014, 14, 307–316. [Google Scholar] [CrossRef] [PubMed]
- Hook, S.A.; Nawrocki, C.C.; Meek, J.I.; Feldman, K.A.; White, J.L.; Connally, N.P.; Hinckley, A.F. Human-Tick Encounters as a Measure of Tickborne Disease Risk in Lyme Disease Endemic Areas. Zoonoses Public Health 2021, 68, 384–392. [Google Scholar] [CrossRef] [PubMed]
- Dattwyler, R.J.; Volkman, D.J.; Luft, B.J.; Halperin, J.J.; Thomas, J.; Golightly, M.G. Seronegative Lyme Disease. N. Engl. J. Med. 1988, 319, 1441–1446. [Google Scholar] [CrossRef] [PubMed]
- Ebi, K.L.; Hess, J.J. Health Risks Due To Climate Change: Inequity In Causes And Consequences: Study examines health risks due to climate change. Health Aff. 2020, 39, 2056–2062. [Google Scholar] [CrossRef] [PubMed]
- Lawrence, C.; Lipton, R.B.; Lowy, F.D.; Coyle, P.K. Seronegative Chronic Relapsing Neuroborreliosis. Eur. Neurol. 1995, 35, 113–117. [Google Scholar] [CrossRef]
- US EPA. Ecoregion Download Files by State-Region 5. Available online: https://www.epa.gov/eco-research/ecoregion-download-files-state-region-5 (accessed on 9 December 2022).


| Variable Name | Definition (4-Year Average between 2017 and 2020) 1 | Data Source |
|---|---|---|
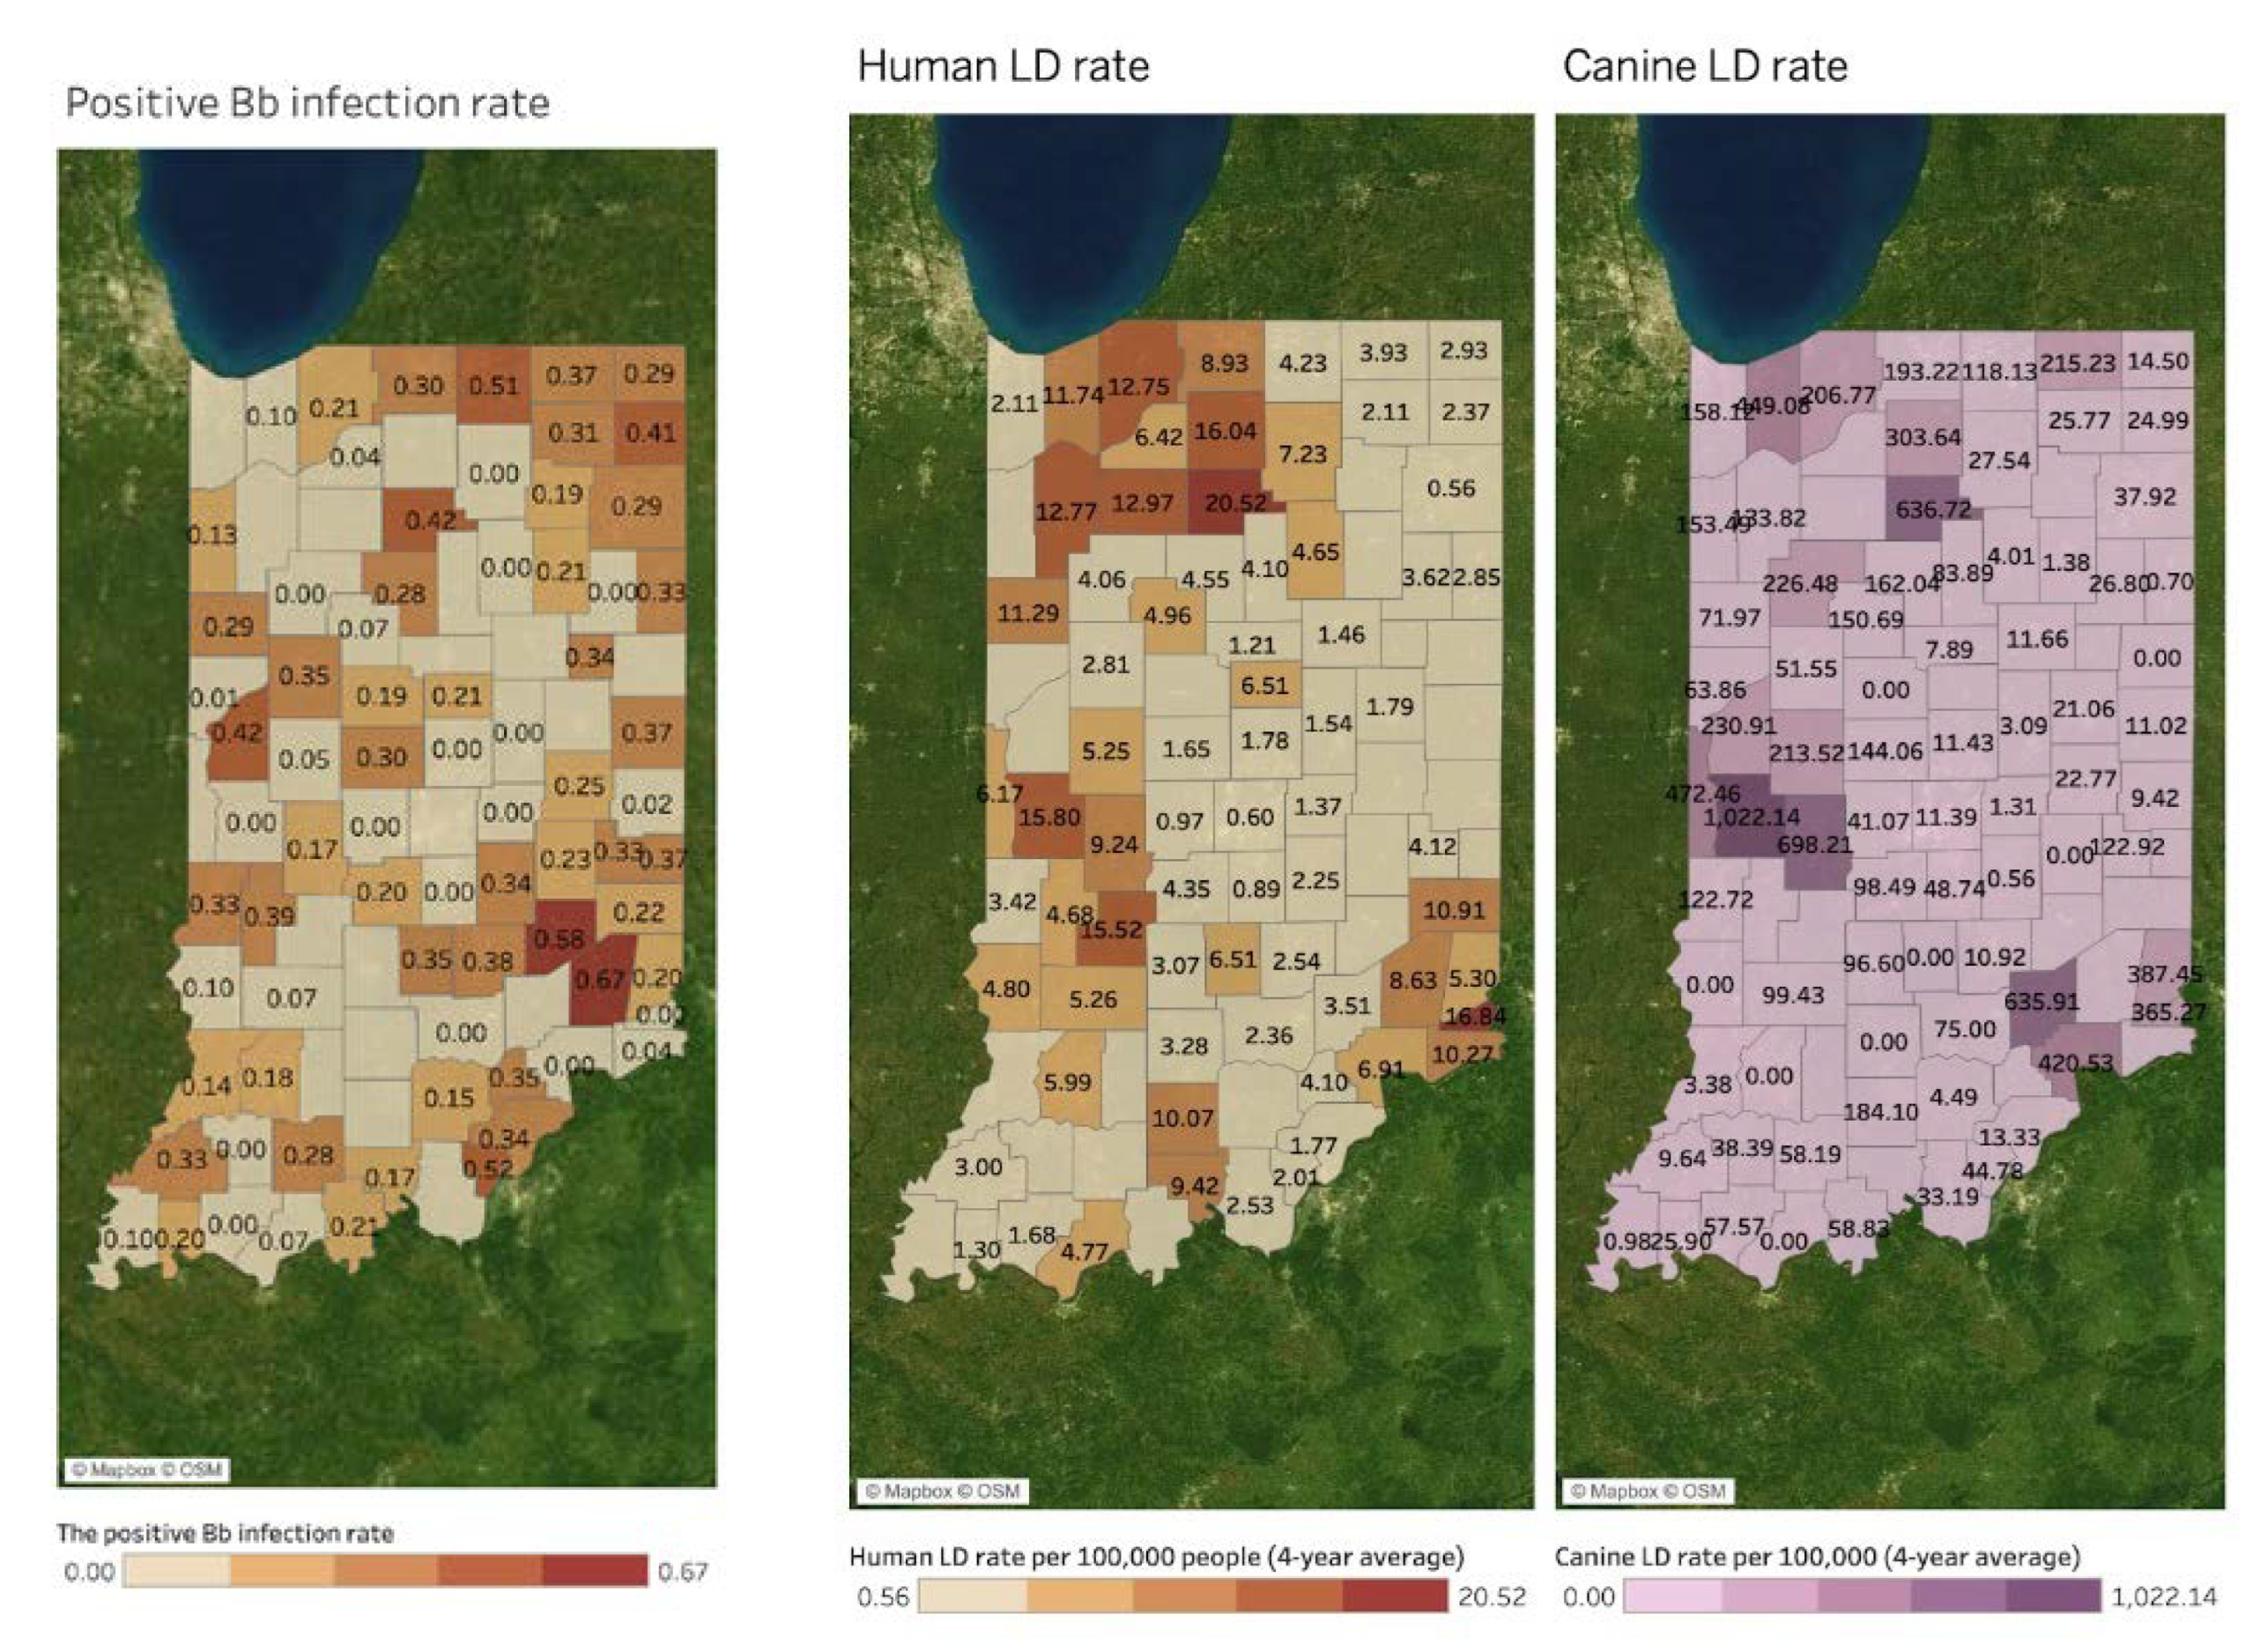
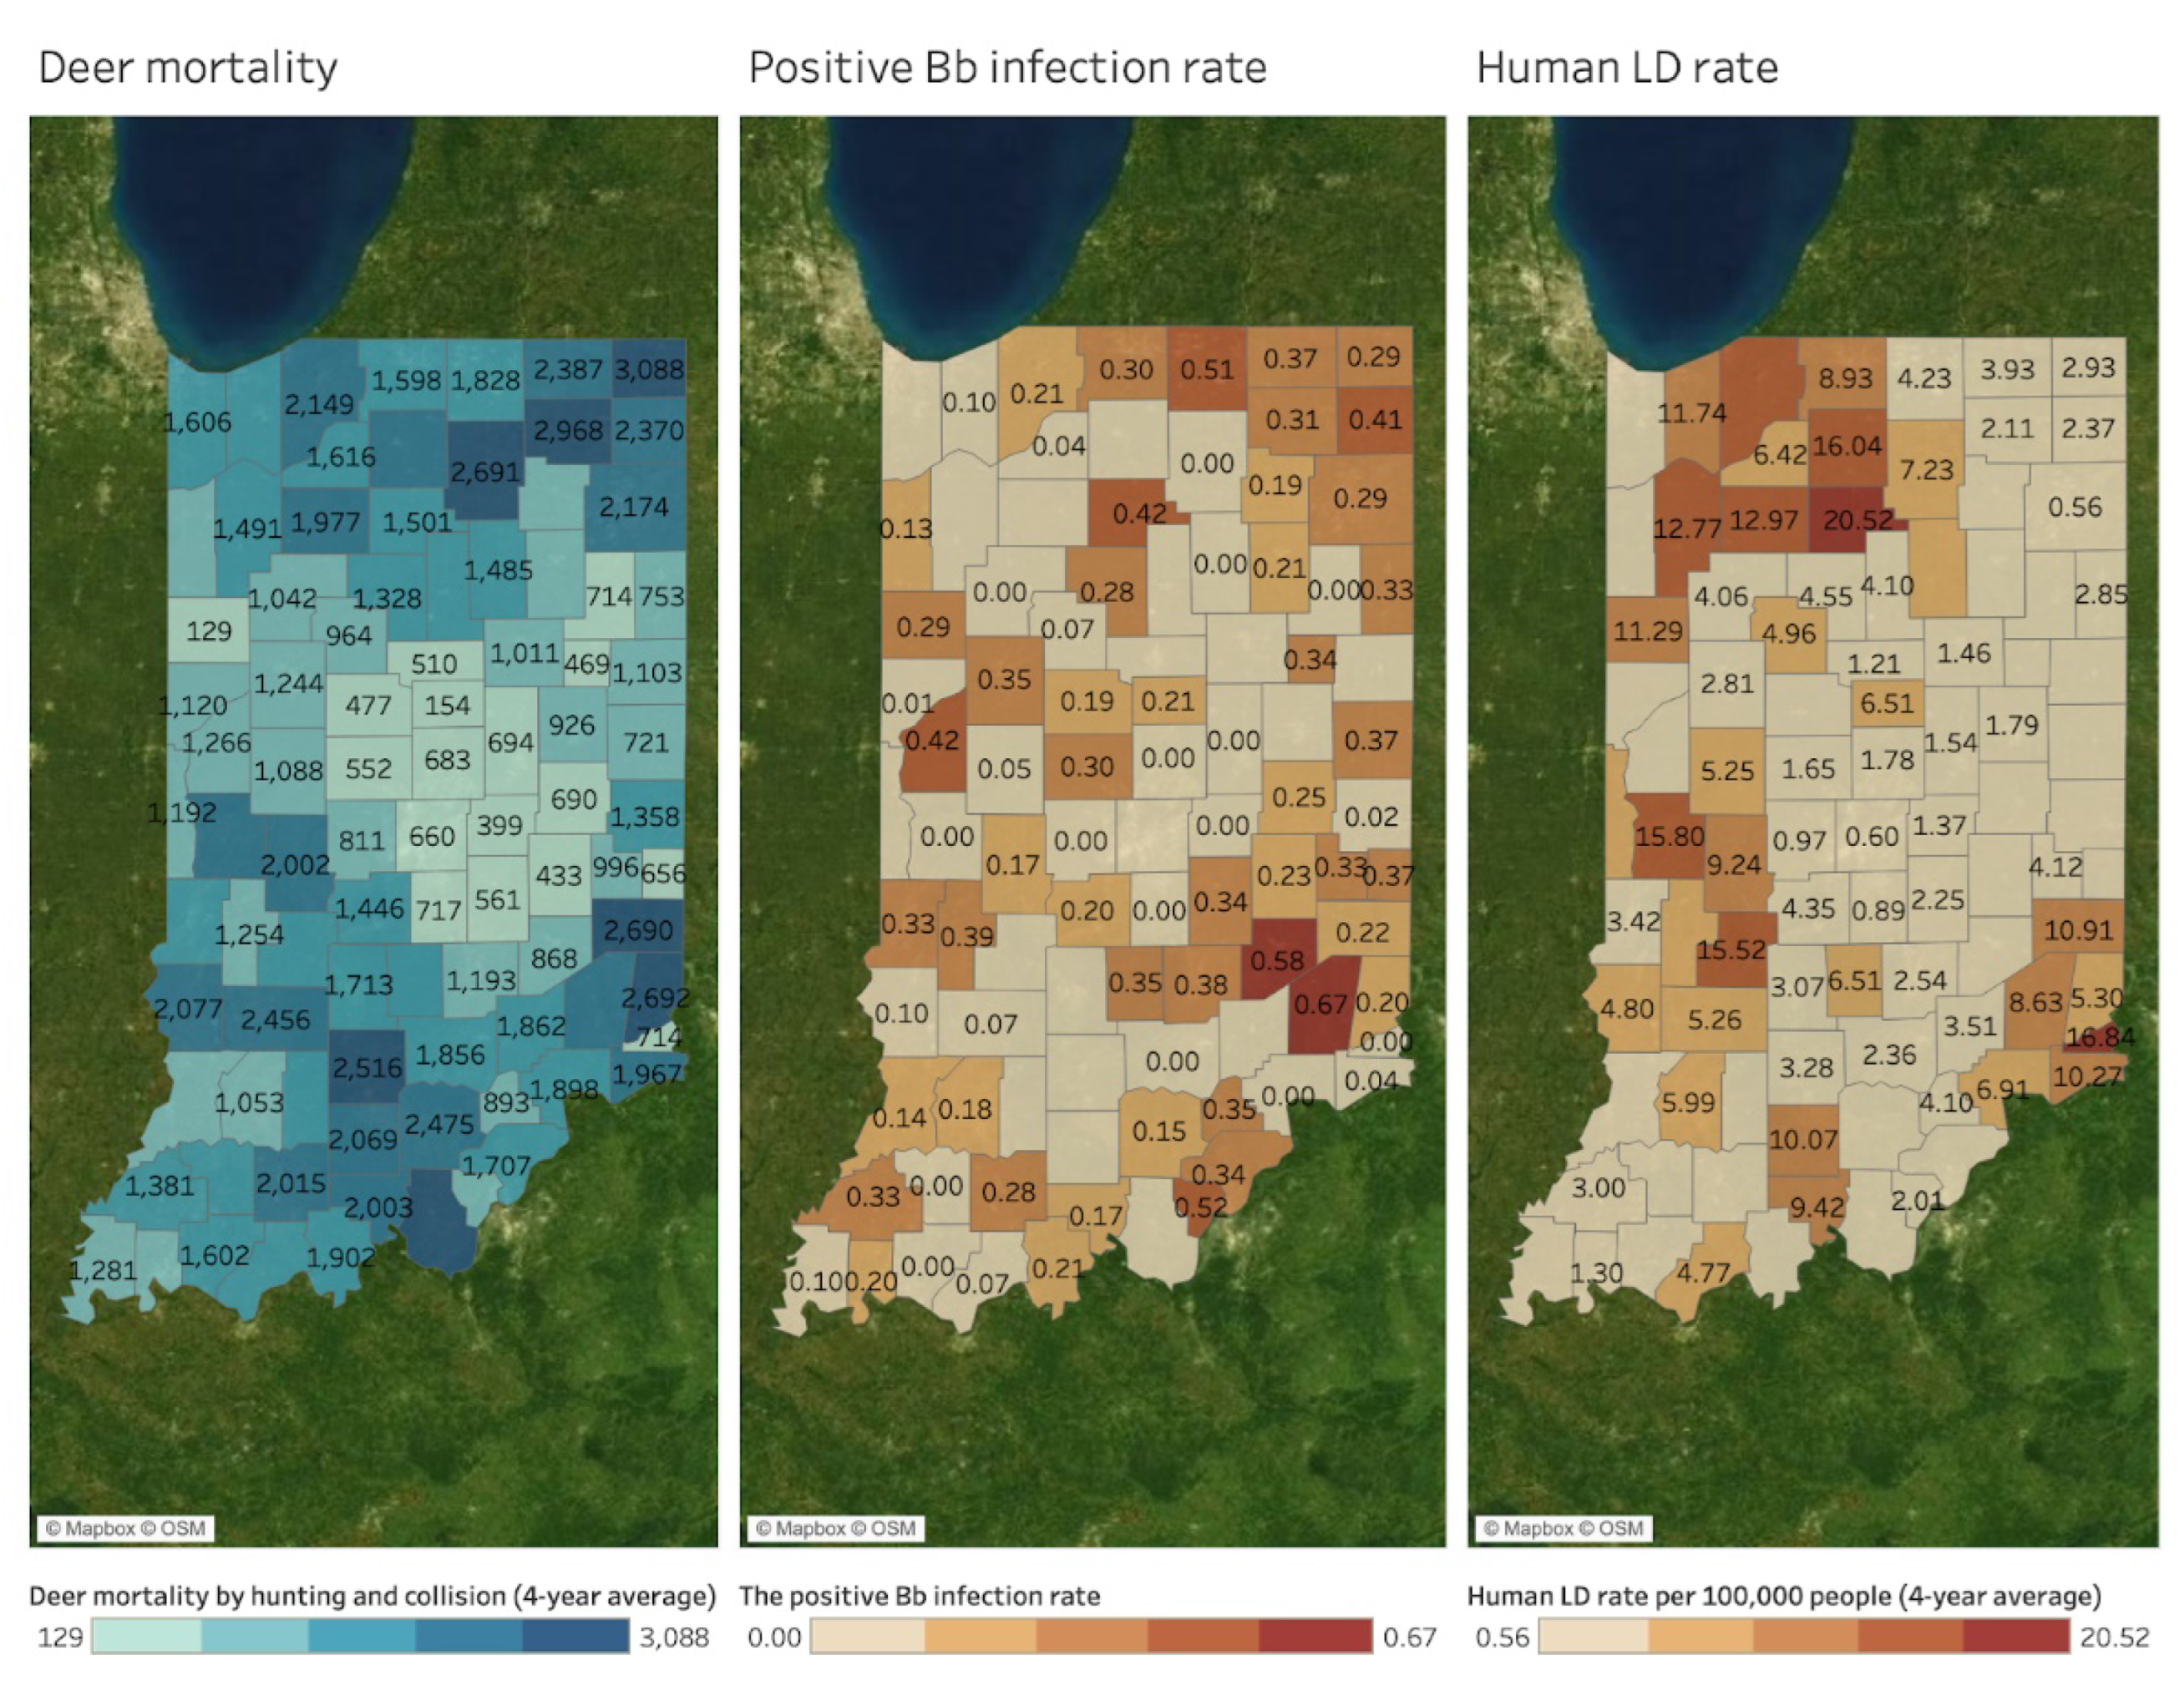
| Human LD | Human LD rate per 100,000 people | IDOH |
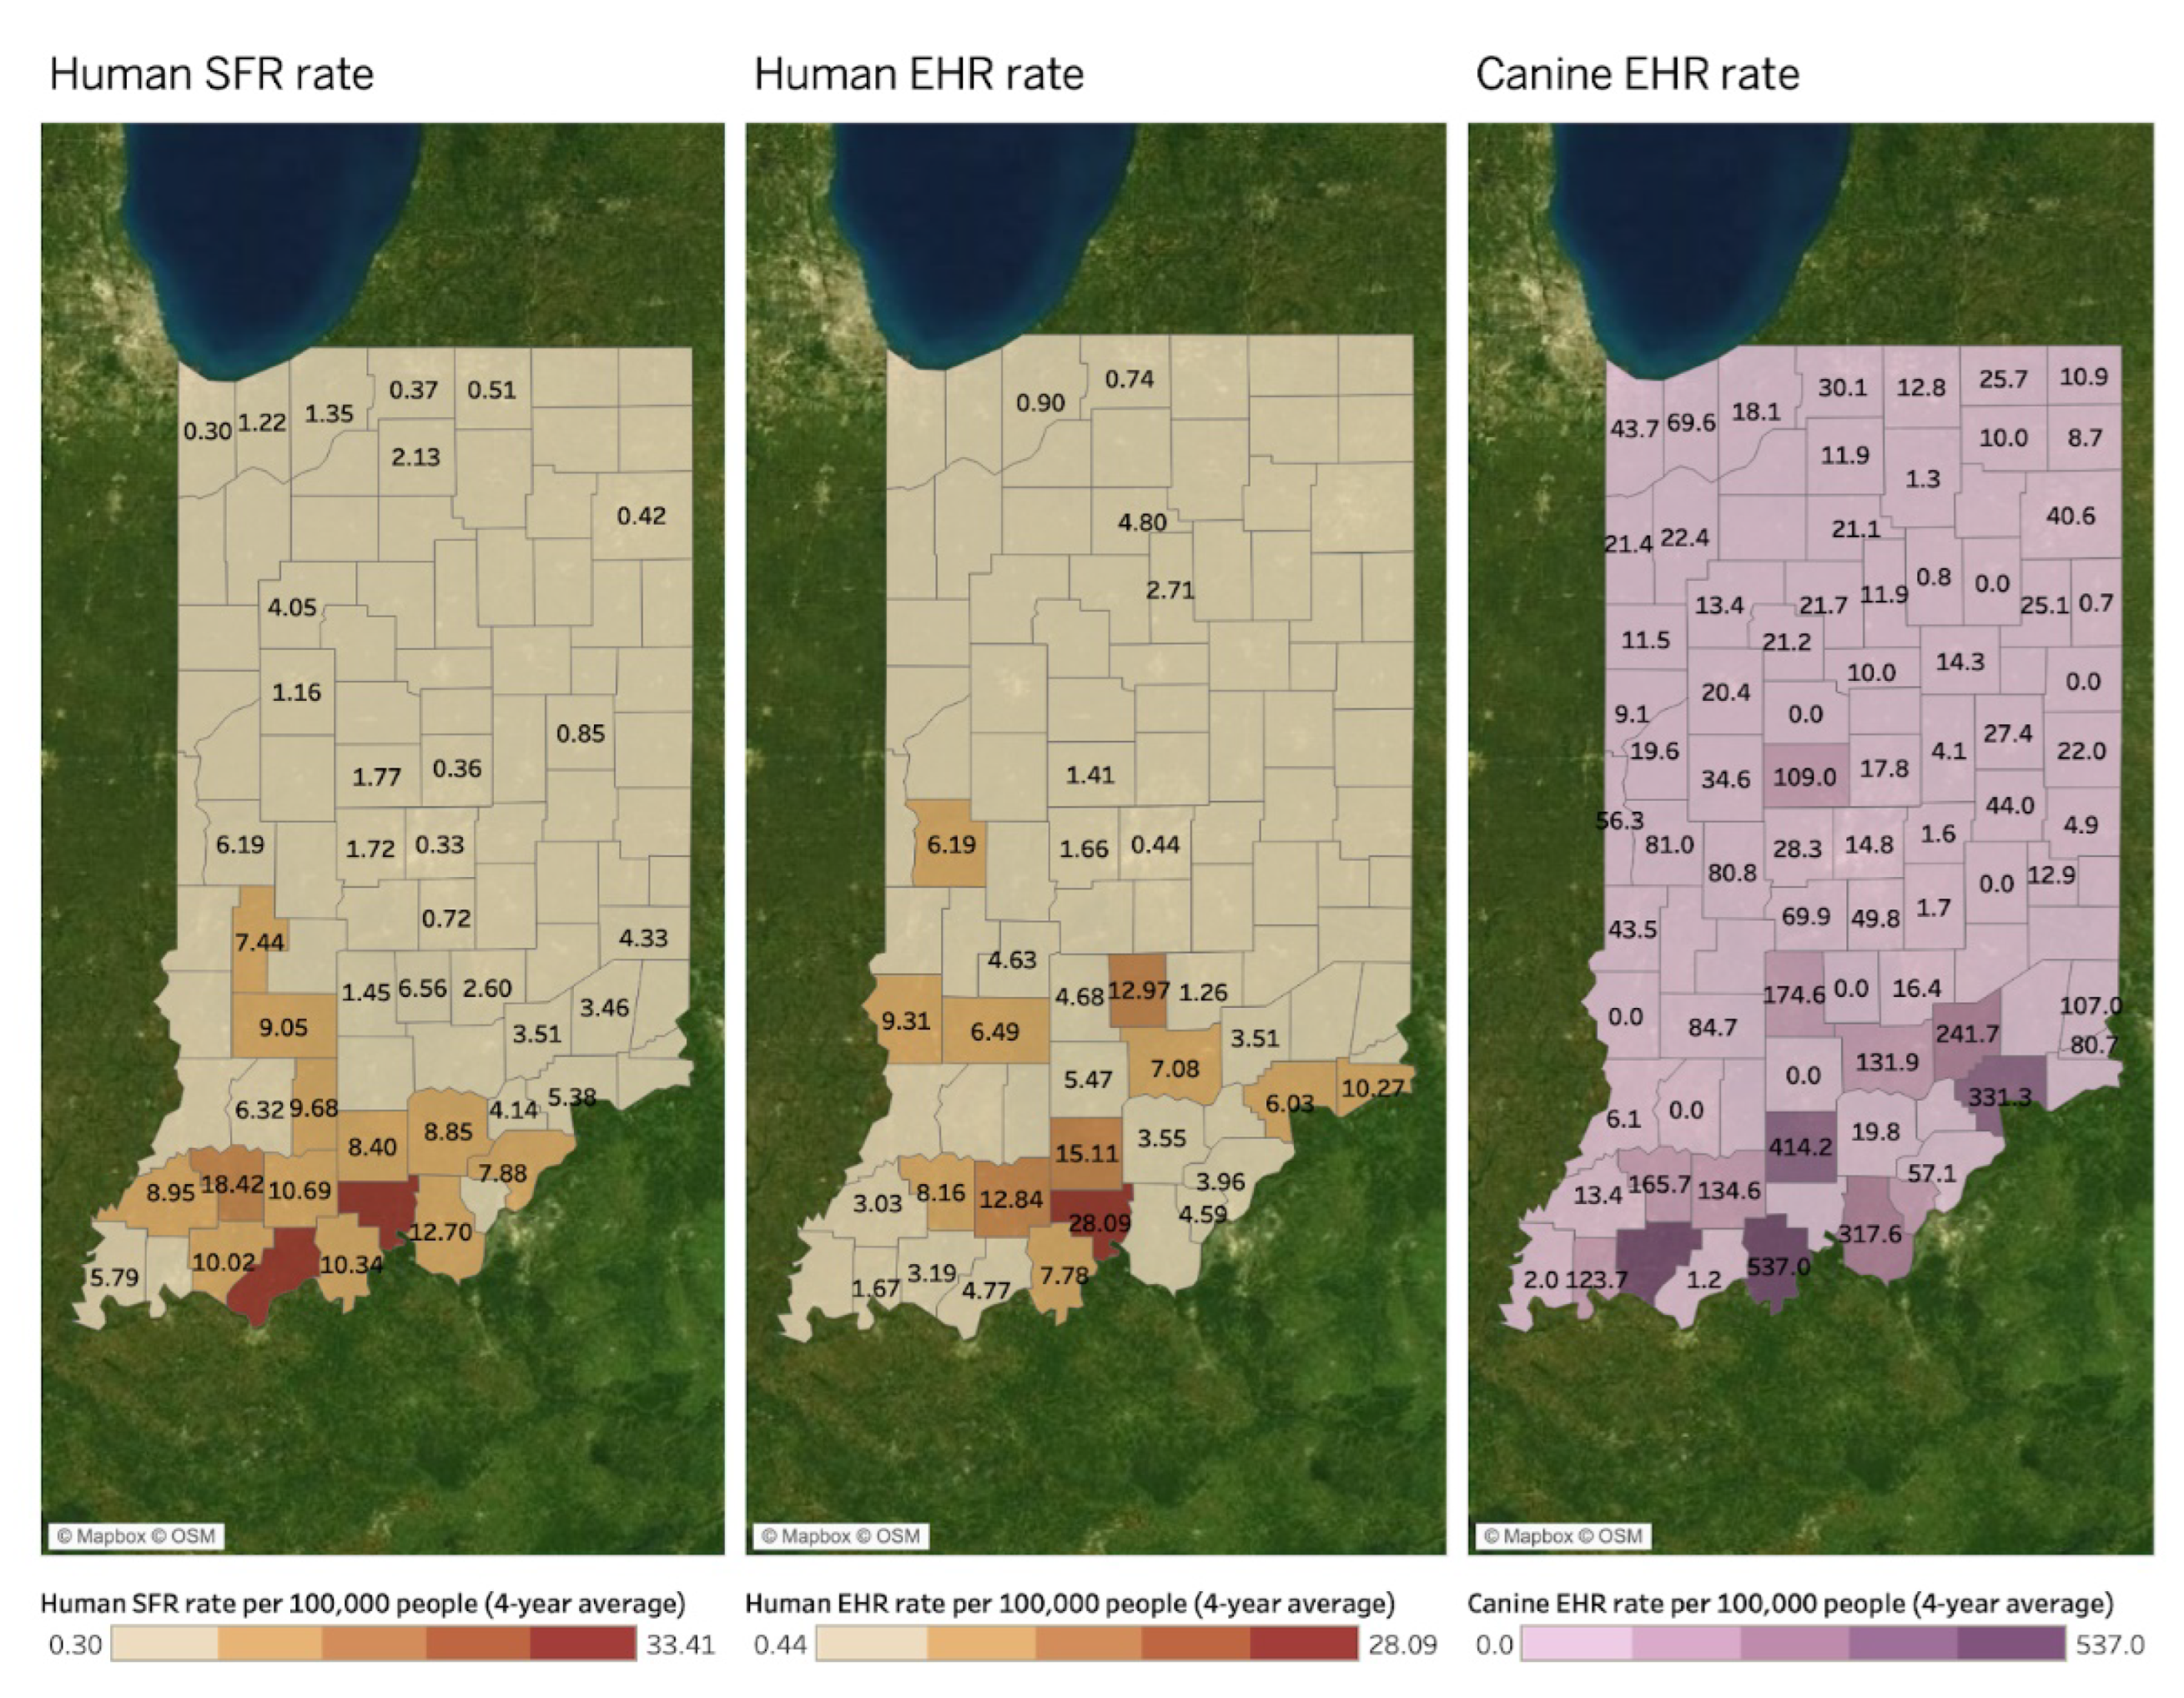
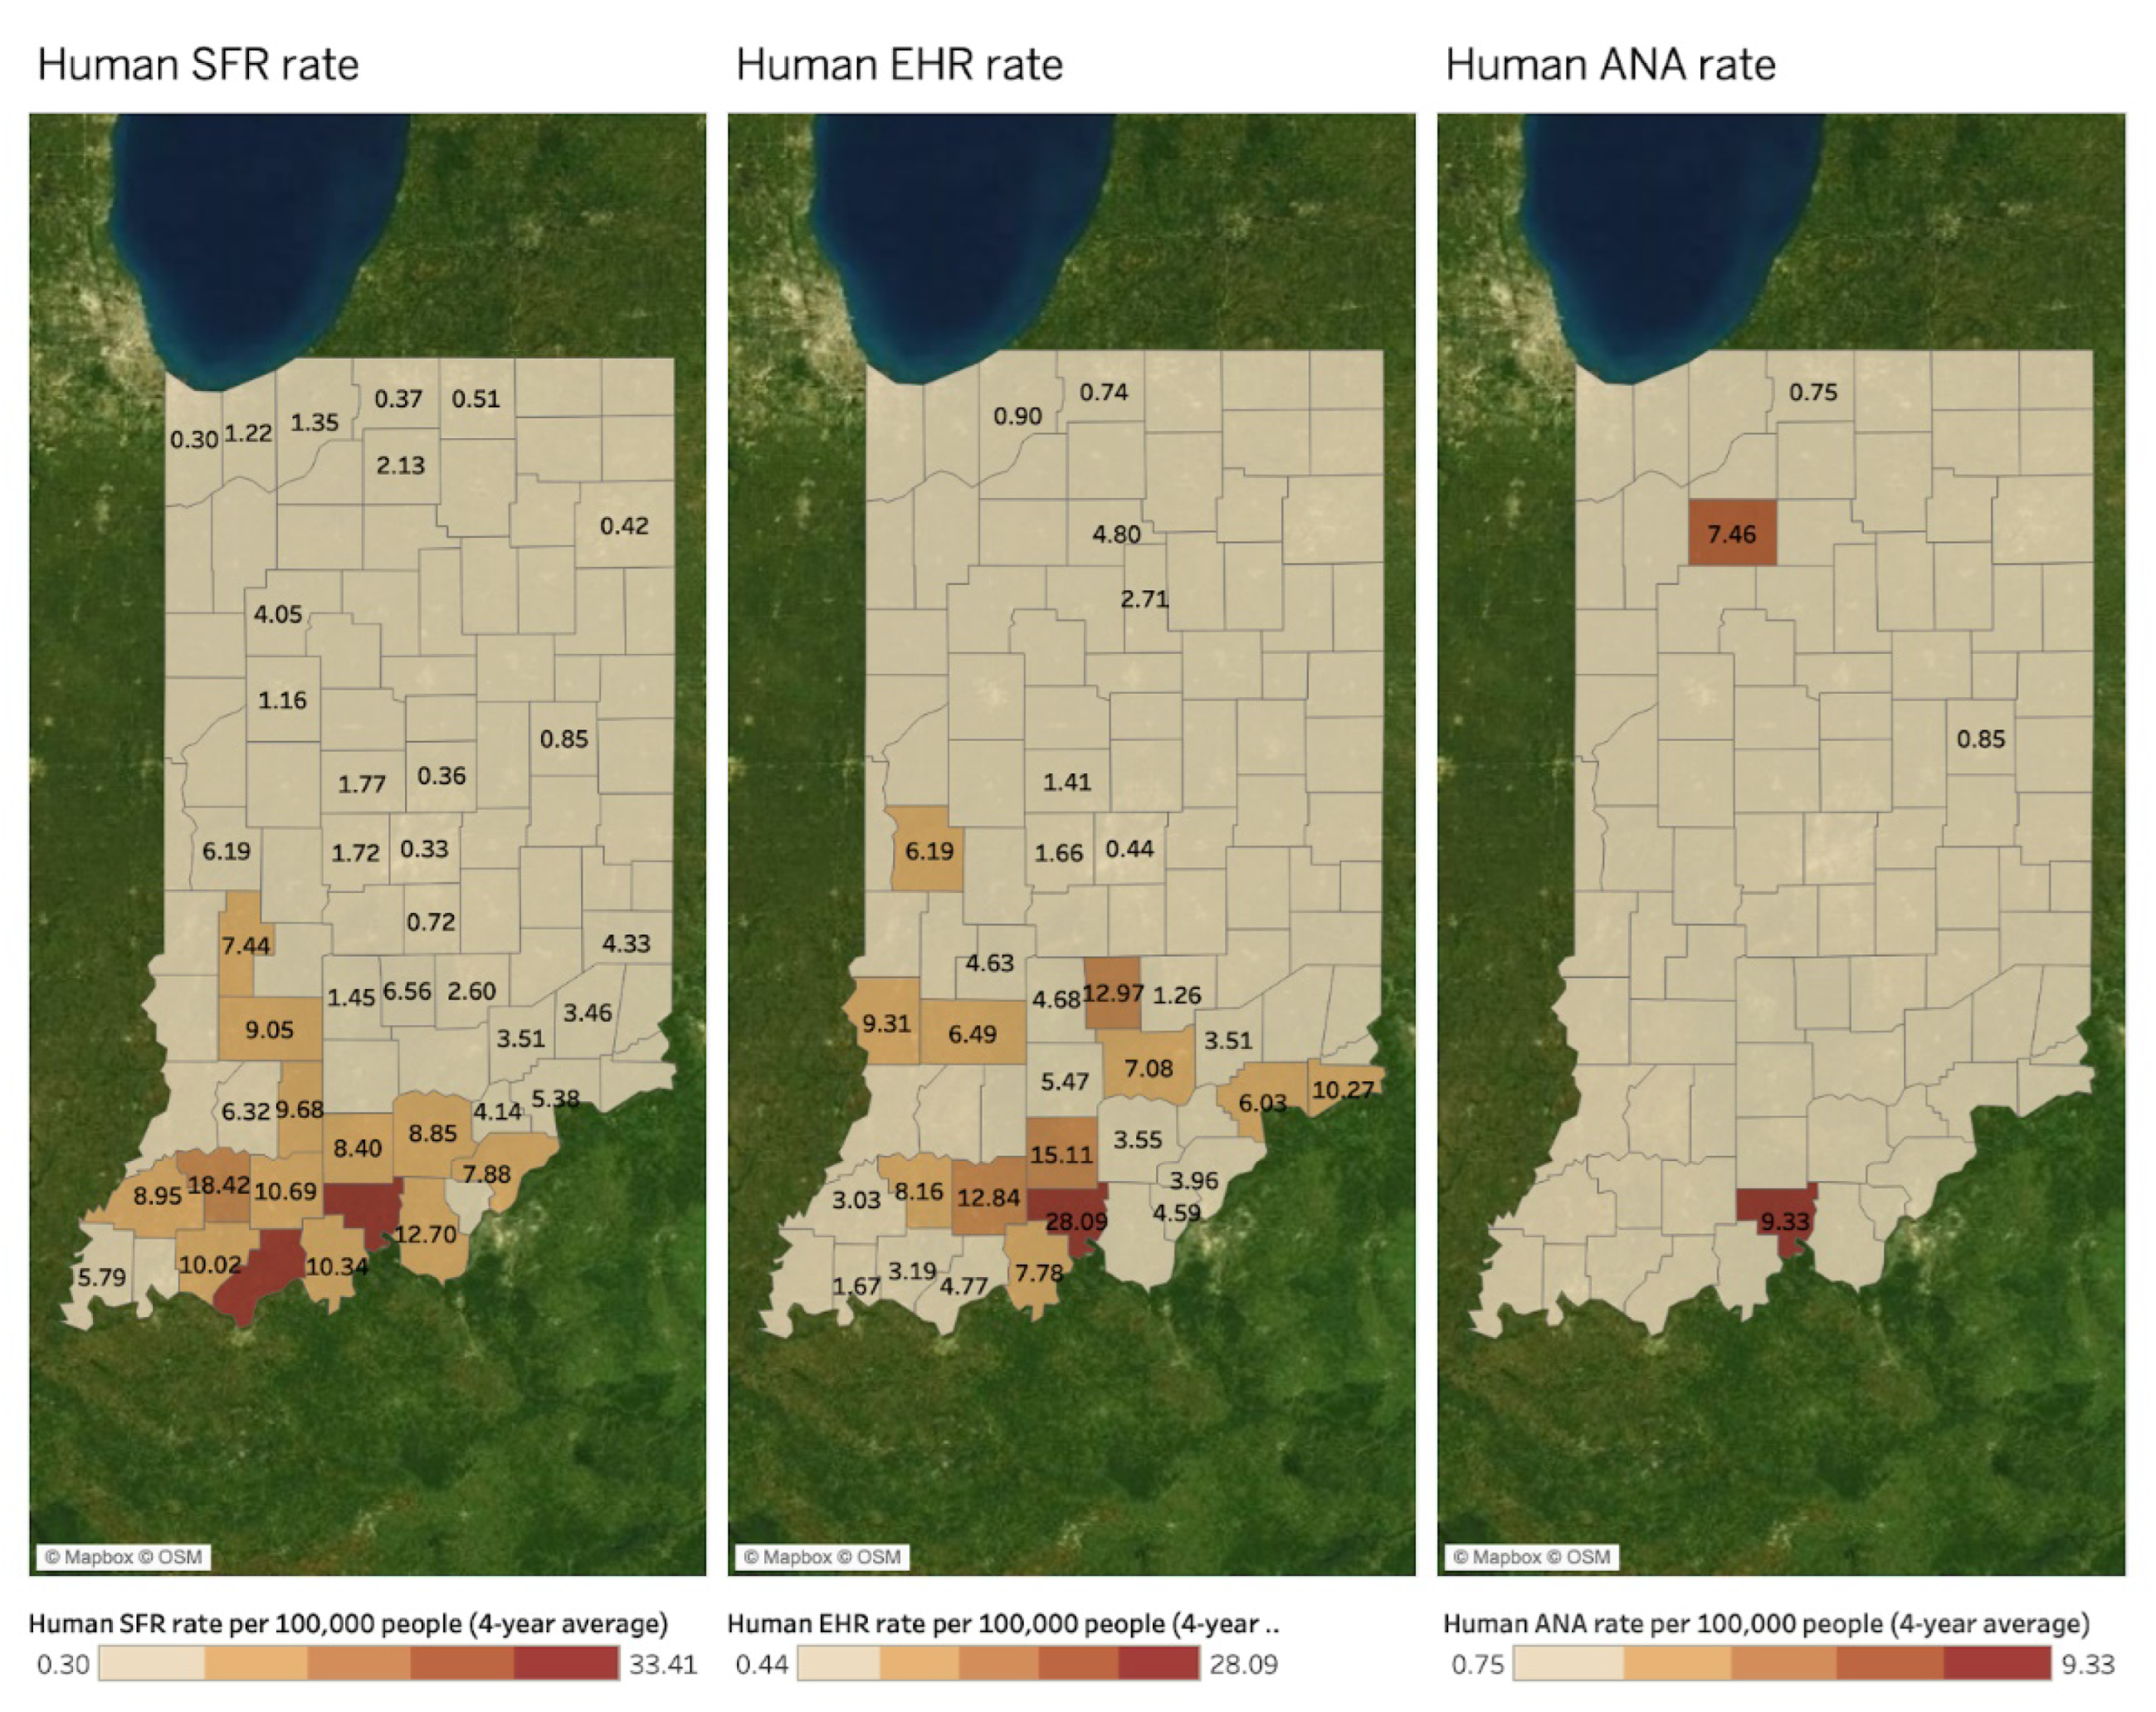
| Human SFR | Human SFR rate per 100,000 people | IDOH |
| Human EHR | Human EHR rate per 100,000 people | IDOH |
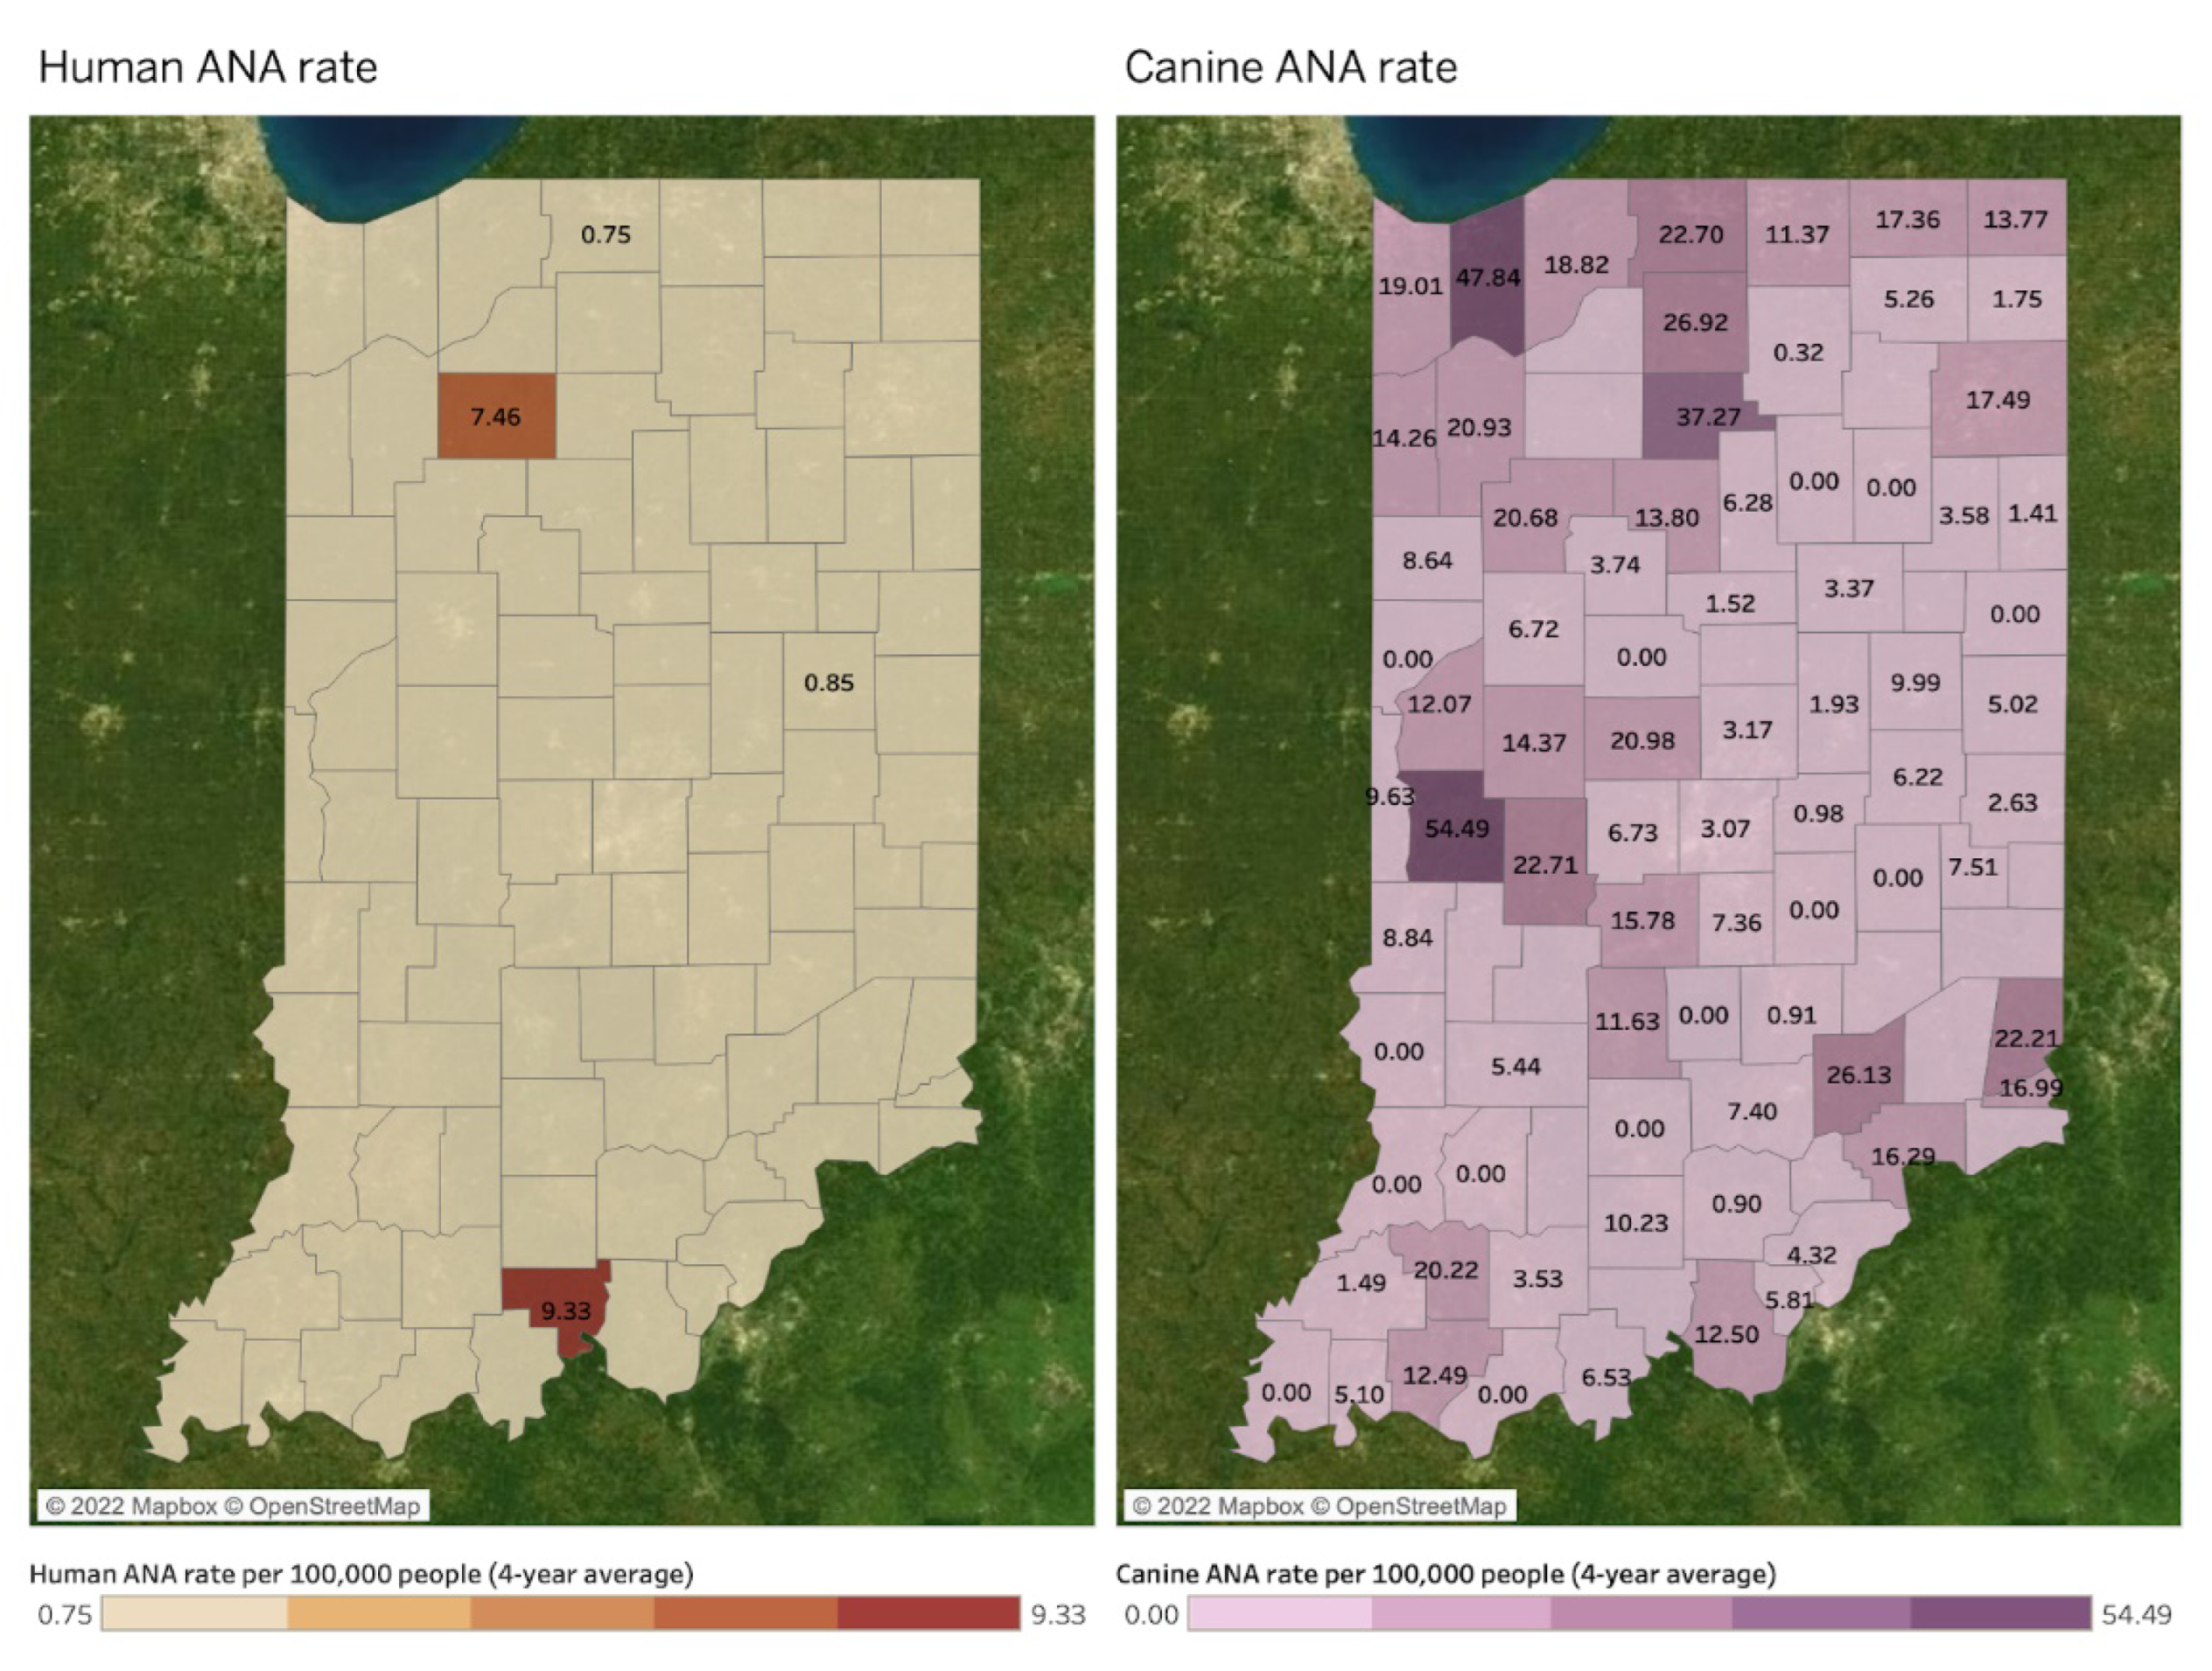
| Human ANA | Human ANA rate per 100,000 people | IDOH |
| Human EHRANA | Human EHRANA rate per 100,000 people | IDOH |
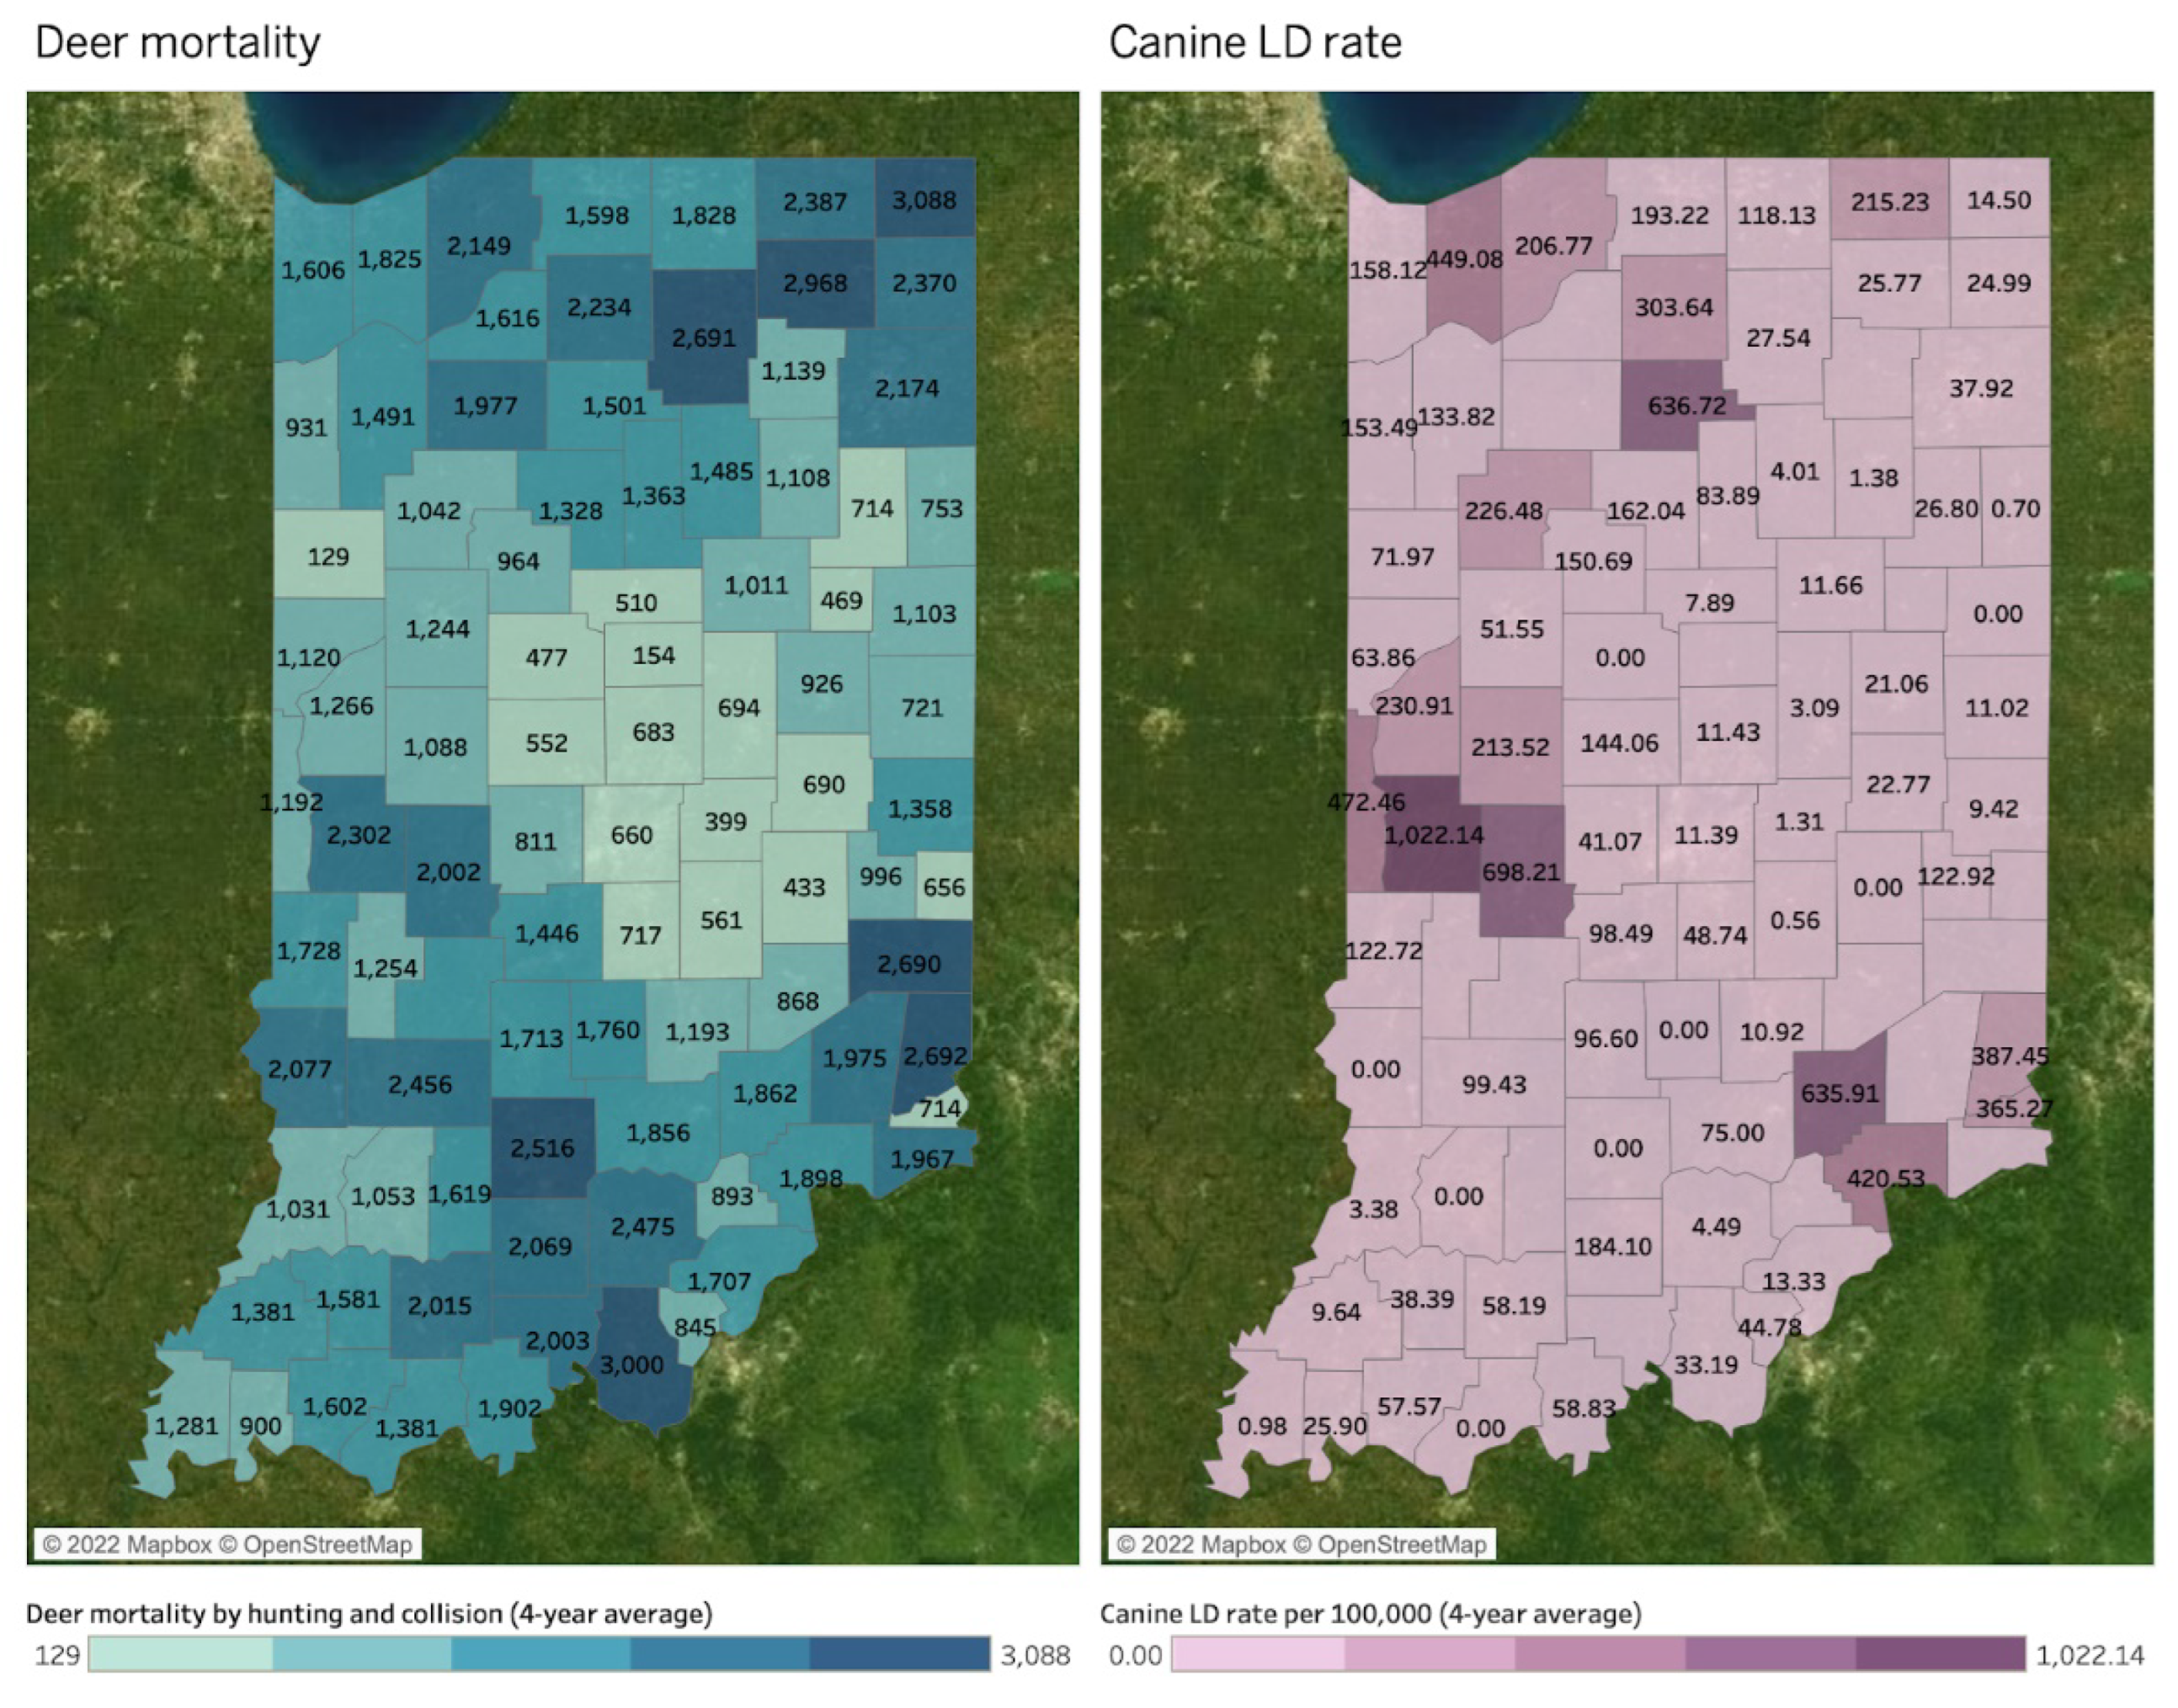
| Canine LD | Canine LD rate per 100,000 people | CAPC 2 |
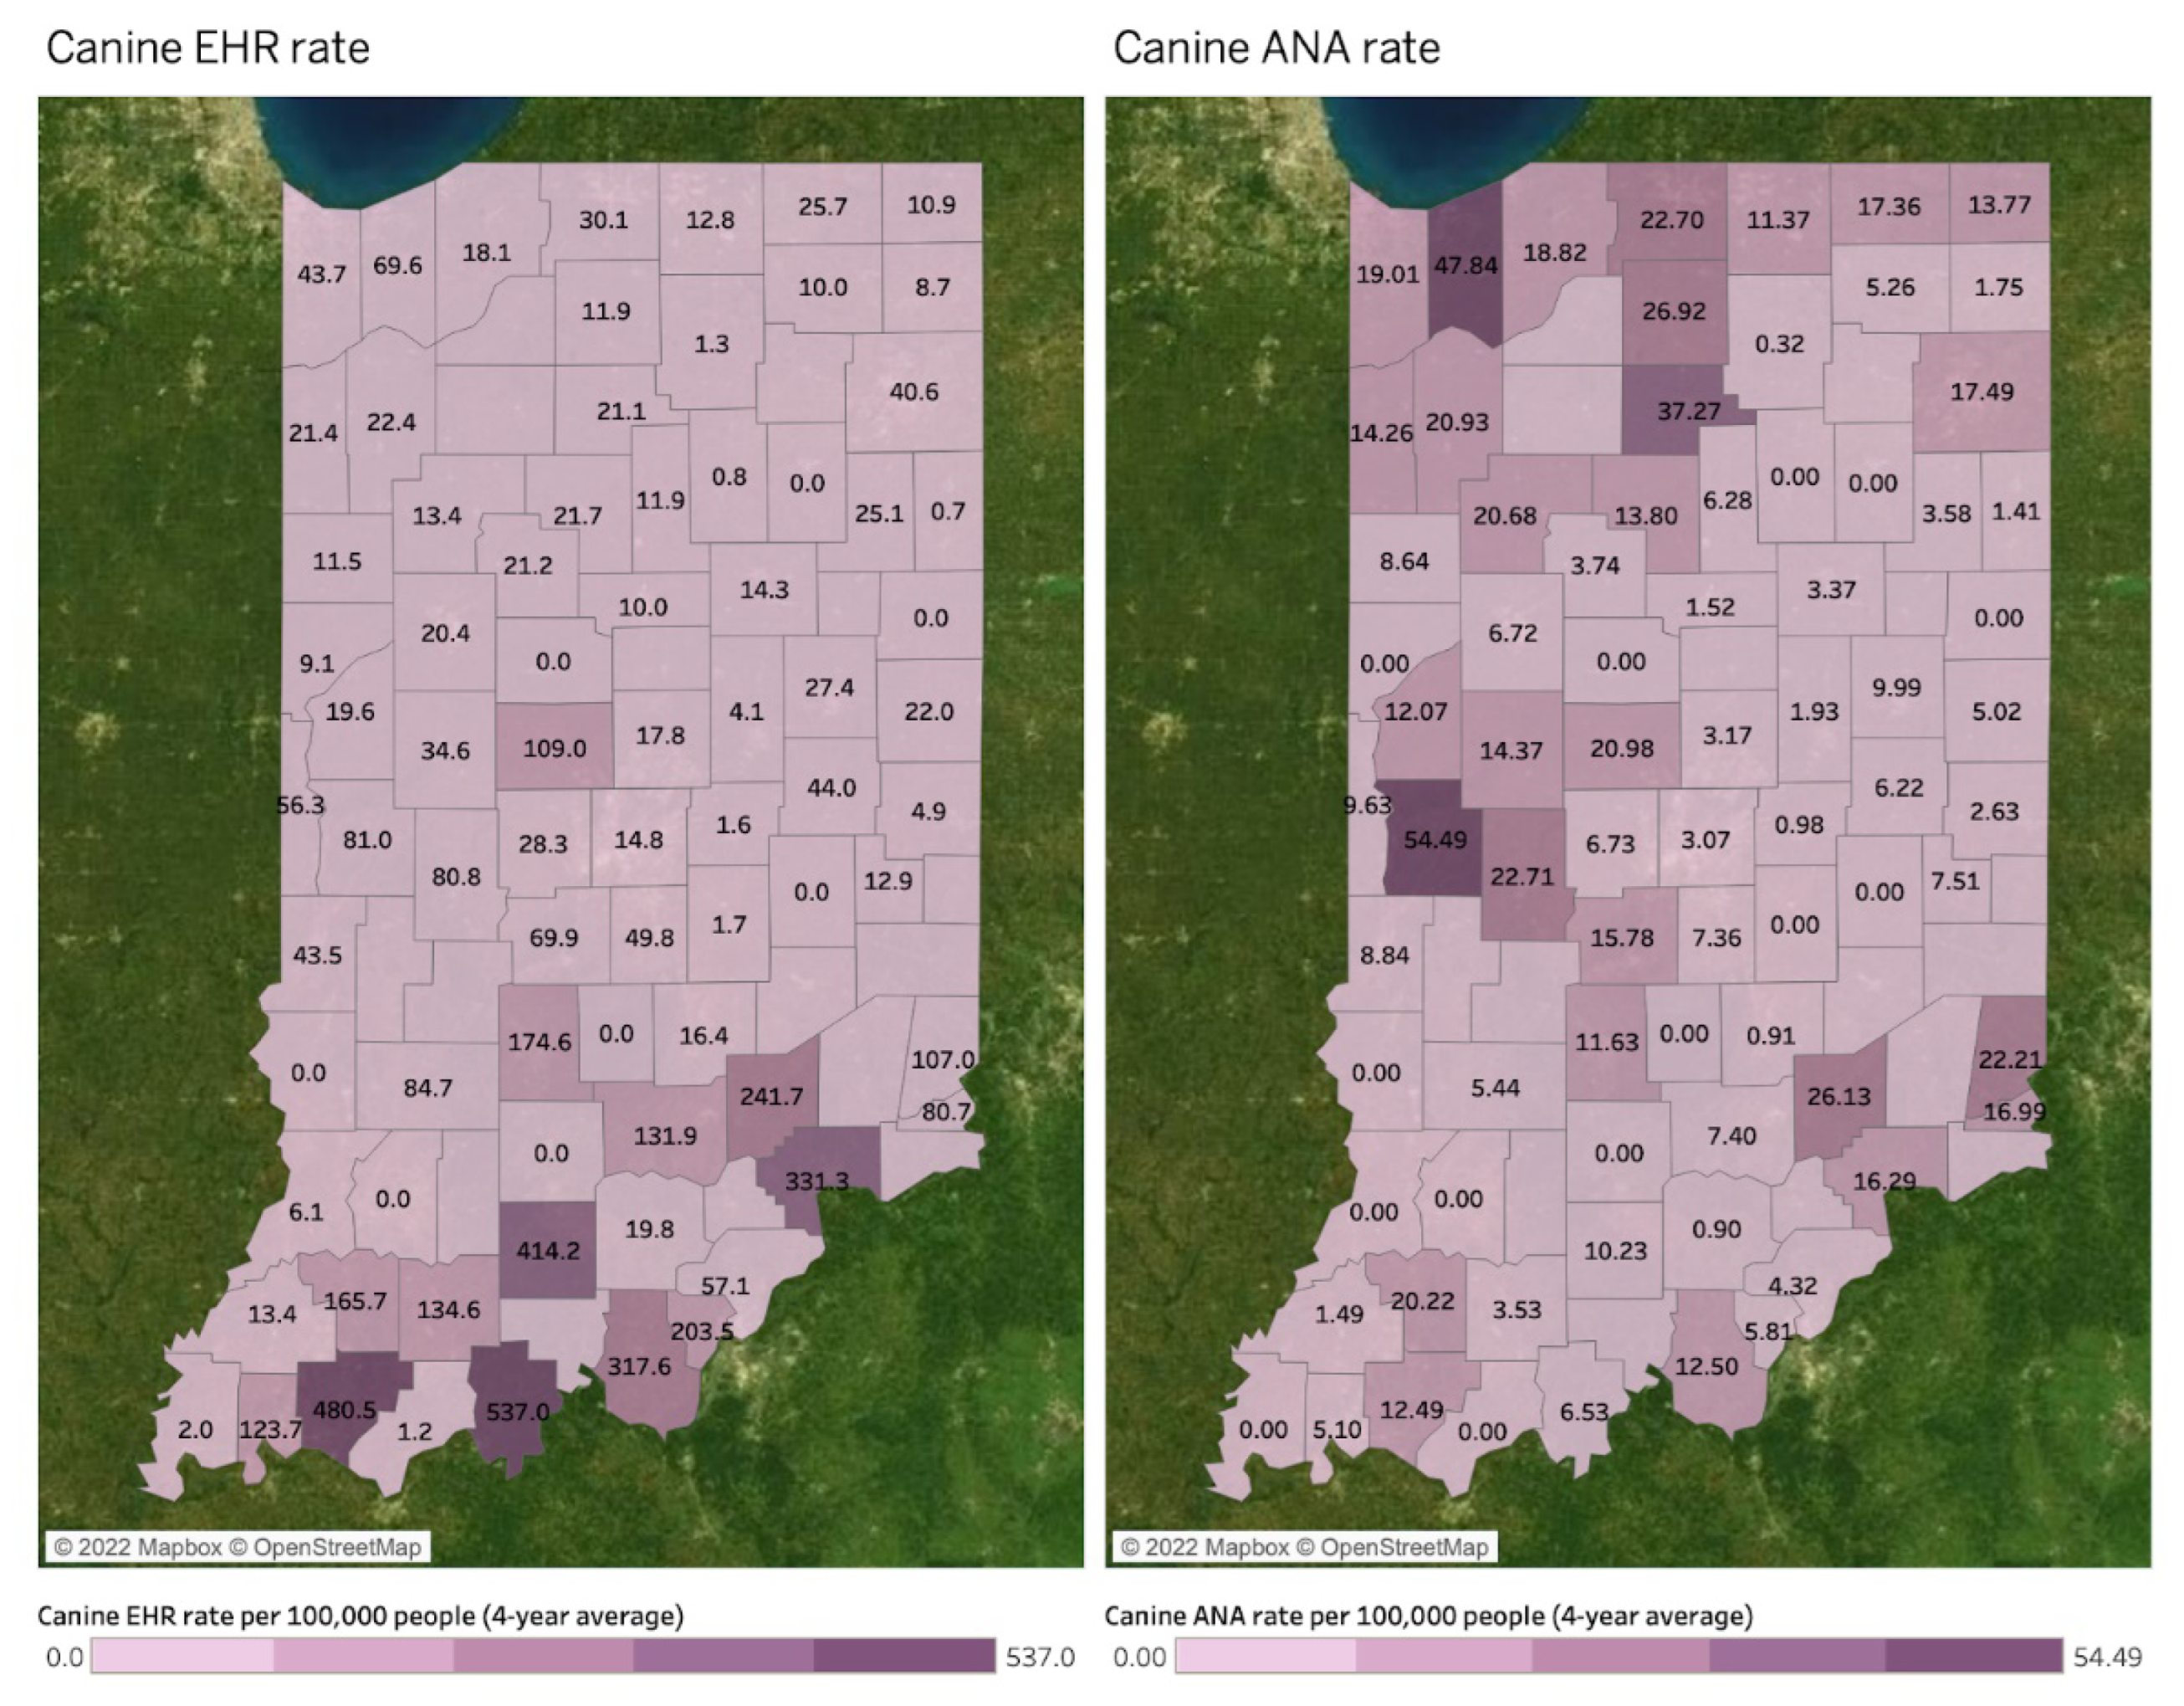
| Canine EHR | Canine EHR rate per 100,000 people | CAPC 2 |
| Canine ANA | Canine ANA rate per 100,000 people | CAPC 2 |
| Deer Observation | The number of deer observations per hour | IDNR 3 |
| Deer Mortality | The number of deer deaths by hunting and collision | IDNR 3 |
| Tick Infectivity | The positive infection rate of Borrelia burgdorferi | IDOH |
| County Population 4 | 2010 and 2020 Decennial US Censuses | US Census 5 |
| SFR | EHR | ANA | EHRANA | LD | ANY TBD | |
|---|---|---|---|---|---|---|
| TBD+ Counties, n (%) | 43 (46.7%) | 32 (34.8%) | 4 (4.3%) | 39 (42.4%) | 71 (77.2%) | 78 (84.8%) |
| Cases, n (%) | 266 (24.9%) | 109 (10.2%) | 5 (0.5%) | 113 (10.6%) | 577 (53.9%) | 1070 (100.0%) |
| Cases, Mean (SD) | 6.2 (7.5) | 3.4 (3.1) | 1.3 (0.5) | 2.9 (2.6) | 8.1 (16.7) | 13.7 (19.0) |
| Cases, Median (IQR) | 3.0 (5.0) | 2.0 (3.5) | 1.0 (0.5) | 2.0 (3.0) | 3.0 (7.0) | 8.0 (16.0) |
| Rate, Mean (SD) | 6.1 (6.9) | 6.0 (5.5) | 4.6 (4.5) | 4.8 (4.8) | 5.6 (4.5) | 9.2 (8.4) |
| Rate, Median (IQR) | 4.1 (7.5) | 4.7 (4.6) | 4.2 (7.6) | 3.5 (4.5) | 4.1 (5.0) | 6.3 (10.1) |
| Canine TBD | Tested | LD+ | EHR+ | ANA+ | ANY TBD+ |
|---|---|---|---|---|---|
| Counties, n (%) | 72 (78.3%) | 69 (75.0%) | 69 (75.0%) | 63 (68.5%) | 70 (76.1%) |
| Total Cases, n (%) | 634,586 (100.0%) | 22,782 (3.6%) | 12,400 (2.0%) | 2605 (0.4%) | 37,787 (6.0%) |
| Cases per County, Mean (SD) | 8813.7 (14481.7) | 330.2 (583.4) | 179.7 (261.1) | 41.4 (72.8) | 539.8 (784.8) |
| Cases per County, Median (IQR) | 3608.0 (9716.0) | 128.0 (347.0) | 53.0 (215.0) | 20.0 (38.0) | 284.5 (655.0) |
| Rate per 100 k per County, Mean (SD) | 2508.7 (2239.2) | 137.6 (194.9) | 70.7 (112.0) | 11.9 (10.7) | 216.0 (245.8) |
| Rate per 100 k per County, Median (IQR) | 2307.1 (2738.3) | 58.2 (148.7) | 22.1 (68.8) | 8.8 (13.6) | 149.0 (230.1) |
| Deer Mortality | All Mortality | Harvest | Collisions | Damage Permits |
|---|---|---|---|---|
| Counties, n (%) | 92 (100.0%) | 92 (100.0%) | 92 (100.0%) | 75 (81.5%) |
| Total Mortality, n (%) | 530,002 (100.0%) | 463,700 (87.5%) | 60,269 (11.4%) | 6033 (1.1%) |
| Mortality by County, Mean (SD) | 5760.9 (2760.0) | 5040.2 (2512.5) | 655.1 (387.7) | 80.4 (104.5) |
| Mortality by County, Median (IQR) | 5487.0 (4079.8) | 4709.5 (3949.8) | 582.5 (406.3) | 42.0 (84.0) |
| Tick Infectivity | Tested, All | Bb+, All | Tested, Adult | Bb+, Adult | Tested, Nymph | Bb+, Nymph |
|---|---|---|---|---|---|---|
| Counties, n (%) | 74 (80.4%) | 59 (64.1%) | 72 (78.3%) | 57 (62.0%) | 62 (67.4%) | 38 (41.3%) |
| Total Ticks, n (%) | 4834 (100.0%) | 1288 (26.6%) | 3139 (64.9%) | 1070 (22.1%) | 1695 (35.1%) | 218 (4.5%) |
| Ticks per County, Mean (SD) | 65.3 (65.9) | 21.8 (24.7) | 43.6 (44.4) | 18.8 (21.3) | 27.3 (26.8) | 5.7 (5.0) |
| Ticks per County, Median (IQR) | 52.0 (72.0) | 15.0 (30.0) | 33.0 (45.0) | 13.0 (21.0) | 20.0 (34.0) | 4.0 (6.0) |
| Bb+ Rate, Mean (SD) | -- | 25.9% (14.1%) | -- | 33.6% (18.7%) | -- | 15.9% (9.0%) |
| Bb+ Rate, Median (IQR) | -- | 27.6% (18.2%) | -- | 36.2% (26.3%) | -- | 14.2% (10.6%) |
| (A) | ||||||||
| Figure Number | Independent Variable | Dependent Variable | County- or DMU-Level | Year (Fixed Covariate) | Year (Fixed Interaction with Ind. Var.) | Year (Random Crossed Effect) | DMU (Random Nested Effect) | County (Random Nested Effect) |
| Figure 2 | Deer Mortality | Deer Observations | DMU | No | No | No | Yes | N/A |
| Figure 3 | Bb+ | Canine LD | County | Yes | No | No | Yes | Yes |
| Figure 3 | Canine LD | Human LD | County | Yes | Yes | No | Yes | Yes |
| Figure 3 | Bb+ | Human LD | County | Yes | No | Yes | Yes | Yes |
| Figure 4 | Canine EHR | Human EHR | County | Yes | Yes | Yes | Yes | Yes |
| Figure 4 | Human SFR | Human EHR | County | Yes | Yes | Yes | Yes | No |
| Figure 4 | Canine EHR | Human SFR | County | Yes | Yes | No | Yes | Yes |
| Figure 5 | Canine ANA | Human ANA | County | Yes | Yes | Yes | No | No |
| Figure 6 | Human LD | Deer Mortality | County | Yes | Yes | Yes | Yes | Yes |
| Figure 6 | Bb+ | Deer Mortality | County | Yes | No | Yes | Yes | Yes |
| Figure 7 | Human EHR | Human ANA | County | Yes | Yes | No | Yes | No |
| Figure 7 | Human SFR | Human ANA | County | Yes | Yes | No | Yes | No |
| Figure 8 | Canine LD | Deer Mortality | County | Yes | Yes | Yes | Yes | Yes |
| Figure 9 | Canine ANA | Canine EHR | County | Yes | Yes | Yes | Yes | Yes |
| Figure 8 and Figure 9 | Canine EHR | Deer Mortality | County | Yes | Yes | Yes | Yes | Yes |
| Figure 6 and Figure 7 | Human EHR | Deer Mortality | County | Yes | Yes | Yes | Yes | Yes |
| Figure 3 and Figure 4 | Bb+ | Canine EHR | County | Yes | No | No | Yes | Yes |
| Figure 3 and Figure 4 | Bb+ | Human EHR | County | Yes | No | Yes | Yes | Yes |
| Figure 3 and Figure 4 | Bb+ | Human SFR | County | Yes | No | No | Yes | Yes |
| (B) | ||||||||
| Figure Number | Independen t Variable | Dependent Variable | Observations (n) | Total Nested Groups (k) | Main Effect (Ind. Var. × Dep. Var.) | Time Effect (Year × Dep. Var.) | Interaction (Time × Main Effect) | LR-Test p-value |
| Figure 2 | Deer Mortality | Deer Observations | 36 | 9 | 2575.08 (1368.5) * | -- | -- | <0.001 |
| Figure 3 | Bb+ | Canine LD | 280 | 77 | 2.66 (1.21) ** | 34.02 (6.34) ** | -- | <0.001 |
| Figure 3 | Canine LD | Human LD | 280 | 77 | 0.84 (1.64) | 0.18 (0.18) | 0 (0) | <0.001 |
| Figure 3 | Bb+ | Human LD | 368 | 92 | 0.04 (0.02) | 0.72 (0.22) ** | -- | <0.001 |
| Figure 4 | Canine EHR | Human EHR | 280 | 77 | −10.11 (1.73) ** | 0.17 (0.13) | 0.01 (0) ** | 0.001 |
| Figure 4 | Human SFR | Human EHR | 368 | 9 | −616.04 (47.25) ** | 0.38 (0.17) ** | 0.31 (0.02) ** | 0.005 |
| Figure 4 | Canine EHR | Human SFR | 280 | 77 | 6.32 (2.97) ** | −0.16 (0.18) | 0 (0) ** | <0.001 |
| Figure 5 | Canine ANA | Human ANA | 280 | 1 | -- | -- | -- | 0.336 |
| Figure 6 | Human LD | Deer Mortality | 368 | 92 | −2817.75 (3043.74) | 31.16 (14.56) ** | 1.4 (1.51) | <0.001 |
| Figure 6 | Bb+ | Deer Mortality | 368 | 92 | 6.92 (3.55) * | 34.19 (13.88) ** | -- | <0.001 |
| Figure 7 | Human EHR | Human ANA | 368 | 9 | -- | -- | -- | 0.320 |
| Figure 7 | Human SFR | Human ANA | 368 | 9 | −99.59 (10.31) ** | −0.01 (0.03) | 0.05 (0.01) ** | 0.005 |
| Figure 8 | Canine LD | Deer Mortality | 280 | 77 | 80.17 (94.77) | 44.83 (15.41) ** | −0.04 (0.05) | <0.001 |
| Figure 9 | Canine ANA | Canine EHR | 280 | 77 | −491.84 (594.81) | 12.23 (4.83) ** | 0.24 (0.29) | <0.001 |
| Figure 8 and Figure 9 | Canine EHR | Deer Mortality | 280 | 77 | 923 (151.7) ** | 71.73 (18.57) ** | −0.46 (0.08) ** | <0.001 |
| Figure 6 and Figure 7 | Human EHR | Deer Mortality | 368 | 92 | 24796.68 (10898.62) ** | 44.32 (16.22) ** | −12.29 (5.4) ** | <0.001 |
| Figure 3 and Figure 4 | Bb+ | Canine EHR | 280 | 77 | −0.76 (0.76) | 18.98 (3.44) ** | -- | <0.001 |
| Figure 3 and Figure 4 | Bb+ | Human EHR | 368 | 92 | −0.04 (0.01) ** | 0.62 (0.2) ** | -- | <0.001 |
| Figure 3 and Figure 4 | Bb+ | Human SFR | 368 | 92 | −0.05 (0.02) ** | −0.54 (0.21) ** | -- | <0.001 |
| Hotspots by DMU | Deer Mortality | Bb+ | Human LD | Human SFR | Human EHR | Human ANA | Canine LD | Canine EHR | Canine ANA |
|---|---|---|---|---|---|---|---|---|---|
| Northeast | 2703 | O | - | - | - | - | - | - | - |
| South | 1945 | - | - | O | O | - | - | O | - |
| Muscatatuck & Dearborn | 1855 and 1791 | O | O | - | - | - | O | - | - |
| Northwest | 1785 | - | O | - | - | - | O | - | O |
| Wabash Valley | 1759 | - | O | - | - | - | O | - | O |
Disclaimer/Publisher’s Note: The statements, opinions and data contained in all publications are solely those of the individual author(s) and contributor(s) and not of MDPI and/or the editor(s). MDPI and/or the editor(s) disclaim responsibility for any injury to people or property resulting from any ideas, methods, instructions or products referred to in the content. |
© 2023 by the authors. Licensee MDPI, Basel, Switzerland. This article is an open access article distributed under the terms and conditions of the Creative Commons Attribution (CC BY) license (https://creativecommons.org/licenses/by/4.0/).
Share and Cite
Maxwell, S.P.; Brooks, C.; Kim, P.; Kim, D.; McNeely, C.L.; Thomas, K. Understanding Habitats and Environmental Conditions of White-Tailed Deer Population Density and Public Health Data to Aid in Assessing Human Tick-Borne Disease Risk. Microorganisms 2023, 11, 865. https://doi.org/10.3390/microorganisms11040865
Maxwell SP, Brooks C, Kim P, Kim D, McNeely CL, Thomas K. Understanding Habitats and Environmental Conditions of White-Tailed Deer Population Density and Public Health Data to Aid in Assessing Human Tick-Borne Disease Risk. Microorganisms. 2023; 11(4):865. https://doi.org/10.3390/microorganisms11040865
Chicago/Turabian StyleMaxwell, Sarah P., Chris Brooks, Pyung Kim, Dohyeong Kim, Connie L. McNeely, and Kevin Thomas. 2023. "Understanding Habitats and Environmental Conditions of White-Tailed Deer Population Density and Public Health Data to Aid in Assessing Human Tick-Borne Disease Risk" Microorganisms 11, no. 4: 865. https://doi.org/10.3390/microorganisms11040865
APA StyleMaxwell, S. P., Brooks, C., Kim, P., Kim, D., McNeely, C. L., & Thomas, K. (2023). Understanding Habitats and Environmental Conditions of White-Tailed Deer Population Density and Public Health Data to Aid in Assessing Human Tick-Borne Disease Risk. Microorganisms, 11(4), 865. https://doi.org/10.3390/microorganisms11040865