Article

Diaporthe Species on Palms: Molecular Re-Assessment and Species Boundaries Delimitation in the D. arecae Species Complex

by
Diana S. Pereira
1,
Sandra Hilário
2,3,
Micael F. M. Gonçalves
3,4 and
Alan J. L. Phillips
1,*
1
Faculdade de Ciências, Biosystems and Integrative Sciences Institute (BioISI), Universidade de Lisboa, Campo Grande, 1749-016 Lisboa, Portugal
2
Interdisciplinary Centre of Marine and Environmental Research (CIIMAR), Terminal de Cruzeiros do Porto de Leixões, Av. General Norton de Matos s/n, 4450-208 Porto, Portugal
3
Faculty of Sciences, Biology Department, University of Porto, Rua do Campo Alegre, Edifício FC4, 4169-007 Porto, Portugal
4
Centre for Environmental and Marine Studies, Department of Biology, Campus Universitário de Santiago, University of Aveiro, 3810-193 Aveiro, Portugal
*
Author to whom correspondence should be addressed.
Microorganisms 2023, 11(11), 2717; https://doi.org/10.3390/microorganisms11112717
Submission received: 28 September 2023 / Revised: 25 October 2023 / Accepted: 3 November 2023 / Published: 6 November 2023
(This article belongs to the Special Issue Plant Pathogenic Fungi: Genetics and Genomics)

Abstract

:
Due to cryptic diversification, phenotypic plasticity and host associations, multilocus phylogenetic analyses have become the most important tool in accurately identifying and circumscribing species in the Diaporthe genus. However, the application of the genealogical concordance criterion has often been overlooked, ultimately leading to an exponential increase in novel Diaporthe spp. Due to the large number of species, many lineages remain poorly understood under the so-called species complexes. For this reason, a robust delimitation of the species boundaries in Diaporthe is still an ongoing challenge. Therefore, the present study aimed to resolve the species boundaries of the Diaporthe arecae species complex (DASC) by implementing an integrative taxonomic approach. The Genealogical Phylogenetic Species Recognition (GCPSR) principle revealed incongruences between the individual gene genealogies. Moreover, the Poisson Tree Processes’ (PTPs) coalescent-based species delimitation models identified three well-delimited subclades represented by the species D. arecae, D. chiangmaiensis and D. smilacicola. These results evidence that all species previously described in the D. arecae subclade are conspecific, which is coherent with the morphological indistinctiveness observed and the absence of reproductive isolation and barriers to gene flow. Thus, 52 Diaporthe spp. are reduced to synonymy under D. arecae. Recent population expansion and the possibility of incomplete lineage sorting suggested that the D. arecae subclade may be considered as ongoing evolving lineages under active divergence and speciation. Hence, the genetic diversity and intraspecific variability of D. arecae in the context of current global climate change and the role of D. arecae as a pathogen on palm trees and other hosts are also discussed. This study illustrates that species in Diaporthe are highly overestimated, and highlights the relevance of applying an integrative taxonomic approach to accurately circumscribe the species boundaries in the genus Diaporthe.

1. Introduction

Diaporthe (syn. Phomopsis) species are well known as pathogens, endophytes and saprobes in economically important crops, ornamentals and forest trees, but also occur as pathogens in humans and other mammals [1,2,3,4,5]. Along with its diverse host ranges and cosmopolitan distribution, the interest in this genus has increased over the decades due to its recurrent association with plant diseases [4,6,7,8,9,10,11,12,13]. Several studies have reported that Diaporthe spp. cause diverse suites of diseases, including leaf spots, blights, root and fruit rots, seed decay, stem cankers, dieback and wilting [14,15,16,17,18,19,20,21]. Given that the implementation of international phytosanitary measures relies on the correct identification of the phytopathogenic fungi [22], the taxonomy of Diaporthe has often been re-evaluated to construct a reliable and natural framework for species identification [13,23,24,25,26,27].
Species identification in the genus Diaporthe was formerly based on morphological characters and host association [4,5,6,24], leading to a proliferation of more than 2000 species names [28]. However, due to phenotypic plasticity, morphological characters and host association proved to be inadequate for species identification in the genus [4,14,29,30]. Currently, the circumscription of species in Diaporthe relies mostly on multi-gene phylogenies based on the nuclear ribosomal internal transcribed spacer region (ITS) and partial sequences of the translation elongation factor 1-α (tef1), β-tubulin (tub2), histone H3 (his3), and calmodulin (cal) genes [5,9,23,24,26,31,32].
Molecular studies have greatly clarified the taxonomy of the genus Diaporthe, for instance, by unveiling its paraphyletic nature [26,33]. However, defining species boundaries remains a major challenge in Diaporthe. Researchers have often found difficulties in interpreting their phylogenetic analyses, which may be related either to limited sampling in many clades, or the use of DNA barcodes with insufficient phylogenetic resolution [34]. As a consequence, many studies of the genus have grouped some species into species complexes, such as D. amygdali, D. arecae, D. eres and D. sojae, thus assisting in an accurate identification of taxa [7,9,27,35,36,37]. Recently, Norphanphoun et al. [27] formalized the concept of species complexes in Diaporthe based on an inferred phylogenetic analysis of a comprehensive dataset of the five most common loci used to identify species in Diaporthe. While several efforts have been made over the last years to resolve the species boundaries of some of those complexes, the accurate identification of species within the D. arecae species complex (DASC) has been overlooked.
Diaporthe arecae was introduced by Srivastava et al. [38] as Subramanella arecae associated with a severe post-harvest fruit rot of Areca catechu in India. The species was later assigned to Diaporthe based on an ex-isotype culture by Gomes et al. [24]. However, these authors revealed that most loci used to infer the phylogenetic relationships in Diaporthe failed to resolve the phylogenetic position of D. arecae and its related species. Later, based on morpho-molecular analyses, Tan et al. [39] introduced three new closely related species to D. arecae, but they showed low bootstrap support values. The problematic clade was first designated as the D. arecae species complex by Huang et al. [35], who isolated 13 endophytic strains from Citrus spp. in different provinces of China that were clustered in a poorly supported clade with the ex-isotype strain of D. arecae. Huang and co-workers were the first to recognize that the species boundaries within the DASC should be carefully re-evaluated, so they “refrained from defining novel taxa within the complex” [35]. Although a few authors have followed the same strategy [40], over the years more than 40 species, including important phytopathogens, distributed worldwide, have been introduced in the DASC. For instance, Guarnaccia and Crous [10] introduced D. limonicola and D. melitensis in the DASC as a devasting dieback disease affecting Citrus in Europe. Contrarily, minor pathogens, such as D. pescicola and D. taoicola [41] and D. guangxiensis and D. viniferae [21], were introduced in the same species complex associated with dieback symptoms in Prunus persica and Vitis vinifera in China, respectively. Moreover, D. oculi and D. pseudooculi were introduced to the DASC by Ozawa et al. [42] as human pathogens causing eye diseases. This evidence suggests that the ecology of the DASC is complex and may include, besides phytopathogens, some species involved in human invasive infections.
It has long been recommended that new Diaporthe species should be carefully introduced [26,32,43]. However, most species belonging to the DASC were introduced based on the concatenation of sequences from different loci, disregarding the application of the Genealogical Concordance Phylogenetic Species Recognition (GCPSR) principle [44]. This common practice often misleads tree species estimation and tends to overestimate the true species diversity, since each clade in combined-gene genealogies is often recognized as a distinct lineage [45,46,47,48]. The GCPSR principle was proposed by Taylor et al. [44] based on the Genealogical Concordance Species Concept (GCSC) by Avise and Ball [49]. The GCPSR assumes that recombination within a lineage creates conflict between individual gene genealogies; thus, the phylogenetic concordance represented by the transition from conflict to congruence detects the lack of gene flow and defines the limit of a species [44]. Nonetheless, delimiting species boundaries in closely related taxa using multilocus phylogenies is not always straightforward. Genes can exhibit different evolutionary histories, which result in conflicts between individual gene genealogies and ultimately mislead the relationships among closely related taxa [46,47,50,51,52]. These conflicts may arise not only from recombination events, but also from incomplete lineage sorting (ILS), in which some alleles are not expected to be reciprocally monophyletic in the initial stages of speciation [34,51,53,54].
For the above reasons, complementary methods, such as haplotype networks, splits graphs (phylogenetic networks), population genetic diversity analyses and coalescent-based species delimitation methods, have recently been proposed to determine species boundaries in Diaporthe more accurately [36,37,55]. As an alternative to the GCPSR criteria, the coalescent methods, based on the Multispecies Coalescent (MSC) model [56], provide a framework for phylogenetic inference based on ancestral polymorphisms and the so-called gene-tree/species-tree conflict [51,54,57,58,59]. Such methods provide a more comprehensive view of speciation events, since they can infer species trees and estimate species boundaries even when there is incongruence between individual gene genealogies and a lack of reciprocal monophyly among lineages [57,60,61]. Despite the utility of coalescent-based methods to support species delimitation, they have rarely been used in phytopathogenic fungi, namely Alternaria [47], Beauveria [62], Colletotrichum [34], Fusarium [48], genera of lichenized fungi [63] and, more recently, Diaporthe [36,37]. Hilário et al. [37] have resolved the D. amygdali species complex, providing evidence that it constitutes a single species through the application of the GCPSR principle, along with coalescent-based models. Likewise, the same methodology has been applied to successfully resolve the D. eres species complex [36], which has been shown to constitute a population with intraspecific variability rather than different lineages.
During a survey leaf spotting fungi associated with palm trees in Lisbon, Portugal, several Diaporthe taxa have been isolated and preliminary results have been reported in [64]. The purpose of the present study is to: (1) re-assess the morphological and molecular characterization of the isolates obtained from foliar lesions of palms that belong to the DASC; and (2) resolve the species boundaries of the DASC by implementing an integrative taxonomic approach comprising single and multilocus phylogenetic analyses, coalescent-based species delimitation methods, phylogenetic networks, hierarchical cluster analysis of phenotypic data and assessment of recombination and population genetic diversity.

2. Material and Methods

2.1. Specimen Collection, Examination, and Single-Spore Isolation

In 2018, diseased leaf segments and leaflets with foliar lesions were collected from ornamental palm trees in Lisbon, Portugal. Plant material was transported to the laboratory in paper envelopes and examined with a Leica MZ9.5 stereo microscope (Leica Microsystems GmbH, Wetzlar, Germany) for observation of lesion morphology and associated fungi. Isolations were made directly from foliar lesions following the methods described by Pereira and Phillips [65].
The isolates used in the present study, CDP 0047, CDP 0358 (D. pseudophoenicicola) and CDP 0460 (D. chamaeropicola), belong to the DASC and were previously reported in a preliminary study on Diaporthe occurring on palms published in [64]. Their morphological observation and characterization were re-accessed here.

2.2. Morphological Observation and Characterization

Cultures were induced to sporulate by culturing on 2% water Agar (WA) (Bacteriological Agar Type E; BIOKAR Diagnostics, Allonne, France) bearing healthy double-autoclaved palm leaf pieces. After incubating at 28 °C under a 12 h near-ultraviolet light/12 h dark cycle, from 3 days to 1 week, conidiomata were cut through vertically, and the conidiogenous layer was dissected. Microscopic structures (pycnidia, conidiophores, conidiogenous cells and conidia) were mounted in 100% lactic acid and examined by differential interference contrast (DIC) microscopy. Observations on micromorphological features were made using Leica MZ9.5 and Leica DMR microscopes (Leica Microsystems GmbH, Wetzlar, Germany), and digital images were recorded with Leica DFC300 and Leica DFC320 cameras (Leica Microsystems GmbH, Wetzlar, Germany), respectively. Measurements were made with the measurement module of the Leica IM500 Image Management System (Leica Microsystems GmbH, Wetzlar, Germany). Mean, standard deviation (SD) and 95% confidence intervals were calculated from n = total of measured structures. Measurements are given as minimum and maximum dimensions with mean and SD in parenthesis. Photoplates were prepared with Adobe Photoshop CS6 Extended (Adobe, San Jose, CA, USA).

2.3. Sequence Alignment and Phylogenetic Analyses

A preliminary identification, based on BLASTn searches with the ITS sequences of the isolates from the present study, was carried out to determine the most closely related taxa, whose sequences were subsequently retrieved from GenBank. Species of Diaporthe isolated from palm tissues listed in the recent literature [26,66,67] or deposited in GenBank were also used. A total of 127 strains currently accepted in the genus Diaporthe were used to perform an initial phylogenetic analysis based on the ITS sequences. The ingroup taxa included three isolates from this study (CDP 0047, CDP 0358 and CDP 460), 22 strains isolated from palm tissues retrieved from recent literature or from GenBank (BR74, HNHK01, HNHK02, HNHK03, HNQH02, HNQH03, HNQZ01, HNWC01, HNWC02, HNWN03, LC 6150, LC 6151, SM28, SM29, SM30, SM35, SM36, SM38, SM39, SM41, SM45 and SM49) and 94 strains of related Diaporthe species retrieved from GenBank (Table 1). This analysis was conducted to select the species recognized within the DASC. The resulting tree was compared with the recent literature on Diaporthe and a highly supported clade representing the DASC was selected for further analyses.
Sequences for each locus were aligned with ClustalX version 2.1 [68] using the following parameters: pairwise alignment parameters (gap opening = 10, gap extension = 0.1) and multiple alignment parameters (gap opening = 10, gap extension = 0.2, DNA transition weight = 0.5, delay divergent sequences = 25%). Alignments were checked, and manual adjustments were made wherever necessary with BioEdit version 7.0.5.3 [69]. Terminal regions with missing data and ambiguously aligned regions were excluded from the analysis. Sequences were combined in concatenated matrices using MEGA X version 10.2.6 [70]. Partition homogeneity was assessed using the incongruence length difference (ILD) test [71] performed in PAUP version 4.0a165 [72] to determine the congruency of genes and whether they could be combined.
Maximum likelihood (ML), maximum parsimony (MP) and Bayesian analyses (BA) were used for phylogenetic inferences of the single gene and concatenated alignments and were implemented on the CIPRES Science Gateway portal version 3.3 [73] using RAxML-NG version 1.1.0 [74], PAUP version 4.0a165 [72] and MrBayes version 3.2.7a [75], respectively. The resulting trees were visualized with FigTree version 1.4.4 [76] and prepared with Adobe Illustrator CS2 version 12.0.0 (Adobe, San Jose, CA, USA).
For ML and BA inferences, the best-fit nucleotide substitution model for each locus was determined using MEGA X version 10.2.6 [70] under the Akaike information criterion (AIC), except for the primary phylogenetic analyses of the concatenated alignment containing all species in the DASC. In this case, ML and BA inferences were performed using a general time reversible (GTR) nucleotide substitution model including a discrete gamma distribution and estimation of proportion of invariable sites (GTR + G + I) to accommodate variable rates across sites. Clade stability and robustness of the branches of the best scoring ML tree were estimated by conducting a rapid bootstrap (BS) analysis with iterations halted automatically by RAxML.
MP were performed using the heuristic search option with 1000 random taxa additions and tree bisection and reconnection (TBR) as the branch-swapping algorithm. All characters were unordered and of equal weight, and alignment gaps were treated as missing data. Maxtrees were set to 10,000, branches of zero length were collapsed and all multiple, and equally parsimonious, trees were saved. Clade stability and robustness of the most parsimonious trees were assessed using BS analysis with 1000 pseudoreplicates each with 10 replicates of random stepwise addition of taxa. Descriptive tree statistics for parsimony such as tree length (TL), homoplasy index (HI), consistency index (CI), retention index (RI) and rescaled consistency index (RC) were calculated.
BA were computed with four simultaneous Markov Chain Monte Carlo chains for two runs, 10,000,000 generations and a sampling frequency of 10 generations, ending the run automatically when standard deviation of split frequencies fell below 0.01. The first 25% of trees were discarded as the burn-in fraction, while the remaining 75% were used to calculate the 50% majority rule consensus tree and posterior probability (PP) values.

2.4. Phylogenetic Species Recognition

Concatenation methods have been shown to work well with missing data if they are evenly distributed among taxa and gene regions and if a sufficiently large number of genes are sampled [77]. However, the concatenated dataset used to infer the phylogenetic relationships among taxa within the DASC did not have fairly evenly distributed missing data among the five gene regions (Table 1). Thus, given the lack of cal and his3 partial sequences for several species of the DASC, multilocus phylogenetic analyses based on five (ITS, tef1, tub2, cal and his3), four (ITS, tef1, tub2 and cal) and three (ITS, tef1 and tub2) loci were conducted to properly resolve the species complex. Each analysis included only those species whose five, four and three loci, respectively, were available. Individual gene trees for each of these multilocus phylogenetic analyses conducted were accessed to compare highly supported clades (ML-BS and MP-BS ≥ 70%) in order to detect conflict between the individual phylogenies and to accordingly apply the GCPSR principle [44] to determine the species boundaries of the DASC.
Moreover, the operational criteria of the two-step process described by Dettman et al. [78] were also applied to resolve certain clades which were not clarified after strictly following the GCPSR principle. For these assessments, ML and MP inferences were conducted for single gene sequence alignments. Briefly, the two-step process was applied as follows: clades were genealogically concordant if they were present in at least some of the individual gene genealogies, and genealogically non-discordant if they were well-supported (ML-BS and MP-BS ≥ 70%) in a single gene tree and not contradicted at or above this level of support in more than one other single-gene tree. This criterion prohibited poorly supported non-monophyly at one locus from impairing well-supported monophyly at another locus. In addition, the selected independent evolutionary lineages (IEL) were determined conclusively if resolved with high support values (ML-BS/MP-BS ≥ 70% and PP ≥ 0.95) in most phylogenetic analyses of the combined datasets. Each IEL was ranked as phylogenetic species based on genetic differentiation (lineages must be well-differentiated to prevent minor tip clades from being recognized as phylogenetic species) and exhaustive subdivision (all individuals must be placed into a phylogenetic species to avoid unclassified individuals) criteria [78,79].
ML individual gene trees of the DASC, comprising all available species for each locus, were also constructed to aid conclusions for certain taxa for which a limited number of loci was available and thus were excluded from the multilocus phylogenetic analyses. All phylogenetic inferences included eight well-delimitated outgroup taxa, corresponding to four well-established Diaporthe species (D. citri, D. corylicola, D. longicolla and D. sennicola).

2.5. Phylogenetic Informativeness Analysis

To determine the loci most suitable for phylogenetic inference in the DASC, the phylogenetic informativeness (PI) profiling method [80] was employed. The analysis was implemented in the PhyDesign [81] web server (http://phydesign.townsend.yale.edu/, accessed on 15 June 2023). PI was measured from a partitioned combined dataset of the ITS, tef1, tub2, cal and his3 loci for 37 isolates, including 20 type strains and related taxa belonging to the DASC and two outgroup taxa. The ML inference from RAxML analysis of the combined dataset was performed using the GTR + G + I substitution model and was used to build a time tree using MEGA X version 10.2.6 [70] as described by Melo [82]. Relative divergence times were estimated for all branching points by applying the RelTime-ML method [83,84] with no calibration constraints. Branch lengths were calculated using the same substitution model as previously used to estimate the phylogenetic tree. The PI for all five partitions were determined using the rates of change for each site under the HyPhy criteria [85].

2.6. Coalescent-Based Species Delimitation Analyses

To infer the species boundaries of the DASC, the coalescent-based models Poisson tree processes (PTP) [86] and multi-rate PTP (mPTP), which accommodates different degrees of intraspecific genetic diversity within a phylogeny and has an improved delimitation accuracy compared to the former [87], were performed. Both analyses were conducted using the newick format of the ML inferences produced by FigTree version 1.4.4 [76]. PTP analyses were performed with 500,000 MCMC generations, thinning set to 100, burn-in of 10% and conducted on the web server for PTP (http://species.h-its.org/ptp/, accessed on 15 May 2023). Convergence of the MCMC iterations was assessed by visualizing the log-likelihood trace plot. mPTP analyses were conducted on the web server for mPTP (http://mptp.h-its.org, accessed on 15 May 2023). Including outgroups that are distantly related to the remaining taxa on the phylogenetic inference may worsen the delimitation results provided by the coalescent-based models applied here. Therefore, both analyses were initially run with and without the outgroup taxa to evaluate their impact on the PTP and mPTP species delimitation hypothesis. As results were qualitatively similar, all subsequent analyses were performed with the outgroup taxa to avoid taxonomic discrepancy among analyses. The resulting trees were prepared with Adobe Illustrator CS2 version 12.0.0 (Adobe, San Jose, CA, USA).
Like concatenation methods, coalescent-based species tree estimation methods have been shown to work reliably and produce accurate species trees even when there are substantial amounts of missing data [88], especially if they are randomly distributed (per gene and/or per taxa) and if a sufficiently large number of genes are sampled [77]. Given the lack of cal and his3 partial sequences for several species in the DASC, the coalescent-based PTP and mPTP models applied included those species whose five (ITS, tef1, tub2, cal and his3), four (ITS, tef1, tub2 and cal) and three (ITS, tef1 and tub2) loci were available, and were conducted using the ML inferences of the 5-, 4- and 3-loci combined datasets, respectively.

2.7. Pairwise Homoplasy Index Test and Phylogenetic Network Analyses

The concatenated alignments were used to infer the occurrence of recombination events within the DASC through the pairwise homoplasy index (PHI, Φw) test [89] implemented in SplitsTree4 version 4.19.0 [90]. To detect intragenic recombination, the PHI test was also applied to the single gene sequence alignments. Significant recombination was considered when the probably of the Φw-statistic was below 0.05 (p-value < 0.05).
To evaluate and visualize the impact of the potential recombination events, the relationships between closely related taxa within the DASC were visualized through phylogenetic networks based on the concatenated sequence alignments. The phylogenetic networks were constructed using the LogDet transformation [91] for the distance matrix and the Neighbor-Net algorithm [92] implemented using SplitsTree4 version 4.19.0. The resulting phylogenetic networks were prepared with Adobe Illustrator CS2 version 12.0.0 (Adobe, San Jose, CA, USA).

2.8. Population Genetic Diversity

Genetic diversity within the DASC was estimated using DnaSP version 6.12.03 [93]. The following molecular diversity indices were calculated for the concatenated and single gene sequence alignments: number of haplotypes (h), number of polymorphic (segregating) sites (S), haplotype (gene) diversity (hd) [94], nucleotide diversity (π) [95], total number of mutations (η) and Watterson estimator (θ) [96]. Neutrality statistical information to understand the potential departure from an equilibrium model of evolution was also obtained through Tajima’s D statistical test [97].

2.9. Hierarchical Cluster Analysis of Phenotypic Data

To assess the correlation between species phylogenetic boundaries and taxa morphology, measurements of the length and width of alpha and beta conidia of all species belonging to the DASC with published taxonomic descriptions were used. A hierarchical cluster analysis (HCA) was conducted using R Statistical Software version 4.3.1 [98]. Pairwise distance among taxa were estimated using Euclidean distance index to generate the dissimilarity matrices, and dendrograms were constructed by the unweighted pair group method with arithmetic mean (UPGMA) as the clustering algorithm. Dendrograms were generated using the following R packages: cluster version 2.1.4 [99], factoextra version 1.0.7 [100] and dendextend version 1.17.1 [101]. The optimal number of clusters was determined using the R package nbclust version 3.0.1 [102] according to the majority rule approach. Goodness-of-fit of the dendrograms was evaluated by means of the cophenetic correlation coefficient (c) [103]. Dendrograms were generated based on the length-to-width (L/W) ratios of alpha and beta conidia. These were calculated for all taxa following Equation (1) to standardize and make the data comparable among taxa.
L / W = L m i n + L m a x W m i n + W m a x ,
where, for a given taxa and a given micromorphological structure, Lmin and Lmax stand for the length minimum and maximum dimensions, respectively, and Wmin and Wmax stand for the width minimum and maximum dimensions, respectively.

3. Results

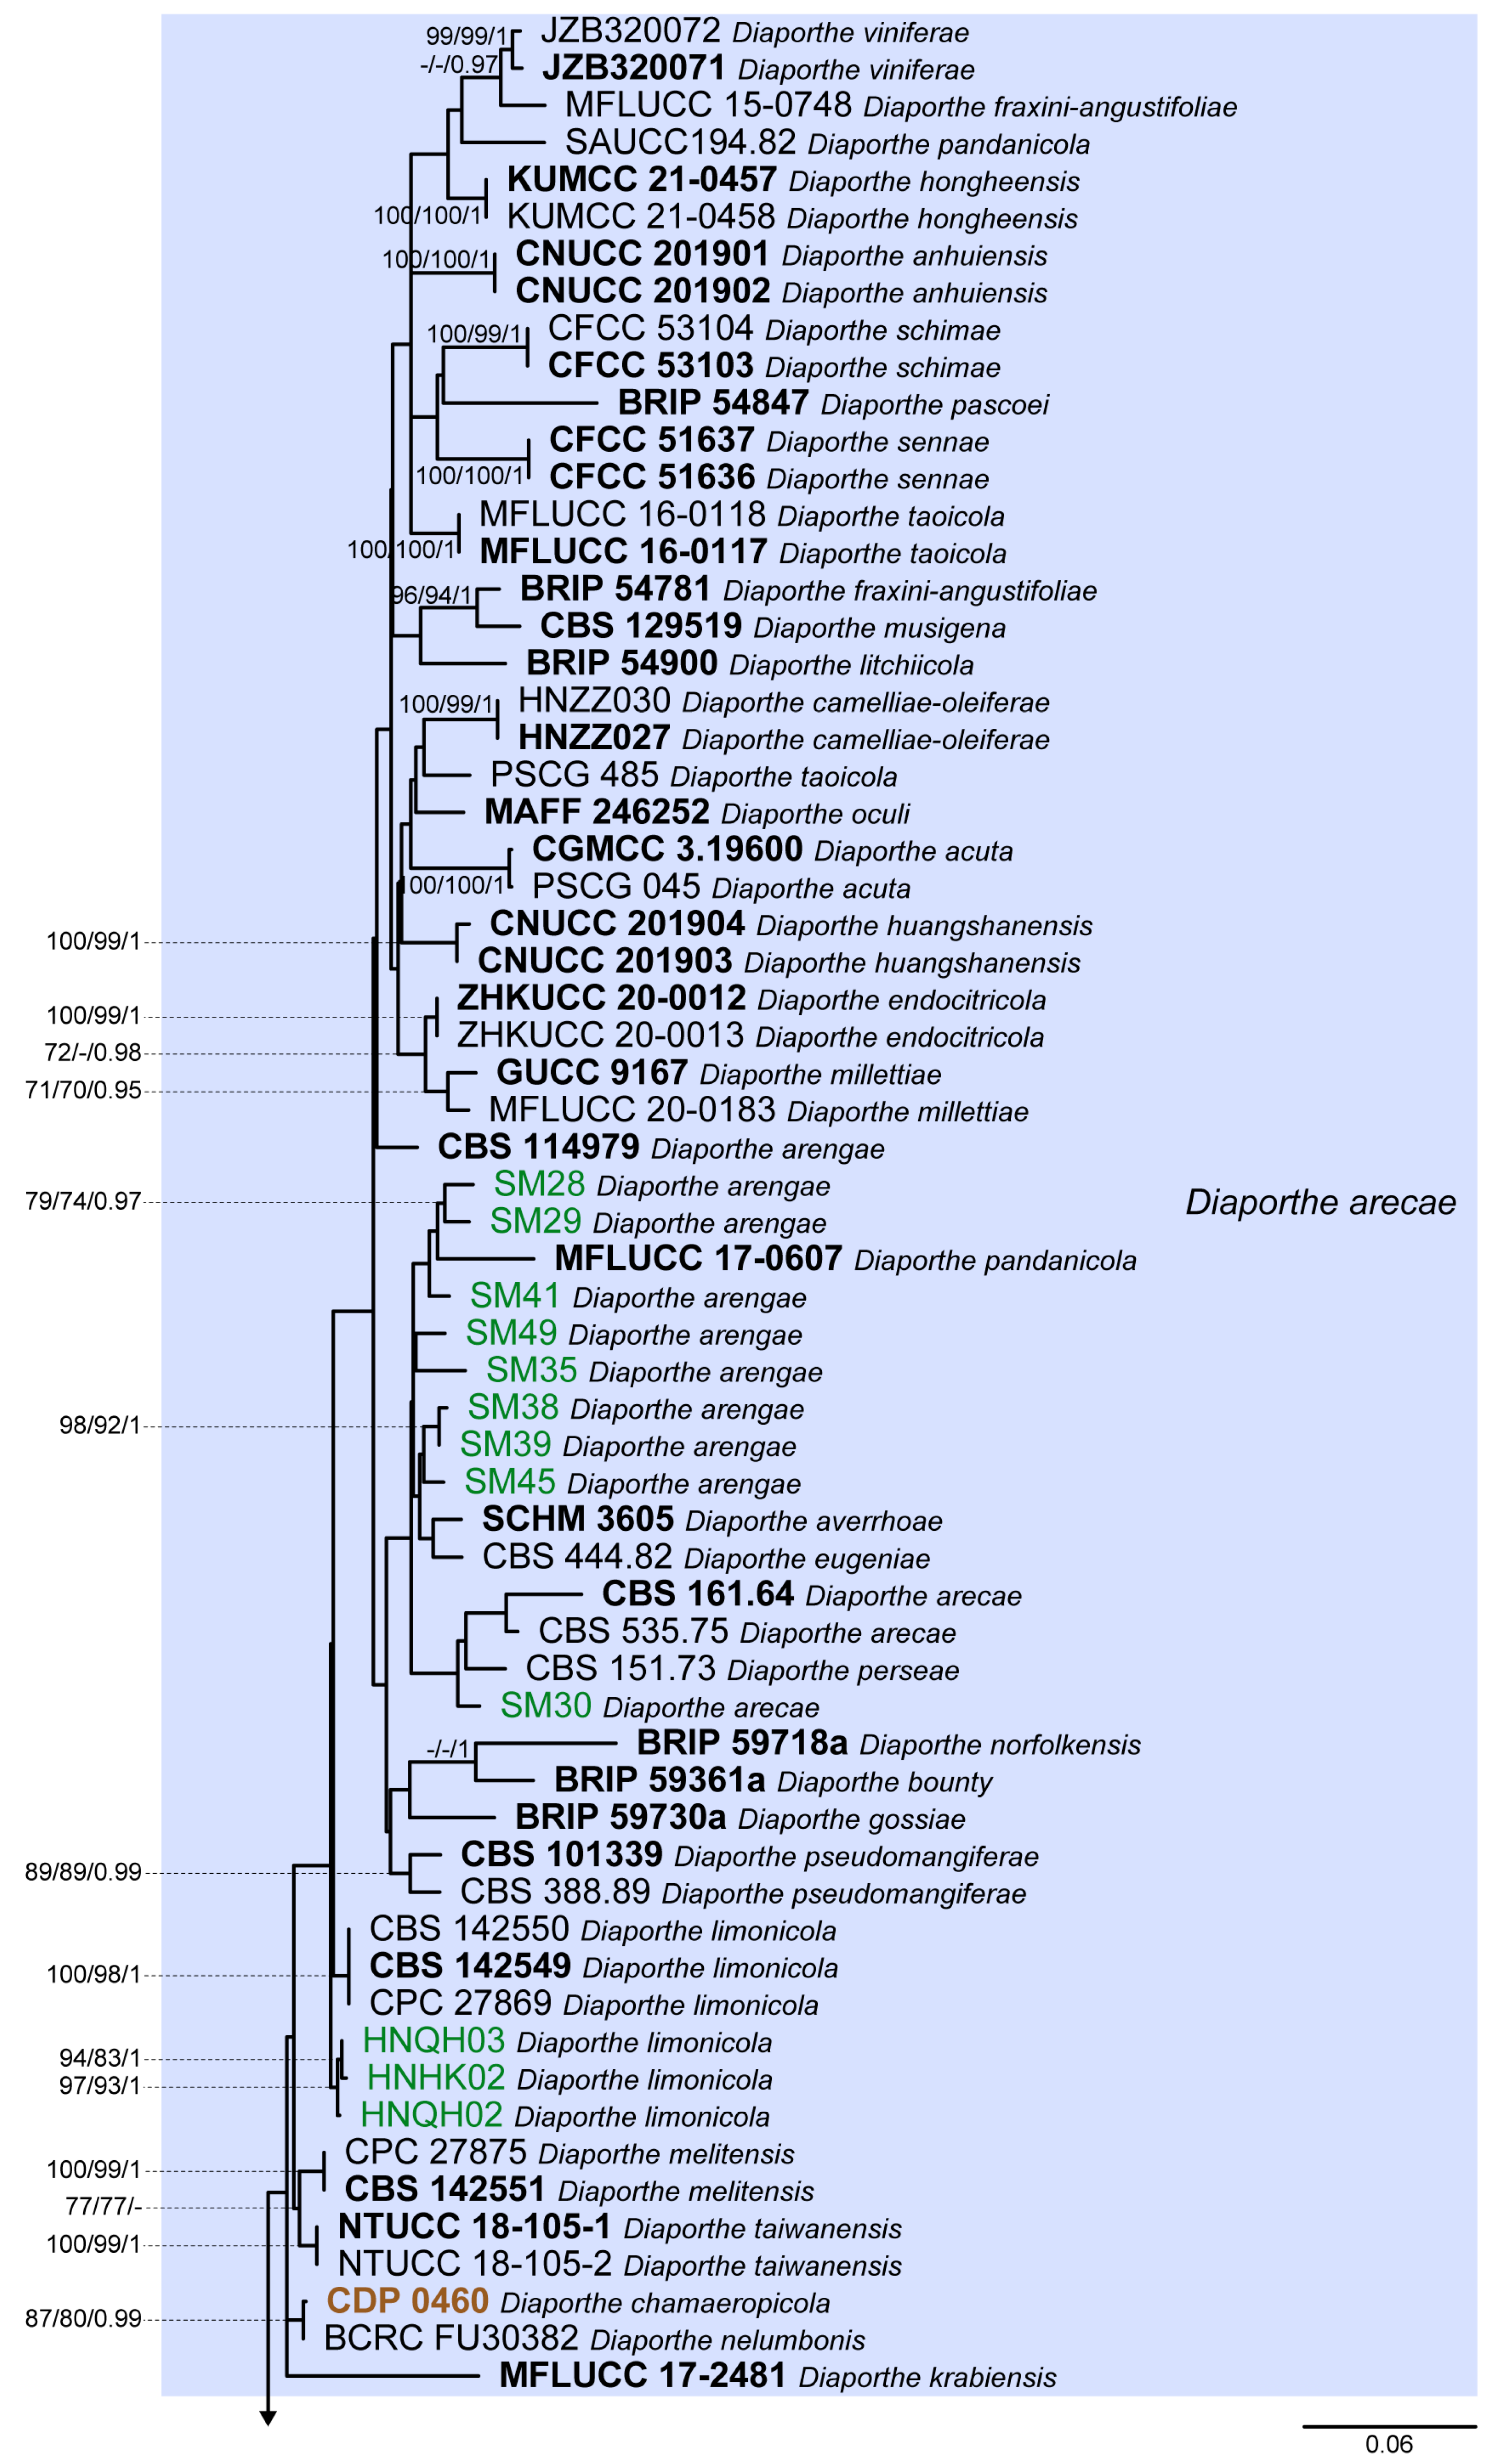
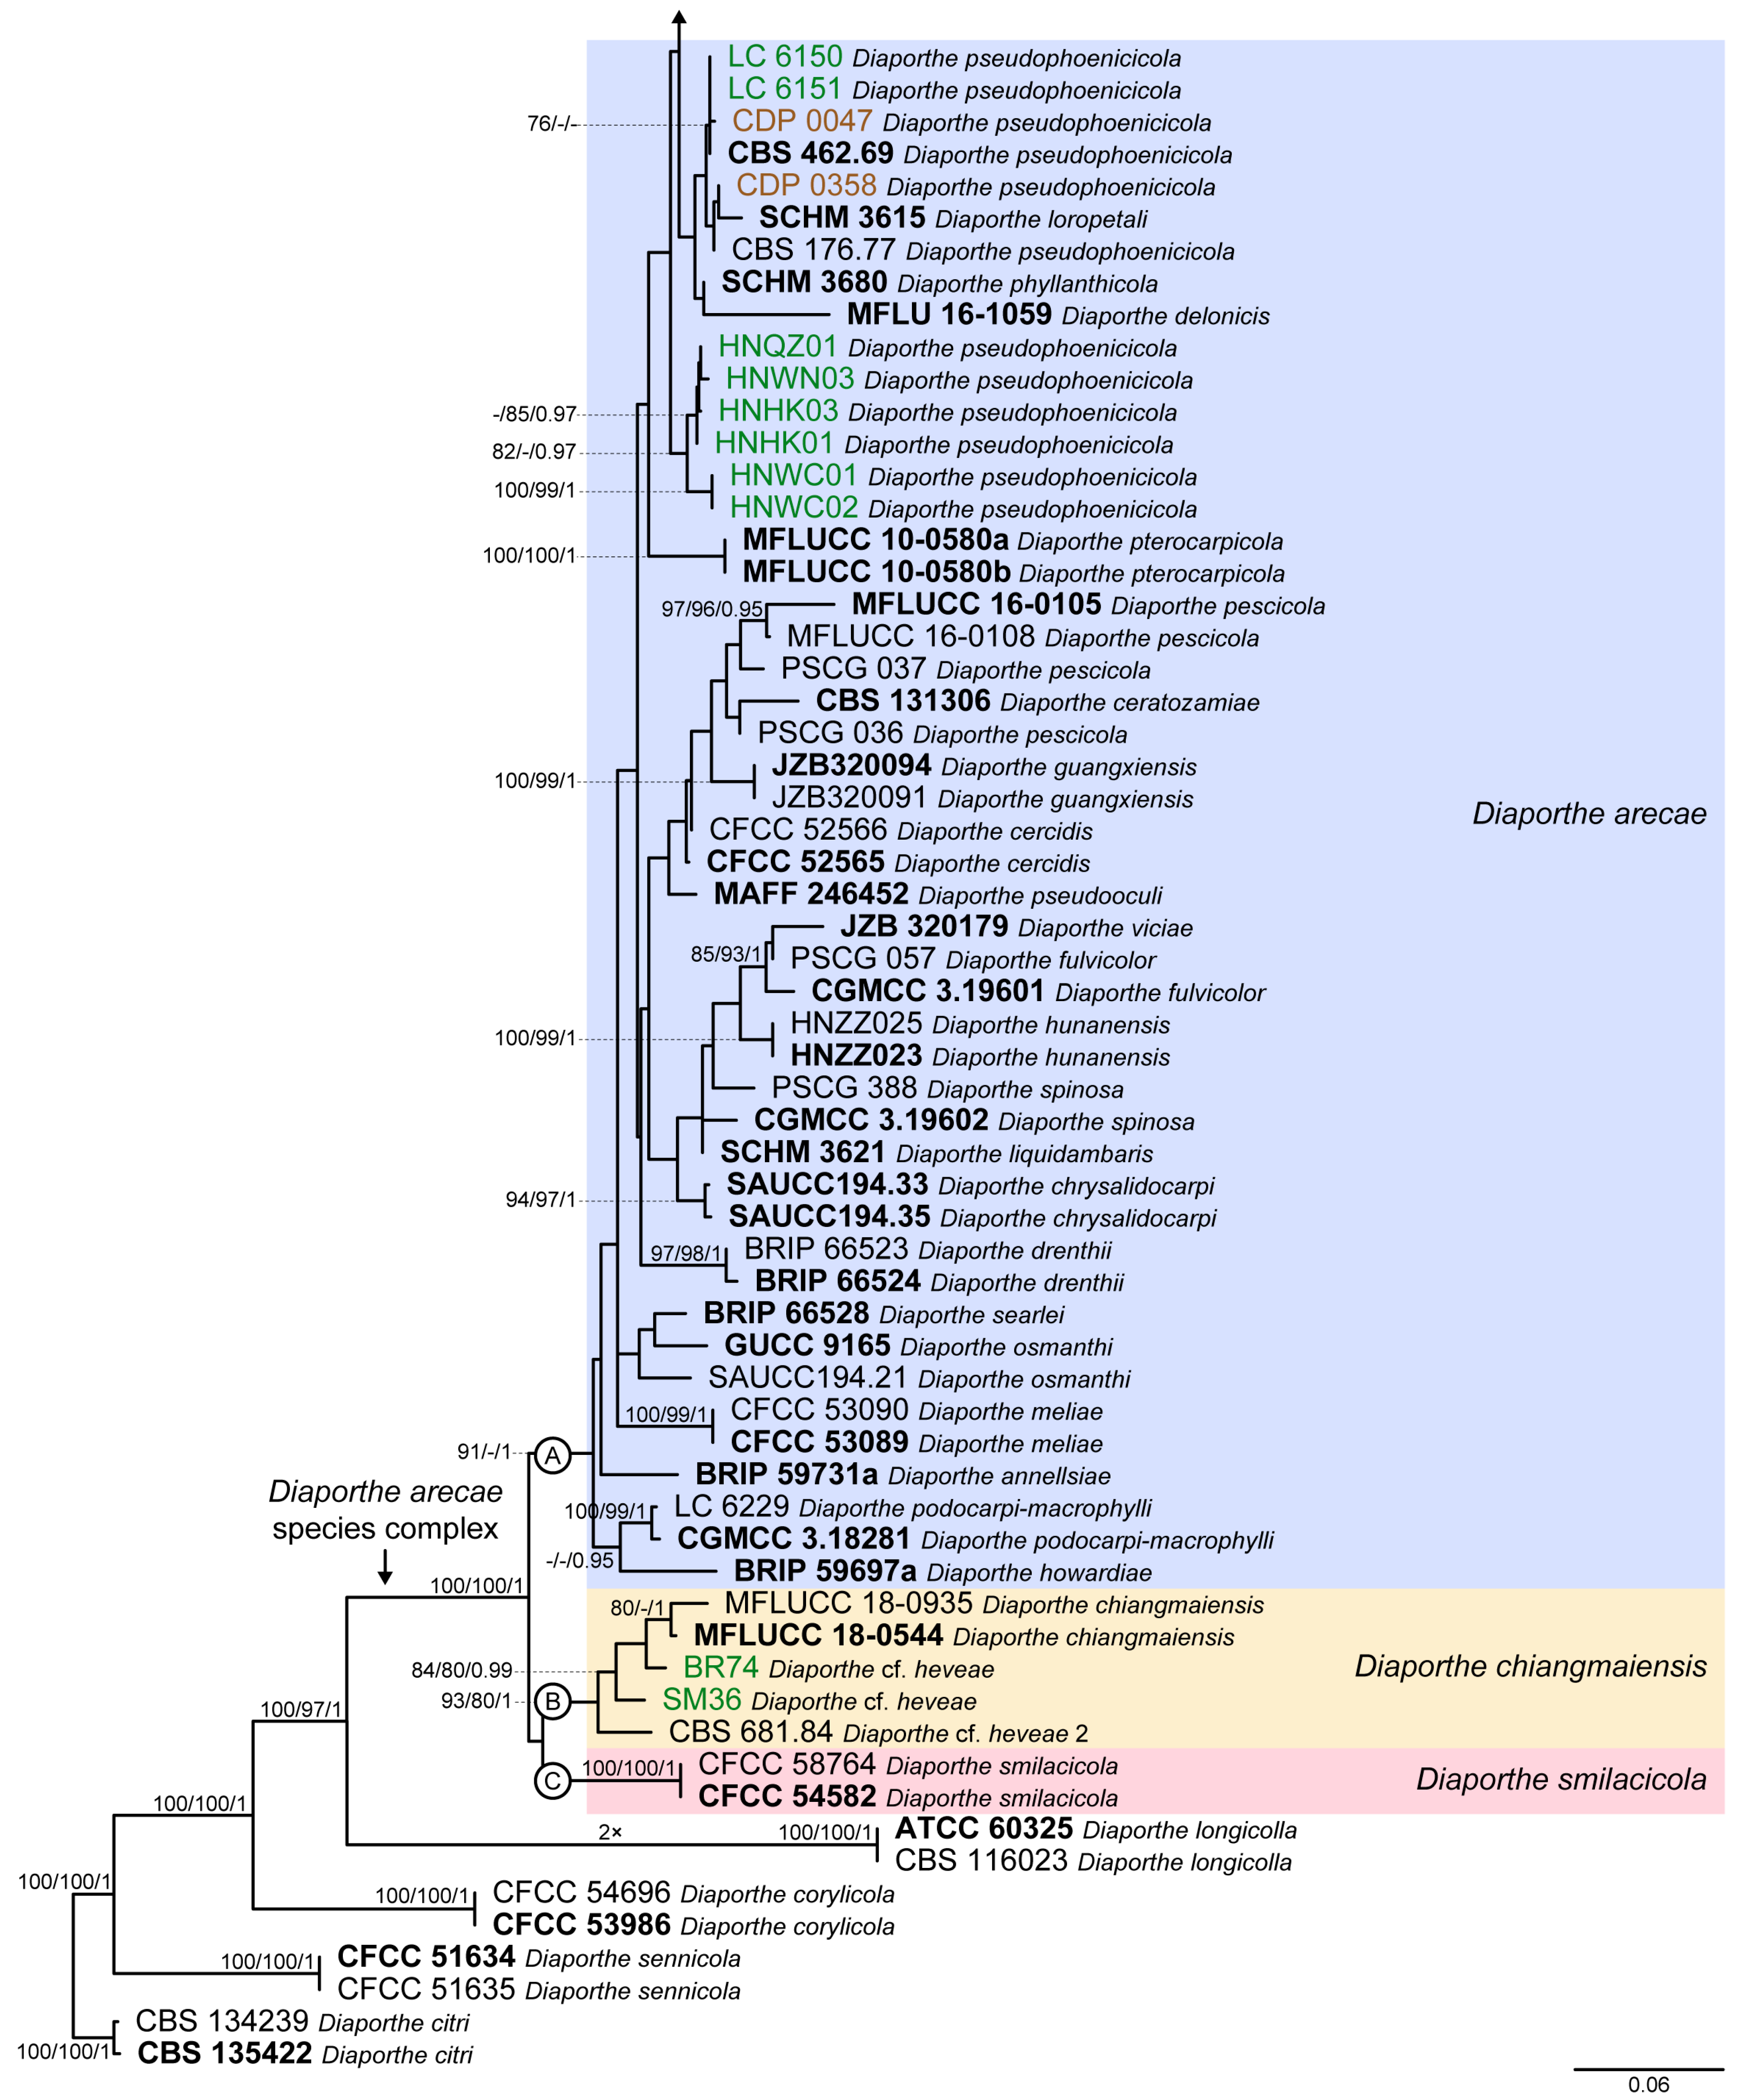
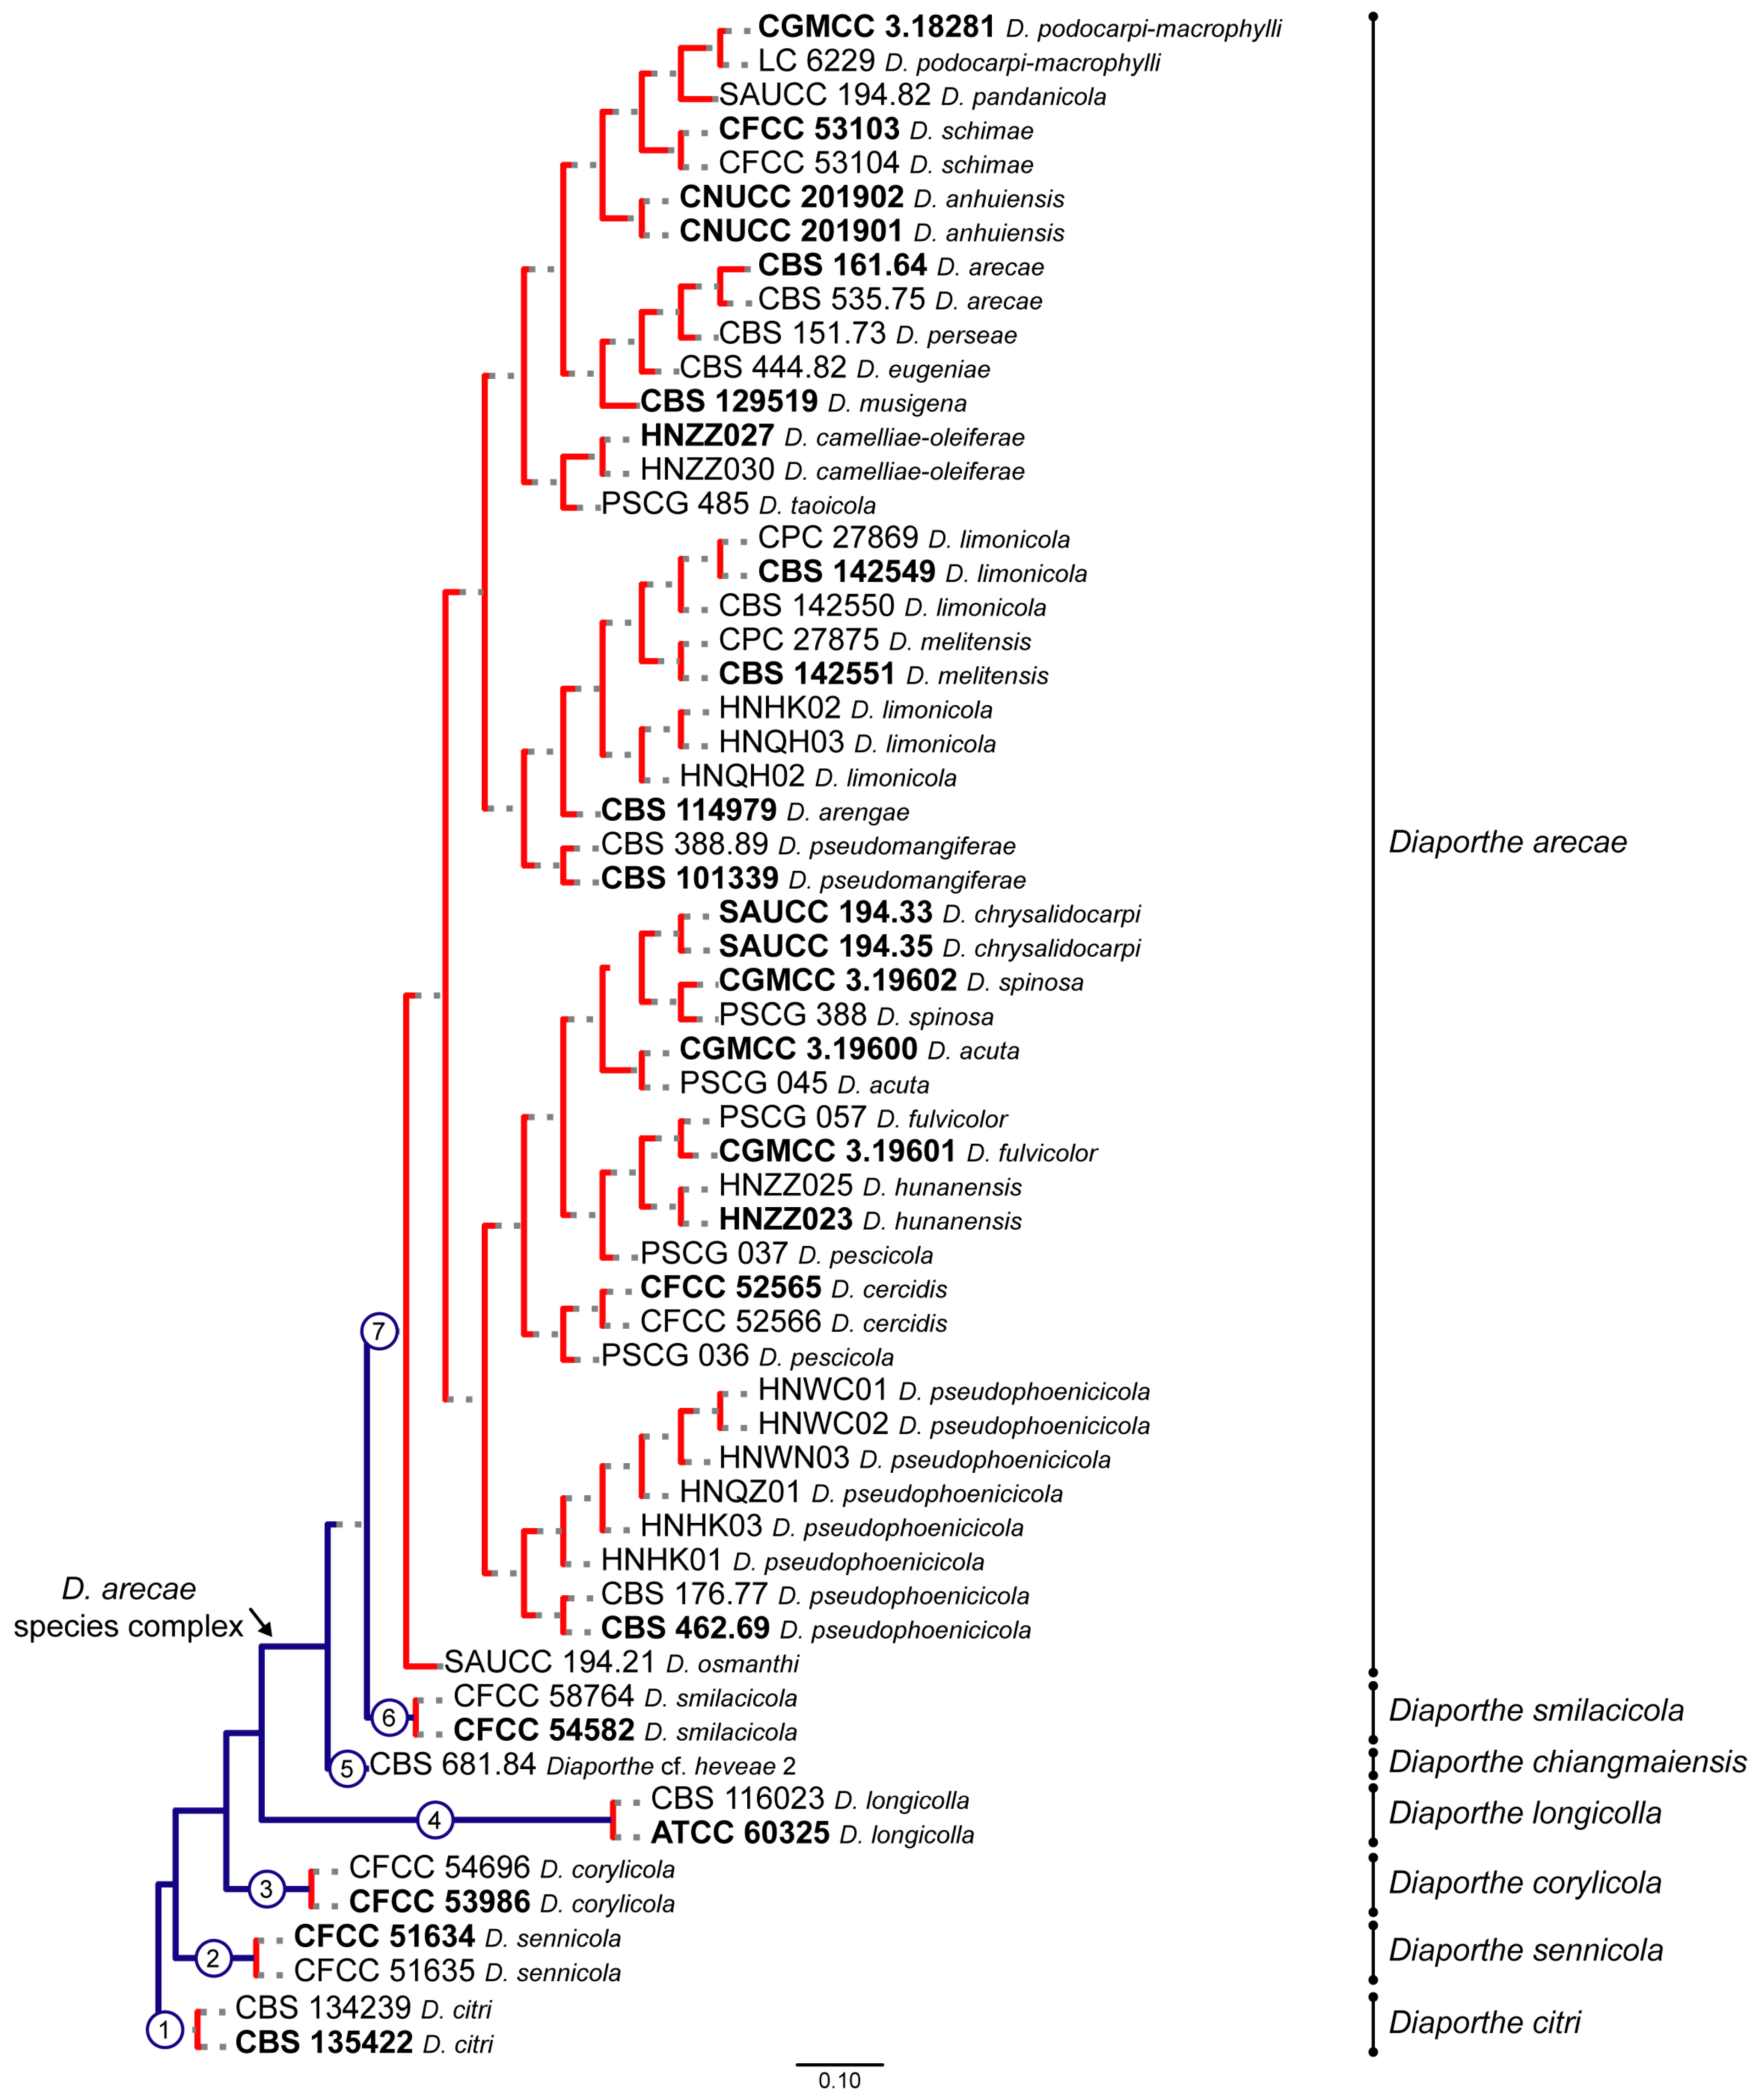
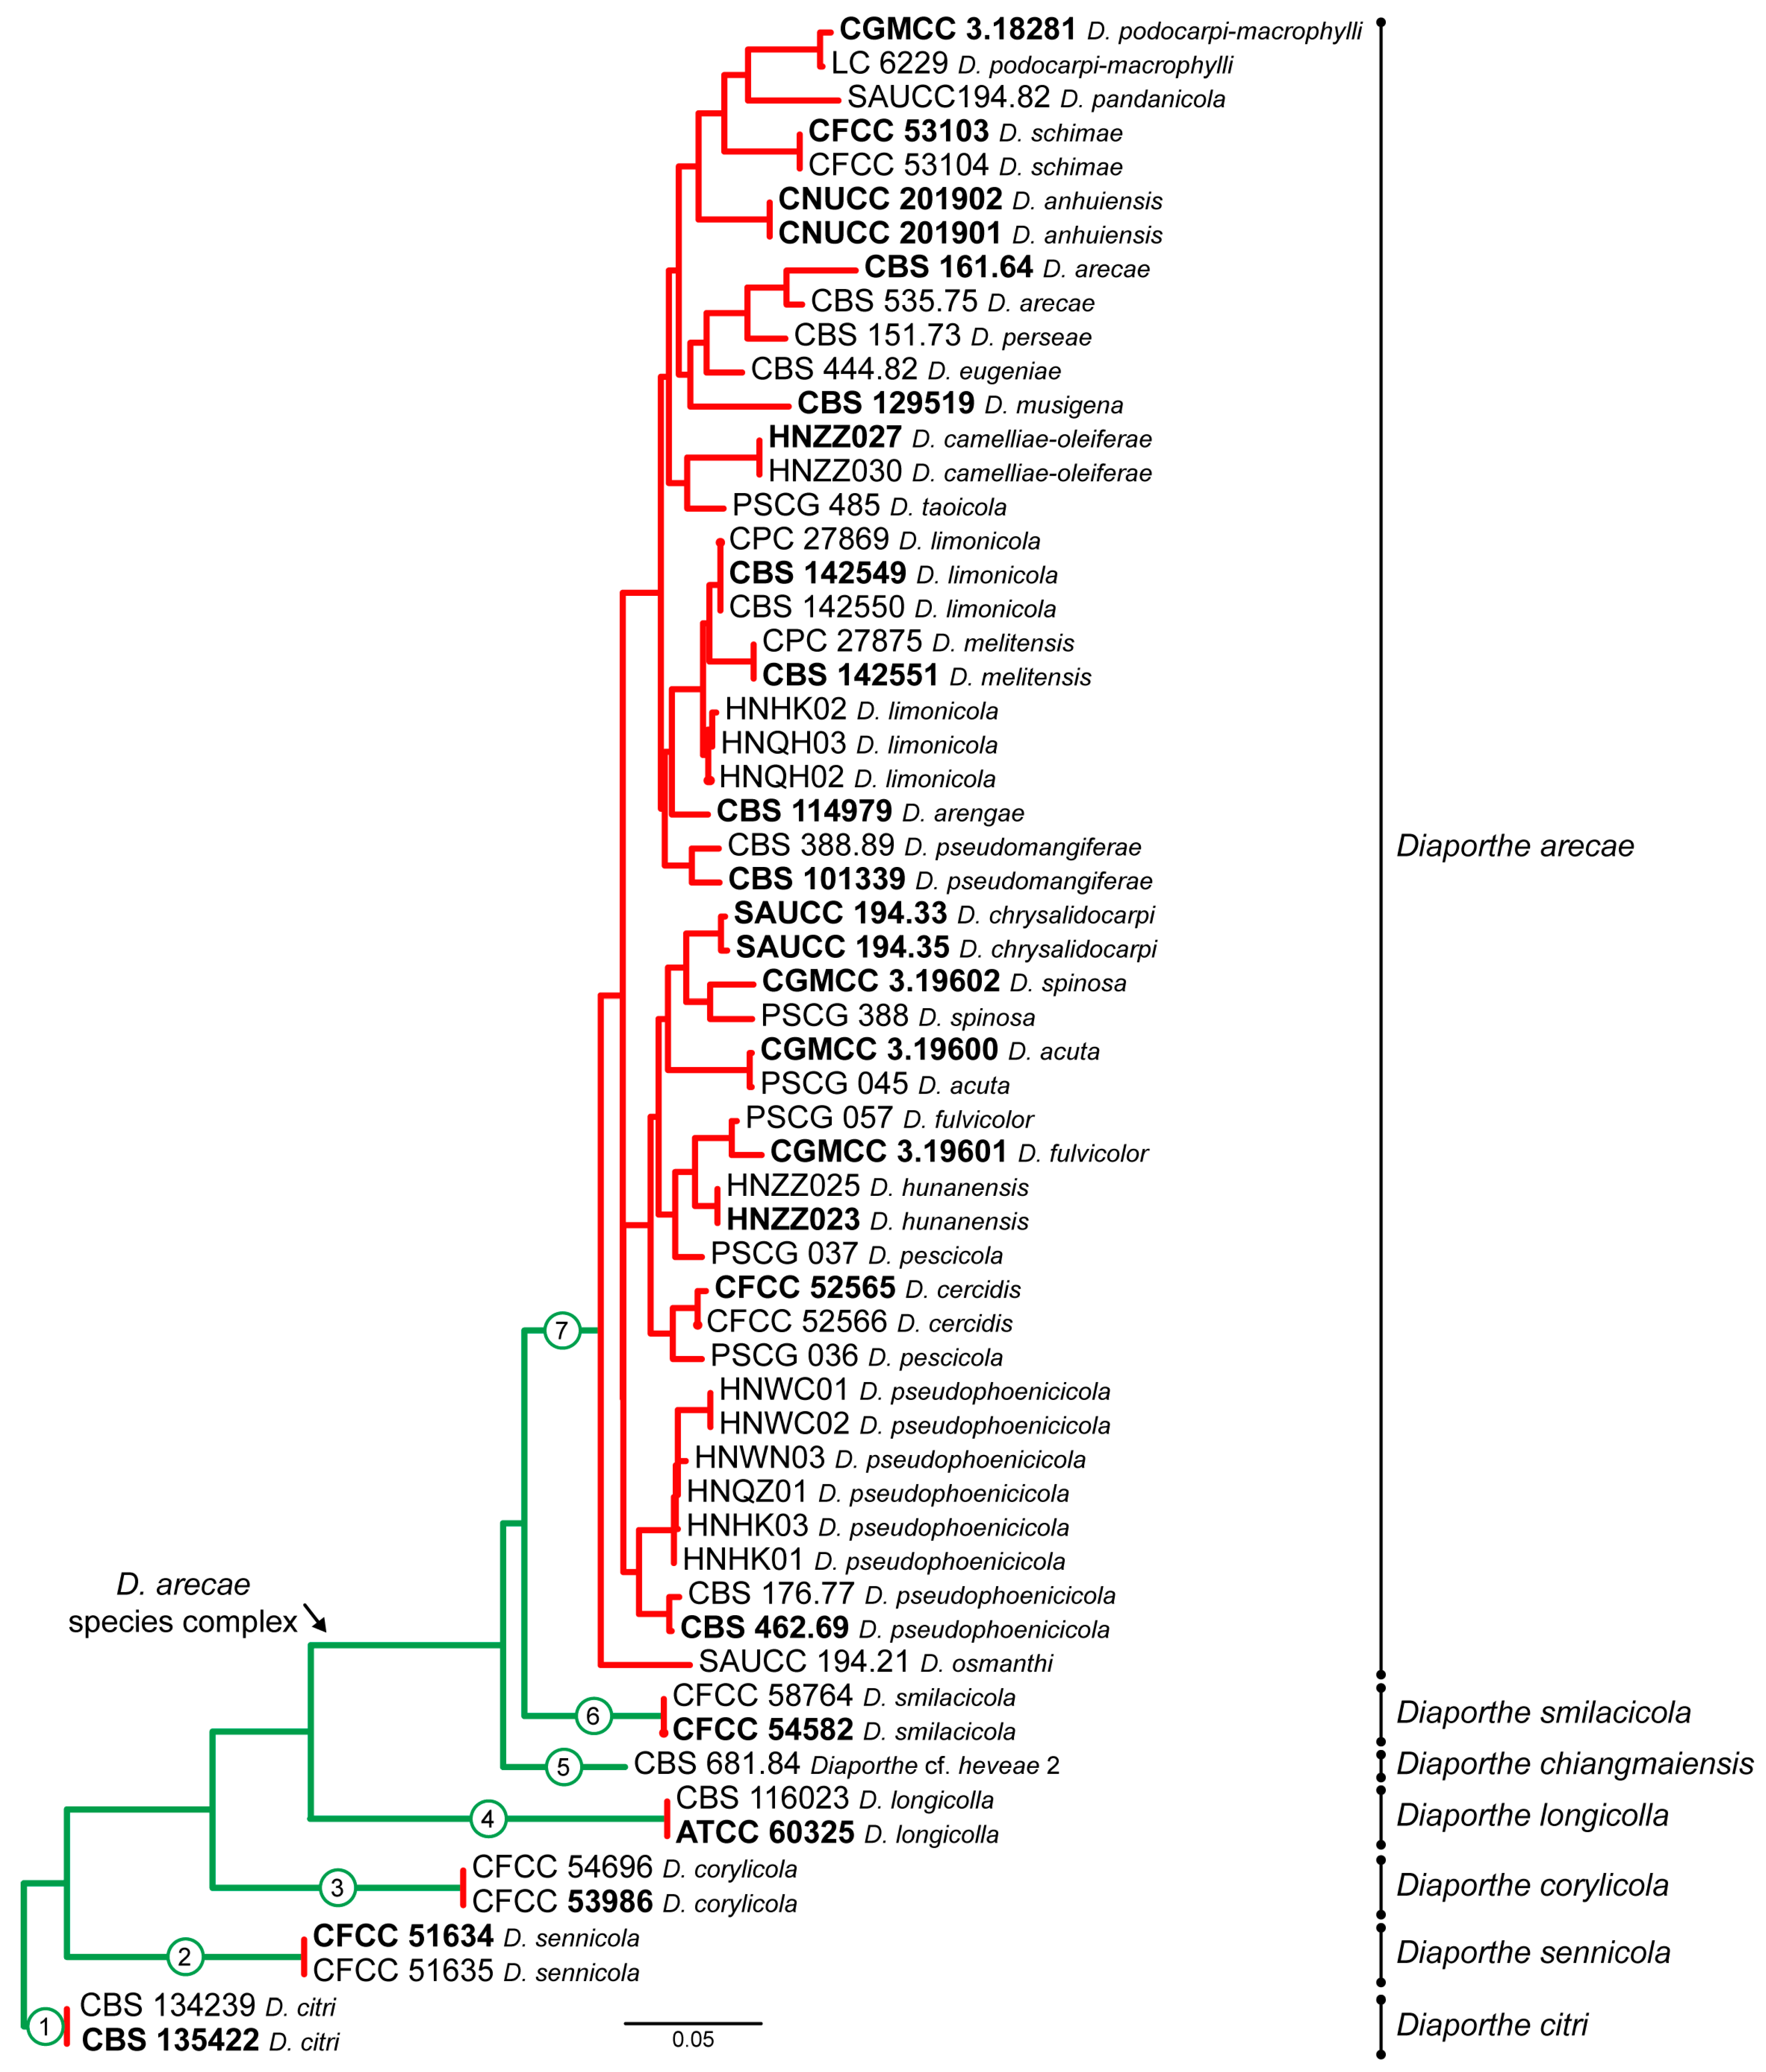
3.1. Preliminary Phylogenetic Analyses

One hundred twenty-seven isolates of Diaporthe species, either from this study or retrieved from GenBank, were included in the phylogenetic analyses (Table 1). The partition homogeneity test for the concatenated alignment resulted in a low p-value (p = 0.01), indicating that the genes are unsuitable to be combined. Nevertheless, despite the observed incongruences, multilocus analyses were conducted based on the five loci. The ITS, tef1, tub2, cal and his3 alignment of 119 ingroup and eight outgroup taxa comprised 2124 characters (including alignment gaps) (490 characters for ITS, 341 characters for tef1, 376 characters for tub2, 461 characters for cal and 456 characters for his3).
Tree topologies resulting from ML, MP and BA inferences were similar, presenting roughly the same well-resolved clades for each species included in the analyses, mostly supported by high maximum likelihood and maximum parsimony bootstrap support values (ML-BS/MP-BS ≥ 70%) and high Bayesian posterior probabilities values (PP ≥ 0.90). The ML tree is shown in Figure 1 with ML-BS/MP-BS/PP values at the nodes.
The final likelihood score for the best scoring ML tree was –15,929.918209. The matrix had 862 distinct alignment patterns, with 27.34% undetermined characters or gaps. Estimated base frequencies were as follows: A = 0.216757, C = 0.321740, G = 0.233831 and T = 0.227672; substitution rates AC = 1.397152, AG = 4.220434, AT = 1.064332, CG = 0.913406, CT = 5.405515 and GT = 1.000000; tree-length = 2.835210; gamma distribution shape parameter α = 0.494944; and proportion of invariable sites = 0.416215. BA inference had an average standard deviation of split frequencies (SDSF) and an average potential scale-reduction factor (PSRF) of 0.074169 and 1.012, respectively, after 10,000,000 generations, resulting in 1,500,002 trees being sampled.
Concerning MP analysis, of the 2124 characters, 1336 characters were constant (62.9%), and 107 variable characters were parsimony uninformative. MP analysis of the remaining 681 parsimony-informative characters (32.1%) resulted in 1000 equally parsimonious trees of 2447 steps with a moderate level of homoplasy as indicated by a CI of 0.449, HI of 0.551, RI of 0.750 and RC of 0.337. The topology of trees differed from one another only in the positions of the isolates within terminal groupings.
According to the phylogenetic analyses of the concatenated alignment (Figure 1), the three isolates from this study, obtained from foliar lesions of palms, clustered in a highly supported monophyletic clade (100% ML-BS/100% MP-BS/1 PP) containing 57 species, which is designated here as the D. arecae species complex (DASC). Moreover, three well-supported sister subclades were observed within the DASC, which were noted as subclades A, B and C (Figure 1). The three isolates from this study, along with 20 strains from palm tissues, clustered together in a subclade comprising 55 species with high ML-BS/PP support values (91%/1; subclade A). The remaining two strains from palm tissues clustered in a highly supported subclade (93% ML-BS/81% MP-BS/1 PP) together with D. chiangmaiensis (MFLUCC 18-0935 and MFLUCC 18-0544, ex-type) and the strain CBS 681.84 (“Diaporthe cf. heveae 2”) (subclade B). Subclade C corresponds to D. smilacicola (CFCC 54582, ex-type, and CFCC 58764), which form a highly supported branch (100% ML-BS/100% MP-BS/1 PP) in the DASC. The subclades A, B and C identified are here reported as three putative phylogenetic species—D. arecae, D. chiangmaiensis and D. smilacicola—and further analyses were conducted to validate their species boundaries.
The ML individual gene trees of the DASC comprising all available species for each locus (Figures S1–S5) also showed that the isolates from this study, along with other strains from palm tissues, clustered in a monophyletic clade with high ML-BS values (94%, 100%, 93%, 72% and 84% in ITS-, tef1-, tub2-, cal- and his3-phylogram, respectively). Thus, the DASC as defined in the present study was similarly observed in all individual gene genealogies. Nonetheless, tree topologies between the individual gene trees varied substantially and most of the internal nodes received low bootstrap support. Moreover, individual gene trees, except for the his3-phylogram, failed to clearly resolve the three subclades structure of the DASC as observed in the multilocus phylogenetic analyses (Figure 1 and Figures S1–S5). In general, tree topology of the his3-phylogram (Figure S5), and to a lesser extent of the cal-phylogram (Figure S4), were more similar to the phylogenetic analyses of the combined dataset. The multilocus phylogenetic analyses showed a better delimitation of the DASC when compared to the individual gene genealogies.

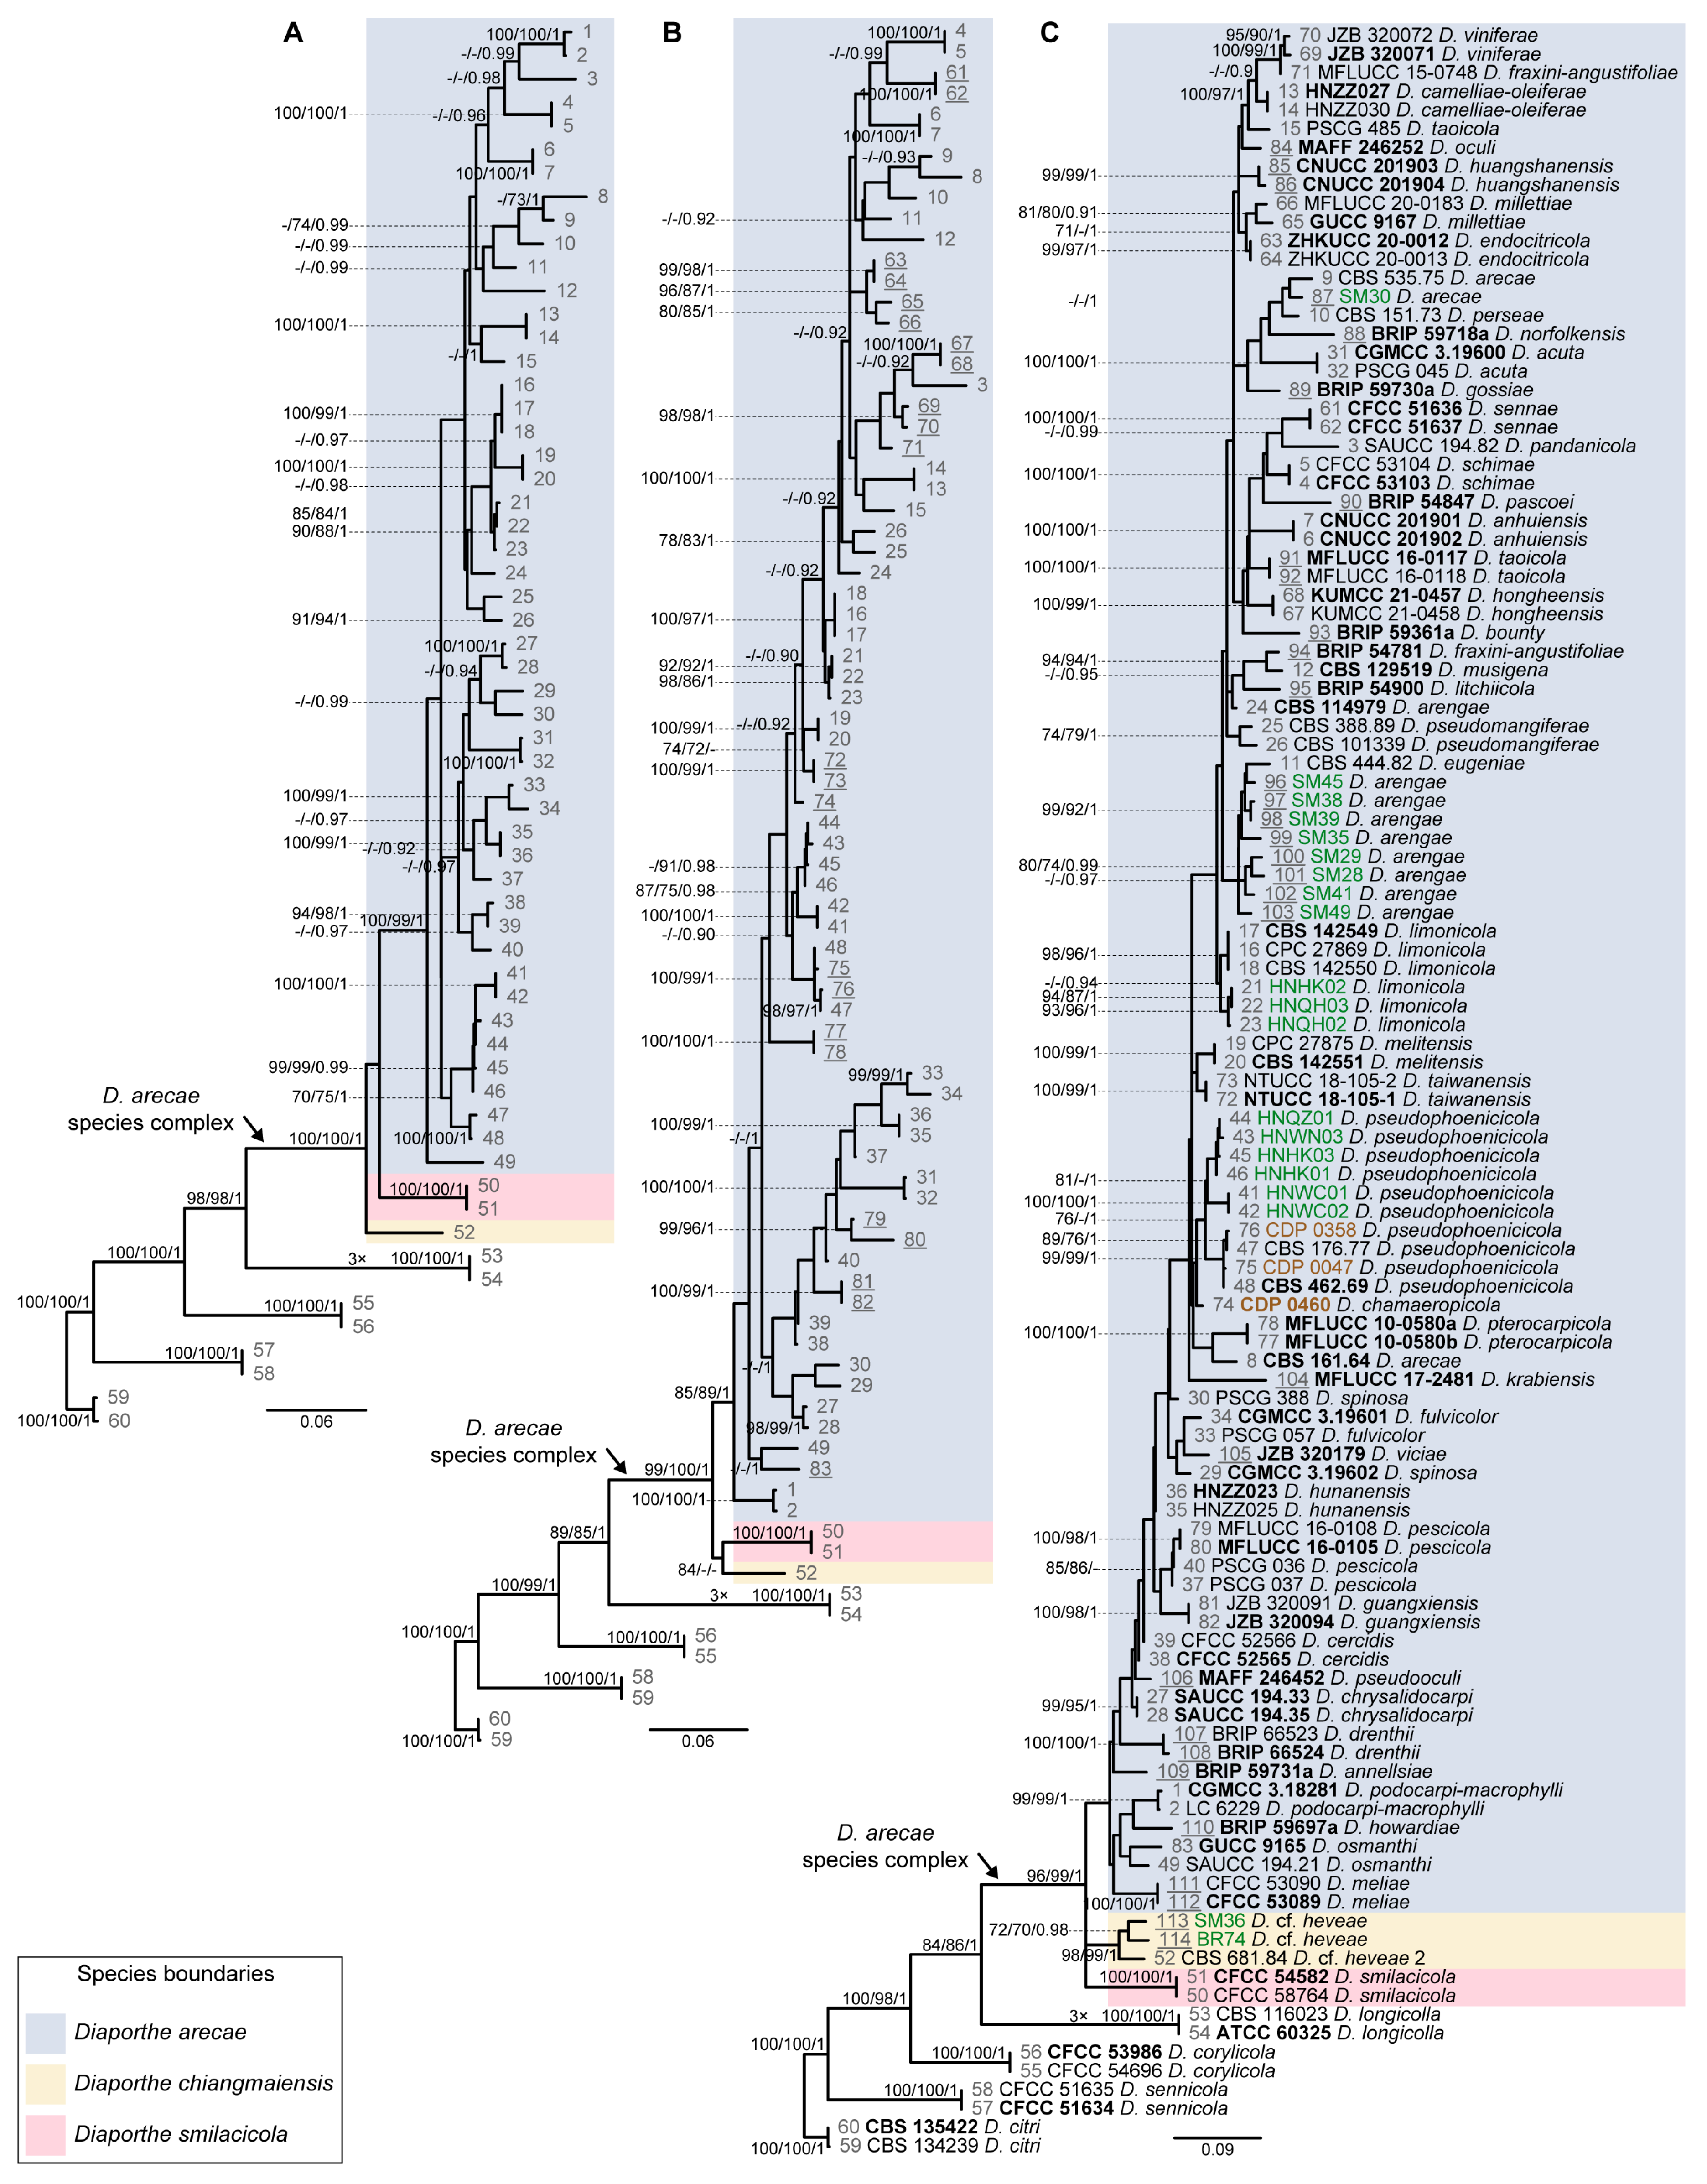
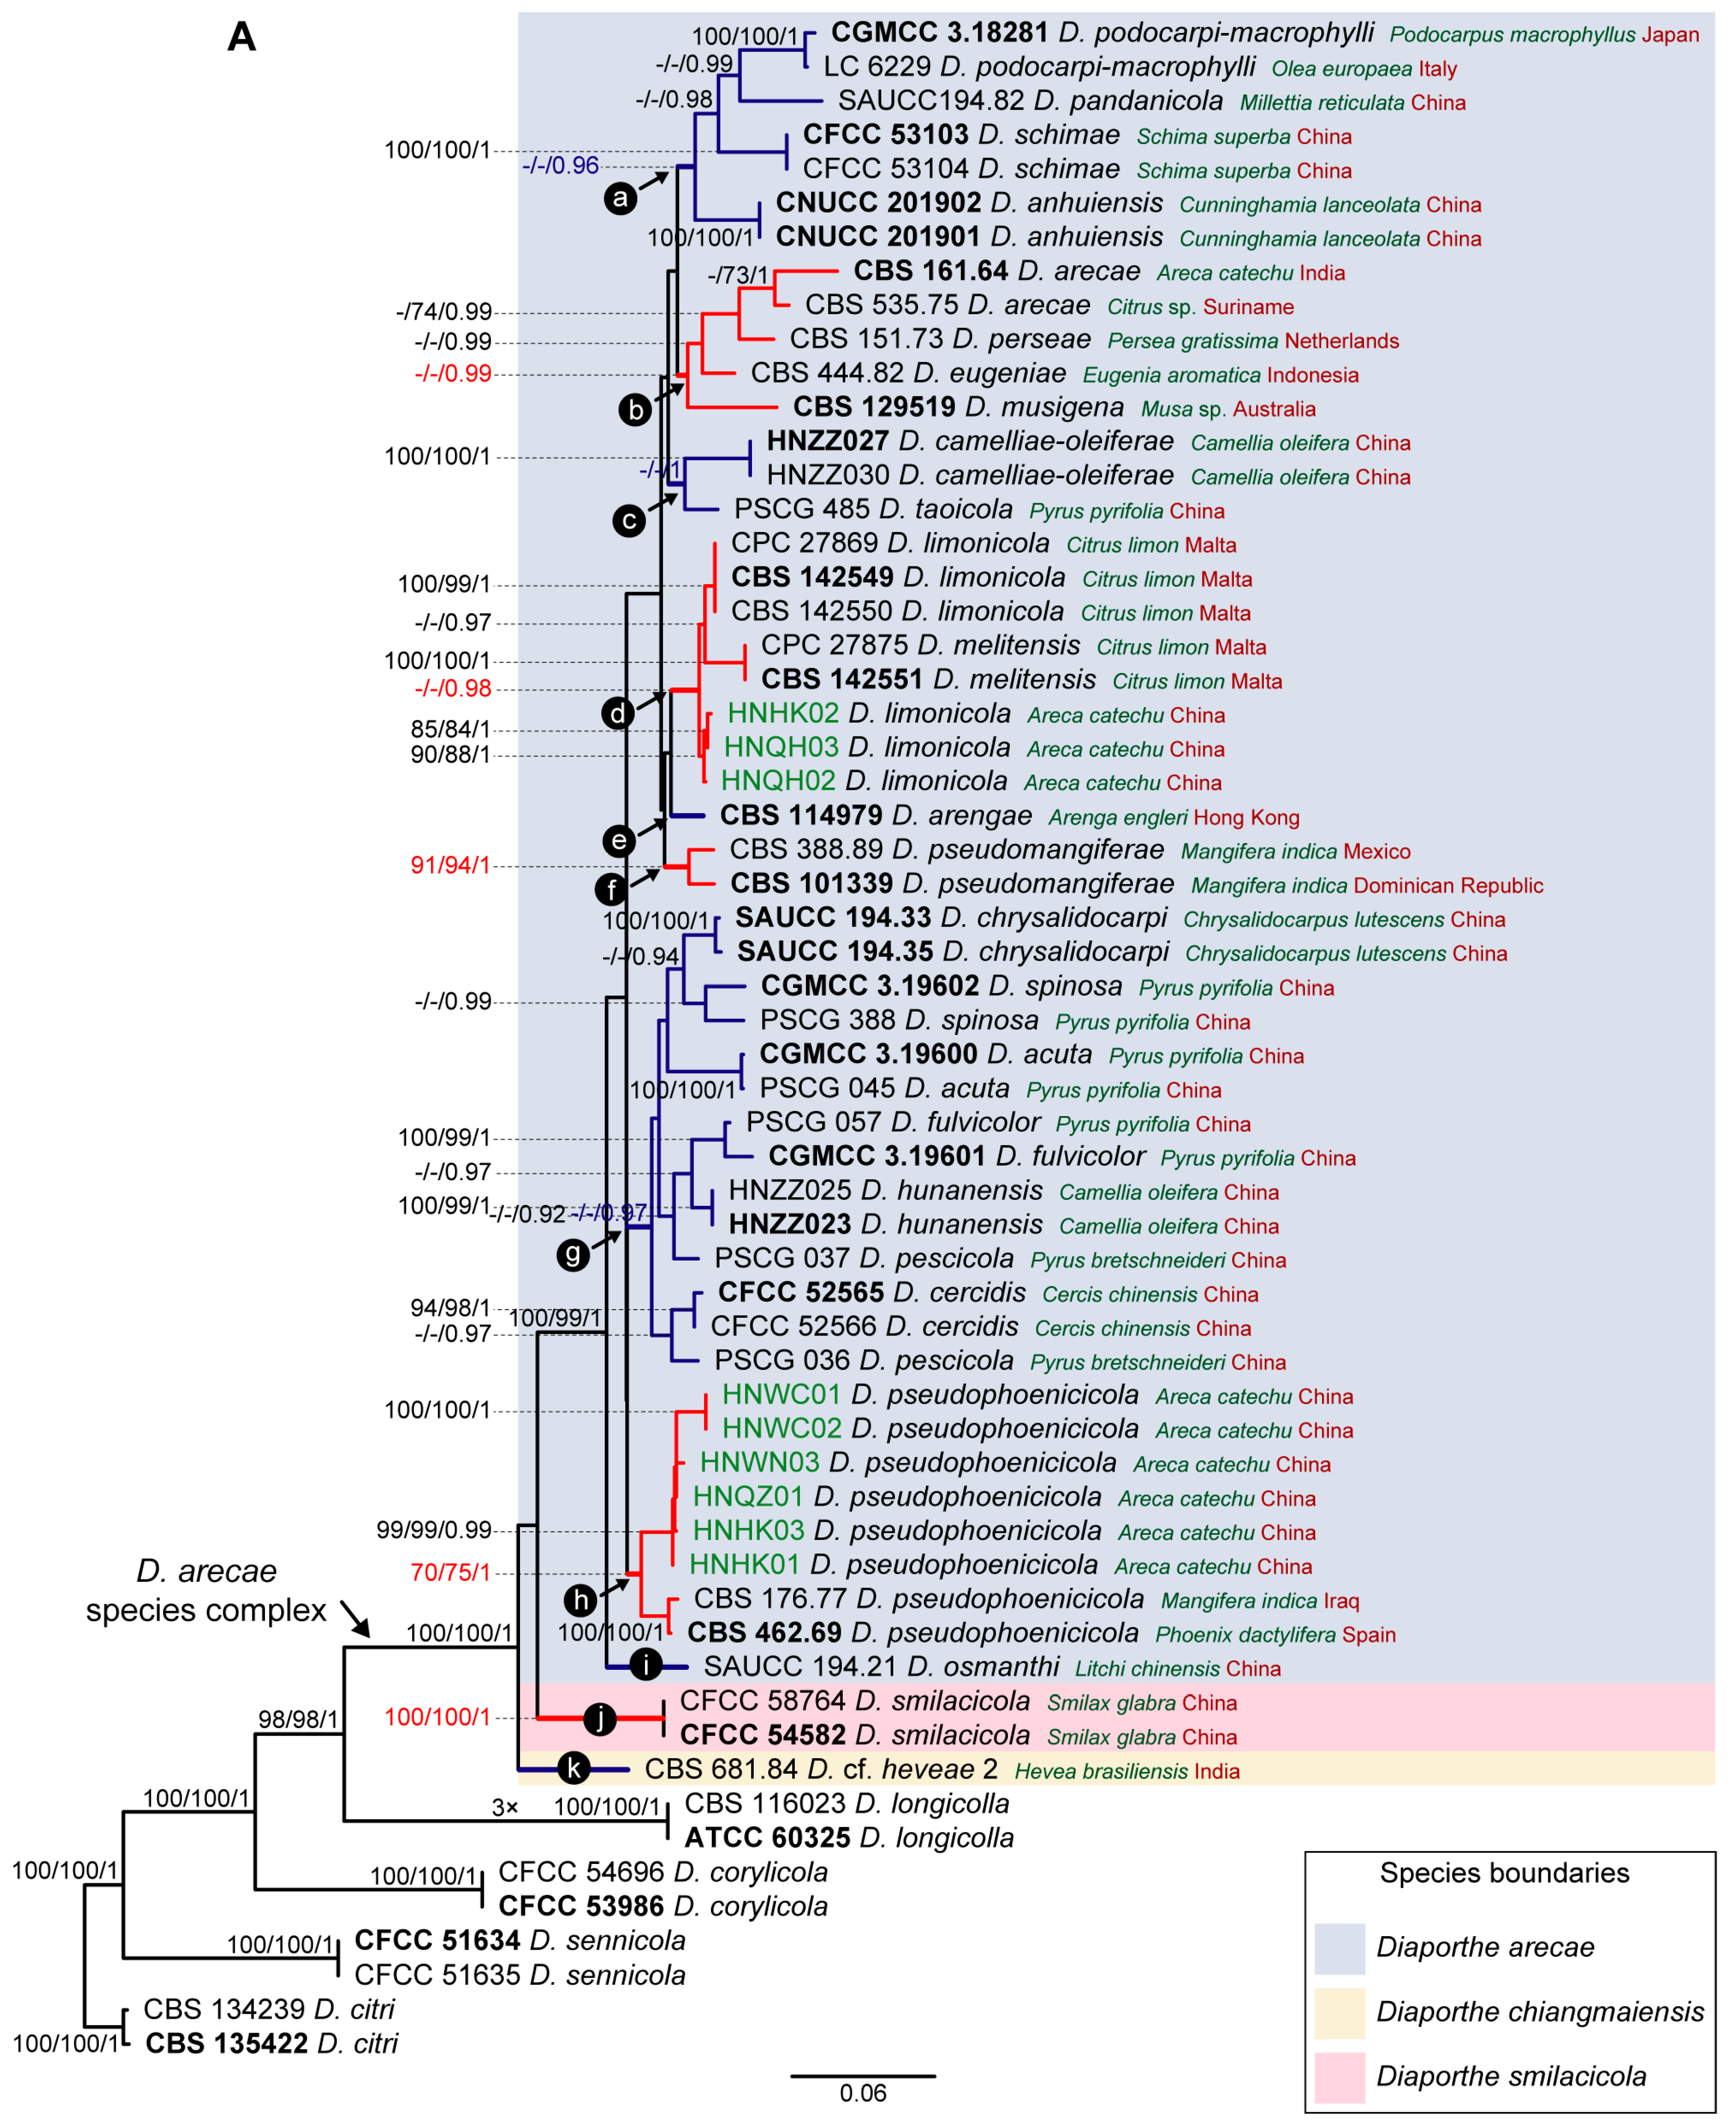
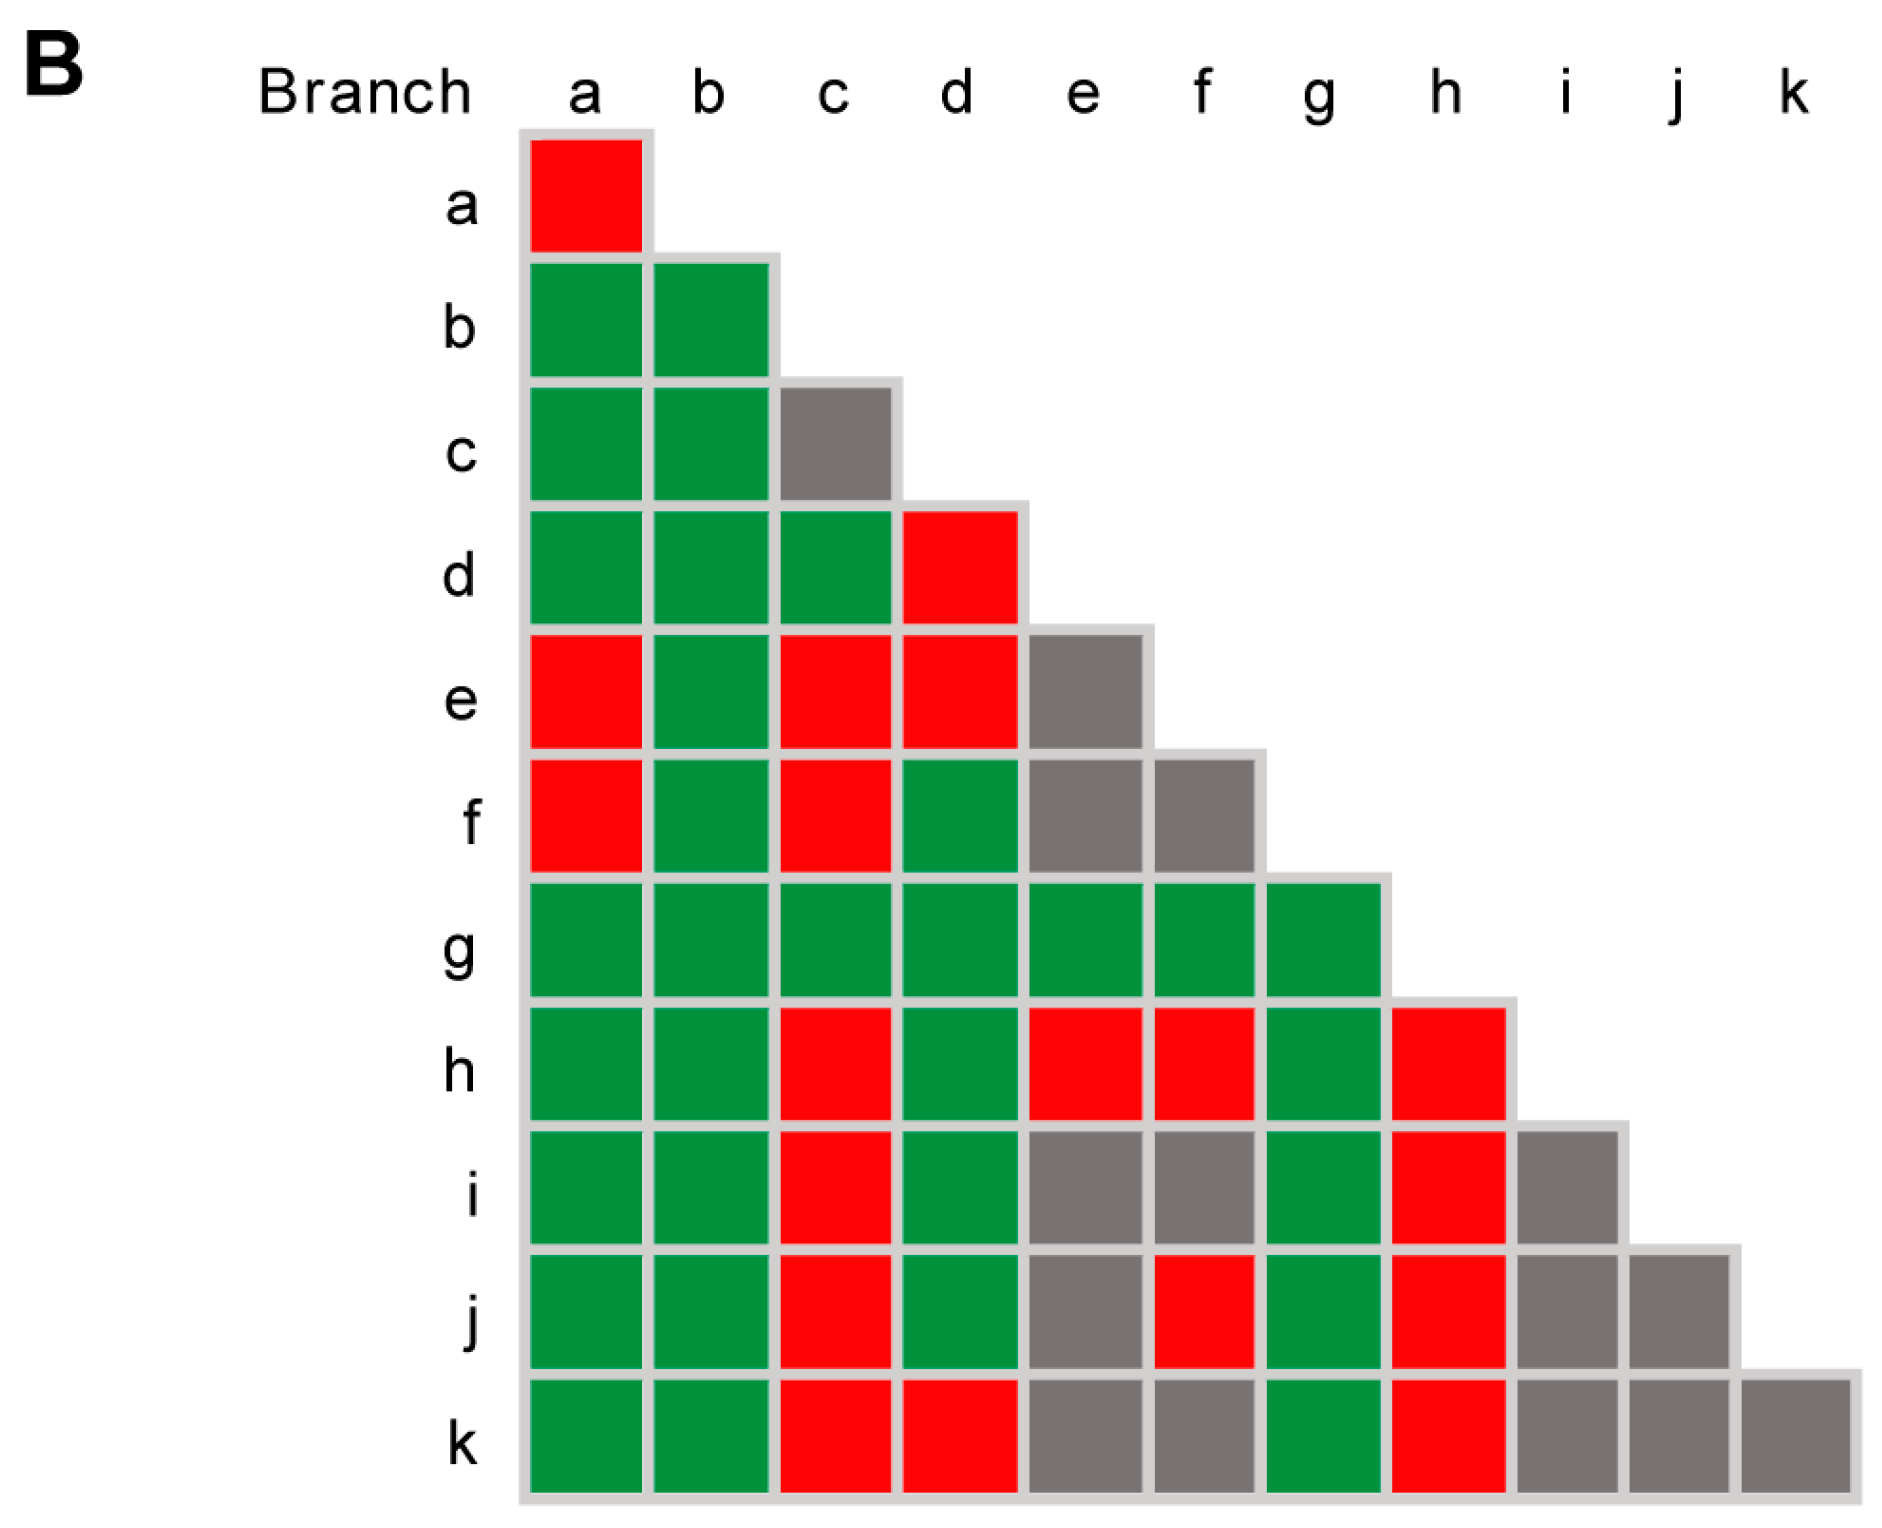
3.2. Species Delimitation Based on the GCPSR Principle

Although in the present study five loci were used to infer the phylogenetic relationships among taxa within the DASC, many taxa were missing sequences of his3 and cal loci (Table 1). These loci were not available for 62 (49%) and 44 (35%) strains, respectively, out of the 127 taxa included in the analyses, while only nine (7%) strains did not have sequences of tub2 and/or tef1 loci.
Given the lack of cal and his3 sequences for several species of the DASC, multilocus phylogenetic analyses were also conducted based on combined datasets of five (ITS, tef1, tub2, his3 and cal), four (ITS, tef1, tub2 and cal) and three loci (ITS, tef1 and tub2) to properly aid conclusions about the species for which those loci were missing on the primary combined dataset phylogenetic analyses (Figure 1). Thus, each analysis included only the species whose respective loci were available. The partition homogeneity test for the five-, four- and three-loci concatenated alignments resulted in low p-values (p = 0.01), indicating that the genes are unsuitable to be combined. Nevertheless, despite the observed incongruences, multilocus ML, BA and MP phylogenetic inferences were conducted for the five-, four- and three-loci combined datasets, and the resulting trees were compared. The ML trees are shown in Figure 2 with ML-BS/MP-BS/PP values at the nodes. Moreover, the single gene genealogies corresponding to each combined dataset were analyzed separately using ML and MP inferences. Tree topologies (Figures S6–S8) were also compared to evaluate phylogenetic congruencies in the DASC through the implementation of the GCPSR principle. Statistics for the different datasets and respective phylogenetic trees are summarized in Table 2.
The combined datasets of five, four and three loci included 52, 75 and 106 ingroup, and eight outgroup taxa and comprised 2124, 1668 and 1207 characters (including alignment gaps), respectively (Table 2). The ML, MP and BI inferences for each combined dataset resulted in topologically similar trees. All three combined datasets produced trees with a similar backbone structure (Figure 2), which was also similar to that obtained for the primary combined dataset phylogenies (Figure 1). Overall, a highly supported monophyletic clade corresponding to the DASC was obtained on the five- (100% ML-BS/100% MP-BS/1 PP) (Figure 2A), four- (99% ML-BS/100% MP-BS/1 PP) (Figure 2B) and three-loci phylogram (96% ML-BS/99% MP-BS/1 PP) (Figure 2C), each presenting the three monophyletic subclades as noted for the primary combined dataset phylogenies (Figure 1). Therefore, tree topologies resulting from the five-, four- and three-loci combined datasets were congruent and recognized three putative phylogenetic species within the DASC, namely D. arecae, D. smilacicola and a clade comprising the strains identified as “Diaporthe cf. heveae” (Figure 2).
Although “Diaporthe cf. heveae” strains have been putatively recognized as D. chiangmaiensis in the primary combined dataset phylogenies (Figure 1), no partial tub2, cal and his3 sequence data were available for D. chiangmaiensis (MFLUCC 18-0935 and MFLUCC 18-0544, ex-type). Therefore, these two strains were excluded from all three combined dataset analyses. Since only ITS and tef1 sequence data were available for the above-mentioned strains of D. chiangmaiensis, a multilocus ML phylogenetic analysis was conducted for all the taxa for which those two loci were available to aid conclusions regarding the relationship between D. chiangmaiensis and “Diaporthe cf. heveae”. The tree obtained presented a highly supported monophyletic clade (98% ML-BS) with three well-supported sister subclades, confirming the predictions of all previous phylograms constructed. Moreover, the D. chiangmaiensis strains MFLUCC 18-0544 (ex-type) and MFLUCC 18-0935 clustered with the “Diaporthe cf. heveae” strains with high ML-BS support (99%), similar to what was obtained in the primary combined dataset phylogenies (Figure 1).
According to the inferences based on the combined datasets of four and three loci, isolates from this study clustered in the D. arecae subclade, together with other strains isolated from palm tissues (Figure 2B,C). The combined phylogenetic analyses suggested that the D. arecae subclade may putatively represent a single species sister to D. smilacicola and D. chiangmaiensis. Most independent evolutionary branches within the D. arecae subclade showed a low or complete lack of support values and only terminal branches for some of the species clustered in highly supported clades (Figure 1 and Figure 2).
To understand the boundaries of the DASC, the GCPSR principle was followed, and the individual ML and MP gene trees produced for each of the combined datasets were compared to identify concordant branches. All individual ML and MP gene trees were topologically similar, presenting the same well-delimited clades. However, this analysis also revealed conflicts between the individual phylogenies, with incongruent branches and most nodes lacking phylogenetic support (Figures S6–S8). Considering the individual phylogenies corresponding to the five-loci combined dataset (Figure S6), it is evident that isolates from the same species cluster in different clades depending on the individual gene tree. For instance, two isolates of D. arecae, including the ex-isotype strain CBS 161.64, are phylogenetically distant in the ITS phylogram (Figure S6A), while they group together in the remaining individual phylograms (Figure S6B–E). Likewise, two isolates of D. pseudomangiferae, including the ex-type strain CBS 101339, are paraphyletic in the tef1 and cal phylogram (Figure S6B,D), but cluster together in a highly supported monophyletic branch in the remaining individual phylogenies (Figure S6A,C,E). Moreover, the relationships between different species are highly discordant among the individual phylogenies. For example, while D. melitensis is phylogenetically indistinguishable from D. limonicola in the tef1, cal and his3 phylograms (Figure S6B,D,E), they are phylogenetically distant in both ITS and tub2 individual phylogenies (Figure S6A,C). Moreover, D. perseae, D. eugeniae and D. musigena are closely related to D. arecae in the tef1 phylogram (Figure S6B), but are distributed throughout the remaining individual phylograms, clustering with other species (Figure S6A,C–E). A similar pattern of incongruencies was observed for the individual phylogenies corresponding to the combined datasets of four and three loci (Figures S7 and S8). In both cases, the greater the number of taxa included in the analyses, the greater the inconsistencies between the individual phylogenies. For instance, D. viniferae clusters in a highly supported monophyletic clade in the ITS and tub2 phylogram (Figures S7A,C and S8A,C), while it is phylogenetically indistinguishable from D. guangxiensis, D. camelliae-oleiferae (Figure S7B) and D. viciae (Figure S8B) in the tef1 phylogram and from D. guangxiensis and D. cercidis in the cal phylogram (Figure S7D).
Following the GCPSR principle, based on the comparison of individual gene genealogies, it was verified that the node delimiting the transition from concordant branches to incongruencies corresponds to the DASC (Figure 2). Contrarily, individual gene trees are concordant regarding the four well-delimited species (D. citri, D. corylicola, D. longicolla and D. sennicola) included as outgroup taxa, and represented by highly supported monophyletic clades (Figures S6–S8). This provides solid evidence that these clades represent different species as opposite to the different species included in the DASC.
To further resolve the putative phylogenetic species previously recognized as three distinct well-supported subclades within the DASC (Figure 1 and Figure 2), an operational framework to identify independent evolutionary lineages (IEL) was applied. Due to the presence of discordant nodes, conflicting branches and a lack of phylogenetic support between taxa of the D. arecae subclade among all individual gene genealogies, subclade A was recognized as a single IEL following the criteria of genealogical concordance and genealogical non-discordance. The backbone structure of three well-supported subclades (A, B and C) within the DASC observed in the combined datasets (Figure 1 and Figure 2) were noted in both the his3 (Figure S6) and cal phylogram (Figures S6 and S7), which was also observed in the initial individual gene trees (Figures S4 and S5). Although these well-supported subclades were not recovered from ITS, tef1 and tub2 individual phylogenies (Figures S6–S8), strains of D. smilacicola and “Diaporthe cf. heveae” formed two monophyletic IEL in all individual phylogenies, except for the tub2 phylogram from the combined dataset of three loci (Figure S8C). Thus, the GCPSR principle also supports the existence of three putative phylogenetic species within the DASC, with most strains falling into the D. arecae subclade that seems to represent a single phylogenetic species sister to D. smilacicola and D. chiangmaiensis.
As estimated by the initial ITS, tef1 or tub2 phylograms (Figures S1–S3), the species D. averrhoae, D. ceratozamiae, D. delonicis, D. liquidambaris, D. loropetali, D. nelumbonis, D. phyllanthicola, D. searlei, and the ex-type strain of D. pandanicola (MFLUCC 17-0607), belong to the DASC, more exactly to the D. arecae subclade. However, given the limited number of loci available for these species, they were not included in the five-, four- and three-loci combined datasets. Nonetheless, considering the structure of the individual gene trees (Figures S1–S3), and given the position of the aforementioned species within the DASC, it is here advocated that they should be assigned to D. arecae.

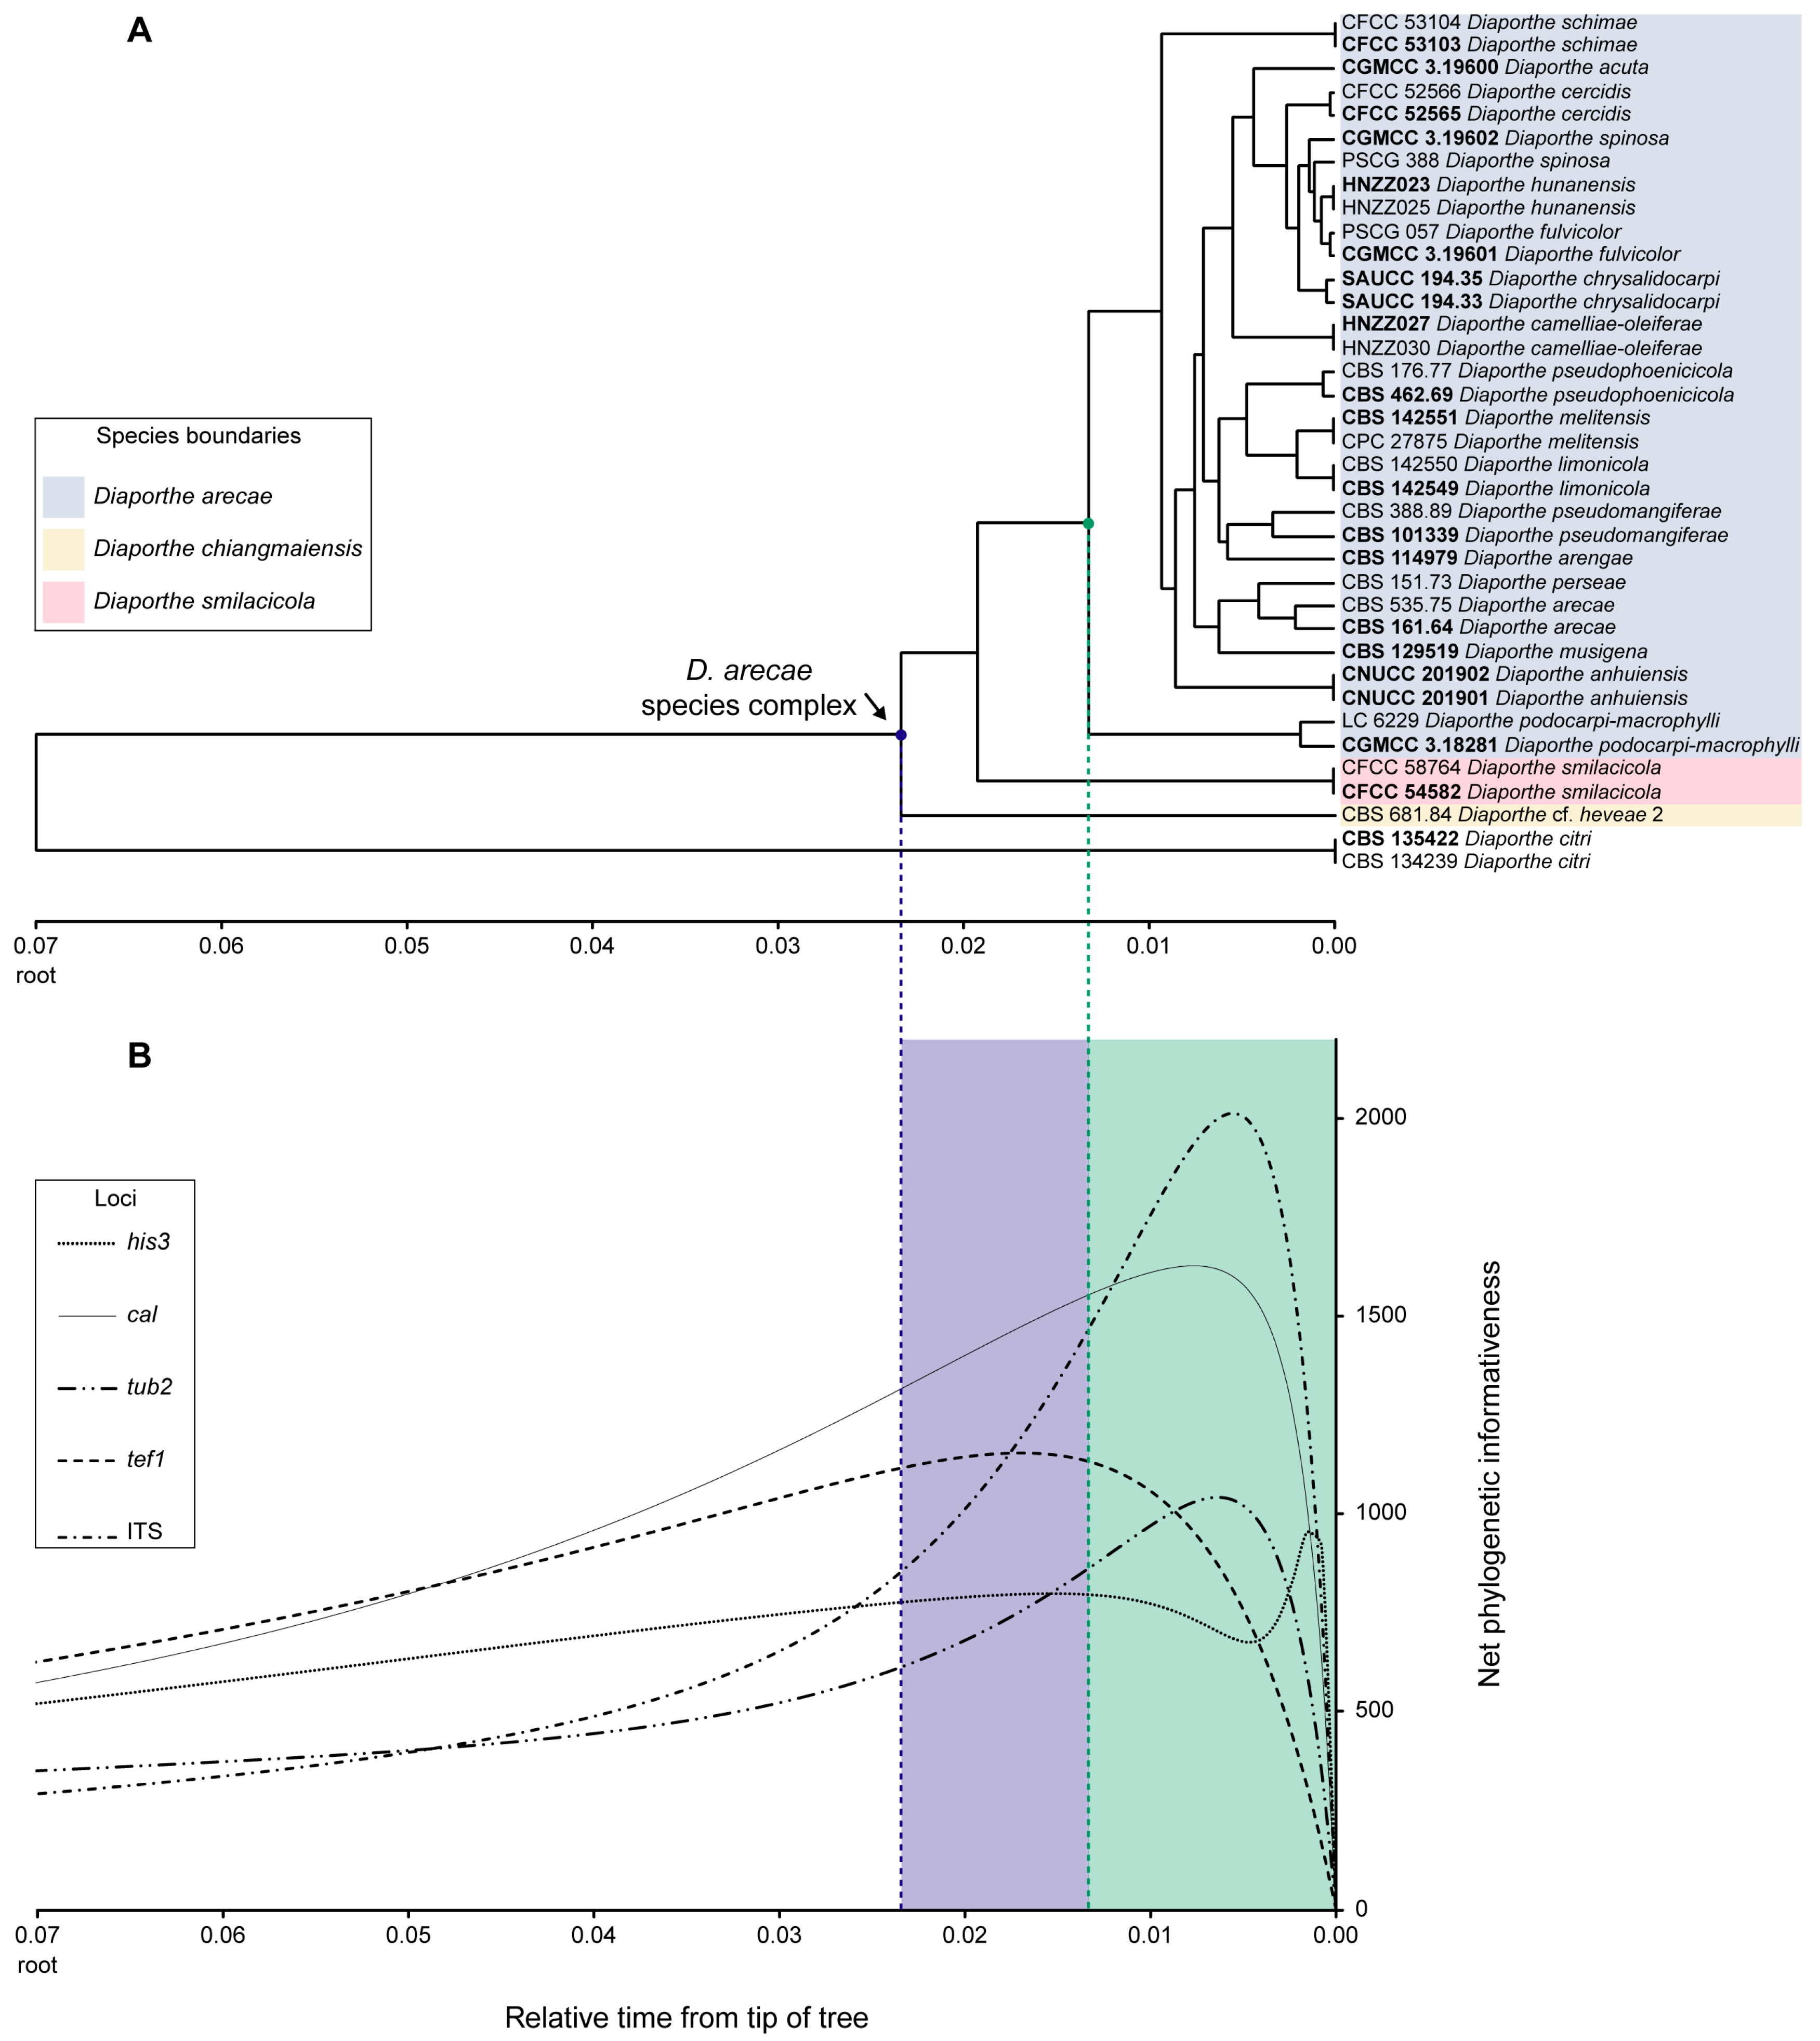
3.3. Phylogenetic Informativeness and Informative Characters of Each Locus

The Phylogenetic Informativeness (PI) profiles indicated that, in general terms, cal, tef1 and his3 are the most informative markers for phylogenetic inference of the DASC, while ITS and tub2 are the least informative (Figure 3). Integrating PI over specific periods of time provides information for ranking loci. The PI analysis showed a peak for the ITS curve corresponding to the D. arecae subclade (green dot and dashed line in Figure 3) and for that specific relative period of time ITS ranks as the most informative marker. Nonetheless, ITS is the least informative locus as the tree approaches its root. According to the informative characters provided by the phylogenetic analyses, ITS displayed the least informative sequences, with the lowest percentage of parsimony-informative characters (17.3%) and unique alignment patterns (23.1%) (Table 2, 5-loci dataset), suggesting that this locus might not be suitable for species delimitation within the DASC. However, phylogenetic analyses excluding the ITS locus were performed in the present study and, except for a slightly improvement in the support values for some nodes, the backbone structure of the trees obtained was similar to those in which the ITS locus was included.
Opposite to ITS, cal, tef1 and, to a lesser extent, his3 ranked as the most informative loci to infer species limits of the DASC (blue dot and dashed line in Figure 3) and to resolve the backbone structure of three well-supported subclades observed in the multilocus phylogenetic inferences (Figure 1 and Figure 2), which is congruent with the results obtained for the his3 and cal phylogram (Figures S4–S7). In comparison with the percentage of parsimony-informative characters and unique alignment patterns of each locus (Table 2, five-loci dataset), tef1 (48.4% and 52.3%, respectively) and cal (33.6% and 39.7%, respectively) showed a congruent result with the PI profiles as the most informative loci. Nonetheless, although the PI profile of tub2 was apparently one of the least informative to resolve species boundaries in the DASC, it exhibited some value in terms of the percentage of parsimony-informative characters (30.6%) and unique alignment patterns (35.4%) (Table 2, 5-loci dataset), ranking as the third out of five most informative loci for phylogenetic inference in the DASC.
The increase in the number of taxa, and subsequently increase the amount of data in each locus, from the five- to the three-loci datasets, we increased the amount of homoplasy detected in each locus (Table 2). For instance, according to the descriptive tree statistics provided by the MP analyses, ITS presented an increasingly moderate level of homoplasy in all three analyses from 0.44 to 0.51 (Table 2, five- and three-loci datasets, respectively). Similarly, while the remaining loci presented low level of homoplasy in the five- and four-loci dataset analyses, tef1 and tub2 presented moderate levels of homoplasy in the three-loci dataset analysis (0.41 and 0.43, respectively; Table 2, three-loci dataset). Homoplasy may arise from reticulation events during the evolutionary history and, as a consequence, can be seen as an indirect measure of recombination. Therefore, increasing the number of taxa seems to reveal the presence of recombination within the DASC and further analyses were conducted to validate this hypothesis.

3.4. Species Delimitation Based on Poisson Tree Processes Models

As previously referred to, missing data were very unevenly distributed among the different genes used, corresponding mostly to sequences of his3 and cal loci (Table 1). Given the lack of these data for several species of the DASC, the coalescent-based PTP and mPTP models applied included those species whose five, four or three loci were available. Therefore, the analyses were conducted using the ML inferences of the five-, four- and three-loci combined datasets, respectively (Figure 2).
The PTP and mPTP analyses performed gave congruent species delimitation results both for each combined dataset and between the different combined datasets. Only the PTP and mPTP trees with a species delimitation hypothesis obtained for the combined dataset of five loci are shown in Figure 4 and Figure 5, respectively, as illustrative results. The web server for PTP outputs a maximum likelihood solution and a highest Bayesian supported solution as species delimitation schemes. The highest Bayesian solution or bPTP corresponds to a Bayesian implementation of the original maximum likelihood PTP model for species delimitation (https://species.h-its.org/ptp/, accessed on 15 May 2023) and adds Bayesian support values to delimited species on the input tree. Although both solutions obtained in the present study gave congruent species delimitation results for all the combined datasets tested, with moderate acceptance rates of more than 60%, the Bayesian support values were inconsistent between the different combined datasets and most were below 0.9. Taking into consideration that the web server for PTP has a limit of 500,000 MCMC generations, the low Bayesian support values might be related to a lack of sufficient MCMC iterations to produce more accurate support values. Therefore, to avoid reporting meaningless results, only the maximum likelihood solution is provided in Figure 4.
According to the estimated species trees, the transition from blue-colored to red-colored branches (in PTP, Figure 4), and the transition from green-colored to red-colored branches (in mPTP, Figure 5) was evidence that both coalescent-based methods returned ML partitions of seven putative species. Both analyses inferred three putative species within the D. arecae species complex. Both models recognized that all species within the D. arecae subclade were comprised in a single monophyletic branch, i.e., they constitute a single species, and thus the strains should be considered as individuals within a population, rather than different taxa. Moreover, PTP and mPTP analyses also showed concordant results regarding the four well-delimited species included as an outgroup and recognized these taxa as monophyletic clades. Therefore, the results obtained with the coalescent-based methods were consistent with the phylogenetic inferences of the DASC (Figure 1 and Figure 2) and the results obtained following the GCPSR principle.
To properly assist in the phylogenetic relationship between the D. chiangmaiensis and “Diaporthe cf. heveae” strains, PTP and mPTP analyses were performed based on the combined dataset of ITS and tef1 sequence data due to the lack of tub2, cal and his3 sequences for these taxa. Both analyses gave similar results, and only the mPTP tree with the species delimitation hypothesis is shown in Figure S9.
The mPTP species delimitation result obtained was congruent with the previous coalescent-based analyses and inferred a ML partition of seven putative species. Moreover, considering the transition between green-colored and red-colored branches, the mPTP analysis recognized D. chiangmaiensis and “Diaporthe cf. heveae” as conspecific, as previously predicted.

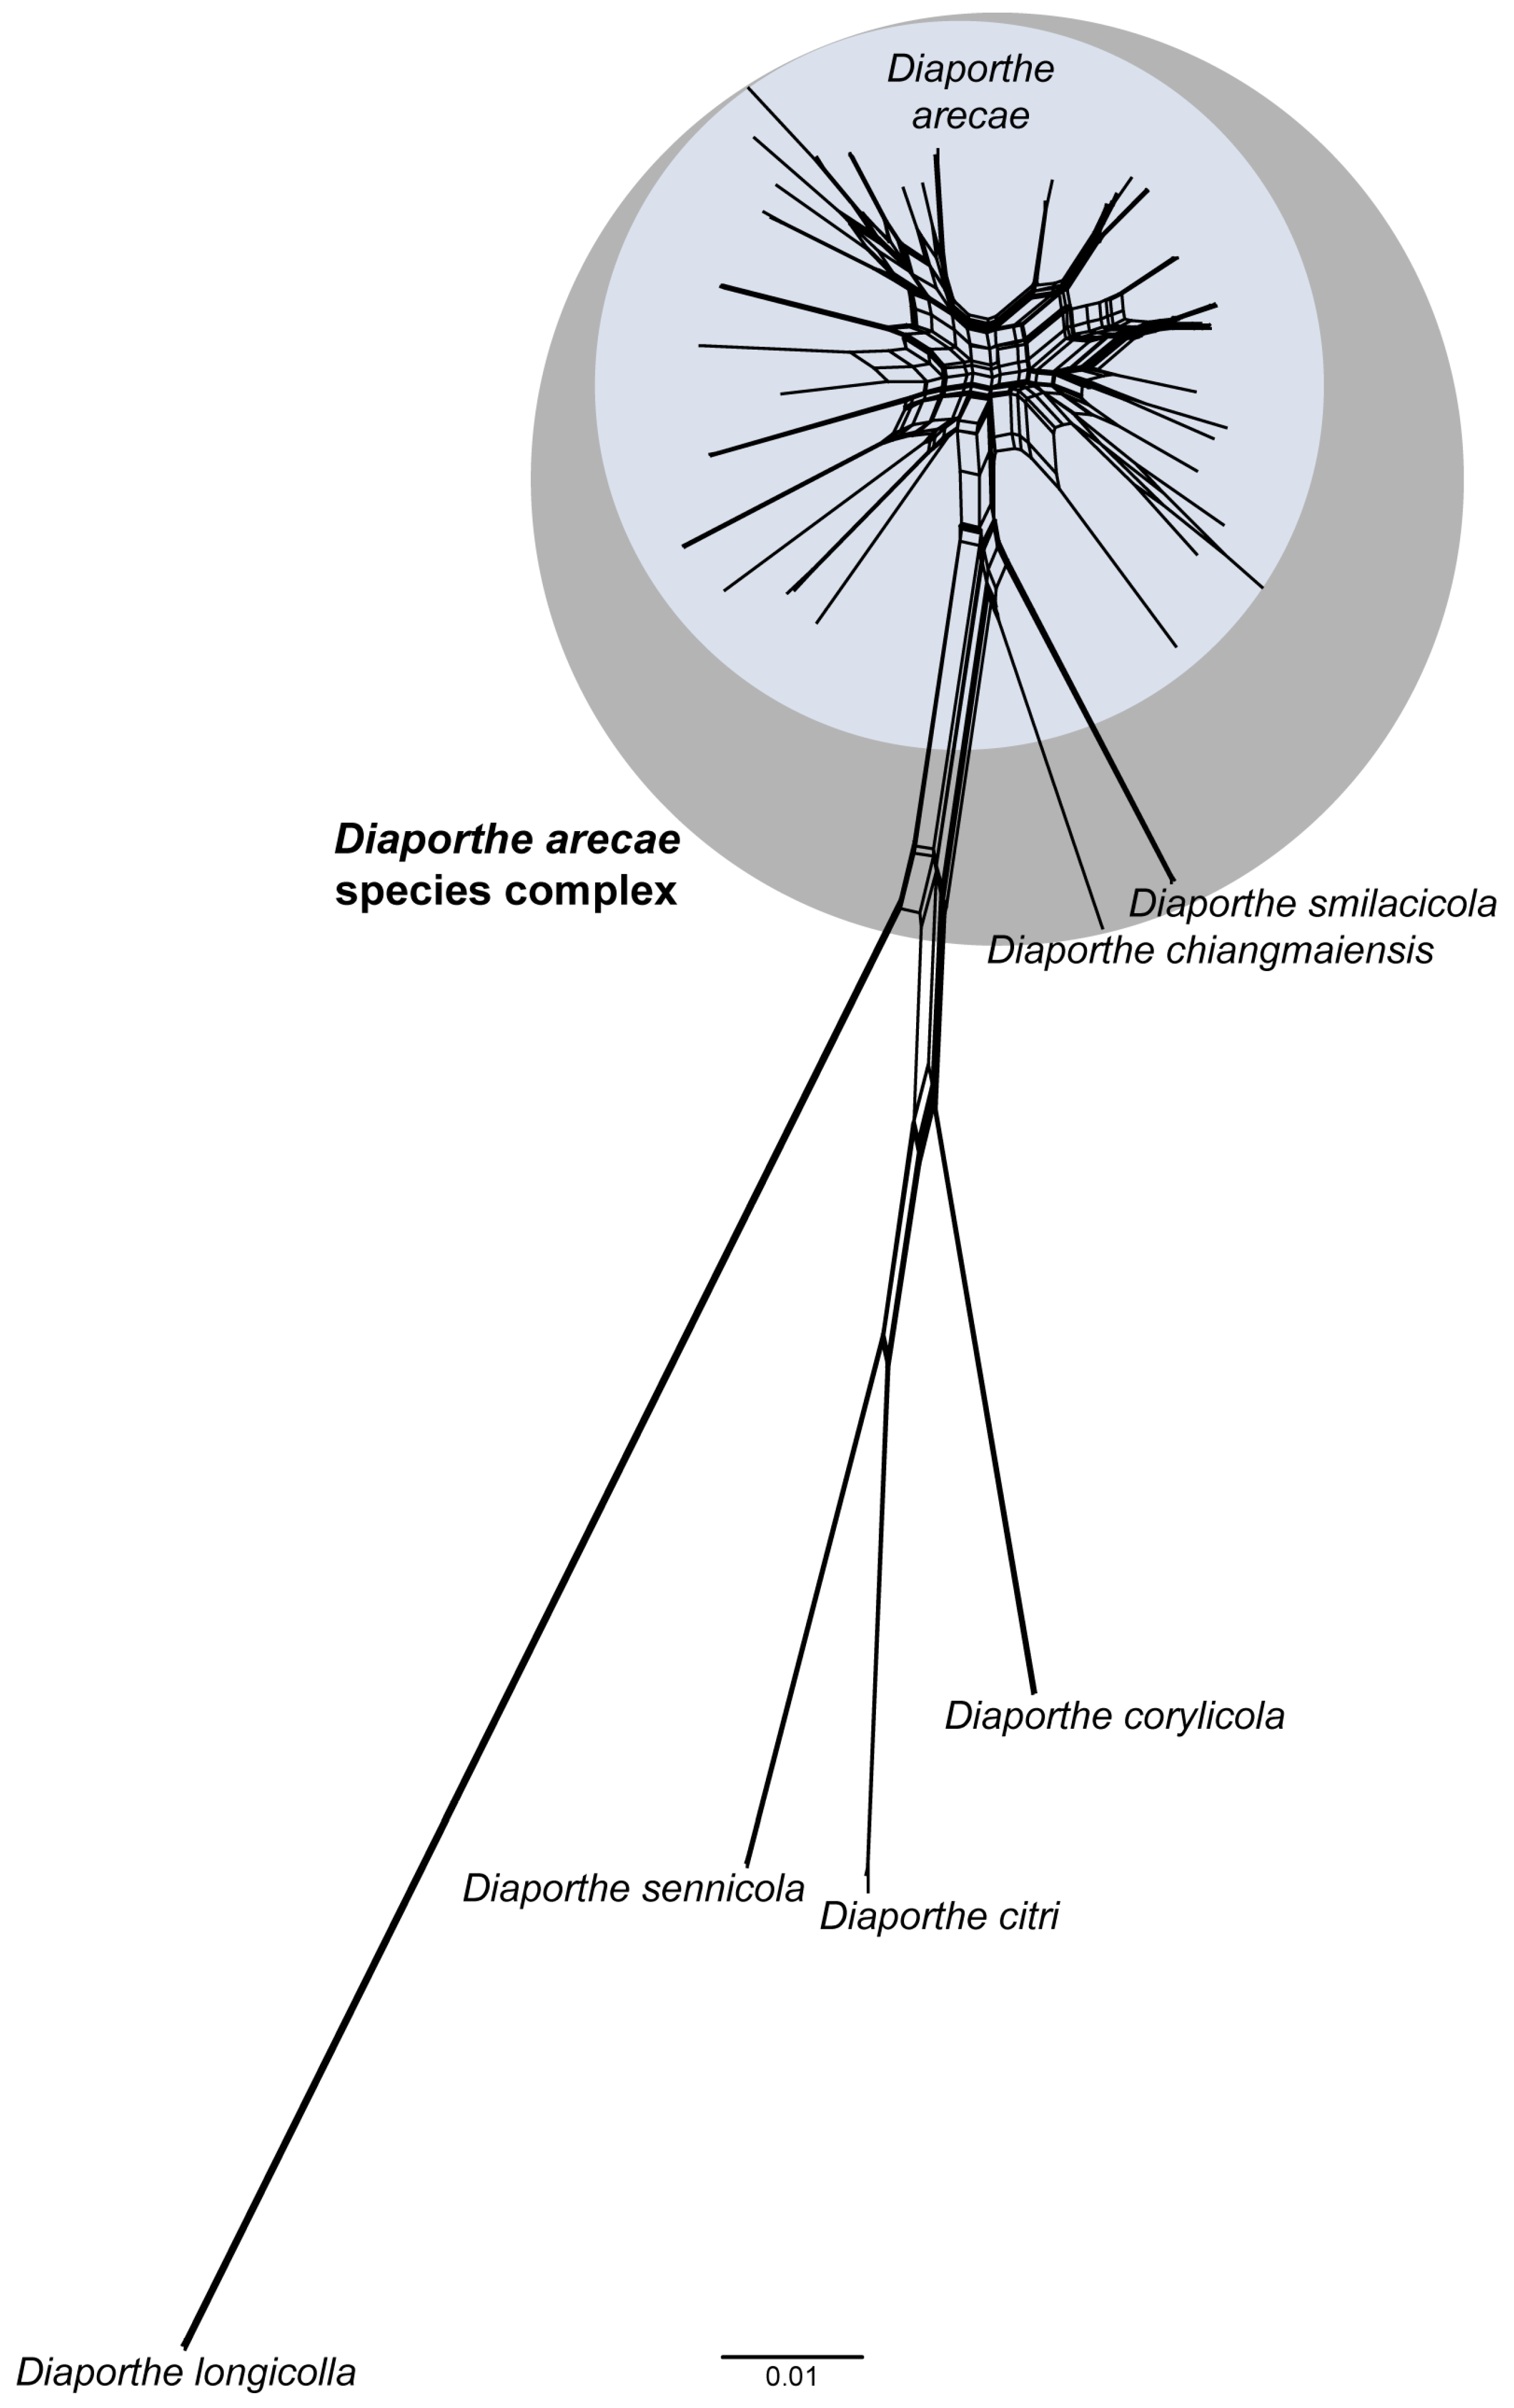
3.5. Pairwise Homoplasy Test and Phylogenetic Network Analyses

The PHI test performed on the five-, four- and three-loci combined datasets gave congruent results and found statistically significant evidence for recombination (p = 0.00, Table 3), denoting that there is no reproductive isolation within the DASC. Moreover, the PHI test also revealed that ITS and tef1 loci are subjected to a significant rate of recombination on the combined dataset of five (p = 4.34 × 10⁻⁴ and 0.02, respectively), four (p = 0.01 and 2.94 × 10⁻³, respectively) and three loci (p = 0.02 and 1.12 × 10⁻³, respectively) (Table 3). Likewise, the tub2 locus tested positive for recombination on the combined dataset of four loci (p = 9.92 × 10⁻³), although no recombination was detected when performing the combined datasets of five and three loci (p = 0.07 and 0.23, respectively) (Table 3). The results obtained are congruent with the predicted occurrence of recombination by the measures of homoplasy provided by the MP analyses (Table 2).
To further analyze the occurrence of recombination among taxa within the D. arecae subclade, highly supported monophyletic branches or singletons by either ML-BS, MP-BS or PP from the phylogenetic inference of the five-loci combined dataset were selected as hypothetical populations or “species”, respectively, and the PHI test was performed for and between every pair of branches (branch a to i, Figure 6A). Moreover, the PHI test was also performed between these monophyletic branches and D. chiangmaiensis and D. smilacicola subclades (branch j and k, Figure 6A). The matrix of the recombination results is shown in Figure 6B.
Most well-supported branches in the complex showed a wide geographical distribution and were not restricted to a specific locality or host plant (Figure 6A). Even so, an exception is observed in branches c and g, which include taxa that were exclusively collected from different provinces of China, although associated with a variety of plant hosts (Figure 6A). However, significant recombination was detected within branches b and g (p = 6.85 × 10⁻⁸ and 5.41 × 10⁻¹⁰, respectively, Figure 6B), revealing the absence of reproductive isolation between D. arecae, D. eugeniae, D. musigena and D. perseae, and D. acuta, D. cercidis, D. chrysalidocarpi, D. fulvicolor, D. hunanensis, D. pescicola and D. spinosa, respectively (Figure 6A). Moreover, all tested paired branches that included the b or g branches gave positive results for recombination, which are likely to be influenced by the presence of significant recombination among the taxa that compose those branches.
Nonetheless, many other paired branches tested positive for recombination without significant recombination within the branches themselves (Figure 6B). For instance, significant recombination was found among taxa from branch a (isolated from five different hosts and three countries) and the species D. osmanthi (branch i, isolated from Litchi chinensis in China) (p = 1.40 × 10⁻⁵); among taxa from branch d (isolated from Citrus limon in Malta and Areca catechu in China) and the species D. pseudomangiferae (branch f, isolated from Mangifera indica in Mexico and Dominican Republic) (p = 3.86 × 10⁻²) and D. osmanthi (branch i) (p = 4.53 × 10⁻²); and among taxa from branches a and c (isolated from Camellia oleifera and Pyrus pyrifolia) and the species D. pseudophoenicicola (branch h, isolated from A. catechu in China, M. indica in Iraq and Phoenix dactylifera in Spain) (p = 1.00 × 10⁻² and 2.00 × 10⁻³, respectively) (Figure 6). Significant recombination was also detected between D. chiangmaiensis (branch k, isolated from Heveae brasiliensis in India) and D. smilacicola (branch j, isolated from Smilax glabra in China) and taxa from branch a (p = 9.80 × 10⁻⁴ and 1.90 × 10⁻², respectively), as well as between D. smilacicola and taxa from branch d (p = 2.76 × 10⁻²) (Figure 6).
The phylogenetic networks built for the combined dataset of five, four and three loci gave very similar results and showed fit values greater than 99% (fit = 99.84%, 99.71% and 99.43%, respectively), indicating that the displayed networks represent well the LogDet distance matrices from which they were computed. Only the splits-graph for the combined dataset of five loci is shown in Figure 7, as an illustrative result. According to the networked relationships, the DASC presents many contradicting edges, representing incompatible and ambiguous signals within the dataset.
These conflicting signals are particularly present among taxa belonging to the D. arecae subclade (subclade A in Figure 1), where parallel edges and boxlike polygons are found between virtually all taxa, revealing the presence of reticulate events, such as recombination, within the group. On the contrary, the four well-delimited species included as outgroup taxa are clearly placed apart from the DASC by an assemblage of long branches and bifurcating evolutionary relationships (Figure 7). Thus, the presence of boxlike polygons in the networked relationships among taxa of the D. arecae subclade imply likelihood of recombination between them, suggesting, together with the relative distances of taxa, that all strains within the D. arecae subclade should be regarded as conspecific.
The phylogenetic network analyses were congruent with the previous phylogenetic inferences and the GCPSR principle, regarding the existence of three distinct species within the DASC. While the networked relationships among taxa of the D. arecae subclade appear to exhibit inherently non-treelike evolutionary events, the relative distance and phylogenetic network structure of the branches corresponding to D. chiangmaiensis (subclade B in Figure 1) and D. smilacicola (subclade C in Figure 1) seem to clearly approach a bifurcated evolutionary relationship without conflicting phylogenetic signals, i.e., without recognition of expressive recombination.
Although similar topological results were observed between the phylogenetic networks built for the different combined datasets, according to what was observed in the previous analyses, the increase in the number of taxa within the DASC, amplified the deviations from a treelike pattern for the D. arecae subclade, revealing a higher number of conflicting phylogenetic signals illustrated by parallel edges. These increasing conflicting signals among isolates within the D. arecae subclade in successive analyses are in line with the extensive topological incongruences of previous analyses and further suggests that it should be regarded as a single species.

3.6. Population Genetic Diversity

Molecular diversity indices and the Tajima’s D test for neutrality were computed for individual gene alignments and concatenated alignments of each combined dataset (five-, four- and three-loci) for the DASC, and a summary of the genetic diversity is presented in Table 4. Overall, the increasing of sample size, i.e., the number of sequences (taxa) in the combined datasets, led to an increase in genetic diversity. However, the observed results were congruent among the three combined datasets and therefore only those for the combined dataset of five loci will be quoted here.
The analyses of genetic diversity within the DASC showed a considerable number of haplotypes (h), segregating sites (S) and mutations (η) for each individual locus and for the concatenated loci. Nonetheless, cal and tef1 presented the highest number of haplotypes (33 and 21, respectively), segregating sites (73 and 72, respectively) and mutations (91 and 75, respectively) (Table 4), which is congruent with the previous analyses that depicted these loci as the most informative to resolve the DASC (Table 2, Figure 3). All loci presented high haplotype diversity (Hd), but low nucleotide diversity (π), suggesting population expansion for the DASC. While haplotype diversity values for each locus and for the combined loci were greater than 95%, reflecting high genetic diversity; the same was not reflected by the nucleotide diversity values, which ranged from 2.1% to 3.7%.
Population expansion in the DASC was also suggested by the neutrality results of the Tajima’s D test, which presented negative values for all loci and for the combined dataset, although associated probabilities did not reach statistical significance (Table 4). However, Tajima’s D test showed a statistically significant difference from the neutral expectations at the 5% level for cal (4-loci dataset in Table 4), tef1 and tub2 (3-loci dataset in Table 4). Thus, the significant departure from neutrality appears to be influenced by the number of taxa included in the DASC, indicating that a similar result would likely be obtained for the combined dataset of five loci if all sequences were available for all species. In addition, comparisons between the nucleotide diversity (π) values and the Watterson estimator (θ) values, which is an expectation of π, also suggest a departure from neutrality in the DASC, since those values are different for most datasets tested.

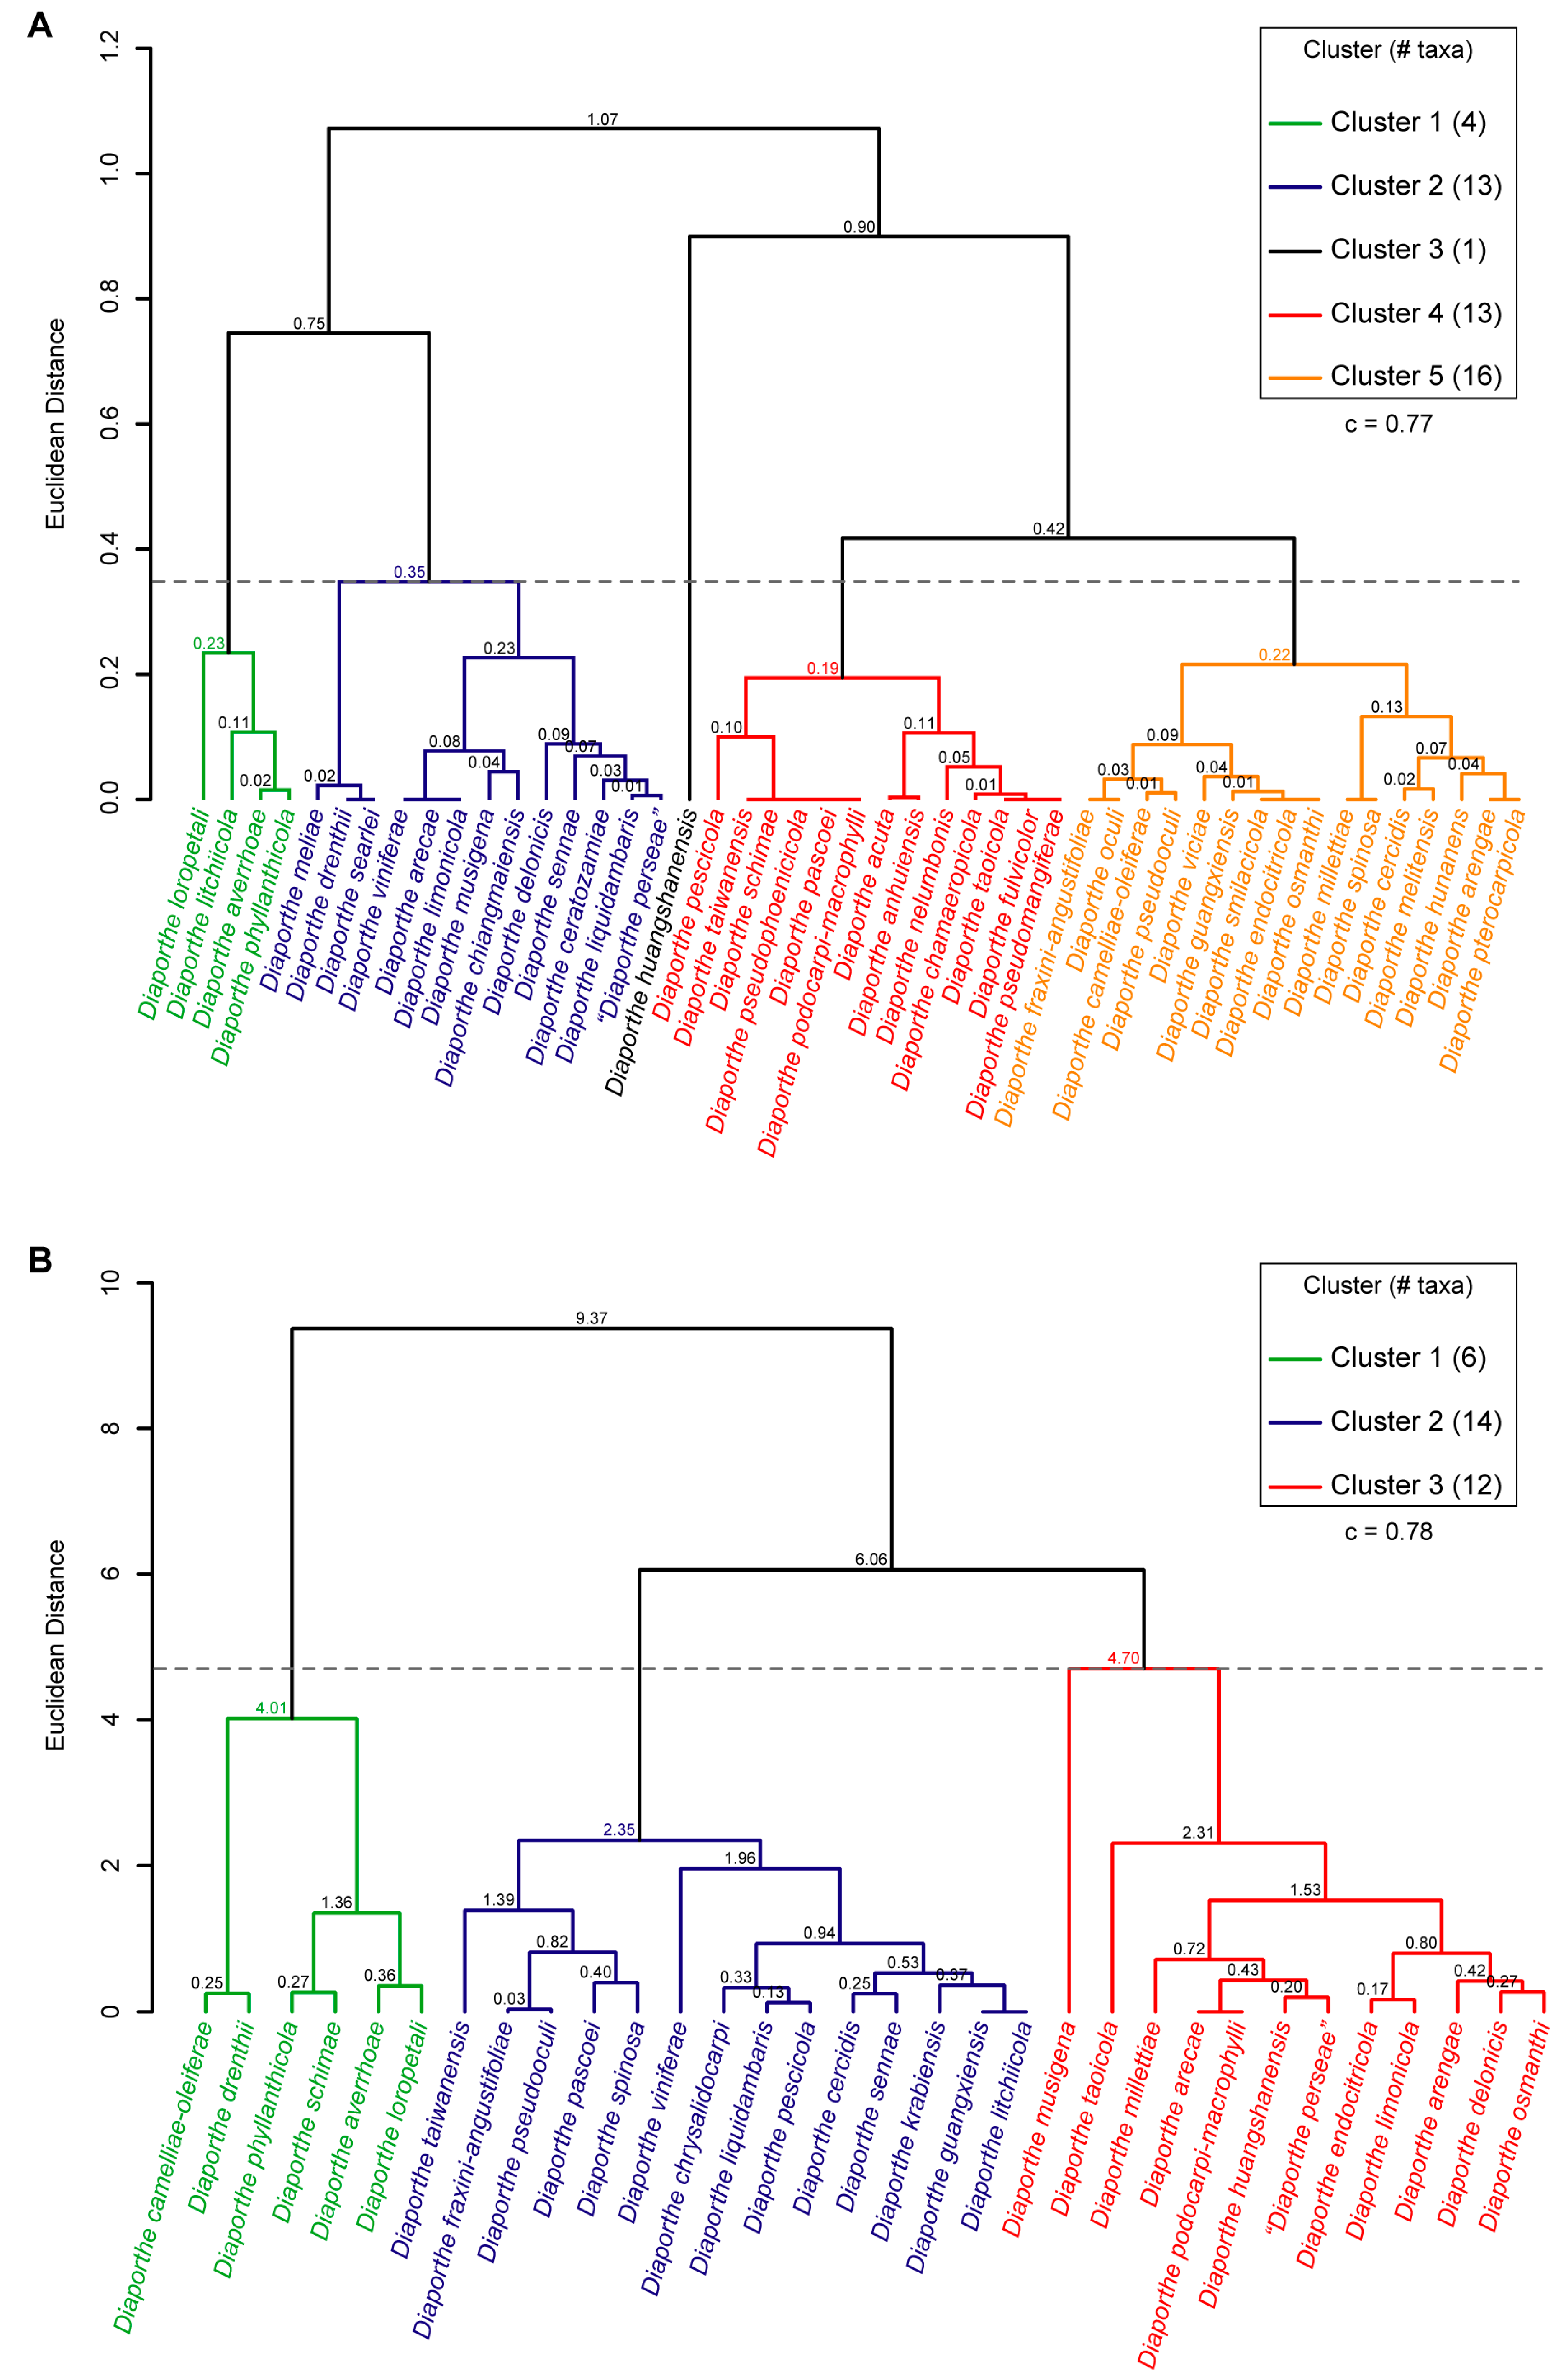
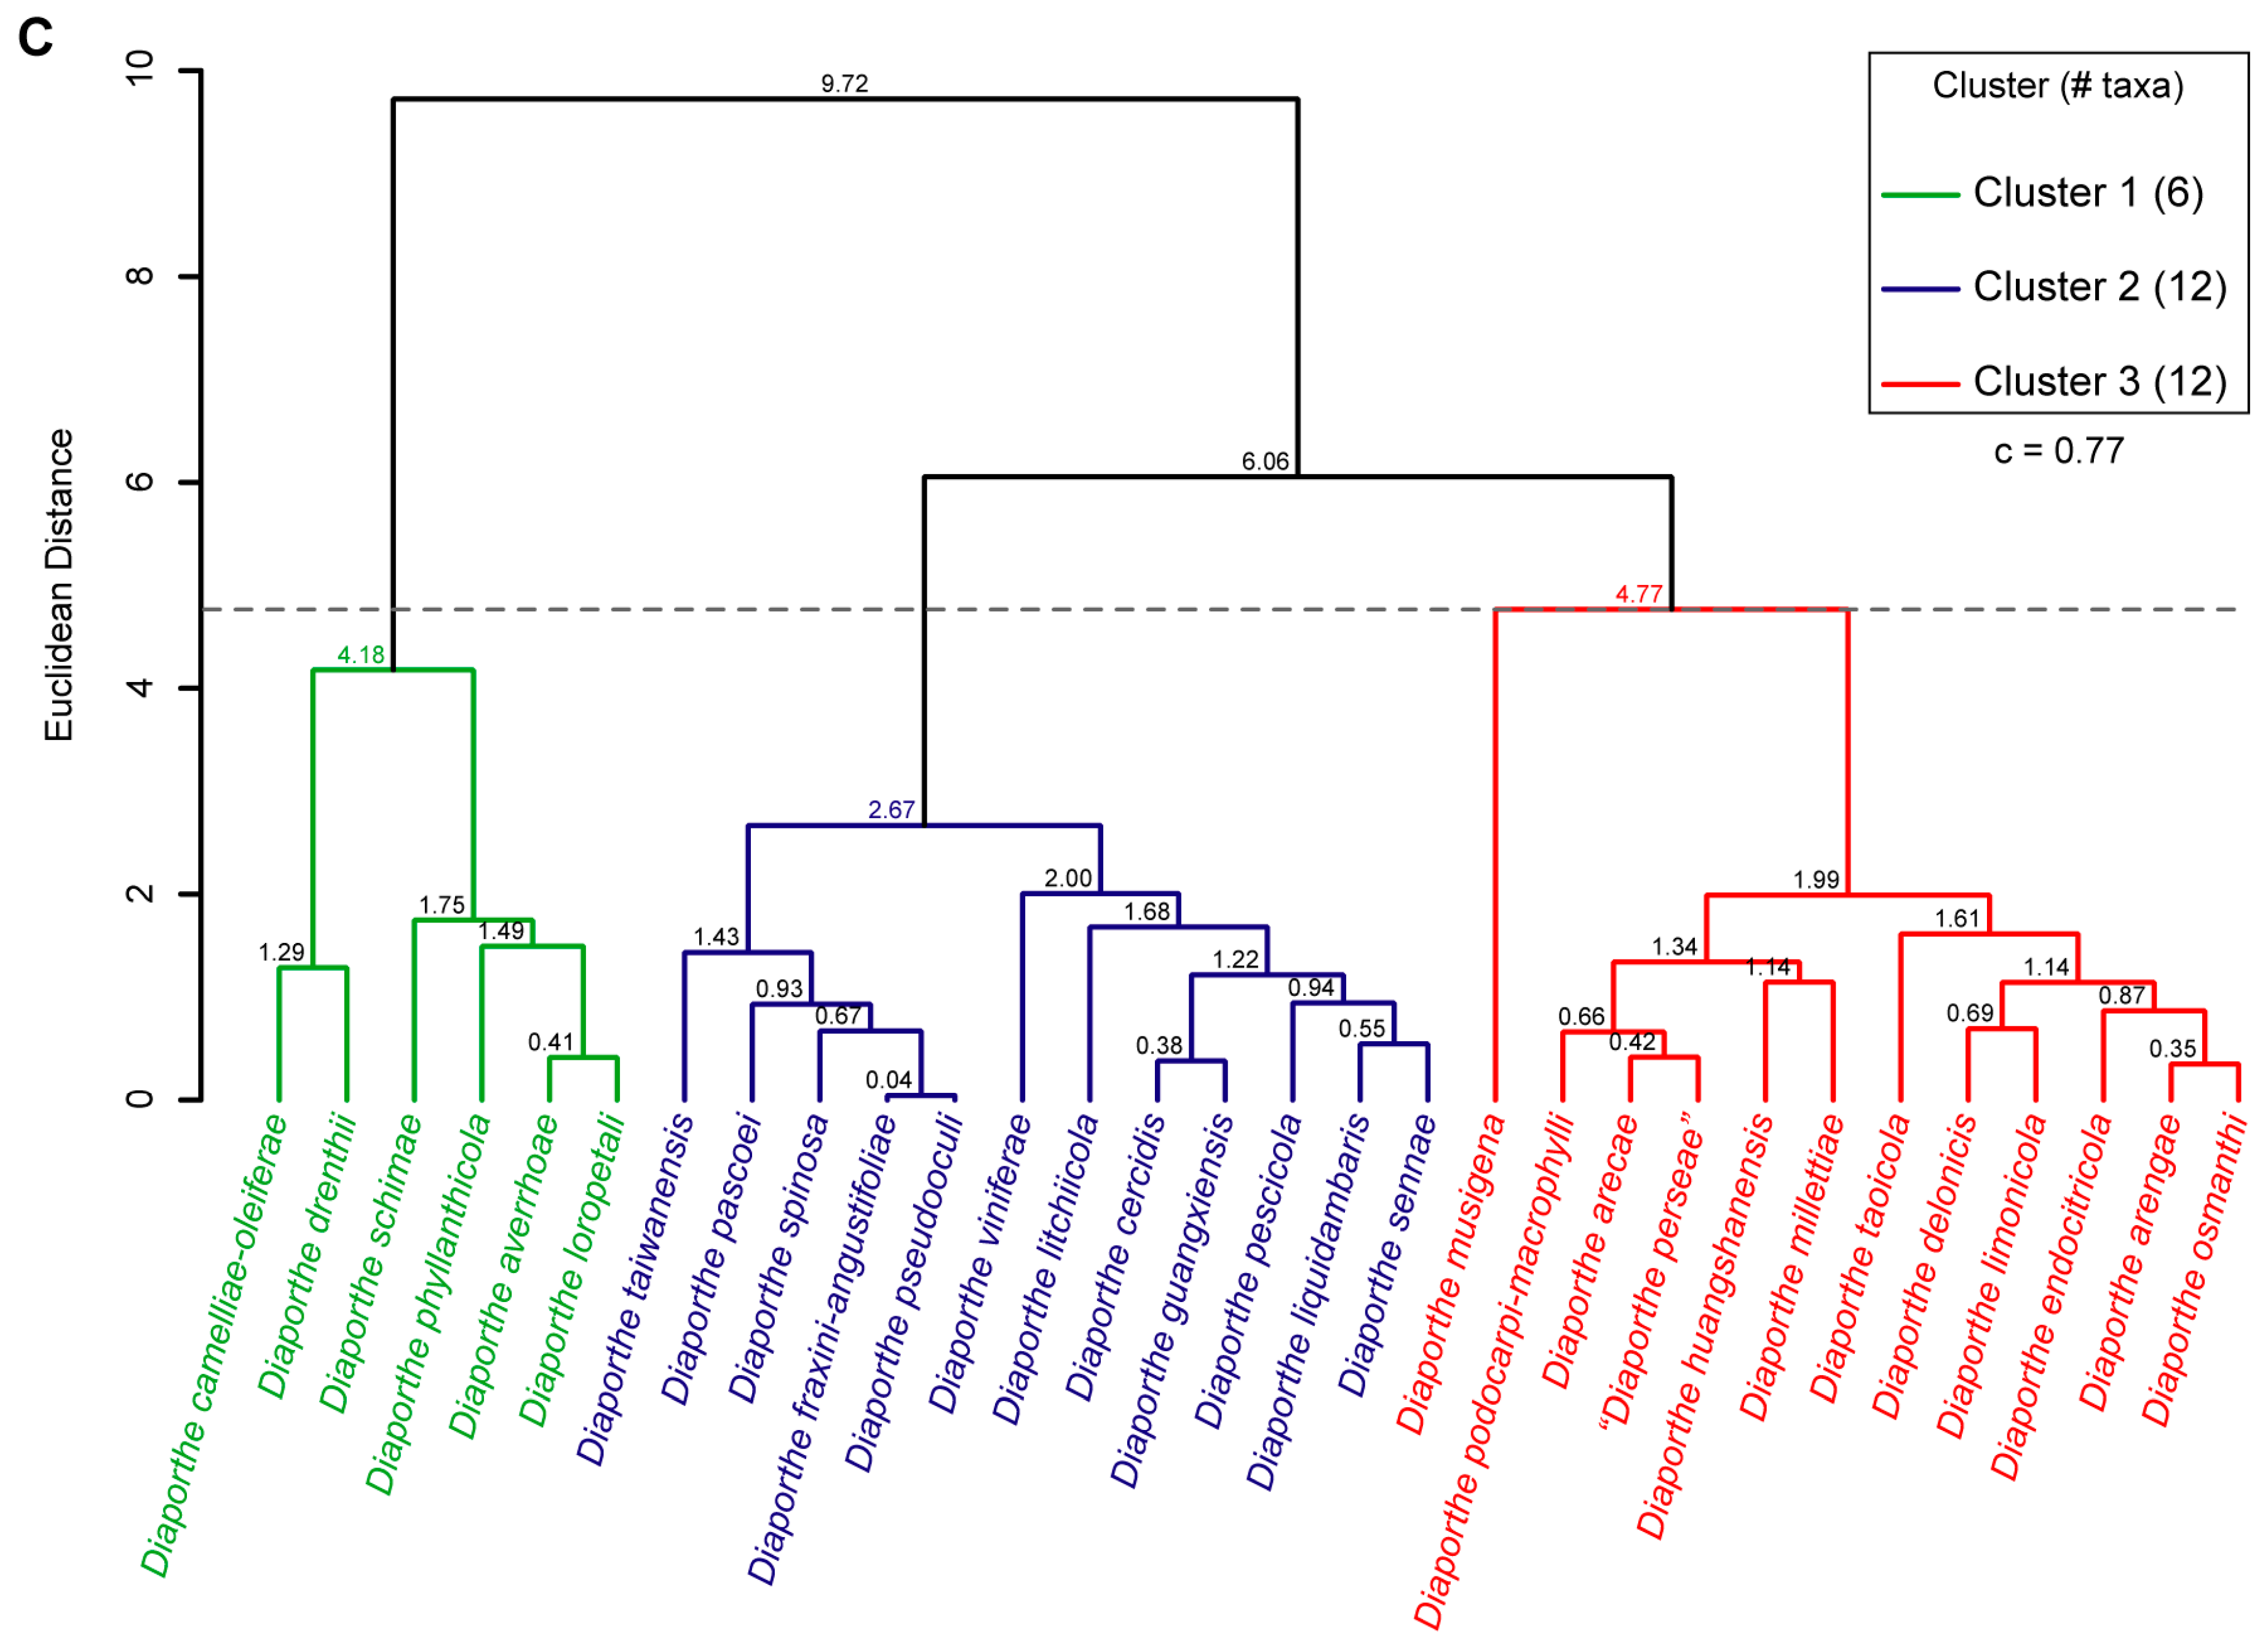
3.7. Hierarchical Cluster Analysis of Phenotypic Data

Three dendrograms were constructed using hierarchical cluster analysis based on published taxonomic descriptions of species belonging to the DASC (Figure 8). All dendrograms presented cophenetic correlation coefficient (c) values greater than 0.75, revealing that the clustering obtained is reliable and well fit. The phenotypic data used to construct the dendrograms were the alpha and beta conidia dimensions. Since some of the species with published taxonomic descriptions do not have alpha or beta conidia, the species included in the analyses were those with available dimensions for the respective feature in which a given dendrogram is based, which should be considered when comparing the dendrograms.
While the dendrogram based on the length-to-width (L/W) ratios of alpha conidia yielded five clusters comprising one to sixteen taxa (Figure 8A), the dendrograms based on L/W of beta conidia yielded three clusters comprising six to fourteen taxa (Figure 8B). Moreover, comparing both dendrograms, clustering patterns are highly discordant and L/W ratios of alpha and beta conidia seem to differently discriminate species in the DASC.
The dendrogram based on the L/W ratio of beta conidia (Figure 8B) was highly congruent with the combined dendrogram based on the L/W ratio of alpha and beta conidia, which also yielded three clusters comprising six to twelve taxa (Figure 8C).
Therefore, dimensions of beta conidia appear to discriminate more strongly between taxa within the DASC, as none of the clusters formed based on the L/W ratio of alpha conidia (Figure 8A) were recovered when both conidia were used to group taxa. However, none of the dendrograms obtained were congruent with the previous analyses based on molecular approaches. While phylogenetic-based analyses showed that the DASC include three putative phylogenetic species (D. arecae, D. chiangmaiensis and D. smilacicola), the hierarchical cluster analyses did not discriminate D. chiangmaiensis (cluster 2 in Figure 8A) and D. smilacicola (cluster 5 in Figure 8A) from other taxa belonging to the D. arecae subclade.

4. Taxonomy

The present study combined phylogenetic analyses, coalescent-based models (PTP and mPTP), phylogenetic networks, recombination and population genetic diversity analyses and hierarchical cluster analysis of phenotypic data to determine the species boundaries in the D. arecae species complex. According to the aforementioned analyses, three sister species (D. arecae, D. chiangmaiensis and D. smilacicola) have been delimited in the DASC. All species previously described in the D. arecae lineage were shown to be conspecific, rather than different taxa. Fifty-two species are thus reduced to synonymy under D. arecae and morphological descriptions of the D. arecae isolates from foliar lesions of palms are provided. Moreover, a synopsis of the morphological data available for the species synonymized here is provided in Table 5, and the host and country, along with the ecological group of all type specimens proposed as synonyms in the present study, are summarized in Table 6.
Diaporthe arecae (H.C. Srivast., Zakia & Govindar.) R.R. Gomes, Glienke & Crous, Persoonia 31: 16 (2013), MycoBank MB802924 (Figure 9).
Basionym: Subramanella arecae H.C. Srivast., Zakia & Govindar., Mycologia 54: 7 (1962), MycoBank MB339830
= Diaporthe acuta Y.S. Guo & G.P. Wang, Persoonia 45: 140 (2020), MycoBank MB830655
= Diaporthe anhuiensis H. Zhou & C.L. Hou, Phytotaxa 422: 165 (2019), MycoBank MB832081
= Diaporthe annellsiae Y.P. Tan & R.G. Shivas, Index of Australian Fungi 2: 1 (2022), MycoBank MB559559
= Diaporthe arengae R.R. Gomes, Glienke & Crous, Persoonia 31: 16 (2013), MycoBank MB802925
= Diaporthe averrhoae (C.Q. Chang, Z.D. Jiang & P.K. Chi) Y.H. Gao & L. Cai, IMA Fungus 8: 183 (2017), MycoBank MB821437
Phomopsis averrhoae C.Q. Chang, Z.D. Jiang & P.K. Chi, Mycosystema 24: 6 (2005), MycoBank MB344467
= Diaporthe bounty Y.P. Tan & R.G. Shivas, Index of Australian Fungi 2: 3 (2022), MycoBank MB559562
= Diaporthe camelliae-oleiferae Q. Yang, MycoKeys 84: 22 (2021), MycoBank MB840451
= Diaporthe ceratozamiae Crous & R.G. Shivas, Persoonia 27: 133 (2011), MycoBank MB560695
= Diaporthe cercidis C.M. Tian & Q. Yang, MycoKeys 39: 124 (2018), MycoBank MB824707
= Diaporthe chamaeropicola D.S. Pereira & A.J.L. Phillips, Fungal Diversity 111: 166 (2021), MycoBank MB557847
= Diaporthe chrysalidocarpi S.T. Huang, J.W. Xia, W.X. Sun & X.G. Zhang, MycoKeys 78: 59 (2021), MycoBank MB837812
= Diaporthe delonicis R.H. Perera, E.B.G. Jones & K.D. Hyde, Mycosphere 11: 2129 (2020), MycoBank MB556855
= Diaporthe drenthii Y.P. Tan, Akinsanmi & R.G. Shivas, Plant Pathology 69: 916 (2020), MycoBank MB833828
= Diaporthe endocitricola Z.Y. Dong, M. Luo, M.M. Xiang & K.D. Hyde, Frontiers in Microbiology 11: 9 (2021), MycoBank MB557628
= Diaporthe fraxini-angustifoliae R.G. Shivas, J. Edwards & Y.P. Tan, Fungal Diversity 61: 255 (2013), MycoBank MB802384
= Diaporthe fulvicolor Y.S. Guo & G.P. Wang, Persoonia 45: 146 (2020), MycoBank MB830657
= Diaporthe gossiae Y.P. Tan & R.G. Shivas, Index of Australian Fungi 2: 5 (2022), MycoBank MB559565
= Diaporthe guangxiensis Dissanayake, X.H. Li & K.D. Hyde, Frontiers in Microbiology 10: 14 (2019), MycoBank MB552578
= Diaporthe hongheensis E.F. Yang & Tibpromma, Journal of Fungi 8: 15 (2022), MycoBank MB559411
= Diaporthe howardiae Y.P. Tan & R.G. Shivas, Index of Australian Fungi 2: 6 (2022), MycoBank MB559570
= Diaporthe huangshanensis H. Zhou & C.L. Hou, Phytotaxa 422: 169 (2019), MycoBank MB832082
= Diaporthe hunanensis Q. Yang, MycoKeys 84: 26 (2021), MycoBank MB840452
= Diaporthe krabiensis (Dayarathne) M.S. Calabon & E.B.G. Jones, Botanica Marina 66: 219 (2023), MycoBank MB848522
Diaporthe krabiensis Dayarathne, Mycosphere 11: 92 (2020), MycoBank MB635831
= Diaporthe limonicola Guarnaccia & Crous, IMA Fungus 8: 328 (2017), MycoBank MB821731
= Diaporthe liquidambaris (C.Q. Chang, Z.D. Jiang & P.K. Chi) Udayanga & Castl., IMA Fungus 7: 291 (2016), MycoBank MB819021
Phomopsis liquidambaris C.Q. Chang, Z.D. Jiang & P.K. Chi, Mycosystema 24: 9 (2005), MycoBank MB344462
Diaporthe liquidambaris (C.Q. Chang, Z.D. Jiang & P.K. Chi) Y.H. Gao & L. Cai, IMA Fungus 8: 183 (2017), MycoBank MB821446
= Diaporthe litchiicola R.G. Shivas, K.R.E. Grice & Y.P. Tan [as “litchicola”], Fungal Diversity 61: 256 (2013), MycoBank MB545033
= Diaporthe loropetali (C.Q. Chang, Z.D. Jiang & P.K. Chi) Y.H. Gao & L. Cai, IMA Fungus 8: 183 (2017), MycoBank MB821448
Phomopsis loropetali C.Q. Chang, Z.D. Jiang & P.K. Chi, Mycosystema 24: 148 (2005), MycoBank MB344460
= Diaporthe meliae C.M. Tian & Qin Yang, MycoKeys 91: 38 (2022), MycoBank MB829523
= Diaporthe melitensis Guarnaccia & Crous, IMA Fungus 8: 329 (2017), MycoBank MB821732
= Diaporthe millettiae H. Long, K.D. Hyde & Yong Wang bis, MycoKeys 57: 119 (2019), MycoBank MB829563
= Diaporthe musigena Crous & R.G. Shivas, Persoonia 26: 119 (2011), MycoBank MB560160
= Diaporthe nelumbonis Sawada ex R. Kirschner, Mycological Progress 17: 280 (2017), MycoBank MB821926
≡ Phyllosticta nelumbonis Sawada, Special Publication College of Agriculture National Taiwan University 8: 140 (1959), MycoBank MB336860
= Diaporthe norfolkensis Y.P. Tan & R.G. Shivas, Index of Australian Fungi 2: 8 (2022), MycoBank MB559574
= Diaporthe oculi Mochiz. & Kaz. Tanaka, Journal of Infection and Chemotherapy 25: 98 (2018), MycoBank MB825540
= Diaporthe osmanthi H. Long, K.D. Hyde & Yong Wang bis, MycoKeys 57: 120 (2019), MycoBank MB829564
= Diaporthe pandanicola Tibpromma & K.D. Hyde, MycoKeys 33: 44 (2018), MycoBank MB823840
= Diaporthe pascoei R.G. Shivas, J. Edwards & Y.P. Tan, Fungal Diversity 61: 258 (2013), MycoBank MB802387
= Diaporthe pescicola Dissanayake, J.Y. Yan, X.H. Li & K.D. Hyde, Mycosphere 8 (5): 542 (2017), MycoBank MB551988
= Diaporthe phyllanthicola (C.Q. Chang, Z.D. Jiang & P.K. Chi) Y.H. Gao & L. Cai, IMA Fungus 8: 184 (2017), MycoBank MB821461
Phomopsis phyllanthicola C.Q. Chang, Z.D. Jiang & P.K. Chi, Mycosystema 24: 10 (2005), MycoBank MB344466
= Diaporthe podocarpi-macrophylli Y.H. Gao & L. Cai, IMA Fungus 8: 176 (2017), MycoBank MB820682
= Diaporthe pseudomangiferae R.R. Gomes, Glienke & Crous, Persoonia 31: 30 (2013), MycoBank MB802945
= Diaporthe pseudooculi Mochiz. & Kaz. Tanaka, Journal of Infection and Chemotherapy 25: 100 (2018), MycoBank MB825541
= Diaporthe pseudophoenicicola R.R. Gomes, Glienke & Crous, Persoonia 31: 30 (2013), MycoBank MB803839
= Diaporthe pterocarpicola Udayanga, Xing Z. Liu & K.D. Hyde, Cryptogamie, Mycologie 33: 303 (2012), MycoBank MB801053
= Diaporthe schimae C.M. Tian & Q. Yang, MycoKeys 77: 55 (2021), MycoBank MB829526
= Diaporthe searlei R.G. Shivas, Akinsanmi & Y.P. Tan, Plant Pathology 69: 918 (2020), MycoBank MB833830
= Diaporthe sennae C.M. Tian & Qin Yang, Phytotaxa 302: 149 (2017), MycoBank MB820452
= Diaporthe spinosa Y.S. Guo & G.P. Wang, Persoonia 45: 154 (2020), MycoBank MB830659
= Diaporthe taiwanensis H.A. Ariyaw. & I. Tsai, Phytotaxa 461: 161 (2020), MycoBank MB835116
= Diaporthe taoicola Dissanayake, J.Y. Yan, X.H. Li & K.D. Hyde, Mycosphere 8: 543 (2017), MycoBank MB551989
= Diaporthe viciae W.S. Zhao, Q. Ning & J.Y. Yan, Mycosphere 14: 34 (2023), MycoBank MB558423
= Diaporthe viniferae Dissanayake, X.H. Li & K.D. Hyde, Frontiers in Microbiology 10: 21 (2019), MycoBank MB552002
Type: INDIA, on fruit of Areca catechu (Arecaceae), during 1958–59, H.C. Srivastava (holotype of Subramanella arecae IMI, anon. s. n., IARI, anon. s. n.). INDIA, on fruit of A. catechu, Feb 1964, H.C. Srivastava (isotype of S. arecae CBS H-7808, ex-isotype culture CBS 161.64).
See [38] for illustrations and descriptions of asexual morph. Sexual morph was not reported for any of the specimens but was reported under the species names D. hongheensis [126] and D. spinosa [104].
Isolate CDP 0358. Sexual morph: Undetermined. Asexual morph: Conidiomata on palm leaflets in culture pycnidial, globose to subglobose, non-stromatic, uniloculate, black, solitary, occasionally aggregated in small groups, immersed in the host becoming erumpent through the ostiolar region, occasionally superficial, exuding a yellowish mucoid mass or cirrus of conidia, up to 220 μm diam. Conidiophores reduced to conidiogenous cells. Conidiogenous cells lining the pycnidial cavity, hyaline, smooth- and thin-walled, discrete, determinate, cylindrical to broadly lageniform, tapering towards the apex, straight or slightly curved, aseptate, rarely 1-septate, unbranched, rarely with one branch below the septum, rarely with minute and inconspicuous collarette, enteroblastic, proliferating at the same level giving rise to periclinal thickenings, (4.99–)7.17–16.46(–22.54) × 1.73–4.43 μm, 95% confidence limits = 10.62–11.83 × 2.41–2.63 μm (mean ± SD = 11.22 ± 2.77 × 2.52 ± 0.50 μm, n = 80). Alpha conidia fusoid to ellipsoid, tapering towards both ends, acute to subacute base, often slightly subtruncate with a flattened hilum, subobtuse to obtuse apex, often narrower in the middle, smooth- and thin-walled, hyaline, aseptate, eguttulate, often with granular contents, 5.76–8.88(–11.52) × 1.62–3.08 μm, 95% confidence limits = 7.26–7.50 × 2.20–2.26 μm (mean ± SD = 7.38 ± 0.75 × 2.23 ± 0.20 μm), mean ± SD conidium length/width ratio = 3.33 ± 0.40 (n = 150). Beta and gamma conidia not observed.
Culture characteristics: Colonies on 1/2 PDA, reaching 55 mm diameter after 7 days at 20 °C in darkness. Surface flat, with filiform margin, circular shape, whitish to pale, opaque. Reverse pale to yellowish orange. No diffusible pigment. Conidiomata black, formed in poorly defined concentric rings after about 2 weeks.
Material examined: PORTUGAL, Lisbon, Parque das Nações, Jardins da Água, Pomar do Mediterrâneo, on foliar lesions of segments of Chamaerops humilis (Arecaceae), 16 October 2018, Diana S. Pereira (specimen HDP 039), living culture CDP 0047 (cal sequence MT011065, ITS sequence MT002357, tef1 sequence MT011069, tub2 sequence MT011075); Parque das Nações, Jardins da Água, near Oceanário de Lisboa, on foliar lesions of segments of C. humilis (Arecaceae), 16 October 2018, Diana S. Pereira (specimen HDP 034), living culture CDP 0460 (ex-type culture of D. chamaeropicola, holotype AVE-F-8) (cal sequence MT011068, ITS sequence MT022111, tef1 sequence MT011074, tub2 sequence MT011080); Parque das Nações, on foliar lesions of leaflets of Phoenix dactylifera (Arecaceae), 16 October 2018, Diana S. Pereira (specimen HDP 044), living culture CDP 0358 (cal sequence MT011067, ITS sequence MT004743, tef1 sequence MT011073, tub2 sequence MT011079).
Hosts: Reported from more than 45 genera and 50 species in 32 families, including Altingiaceae (Liquidambar formosana), Anacardiaceae (Mangifera indica), Arecaceae (Areca catechu, Arenga engleri, Chamaerops humilis, Chrysalidocarpus lutescens, Phoenix canariensis, P. dactylifera), Asparagaceae (Agave sp.), Betulaceae (Corylus avellana), Cannabaceae (Celtis formosana), Convolvulaceae (Ipomoea batatas), Cupressaceae (Cunninghamia lanceolata), Euphorbiaceae (Hevea brasiliensis), Fabaceae (Cercis chinensis, Delonix regia, Millettia reticulata, Pongamia pinnata, Pterocarpus indicus, Senna bicapsularis, Sesbania sp., Vicia villosa), Ginkgoaceae (Ginkgo biloba), Hamamelidaceae (Loropetalum chinense), Lauraceae (Persea americana, P. gratissima), Meliaceae (Melia azedarach), Moraceae (Ficus ampelos), Musaceae (Musa sp.), Nelumbonaceae (Nelumbo nucifera), Oleaceae (Fraxinus angustifolia, Olea europaea, Osmanthus fragrans), Oxalidaceae (Averrhoa carambola), Pandanaceae (Pandanus sp.), Phyllanthaceae (Phyllanthus emblica), Poaceae (Dendrocalamus latiflorus), Podocarpaceae (Podocarpus macrophyllus), Proteaceae (Macadamia sp.), Rhizophoraceae (Bruguiera sp.), Rosaceae (Malus domestica, Prunus persica, Pyrus bretschneideri, P. communis, P. pyrifolia), Rubiaceae (Ixora chinensis), Rutaceae (Citrus grandis, C. limon, C. reticulata, C. sinensis, Citrus sp., C. unshiu), Sapindaceae (Acer palmatum, A. Pictum, Litchi chinensis), Theaceae (Camellia oleifera, Schima superba), Vitaceae (Vitis vinifera) and Zamiaceae (Ceratozamia robusta) ([128], present study).
Distribution: Australia (including the Norfolk Island), Caucasia, China, Dominican Republic, Hong Kong, India, Iran, Iraq, Italy, Japan, Malaysia, Malta, Mexico, Netherlands, Portugal, Puerto Rico, South Africa (including KwaZulu-Natal and Mpumalanga provinces), Spain, Suriname, Taiwan, Thailand, Turkey, USA ([128], present study).
Notes: Diaporthe arecae was introduced by Srivastava et al. [38] as Subramanella arecae from Areca catechu in India and was later assigned to Diaporthe by Gomes et al. [24]. Several studies have revealed that most loci used to infer the phylogeny of Diaporthe species failed to resolve the phylogenetic position of D. arecae and its related species, insomuch that the clade has been treated as a species complex [35]. Over the years, more than 50 species from various hosts distributed worldwide have been introduced to the D. arecae species complex (DASC) (Table 5 and Table 6). The integrative taxonomic approach conducted in this study revealed that all “species” introduced in the D. arecae subclade represent intraspecific variation and were therefore synonymized under D. arecae. According to the analyses conducted here, the strains “D. eugeniae” CBS 444.82 and “D. perseae” CBS 151.73 were shown to be synonyms of D. arecae. However, the species D. eugeniae and D. perseae were not considered in the synonyms proposed here, since no type strains have been formally linked to these species. Diaporthe eugeniae (as Phomopsis eugeniae) was originally described on Eugenia aromatica from West Sumatra, Indonesia [129]. Later, Gomes et al. [24] analyzed the strain CBS 444.82 from E. aromatica in Lampung, Indonesia and considered this isolate to be authentic for D. eugeniae, but no epitype was formally designated since the isolate proved to be sterile. Diaporthe perseae (as P. perseae) was originally described from branches of dying Persea gratissima trees in Russia [130]. Later, Gomes et al. [24] analyzed the strain CBS 151.73 from young a fruit of P. gratissima in the Netherlands Antilles and considered this strain to be authentic to D. perseae based on the morphology of its alpha conidia, but no epitype was formally designated. As no ex-type cultures exist either for D. eugeniae or D. perseae, the strains “D. eugeniae” CBS 444.82 and “D. perseae” CBS 151.73 were here assigned to D. arecae. In spite of this, since neither of these two strains are linked to the holotypes, the species epithets eugeniae and perseae could not be made synonyms of D. arecae. Although it is clear through the analyses conducted here that all “species” in the D. arecae subclade are conspecific; internal nodes and sub-branches were observed in this subclade, indicating the possibility of active divergence and speciation. Morphologically speaking, all “species” harbor fusoid to ellipsoid alpha conidia and filiform, curved to hamate beta conidia of considerably overlapping dimensions, a common absence of gamma conidia (observed only in D. limonicola, D. musigena and “D. perseae”), as well as conidiomata, conidiophores and/or conidiogenous cells that lie within the same size ranges (Table 5). Considering the morphological data available for the “species” synonymized here, the mean dimensions of the alpha and beta conidia produced by D. arecae strains are 6.07–8.49 × 1.93–2.7 μm (mean L/W = 1.96–4.60) and 18.60–29.14 × 1.02–1.53 μm (mean L/W = 10.25–30.00), respectively, which clearly overlap the dimensions reported for the type specimen of D. arecae (CBS H-7808; alpha and beta conidia dimensions = 7.2–9.6 × 2.4 μm and 14.4–24 × 1.2 μm, respectively) (Table 5). Thus, except for the production of gamma conidia observed in the aforementioned “species”, the morphology of the asexual morph of all D. arecae strains match the original description reported by Srivastava et al. [38]. The three isolates from foliar lesions of palms in Lisbon, Portugal (CDP 0047, CDP 0358 and CDP 0460) are also morphologically similar to the type specimen of D. arecae [38] (Figure 9). Considering the strain characterized here (CDP 0358) and the type specimen of D. arecae (CBS H-7808), both produce hyaline, aseptate and ellipsoid alpha conidia of overlapping dimensions (5.76–8.88 × 1.62–3.08 μm and 7.2–9.6 × 2.4 μm, respectively) [38]. Nevertheless, the production of beta conidia has not been observed for any of the strains characterized in the present study, as already reported for other “species” introduced in the D. arecae subclade. The morphological differences observed among the D. arecae strains fit in well with the extensive plasticity that the Diaporthe genus is known to exhibit. The phenotypic plasticity of D. arecae has been well observed in the three isolates from foliar lesions of palms characterized in this study. While all three isolates tend to develop stromatic, uni- to multilocular, inostiolate pycnidial conidiomata of variable shape and size when grown on PDA, the pycnidia produced when grown on WA are non-stromatic, unilocular, ostiolate, globose to subglobose and much less variable in size. Interestingly, the stromatic pycnidial conidiomata observed on PDA highly resemble the pycnosclerotia described by Srivastava et al. [38] for the type of D. arecae specimen, which are also multiloculate and inostiolate. Moreover, while long, cylindrical, unbranched or branched paraphyses, that later often function as conidiogeneous cells, are observed in the conidiogeneous layer of all three isolates when they are grown on PDA, the pycnidia produced when grown on WA lack paraphyses. Thus, the morphological variability among taxa belonging to the D. arecae subclade, such as the absence or presence of paraphyses, beta- or gamma-conidia (Table 5), are likely to be a result of character plasticity due to environmental conditions. No relevant variation in micromorphology was observed between the strains from foliar lesions of palms and all three strains present very similar alpha conidial dimensions and remarkably similar alpha conidia L/W ratios (mean = 8.24 × 2.38 μm, L/W = 3.49 for CDP 0047, 7.38 × 2.23, L/W = 3.33 for CDP 0358 and 7.53 × 2.31 µm, L/W = 3.33 for CDP 0460). Diaporthe arecae has not previously been reported in Portugal, representing a new geographical record. Moreover, this is the first time this species has been recorded on Chamaerops humilis, representing a new host record. The isolates of D. arecae studied here were recorded from foliar lesions of palms, but their pathogenicity has not been tested. However, D. arecae has been introduced as causing the severe post-harvest fruit rot of A. catechu [38] and has already been recorded on leaf spots of A. catechu [65] and Chrysalidocarpus lutescens [110]. Other palm tree species known to be hosts of D. arecae include Arenga engleri [24], Calamus castaneus [67], Phoenix canariensis [26] and P. dactylifera ([24], present study). Although D. arecae has primarily been described from palms and is frequently reported on Arecaceae hosts, the geo–ecological data for the isolates recognized here as D. arecae suggests that this species has a widespread distribution and a broad host range as a pathogen, endophyte or saprobe, e.g., refs. [21,104,105,107,114,124] (Table 6).

5. Discussion

Given the overlap in morphological features, coupled with morphological plasticity, Phylogenetic Species Recognition (PSR) has become the standard methodology for the identification of species in Diaporthe [13,23,24,25,26,27]. However, most Diaporthe spp. have been introduced in recent years as well-supported terminal clades based on gene concatenation, without looking for incongruences between individual gene trees or evaluating the lack of gene flow between populations. Therefore, a spurious proliferation in the number of Diaporthe species has been observed. This is largely attributed to the intraspecific variability of the genus, that hinders the interpretation of phylogenetic analyses and has been erroneously used to delimit species [13,23,24,26]. In this regard, following a survey of leaf-spotting fungi associated with palm trees in Lisbon, Portugal, the present study aimed to clarify the boundaries of species within the Diaporthe arecae species complex (DASC) by implementing an integrative taxonomic approach. Three species—D. arecae, D. chiangmaiensis and D. smilacicola—have been recognized in the complex, and fifty-two previously introduced species were shown to be synonyms of D. arecae. To the best of authors’ knowledge, this is the first study to establish a robust circumscription of species in the DASC.
It has long been argued that species circumscription should be based on the simultaneous and rigorous application of multilocus analyses and genealogical concordance [44,131]. Genealogical Concordance Phylogenetic Species Recognition (GCPSR) has been shown to have profound implications for accurate species recognition, and resolution of complexes of cryptic taxa [78,132,133] and has already been successfully applied to resolve cryptic species of common phytopathogenic genera, such as Armillaria [134], Fusarium [135,136], Plagiostoma [137], Phyllosticta [138], Colletotrichum [139,140,141] and Calonectria [142], as well as Diaporthe [9,23,36,37]. In the present study, phylogenetic analyses of combined datasets revealed some well-supported clades within the DASC, previously interpreted as different species. However, most of the taxa composing these clades showed phylogenetic discordance in the individual phylograms, revealing incongruent nodes, conflicting branches, a lack of phylogenetic support and frequently displayed a polyphyletic or paraphyletic nature in some individual phylograms. Moreover, genealogical concordance and genealogical non-discordance criteria indicated that the node delimiting the DASC represents the transition from concordant to incongruent branches and three independent evolutionary lineages (IEL) were recognized within the DASC as mentioned above. The incongruences observed between individual gene genealogies suggest that the loci used for phylogenetic inferences of the DASC may harbor different evolutionary histories [46,47,50]. A similar result has also been inferred from the incongruence length difference (ILD) tests performed, which indicated that the loci were not congruent and should be analyzed separately [143]. Therefore, the concatenation of different loci for phylogenetic inferences within the DASC is an inadequate approach, as it tends to overestimate species diversity. Moreover, the conflict observed among gene trees can be reasonably explained by recombination events among individuals within a species, which in turn may indicate a lack of reproductive isolation [144,145,146,147]. Hence, given the extensive incongruent lineages observed among taxa within the D. arecae subclade, the GCPSR principle indicates that they are conspecific, representing a single IEL. Accordingly, it is suggested that 52 species previously described in the D. arecae subclade represent intraspecific variability, which is supported by the population genetic diversity analyses.
The degree of genetic diversity within the DASC revealed a high haplotype diversity above 95% and a substantial low nucleotide diversity for all loci and combined datasets. This is indicative of a high number of haplotypes that differ by only small differences that may be due to new polymorphisms [148]. As described by Grant and Bowen [149], the combination of high haplotype diversity and low nucleotide diversity can be a signature of a rapid demographic expansion from a small effective population size that enhances the retention of new mutations. Thus, it is hypothesized here that the DASC might be under a recent population expansion, which is consistent with the large number of unique haplotypes and polymorphic sites found in all loci and combined datasets. Further evidence for an excess of new mutations concomitant with recent population size expansion was suggested by the negative values of Tajima’s D neutrality test [150]. While positive significant Tajima’s D values are indicative of a balancing selection, where the absence of significant recombination maintains advantageous genetic diversity, negative significant Tajima’s D values suggest an excess of rare alleles in the population that have arisen after the fixation of a new beneficial genetic variant [97,151]. Thus, the present results suggest that the DASC may have escaped from an equilibrium model of evolution, which can be explained by recombination events, occurring mainly in ITS and tef1 loci. This hypothesis was also corroborated by the topology of the phylogenetic networks built for the DASC.
Phylogenetic networks are a generalization of phylogenetic trees, used to display more complex evolutionary histories. They allow the representation of non-treelike evolutionary events (reticulations), such as recombination, hybridization and horizontal gene transfer, and thus, can be interpreted as a visualization of contradictory phylogenetic information [90,152,153]. The phylogenetic networks of the DASC were composed by parallel edges and boxlike polygons among virtually all taxa belonging to the D. arecae subclade, a characteristic of the presence of recombination events within the dataset. Thus, the present results suggest that the DASC is a population that may have undergone a recent expansion, which is mainly related to the D. arecae subclade that is a single entity producing a large number of offspring [148,154]. Recombination creates new genotypes by combining genetic material from distinct lineages, and in turn, enhances the population genetic diversity [155,156]. The recombination events among some taxa of the D. arecae subclade may have led to recently diverged individuals within the DASC that retained ancestral polymorphisms, as suggested by the presence of a high number of closely related haplotypes, evidencing a population under incomplete lineage sorting (ILS) [47,63]. The formulated hypotheses are in line with the existence of extensive phylogenetic incongruences between gene trees among taxa within the D. arecae subclade. Therefore, the D. arecae subclade should be considered as ongoing evolving lineages since the internal nodes and sub-branches indicate the possibility of active divergence and speciation.
Considering that gene concatenation was found to be unsuitable for species circumscription within the DASC, the above-mentioned formulated hypotheses were tested through the application of the coalescent-based methods single- and multi-rate Poisson Tree Processes (PTP and mPTP, respectively). Coalescent-based models are an efficient tool for studying the evolutionary processes that contribute to speciation, since they can infer the relationships among taxa and delimit IEL objectively even in the presence of gene–tree conflict [60]. PTP and similar coalescent-based methods use the distinct branching patterns between divergence (Poisson model) and intraspecific diversification (coalescent model) to distinguish between speciation and population processes, which is measured in terms of the number of nucleotide substitutions per site [86]. The main assumption of these methods is that within-species branching events will be substantially more frequent than between species and thus the transition between different branching patterns is the threshold used to predict species boundaries [157]. Recent studies have successfully applied coalescent methods to delimit boundaries of cryptic species complexes of fungi, where there is a dearth of distinctive morphological characters. For instance, Liu et al. [34] showed that the distinct lineages of Colletotrichum siamense sensu latu recognized as different species based on gene concatenation were recognized as a single species when applying coalescent methods. Similarly, coalescent methods have been successfully used in the identification of the number of species in the Alternaria alternata [47] and Fusarium oxysporum [48] species complexes. In the present study, both PTP and mPTP recognized three species within the DASC—D. arecae, D. chiangmaiensis and D. smilacicola—as suggested by the GCPSR principle. Moreover, both methods inferred that the D. arecae subclade should be recognized as a single species, concordant with the results suggested by population genetic diversity analyses. Thus, overestimated species in the D. arecae subclade, obtained in the concatenated multilocus analyses, were not supported by coalescent-based analyses. A few recent studies have also applied coalescent models to resolve other important species complexes in Diaporthe. Hilário et al. [36,37] applied the General Mixed Yule Coalescent (GMYC) and PTP models to reliably delimit the boundaries of D. amygdali and D. eres, which drastically reduced the number of taxa that were previously recognized as different lineages related to both species.
Phylogenetic informativeness (PI) profiles were generated to compare each locus with respect to the species hypothesis inferred based on the multilocus phylogenetic analyses. Previous studies have shown that tef1 is the most informative locus out of the five common loci used for molecular identification within the Diaporthe genus [7,9,23,30,32]. However, although tef1 locus showed the highest number of informative characters to resolve the DASC, the pairwise homoplasy index (PHI) test revealed significant intragenic recombination, and the Tajima’s D test gave significant negative values, which can be also indicative of recombination events within the population at that locus. Moreover, the individual phylograms of the cal and his3 loci were more congruent with the backbone structure of the three well-supported subclades within the DASC observed in all the multilocus analyses and predicted by the GCPSR principle. In addition, PI profiles ranked cal as the most phylogenetic informative locus to infer the species limits of the DASC. Thus, the present study suggests that the definition of the optimal set of loci that can be used for species identification in Diaporthe may depend on the clade under analysis. For the DASC, the cal locus seems to be the most appropriate locus to infer species limits, although the evolutionary relationships among taxa become better resolved and supported when all five loci are simultaneously used for phylogenetic inferences, as corroborated by previous studies, e.g., ref. [32].
Integrating PI over specific periods of time provides information for ranking loci, since the integration area will be largest for the loci that have the highest probability of substitution in the given time period [80,81]. An interesting pattern was observed in the PI profile of ITS. ITS showed the lowest informative characters to resolve the DASC, suggesting that this locus might not be suitable for species delimitation within the DASC, as already suggested for other Diaporthe species complexes [7,9,36]. Nonetheless, while ITS is the least informative locus as the tree approaches its root, a substantial peak in the PI profile of ITS corresponding to the specific relative period of time in which the D. arecae subclade radiates into several branches. This indicates that ITS ranks as the most informative marker to infer intraspecific variation within the DASC. Although ITS has been widely used in fungal systematics to delimit species and to understand evolutionary relationships [158,159], several known issues related to the effectiveness of this region have already been observed, including the overestimation and underestimation of fungal diversity [30,160,161,162]. Several studies have shown ITS to be uninformative for accurate species identification in Diaporthe due to the lack of interspecific variation [1,8,30,43], which has also been observed in the present study. Nonetheless, it might be a suitable locus to test evolutionary hypotheses, such as the occurrence of recombination between strains.
PI plots quantify and display a predicted signal without accounting for phylogenetic noise. Hence, the results presented here should be considered carefully in the light of homoplasy, which is likely to rise or diminish the utility of loci during certain periods of time different from the peak informativeness for a given profile [80,81]. A high degree of homoplasy has been detected among ITS sequences within the DASC. Homoplasy may arise from reticulation events during the evolutionary history and, as a result, can be seen as an indirect measure of recombination [163] shown to be statistically significant among ITS sequences. Thus, the ITS peak observed in the PI profiling are likely to be influenced by the presence of homoplasy among the ITS sequences.
Morphology, as well as ecological traits, are also used to delimit species of fungi. However, species defined based on morphology or ecology often comprise cryptic species when the PSR is applied [44,164,165,166]. In this regard, the formulated hypothesis, of three putative species within the DASC, was also tentatively tested for both the morphological and ecological traits of all taxa belonging to the DASC. For many years, taxonomic studies in Diaporthe have been primarily based on Morphological Species Recognition (MSR), according to which, species in the Diaporthe were diagnosed by a set of morphological characters [167,168]. However, MSR was shown to be unreliable in reflecting the evolutionary history of the genus, as morphological characters within the Diaporthe are highly conserved and display great plasticity depending on environmental conditions [14]. Similarly, in the present study, based on published taxonomic descriptions of the species belonging to the DASC, it was evident that they present morphological indistinctiveness. Due to the subjectivity of characterizing some morphological structures, a hierarchical cluster analysis (HCA) was performed based on the length-to-width (L/W) ratios of alpha and beta conidia, which are discrete and easily identifiable structures whose characterization is naturally subject to greater objectivity. Although the dendrograms of the L/W conidial ratios yielded three to five different clusters of species within the DASC, according to the conidia used in the HCA, they did not support any of the clades or subclades observed in the combined and individual phylograms. Moreover, morphological characters did not discriminate between the three species delimited within the DASC. Thus, morphological characters are not reliable in delimiting species within the DASC, which showed cryptic speciation when the L/W ratios of alpha conidia were compared. Likewise, the differences detected between the L/W ratios of alpha and beta conidia of taxa belonging to the D. arecae subclade are simply a reflection of the intraspecific variability and character plasticity of D. arecae. It is worth mentioning that using standardized media and growth conditions can probably result in more stable and reliable morphological characters for diagnosis coupled with molecular data for the species recognized within the DASC, as already suggested by Mostert et al. [14]. For instance, it has already been shown that temperatures above 30 °C or a dextrose concentration seems to influence the production of beta conidia in certain Diaporthe species [14]. Likewise, although a higher variability in the L/W of beta conidia was observed, it is more likely that it represents character plasticity than morphospecies within the DASC.
Besides morphological characters, host plants have also been extensively used in the past as a key feature in the identification of species in Diaporthe. Nonetheless, studies have long shown that one Diaporthe species colonizes more than one host species, and that host switching appears to have occurred frequently during speciation [11,18,169,170]. These observations were confirmed by the results obtained in the present study, since taxa belonging to the D. arecae subclade were introduced based on collections from several different plant hosts belonging to 25 different plant families, and two species (D. oculi and D. pseudooculi) were found to be associated with diseased human eyes [42]. Considering that the Ecological Species Recognition (ESR) diagnoses different species as a set of lineages occupying a specific ecological niche (e.g., host plant or locality), evolving separately from all other lineages [167,168], the well-supported branches recognized in a phylogenetic inference might be used as a guide to find diagnostic ecological differences between taxa belonging to these branches [34]. However, the present results also showed a clear lack of phylogeographical association among taxa belonging to the DASC, as most well-supported branches in the complex show a wide geographical distribution and are not restricted to a specific locality or host plant. The detection of significant recombination within closely related taxa should be considered as an important method to justify a species [171]. Thus, to further test the possible correlation between the genetic divergence of clades within the DASC and their ecological niche, the well-supported branches recognized in the phylogenetic inference were tested for genetic exchange to assess their evolutionary independence. According to the present results, significant genetic recombination within some branches and between some of the paired branches was detected, suggesting a lack of reproductive isolation between most species introduced in the DASC. For instance, isolates of branches b and g showed significant recombination between themselves and with isolates of all remaining branches in the phylogenetic inference, although the results are likely to be influenced by the presence of significant recombination between the branches themselves. Nevertheless, clades within which no significant recombination was detected revealed significant recombination with some other branches. Therefore, the ecological aspects of taxa within the DASC suggest an absence of host plant and/or geographic barriers to gene flow in nature, providing further evidence to support the hypotheses formulated by the phylogenetic and population genetic diversity analyses.
Although all the analyses carried out clearly showed that D. chiangmaiensis and D. smilacicola are delimited from D. arecae, significant recombination was detected between both species and the D. arecae subclade. Hence, the detection of significant recombination between these lineages may be the result of a recent speciation process, i.e., the three lineages may have radiated from a recent common ancestor, since some alleles are not expected to be reciprocally monophyletic in the initial stages of speciation [54,63]. This hypothesis is in line with the relative branch distances observed in the phylogenetic networks for D. smilacicola and D. chiangmaiensis, which appear to have just emerged from the complex reticulation of branches that constitutes the evolutionary relationships in the D. arecae subclade. Moreover, it is also supported by the incongruences observed in some of the single gene phylograms that do not present the backbone structure of three well-supported subclades within the DASC. Furthermore, the existence of a putative hybrid in Diaporthe was recently reported [43]. It is therefore worth mentioning that the three species recognized in the complex may also be linked by occasional hybridization, which would also justify the incongruences detected. However, this hypothesis could only be tested with genome-scale data and the use of a larger number of isolates of D. smilacicola and D. chiangmaiensis.
Although the analyses conducted here are clear in delimiting D. arecae, D. chiangmaiensis and D. smilacicola as three distinct sister lineages, virtually nothing is known about the ecology of these lineages, including their host ranges and lifestyles. The genetic diversity analyses performed here raise several questions regarding the speciation process in Diaporthe and how it may affect the pathology of species recognized within the DASC. The forces driving the intraspecific variation in Diaporthe species reported by a few authors, e.g., ref. [7] is still poorly explored. For instance, Manawasighe et al. [21] demonstrated that the genetic variation of D. eres associated with grapevine dieback in China were positively correlated with their geographic location. Nonetheless, the same conclusions were not obtained by Chaisiri et al. [55], who compared Chinese and European D. eres isolates and found no significant differences between the genetic diversity of the two geographical populations. Moreover, they found no association between the groups in the Chinese population of D. eres and their geographic distribution. Similarly, in the present study, there was no phylogeographic correlation between D. arecae isolates (D. arecae subclade). Therefore, it is suggested that further studies towards the genetic diversity of D. arecae and their country of origin, with a greater number of strains, should be conducted to better clarify if certain genotypes are associated with specific ecological niches.
Population divergence and its intraspecific genetic diversity has frequently impaired the interpretation of Diaporthe phylogenies and the accurate identification of Diaporthe spp. However, the problem of reliably identifying species in Diaporthe has practical consequences when studying the phylogenetic relationships in this genus due to their recurrent association with plant diseases [172]. The accurate identification and naming of fungal pathogens are essential to understand the aspects of their phytopathology, including epidemiology, disease surveillance and control, as well as plant health inspection [173,174]. In this regard, clarification of the species boundaries within the DASC significantly improves the knowledge of taxonomy and host diversity in D. arecae and highlights the unknown potential of this species as an important phytopathogenic agent. The great majority of D. arecae isolates have been reported as minor pathogens on a wide range of plant hosts, mostly associated with leaf spots [31,64,107,108,110,120,121,122,123,125], diseased branches, twigs, stems, trunks and shoots [10,21,39,41,104,117], as well as rotten plant parts [24,39,112,119]. Nonetheless, D. arecae (as S. arecae) has been introduced as a cause of severe post-harvest fruit rot of Areca catechu [38] and has also been reported (as D. limonicola and D. melitensis) to be associated with a devasting dieback disease of Citrus plants in some Europe countries [10]. Thus, the presence of certain genotypic variants of D. arecae in some hosts can lead to outbreaks of major infections. This is particularly relevant considering the current scenario of global climate change, due to which plant communities come under pressure which may facilitate the emergence of more aggressive D. arecae strains capable of colonizing new hosts [175,176]. Furthermore, changing environments may represent an opportunity for fungi to switch from an endophytic or saprophytic lifestyle to a pathogenic lifestyle [21], which would not be surprising if found in D. arecae as it has been recorded as pathogens, saprobes and endophytes on different plant hosts. For instance, the ability of D. arecae to switch from an endophytic to a pathogenic lifestyle has previously been commented on by Srivastava et al. [38] who isolated D. arecae from both rotten and healthy-looking fruits from arecanut, suggesting that D. arecae might be present in Areca catechu fruits as an endophyte or a latent pathogen.
The three isolates in this study were obtained from foliar lesions of ornamental palms, but their pathogenicity has not been proven. Moreover, this was the first report on D. arecae strains from Chamaerops humilis from Portugal, representing a new host and geographical record. Thus, future studies should aim to better understand the phytopathogenic potential of these isolates of D. arecae, especially the genotypic variant previously identified as D. chamaeropicola [64], due to its potential to represent a threat for certain important Portuguese crops, such as Vitis vinifera and Pyrus spp., from which minor pathogenic strains of D. arecae have often been isolated [21,104]. To date, Diaporthe arecae has been recorded on six different Arecaceae hosts, including Areca catechu (as S. arecae, D. limonicola and D. pseudophoenicicola) [38,65], Arenga engleri (as D. arengae) [24], Calamus castaneus (as D. arengae and D. arecae) [67], Chamaerops humilis (as D. chamaeropicola and D. pseudophoenicicola) ([64], present study), and Chrysalidocarpus lutescens (as D. chrysalidocarpi) [110], Phoenix canariensis and P. dactilyfera (as D. pseudophoenicicola) ([24,26,64], present study), indicating that this may be a frequent species of Diaporthe occurring on palms. Nonetheless, the extent of Diaporthe spp. associated with Arecaceae hosts is highly overlooked and only a few species have been studied using morphomolecular analyses, making most old records unreliable. Furthermore, the ecology of D. arecae on Arecaceae needs further research to establish its potential as a possible threat to certain palm species. Although Srivastava et al. [38] first reported D. arecae (as S. arecae) causing a severe post-harvest fruit rot of Areca catechu, subsequent records of D. arecae on Arecaceae hosts were associated with either symptomless or endophytic occurrences [105,111,113,114,126,127] and minor diseases, such as leaf spots ([64,110], present study).

6. Conclusions

Molecular analyses based on the GCPSR principle and PTP coalescent models provided strong evidence that all species previously described in the D. arecae subclade are conspecific. Further analyses, i.e., the PHI test and population genetic diversity, coupled with morphological indistinctiveness, have reinforced the absence of reproductive isolation, as well as host plant and geographic barriers to gene flow. Yet, additional analyses are needed to better understand the genetic diversity of D. arecae through the isolation of a greater number of strains, as well as to establish its phytopathogenic potential for Arecaceae hosts and other important crops worldwide. Our results suggest that speciation events in Diaporthe are highly overestimated. Previous studies have accepted well-supported clades as distinct species using phylogenetic analyses based on concatenation of multilocus DNA sequence data. However, phenotypic plasticity associated with insufficient phylogenetic resolution often misleads species identification, which is erroneously used to describe new taxa. Hence, it is here advocated that individual gene genealogies must always be checked for incongruences and carefully analyzed prior to the description of new Diaporthe species. Furthermore, this study has suggested that the optimal set of loci for species identification in Diaporthe may depend on the clade under analysis. A critical analysis of the informativeness of different loci must be carried out to clarify which of them is most likely to best infer the evolutionary relationships between taxa. In addition, upcoming studies on the Diaporthe genus should also implement coalescent methods to provide accurate support for multilocus phylogenies. The integrative taxonomic approach carried out here can clarify species boundaries in most clades where the use of highly polymorphic sequences for common loci hinders the clear interpretation of phylogenetic inferences. Therefore, this methodology provides a solid framework that can be applied for species delimitation in morphologically conserved fungi.

Supplementary Materials

The following supporting information can be downloaded at: https://www.mdpi.com/article/10.3390/microorganisms11112717/s1, Figures S1–S5: Phylogenetic trees generated from maximum likelihood analyses based on ITS, tef1, tub2, cal and his3 sequence data, respectively, for all species of the Diaporthe arecae species complex and related species. Figures S6–S8: Phylogenetic trees generated from maximum likelihood analysis for species of the Diaporthe arecae species complex and related species with available sequence data of ITS, tef1, tub2, cal and his3 (5-loci), ITS, tef1, tub2 and cal (4-loci) and ITS, tef1 and tub2 (3-loci), respectively. Figure S9: Maximum likelihood species delimitation scheme obtained from the multi-rate Poisson tree process (mPTP) analysis of the Diaporthe arecae species complex and related species, based on combined dataset of 2-loci (ITS and tef1).

Author Contributions

Conceptualization: D.S.P. and S.H.; Data curation: D.S.P.; Funding acquisition: A.J.L.P.; Investigation: D.S.P.; Methodology: D.S.P. and S.H.; Supervision: A.J.L.P.; Writing—original draft: D.S.P.; Writing—review and editing: A.J.L.P., D.S.P., M.F.M.G. and S.H. All authors have read and agreed to the published version of the manuscript.

Funding

This research was funded by the Portuguese Foundation for Science and Technology (FCT/MCTES) that finances BioISI (Biosystems and Integrative Sciences Institute) (UIDB/04046/2020 + UIDP/04046/2020) through national funds (OE) and PhD grant to Diana S. Pereira (SFRH/BD/09742/2020).

Institutional Review Board Statement

Not applicable.

Informed Consent Statement

Not applicable.

Data Availability Statement

All data generated or analysed in this study are included in this article and its supplementary information files. All sequence data are available in the NCBI GenBank, following the accession numbers in the manuscript.

Acknowledgments

M.F.M.G. and S.H. acknowledge the funding from national funds through FCT, I.P., covered by the provisions of the Decree-Law no. 57/2016 of 29th August, updated by the Law no. 57/2017 of 19th July. D.S.P. gratefully acknowledges the kind assistance of Lisa A. Castlebury of the United States Department of Agriculture (USDA)|Agricultural Research Service (ARS) in accessing information on fungus–host associations in the US National Fungus Collections Fungus-Host Database.

Conflicts of Interest

The authors declare no conflict of interest.

References

  1. Murali, T.S.; Suryanarayanan, T.S.; Geeta, R. Endophytic Phomopsis species: Host range and implications for diversity estimates. Can. J. Microbiol. 2006, 52, 673–680. [Google Scholar] [CrossRef] [PubMed]
  2. Santos, J.M.; Phillips, A.J.L. Resolving the complex of Diaporthe (Phomopsis) species occurring on Foeniculum vulgare in Portugal. Fungal Divers. 2009, 34, 111–125. [Google Scholar]
  3. Garcia-Reyne, A.; López-Medrano, F.; Morales, J.M.; Esteban, C.G.; Martín, I.; Eraña, I.; Meiie, Y.; Lalueza, A.; Alastruey-Izquierdo, A.; Rodríguez-Tudela, J.L.; et al. Cutaneous infection by Phomopsis longicolla in a renal transplant recipient from Guinea: First report of human infection by this fungus. Transpl. Infect. Dis. 2011, 13, 204–207. [Google Scholar] [CrossRef] [PubMed]
  4. Udayanga, D.; Liu, X.; McKenzie, E.H.C.; Chukeatirote, E.; Bahkali, A.H.A.; Hyde, K.D. The genus Phomopsis: Biology, applications, species concepts and names of common phytopathogens. Fungal Divers. 2011, 50, 189–225. [Google Scholar] [CrossRef]
  5. Hyde, K.D.; Nilsson, R.H.; Alias, S.A.; Ariyawansa, H.A.; Blair, J.E.; Cai, L.; de Cock, A.W.A.M.; Dissanayake, A.J.; Glockling, S.L.; Goonasekara, I.D.; et al. One stop shop: Backbones trees for important phytopathogenic genera: I. Fungal Divers. 2014, 67, 21–125. [Google Scholar] [CrossRef]
  6. Uecker, F.A. A world list of Phomopsis names with notes on nomenclature, morphology and biology. Mycol. Mem. 1988, 13, 1–231. [Google Scholar]
  7. Udayanga, D.; Castlebury, L.A.; Rossman, A.Y.; Chukeatirote, E.; Hyde, K.D. Insights into the genus Diaporthe: Phylogenetic species delimitation in the D. eres species complex. Fungal Divers. 2014, 67, 203–229. [Google Scholar] [CrossRef]
  8. Udayanga, D.; Castlebury, L.A.; Rossman, A.Y.; Hyde, K.D. Species limits in Diaporthe: Molecular re-assessment of D. citri, D. cytosporella, D. foeniculina and D. rudis. Persoonia 2014, 32, 83–101. [Google Scholar] [CrossRef]
  9. Udayanga, D.; Castlebury, L.A.; Rossman, A.Y.; Chukeatirote, E.; Hyde, K.D. The Diaporthe sojae species complex, phylogenetic re-assessment of pathogens associated with soybean, cucurbits and other field crops. Fungal Biol. 2015, 119, 383–407. [Google Scholar] [CrossRef]
  10. Guarnaccia, V.; Crous, P.W. Emerging citrus diseases in Europe caused by species of Diaporthe. IMA Fungus 2017, 8, 317–334. [Google Scholar] [CrossRef]
  11. Guarnaccia, V.; Vitale, A.; Cirvilleri, G.; Aiello, D.; Susca, A.; Epifani, F.; Perrone, G.; Polizzi, G. Characterisation and pathogenicity of fungal species associated with branch cankers and stem-end rot of avocado in Italy. Eur. J. Plant Pathol. 2016, 146, 963–976. [Google Scholar] [CrossRef]
  12. Guarnaccia, V.; Groenewald, J.Z.; Woodhall, J.; Armengol, J.; Cinelli, T.; Eichmeier, A.; Ezra, D.; Fontaine, F.; Gramaje, D.; Gutierrez-Aguirregabiria, A.; et al. Diaporthe diversity and pathogenicity revealed from a broad survey of grapevine diseases in Europe. Persoonia 2018, 40, 135–153. [Google Scholar] [CrossRef] [PubMed]
  13. Marin-Felix, Y.; Hernández-Restrepo, M.; Wingfield, M.J.; Akulov, A.; Carnegie, A.J.; Cheewangkoon, R.; Gramaje, D.; Groenewald, J.Z.; Guarnaccia, V.; Halleen, F.; et al. Genera of phytopathogenic fungi: GOPHY 2. Stud. Mycol. 2019, 92, 47–133. [Google Scholar] [CrossRef] [PubMed]
  14. Mostert, L.; Crous, P.W.; Kang, J.C.; Phillips, A.J.L. Species of Phomopsis and a Libertella sp. occurring on grapevines with specific reference to South Africa: Morphological, cultural, molecular and pathological characterization. Mycologia 2001, 93, 146–167. [Google Scholar] [CrossRef]
  15. Mostert, L.; Kang, J.C.; Crous, P.W.; Denman, S. Phomopsis saccharata sp. nov., causing a canker and die-back disease of Protea repens in South Africa. Sydowia 2001, 53, 227–235. [Google Scholar]
  16. van Rensburg, J.C.J.; Lamprecht, S.C.; Groenewald, J.Z.; Castlebury, L.A.; Crous, P.W. Characterization of Phomopsis spp. associated with die-back of rooibos (Aspalathus linearis) in South Africa. Stud. Mycol. 2016, 55, 65–74. [Google Scholar] [CrossRef]
  17. Diogo, E.L.F.; Santos, J.M.; Phillips, A.J.L. Phylogeny, morphology and pathogenicity of Diaporthe and Phomopsis species on almond in Portugal. Fungal Divers. 2010, 44, 107–115. [Google Scholar] [CrossRef]
  18. Thompson, S.; Tan, Y.; Young, A.; Neate, S.; Aitken, E.; Shivas, R. Stem cankers on sunflower (Helianthus annuus) in Australia reveal a complex of pathogenic Diaporthe (Phomopsis) species. Persoonia 2011, 27, 80–89. [Google Scholar] [CrossRef]
  19. Thompson, S.M.; Tan, Y.P.; Shivas, R.G.; Neate, S.M.; Morin, L.; Bissett, A.; Aitken, E.A.B. Green and brown bridges between weeds and crops reveal novel Diaporthe species in Australia. Persoonia 2015, 35, 39–49. [Google Scholar] [CrossRef]
  20. Díaz, G.A.; Latorre, B.A.; Lolas, M.; Ferrada, E.; Naranjo, P.; Zoffoli, J.P. Identification and characterization of Diaporthe ambigua, D. australafricana, D. novem, and D. rudis causing a postharvest fruit rot in kiwifruit. Plant Dis. 2017, 101, 1402–1410. [Google Scholar] [CrossRef]
  21. Manawasinghe, I.S.; Dissanayake, A.J.; Li, X.; Liu, M.; Wanasinghe, D.N.; Xu, J.; Zhao, W.; Zhang, W.; Zhou, Y.; Hyde, K.D.; et al. High genetic diversity and species complexity of Diaporthe associated with grapevine dieback in China. Front. Microbiol. 2019, 10, 1936. [Google Scholar] [CrossRef] [PubMed]
  22. Wingfield, M.J.; de Beer, Z.W.; Slippers, B.; Wingfield, B.D.; Groenewald, J.Z.; Lombard, L.; Crous, P.W. One fungus, one name promotes progressive plant pathology. Mol. Plant Pathol. 2012, 13, 604–613. [Google Scholar] [CrossRef] [PubMed]
  23. Udayanga, D.; Liu, X.; Crous, P.W.; McKenzie, E.H.C.; Chukeatirote, E.; Hyde, K.D. A multi-locus phylogenetic evaluation of Diaporthe (Phomopsis). Fungal Divers. 2012, 56, 157–171. [Google Scholar] [CrossRef]
  24. Gomes, R.R.; Glienke, C.; Videira, S.I.R.; Lombard, L.; Groenewald, J.Z.; Crous, P.W. Diaporthe: A genus of endophytic, saprobic and plant pathogenic fungi. Persoonia 2013, 31, 1–41. [Google Scholar] [CrossRef] [PubMed]
  25. Dissanayake, A.J.; Phillips, A.J.L.; Hyde, K.D.; Yan, J.; Li, X. The current status of species in Diaporthe. Mycosphere 2017, 8, 1106–1156. [Google Scholar] [CrossRef]
  26. Gao, Y.; Liu, F.; Duan, W.; Crous, P.W.; Cai, L. Diaporthe is paraphyletic. IMA Fungus 2017, 8, 153–187. [Google Scholar] [CrossRef] [PubMed]
  27. Norphanphoun, C.; Gentekaki, E.; Hongsanan, S.; Jayawardena, R.; Senanayake, I.C.; Manawasinghe, I.S.; Abeywickrama, P.D.; Bhunjun, C.S.; Hyde, K.D. Diaporthe: Formalizing the species-group concept. Mycosphere 2022, 13, 752–819. [Google Scholar] [CrossRef]
  28. Crous, P.W.; Gams, W.; Stalpers, J.A.; Robert, V.; Stegehuis, G. MycoBank: An online initiative to launch mycology into the 21st century. Stud. Mycol. 2004, 50, 19–22. [Google Scholar]
  29. Wehmeyer, L.E. The genus Diaporthe Nitschke and its segregates. Univ. Mich. Stud. Sci. Ser. 1993, 9, 1–349. [Google Scholar]
  30. Santos, J.M.; Correia, V.G.; Phillips, A.J.L. Primers for mating-type diagnosis in Diaporthe and Phomopsis: Their use in teleomorph induction in vitro and biological species definition. Fungal Biol. 2010, 114, 255–270. [Google Scholar] [CrossRef]
  31. Udayanga, D.; Liu, X.; McKenzie, E.H.C.; Chukeatirote, E.; Hyde, K.D. Multi-locus phylogeny reveals three new species of Diaporthe from Thailand. Cryptogam. Mycol. 2012, 33, 295–309. [Google Scholar] [CrossRef]
  32. Santos, L.; Alves, A.; Alves, R. Evaluating multi-locus phylogenies for species boundaries determination in the genus Diaporthe. PeerJ 2017, 5, e3120. [Google Scholar] [CrossRef] [PubMed]
  33. Senanayake, I.C.; Crous, P.W.; Groenewald, J.Z.; Maharachchikumbura, S.S.N.; Jeewon, R.; Phillips, A.J.L.; Bhat, J.D.; Perera, R.H.; Li, Q.R.; Li, W.J.; et al. Families of Diaporthales based on morphological and phylogenetic evidence. Stud. Mycol. 2017, 86, 217–296. [Google Scholar] [CrossRef] [PubMed]
  34. Liu, F.; Wang, M.; Damm, U.; Crous, P.W.; Cai, L. Species boundaries in plant pathogenic fungi: A Colletotrichum case study. BMC Plant Biol. 2016, 16, 81. [Google Scholar] [CrossRef]
  35. Huang, F.; Udayanga, D.; Wang, X.; Hou, X.; Mei, X.; Fu, Y.; Hyde, K.D.; Li, H. Endophytic Diaporthe associated with Citrus: A phylogenetic reassessment with seven new species from China. Fungal Biol. 2015, 119, 331–347. [Google Scholar] [CrossRef]
  36. Hilário, S.; Gonçalves, M.F.M.; Alves, A. Using genealogical concordance and coalescent-based species delimitation to assess species boundaries in the Diaporthe eres complex. J. Fungi 2021, 25, 507. [Google Scholar] [CrossRef]
  37. Hilário, S.; Santos, L.; Alves, A. Diaporthe amygdali, a species complex or a complex species? Fungal Biol. 2021, 125, 505–518. [Google Scholar] [CrossRef]
  38. Srivastava, H.C.; Banu, Z.; Govindarajan, V.S. Fruit rot of areca nut caused by a new fungus. Mycologia 1962, 54, 5–11. [Google Scholar] [CrossRef]
  39. Tan, Y.P.; Edwards, J.; Grice, K.R.E.; Shivas, R.G. Molecular phylogenetic analysis reveals six new species of Diaporthe from Australia. Fungal Divers. 2013, 61, 251–260. [Google Scholar] [CrossRef]
  40. Arciuolo, R.; Santos, C.; Soares, C.; Castello, G.; Spigolon, N.; Chiusa, G.; Lima, N.; Battilani, P. Molecular characterization of Diaporthe species associated with hazelnut defects. Front. Plant Sci. 2020, 11, 611655. [Google Scholar] [CrossRef]
  41. Dissanayake, A.J.; Zhang, W.; Liu, M.; Hyde, K.D.; Zhao, W.S.; Li, X.; Yan, J. Diaporthe species associated with peach tree dieback in Hubei, China. Mycosphere 2017, 8, 533–549. [Google Scholar] [CrossRef]
  42. Ozawa, K.; Mochizuki, K.; Takagi, D.; Ishida, K.; Sunada, A.; Ohkusu, K.; Kamei, K.; Hashimoto, A.; Tanaka, K. Identification and antifungal sensitivity of two new species of Diaporthe isolated. J. Infect. Chemother. 2019, 25, 96–103. [Google Scholar] [CrossRef]
  43. Hilário, S.; Santos, L.; Phillips, A.J.L.; Alves, A. Caveats of the internal transcribed spacer region as a barcode to resolve species boundaries in Diaporthe. Fungal Biol. 2022, 126, 54–74. [Google Scholar] [CrossRef] [PubMed]
  44. Taylor, J.W.; Jacobson, D.J.; Kroken, S.; Kasuga, T.; Geiser, D.M.; Hibbett, D.S.; Fisher, M.C. Phylogenetic species recognition and species concepts in fungi. Fungal Genet. Biol. 2000, 31, 21–32. [Google Scholar] [CrossRef] [PubMed]
  45. Maddison, W.P. Gene trees in species trees. Syst. Biol. 1997, 46, 523–536. [Google Scholar] [CrossRef]
  46. Kubatko, L.S.; Degnan, J.H. Inconsistency of phylogenetic estimates from concatenated data under coalescence. Syst. Biol. 2007, 56, 17–24. [Google Scholar] [CrossRef] [PubMed]
  47. Stewart, J.E.; Timmer, L.W.; Lawrence, C.B.; Pryor, B.M.; Peever, T.L. Discord between morphological and phylogenetic species boundaries: Incomplete lineage sorting and recombination results in fuzzy species boundaries in an asexual fungal pathogen. BMC Evol. Biol. 2014, 14, 38. [Google Scholar] [CrossRef]
  48. Achari, S.R.; Kaur, J.; Dinh, Q.; Mann, R.; Sawbridge, T.; Summerell, B.A.; Edwards, J. Phylogenetic relationship between Australian Fusarium oxysporum isolates and resolving the species complex using the multispecies coalescent model. BMC Genom. 2020, 21, 248. [Google Scholar] [CrossRef]
  49. Avise, J.C.; Ball, R.M., Jr. Principles of genealogical concordance in species concepts and biological taxonomy. In Oxford Surveys in Evolutionary Biology; Futuyma, D., Antonovics, J., Eds.; Oxford University Press: Oxford, UK, 1990; Volume 7, pp. 45–67. [Google Scholar]
  50. Carstens, B.C.; Knowles, L.L. Estimating species phylogeny from gene-tree probabilities despite incomplete lineage sorting: An example from Melanoplus grasshoppers. Syst. Biol. 2007, 56, 400–411. [Google Scholar] [CrossRef]
  51. Degnan, J.H.; Rosenberg, N.A. Gene tree discordance, phylogenetic inference and the multispecies coalescent. Trends Ecol. Evol. 2009, 24, 332–340. [Google Scholar] [CrossRef]
  52. Kubatko, L.S.; Carstens, B.C.; Knowles, L.L. STEM: Species tree estimation using maximum likelihood for gene trees under coalescence. Bioinformatics 2009, 25, 9–973. [Google Scholar] [CrossRef]
  53. Eckert, A.J.; Carstens, B.C. Does gene flow destroy phylogenetic signal? The performance of three methods for estimating species phylogenies in the presence of gene flow. Mol. Phylogenet. Evol. 2008, 49, 832–842. [Google Scholar] [CrossRef] [PubMed]
  54. Rannala, B.; Yang, Z. Species Delimitation. In Phylogenetics in the Genomic Era; Scornavacca, C., Delsuc, F., Galtier, N., Eds.; No Commercial Publisher, 2020; Chapter 5.5; pp. 5.5:1–5.5:18. Available online: https://hal.inria.fr/PGE (accessed on 15 June 2023).
  55. Chaisiri, C.; Liu, X.; Lin, Y.; Fu, Y.; Zhu, F.; Luo, C. Phylogenetic and haplotype network analyses of Diaporthe eres species in China based on sequences of multiple loci. Biology 2021, 10, 179. [Google Scholar] [CrossRef] [PubMed]
  56. Rannala, B.; Yang, Z. Bayes estimation of species divergence times and ancestral population sizes using DNA sequences from multiple loci. Genetics 2003, 164, 1645–1656. [Google Scholar] [CrossRef] [PubMed]
  57. Edwards, S.V. Is a new and general theory of molecular systematics emerging? Evolution 2009, 63, 1–19. [Google Scholar] [CrossRef]
  58. Liu, L.; Wu, S.; Yu, L. Coalescent methods for estimating species trees from phylogenomic data. J. Syst. Evol. 2015, 53, 380–390. [Google Scholar] [CrossRef]
  59. Jiao, X.; Flouri, T.; Yang, Z. Multispecies coalescent and its applications to infer species phylogenies and cross-species gene flow. Natl. Sci. Rev. 2021, 8, nwab127. [Google Scholar] [CrossRef]
  60. Fujita, M.K.; Leaché, A.D.; Burbrink, F.T.; McGuire, J.A.; Moritz, C. Coalescent-based species delimitation in an integrative taxonomy. Trends Ecol. Evol. 2012, 27, 480–488. [Google Scholar] [CrossRef]
  61. Mirarab, S.; Nakhleh, L.; Warnow, T. Multispecies coalescent: Theory and applications in phylogenetics. Annu. Rev. Ecol. Evol. Syst. 2021, 52, 247–268. [Google Scholar] [CrossRef]
  62. Bustamante, D.E.; Oliva, M.; Leiva, S.; Mendoza, J.E.; Bobadilla, L.; Angulo, G.; Calderon, M.S. Phylogeny and species delimitations in the entomopathogenic genus Beauveria (Hypocreales, Ascomycota), including the description of B. peruviensis sp. nov. MycoKeys 2019, 58, 47–68. [Google Scholar] [CrossRef]
  63. Boluda, C.G.; Rico, V.J.; Divakar, P.K.; Nadyeina, O.; Myllys, L.; McMullin, R.T.; Zamora, J.C.; Scheidegger, C.; Hawksworth, D.L. Evaluating methodologies for species delimitation: The mismatch between phenotypes and genotypes in lichenized fungi (Bryoria sect. Implexae, Parmeliaceae). Persoonia 2019, 42, 75–100. [Google Scholar] [CrossRef]
  64. Boonmee, S.; Wanasinghe, D.N.; Calabon, M.S.; Huanraluek, N.; Chandrasiri, S.K.U.; Jones, G.E.B.; Rossi, W.; Leonardi, M.; Singh, S.K.; Rana, S.; et al. Fungal diversity notes 1387–1511: Taxonomic and phylogenetic contributions on genera and species of fungal taxa. Fungal Divers. 2021, 111, 1–335. [Google Scholar] [CrossRef]
  65. Pereira, D.S.; Phillips, A.J.L. Botryosphaeriaceae on palms—A new species of Neodeightonia, N. chamaeropicola, and new records from diseased foliage of ornamental palms in Portugal. Phytotaxa, 2023; submitted. [Google Scholar]
  66. Xu, G.; Qiu, F.; Li, X.; Zheng, F.-Q.; Zheng, L.; Miao, W.G.; Xie, C.P. Diaporthe limonicola causing leaf spot disease on Areca catechu in China. Plant Dis. 2020, 104, 1869. [Google Scholar] [CrossRef]
  67. Azuddin, N.F.; Mohd, M.H.; Rosely, N.F.N.; Mansor, A.; Zakaria, L. Molecular phylogeny of endophytic fungi from rattan (Calamus castaneus Griff.) spines and their antagonistic activities against plant pathogenic fungi. J. Fungi 2021, 7, 301. [Google Scholar] [CrossRef] [PubMed]
  68. Thompson, J.D.; Gibson, T.J.; Plewniak, F.; Jeanmougin, F.; Higgins, D.G. The ClustalX windows interface: Flexible strategies for multiple sequence alignment aided by quality analysis tools. Nucleic Acids Res. 1997, 25, 4876–4882. [Google Scholar] [CrossRef] [PubMed]
  69. Hall, T.A. BioEdit: A user-friendly biological sequence alignment editor and analysis program for Windows 95/98/NT. Nucleic Acids Symp. Ser. 1999, 41, 95–98. [Google Scholar]
  70. Kumar, S.; Stecher, G.; Li, M.; Knyaz, C.; Tamura, K. MEGA X: Molecular evolutionary genetics analysis across computing platforms. Mol. Biol. Evol. 2018, 35, 1547–1549. [Google Scholar] [CrossRef]
  71. Farris, J.S.; Kallersjo, M.; Kluge, A.G.; Bult, C. Testing significance of congruence. Cladistics 1994, 10, 315–319. [Google Scholar] [CrossRef]
  72. Swofford, D.L. PAUP*. Phylogenetic Analysis Using Parsimony (*and Other Methods); Version 4.0a165; Sinauer Associates: Sunderland, MA, USA, 2002. [Google Scholar]
  73. Miller, M.A.; Pfeiffer, W.; Schwartz, T. Creating the CIPRES Science Gateway for inference of large phylogenetic trees. In Proceedings of the 2010 Gateway Computing Environments Workshop (GCE), New Orleans, LA, USA, 14 November 2010; pp. 1–8. [Google Scholar]
  74. Kozlov, A.M.; Darriba, D.; Flouri, T.; Morel, B.; Stamatakis, A. RAxML-NG: A fast, scalable and user-friendly tool for maximum likelihood phylogenetic inference. Bioinformatics 2019, 35, 4453–4455. [Google Scholar] [CrossRef]
  75. Ronquist, F.; Teslenko, M.; van der Mark, P.; Ayres, D.L.; Darling, A.; Höhna, S.; Larget, B.; Liu, L.; Suchard, M.A.; Huelsenbeck, J.P. MrBayes 3.2: Efficient Bayesian phylogenetic inference and model choice across a large model space. Syst. Biol. 2012, 61, 539–542. [Google Scholar] [CrossRef]
  76. Rambaut, A. FigTree v1.4.4; 2018. Available online: http://tree.bio.ed.ac.uk/software/figtree/ (accessed on 15 June 2023).
  77. Xi, Z.; Liu, L.; Davis, C.C. The impact of missing data on species tree estimation. Mol. Biol. Evol. 2016, 33, 838–860. [Google Scholar] [CrossRef] [PubMed]
  78. Dettman, J.R.; Jacobson, D.J.; Taylor, J.W. A multilocus genealogical approach to phylogenetic species recognition in the model eukaryote Neurospora. Evolution 2003, 57, 2703–2720. [Google Scholar] [PubMed]
  79. Dettman, J.R.; Jacobson, D.J.; Taylor, J.W. Multilocus sequence data reveal extensive phylogenetic species diversity within the Neurospora discreta complex. Mycologia 2006, 98, 436–446. [Google Scholar] [CrossRef] [PubMed]
  80. Townsend, J.P. Profiling phylogenetic informativeness. Syst. Biol. 2007, 56, 222–231. [Google Scholar] [CrossRef] [PubMed]
  81. López-Giráldez, F.; Townsend, J.P. PhyDesign: An online application for profiling phylogenetic informativeness. BMC Evol. Biol. 2011, 11, 152. [Google Scholar] [CrossRef]
  82. Mello, B. Estimating TimeTrees with MEGA and the TimeTree Resource. Mol. Biol. Evol. 2018, 35, 2334–2342. [Google Scholar] [CrossRef]
  83. Tamura, K.; Battistuzzi, F.U.; Billing-Ross, P.; Murillo, O.; Filipski, A.; Kumar, S. Estimating divergence times in large molecular phylogenies. Proc. Natl. Acad. Sci. USA 2012, 109, 19333–19338. [Google Scholar] [CrossRef]
  84. Tamura, K.; Qiqing, T.; Kumar, S. Theoretical foundation of the RelTime method for estimating divergence times from variable evolutionary rates. Mol. Biol. Evol. 2018, 35, 1770–1782. [Google Scholar] [CrossRef]
  85. Pond, S.L.K.; Frost, S.D.W.; Muse, S.V. HyPhy: Hypothesis testing using phylogenies. Bioinformatics 2015, 21, 676–679. [Google Scholar] [CrossRef]
  86. Zhang, J.; Kapli, P.; Pavlidis, P.; Stamatakis, A. A general species delimitation method with applications to phylogenetic placements. Bioinformatics 2013, 29, 2869–2876. [Google Scholar] [CrossRef]
  87. Kapli, P.; Lutteropp, S.; Zhang, J.; Kobert, K.; Pavlidis, P.; Stamatakis, A.; Flouri, T. Multi-rate Poisson tree processes for single-locus species delimitation under maximum likelihood and Markov chain Monte Carlo. Bioinformatics 2017, 33, 1630–1638. [Google Scholar] [CrossRef] [PubMed]
  88. Nute, M.; Chou, J.; Molloy, E.K.; Warnow, T. The performance of coalescent-based species tree estimation methods under models of missing data. BMC Genom. 2018, 19, 286. [Google Scholar] [CrossRef]
  89. Bruen, T.C.; Philippe, H.; Bryant, D. A simple and robust statistical test for detecting the presence of recombination. Genetics 2006, 172, 2665–2681. [Google Scholar] [CrossRef] [PubMed]
  90. Huson, D.H.; Bryant, D. Application of phylogenetic networks in evolutionary studies. Mol. Biol. Evol. 2006, 23, 254–267. [Google Scholar] [CrossRef] [PubMed]
  91. Steel, M.A. Recovering a tree from the leaf colorations it generates under a Markov model. Appl. Math. Lett. 1994, 7, 19–24. [Google Scholar] [CrossRef]
  92. Bryant, D.; Moulton, V. Neighbor-Net: An agglomerative method for the construction of phylogenetic networks. Mol. Biol. Evol. 2004, 21, 255–265. [Google Scholar] [CrossRef]
  93. Rozas, J.; Ferrer-Mata, A.; Sánchez-DelBarrio, J.C.; Guirao-Rico, S.; Librado, P.; Ramos-Onsins, S.E.; Sánchez-Gracia, A. DnaSP 6: DNA sequence polymorphism analysis of large data sets. Mol. Biol. Evol. 2017, 34, 3299–3302. [Google Scholar] [CrossRef]
  94. Nei, M. Molecular Evolutionary Genetics; Columbia University Press: New York, NY, USA, 1987. [Google Scholar]
  95. Tajima, F. Evolutionary relationship of DNA sequences in finite populations. Genetics 1983, 105, 437–460. [Google Scholar] [CrossRef]
  96. Watterson, G.A. On the number of segregating sites in genetical models without recombination. Theor. Pop. Biol. 1975, 7, 256–276. [Google Scholar] [CrossRef]
  97. Tajima, F. Statistical method for testing the neutral mutation hypothesis by DNA polymorphism. Genetics 1989, 123, 585–595. [Google Scholar]
  98. R Core Team. R: A Language and Environment for Statistical Computing; R Foundation for Statistical Computing: Vienna, Austria, 2021; Available online: https://www.R-project.org/ (accessed on 15 June 2023).
  99. Maechler, M.; Rousseeuw, P.; Struyf, A.; Hubert, M.; Hornik, K. Cluster: Cluster Analysis Basics and Extensions. R Package Version 2.1.4. 2022. Available online: https://CRAN.R-project.org/package=cluster (accessed on 15 June 2023).
  100. Kassambara, A.; Mundt, F. Factoextra: Extract and Visualize the Results of Multivariate Data Analyses. R Package Version 1.0.7. 2020. Available online: https://CRAN.R-project.org/package=factoextra (accessed on 15 June 2023).
  101. Galili, T. Dendextend: An R package for visualizing, adjusting, and comparing trees of hierarchical clustering. Bioinformatics 2015, 31, 3718–3720. [Google Scholar] [CrossRef]
  102. Charrad, M.; Ghazzali, N.; Boiteau, V.; Niknafs, A. NbClust: An r package for determining the relevant number of clusters in a data set. J. Stat. Softw. 2014, 61, 1–36. [Google Scholar] [CrossRef]
  103. Sokal, R.R.; Rohlf, F.J. The comparison of dendrograms by objective methods. Taxon 1962, 11, 33–40. [Google Scholar] [CrossRef]
  104. Guo, Y.S.; Crous, P.W.; Bai, Q.; Fu, M.; Yang, M.M.; Wang, X.H.; Du, Y.M.; Hong, N.; Xu, W.X.; Wang, G.P. High diversity of Diaporthe species associated with pear shoot canker in China. Persoonia 2020, 45, 132–162. [Google Scholar] [CrossRef] [PubMed]
  105. Zhou, H.; Hou, C.L. Three new species of Diaporthe from China based on morphological characters and DNA sequence data analyses. Phytotaxa 2019, 422, 157–174. [Google Scholar] [CrossRef]
  106. Chang, C.Q.; Cheng, Y.H.; Xiang, M.H.; Jiang, Z.D.; Chi, P.K. New species of Phomopsis on woody plants in Fujian province. Mycosystema 2005, 24, 6–11. [Google Scholar]
  107. Yang, Q.; Tang, J.; Zhou, G.Y. Characterization of Diaporthe species on Camellia oleifera in Hunan Province, with descriptions of two new species. MycoKeys 2021, 84, 15–33. [Google Scholar] [CrossRef]
  108. Crous, P.W.; Summerell, B.A.; Shivas, R.G.; Romberg, M.; Mel’nik, V.A.; Verkley, G.J.M.; Groenewald, J.Z. Fungal Planet description sheets: 92–106. Persoonia 2011, 27, 130–162. [Google Scholar] [CrossRef]
  109. Yang, Q.; Fan, X.L.; Guarnaccia, V.; Tian, C.M. High diversity of Diaporthe species associated with dieback diseases in China, with twelve new species described. MycoKeys 2018, 39, 97–149. [Google Scholar] [CrossRef]
  110. Huang, S.T.; Xia, J.W.; Zhang, X.G.; Sun, W.X. Morphological and phylogenetic analyses reveal three new species of Diaporthe from Yunnan, China. MycoKeys 2021, 78, 49–77. [Google Scholar] [CrossRef]
  111. Perera, R.H.; Hyde, K.D.; Maharachchikumbura, S.S.N.; Jones, E.B.G.; McKenzie, E.H.C.; Stadler, M.; Lee, H.B.; Samarakoon, M.C.; Ekanayaka, A.H.; Camporesi, E.; et al. Fungi on wild seeds and fruits. Mycosphere 2020, 11, 2108–2480. [Google Scholar] [CrossRef]
  112. Wrona, C.J.; Mohankumar, V.; Schoeman, M.H.; Tan, Y.P.; Shivas, R.G.; Jeff-Ego, O.S.; Akinsanmi, O.A. Phomopsis husk rot of macadamia in Australia and South Africa caused by novel Diaporthe species. Plant Pathol. 2020, 69, 911–921. [Google Scholar] [CrossRef]
  113. Dong, Z.; Manawasinghe, I.S.; Huang, Y.; Shu, Y.; Phillips, A.J.L.; Dissanayake, A.J.; Hyde, K.D.; Xiang, M.; Luo, M. Endophytic Diaporthe associated with Citrus grandis cv. Tomentosa in China. Front. Microbiol. 2021, 11, 1–20. [Google Scholar] [CrossRef]
  114. Dayarathne, M.C.; Jones, E.B.G.; Maharachchikumbura, S.S.N.; Devadatha, B.; Sarma, V.V.; Khongphinitbunjong, K.; Chomnunti, P.; Hyde, K.D. Morpho-molecular characterization of microfungi associated with marine based habitats. Mycosphere 2020, 11, 1–188. [Google Scholar] [CrossRef]
  115. Rossman, A.Y.; Allen, W.C.; Braun, U.; Castlebury, L.A.; Chaverri, P.; Crous, P.W.; Hawksworth, D.L.; Hyde, K.D.; Johnston, P.; Lombard, L.; et al. Overlooked competing asexual and sexually typified generic names of Ascomycota with recommendations for their use or protection. IMA Fungus 2016, 7, 289–308. [Google Scholar] [CrossRef]
  116. Chang, C.Q.; Xi, P.G.; Xiang, M.M.; Jiang, Z.D.; Chi, P.K. New species of Phomopsis on woody plants in Hunan province. Mycosystema 2005, 24, 145–154. [Google Scholar]
  117. Cao, L.; Luo, D.; Lin, W.; Yang, Q.; Deng, X. Four new species of Diaporthe (Diaporthaceae, Diaporthales) from forest plants in China. MycoKeys 2022, 91, 25–47. [Google Scholar] [CrossRef]
  118. Long, H.; Zhang, Q.; Hao, Y.Y.; Shao, X.Q.; Wei, X.X.; Hyde, K.D.; Wang, Y.; Zhao, D.G. Diaporthe species in south-western China. MycoKeys 2019, 57, 113–127. [Google Scholar] [CrossRef]
  119. Crous, P.W.; Groenewald, J.Z.; Shivas, R.G.; Edwards, J.; Seifert, K.A.; Alfenas, A.C.; Alfenas, R.F.; Burgess, T.I.; Carnegie, A.J.; Hardy, G.S.J.; et al. Fungal Planet description sheets: 69–91. Persoonia 2011, 26, 108–156. [Google Scholar] [CrossRef]
  120. Chen, K.-L.; Kirschner, R. Fungi from leaves of lotus (Nelumbo nucifera). Mycol. Prog. 2017, 17, 275–293. [Google Scholar] [CrossRef]
  121. Yang, Q.; Jiang, N.; Tian, C.M. New species and records of Diaporthe from Jiangxi Province, China. MycoKeys 2021, 77, 41–64. [Google Scholar] [CrossRef] [PubMed]
  122. Yang, Q.; Fan, X.L.; Du, Z.; Tian, C.M. Diaporthe species occurring on Senna bicapsularis in southern China, with descriptions of two new species. Phytotaxa 2017, 302, 145–155. [Google Scholar] [CrossRef]
  123. Ariyawansa, H.A.; Tsai, I.; Withee, P.; Tanjira, M.; Yen, C.Y.; Al-Rashed, S.; Elgorban, A.M.; Cheewangkoon, R. Diaporthe taiwanensis: A new taxon causing leaf spots and necrosis on Ixora chinensis in Taiwan. Phytotaxa 2020, 461, 155–165. [Google Scholar] [CrossRef]
  124. Abeywickrama, P.D.; Qian, N.; Jayawardena, R.S.; Li, Y.; Zhang, W.; Guo, K.; Zhang, L.; Zhang, G.Z.; Yan, J.; Li, X.; et al. Endophytic fungi in green manure crops; friends or foe? Mycosphere 2023, 14, 1–106. [Google Scholar] [CrossRef]
  125. Tan, Y.P.; Shivas, R.G. Nomenclatural novelties. Index Austral. Fungi 2022, 2, 1–12. [Google Scholar]
  126. Yang, E.F.; Karunarathna, S.C.; Dai, D.Q.; Stephenson, S.L.; Elgorban, A.M.; Al-Rejaie, S.; Xiong, Y.R.; Promputtha, I.; Samarakoon, M.C.; Tibpromma, S. Taxonomy and phylogeny of fungi associated with Mangifera indica from Yunnan, China. J. Fungi 2022, 8, 1249. [Google Scholar] [CrossRef]
  127. Tibpromma, S.; Hyde, K.D.; Bhat, J.D.; Mortimer, P.E.; Xu, J.C.; Promputtha, I.; Doilom, M.; Yang, J.B.; Tang, A.M.C.; Karunarathna, S.C. Identification of endophytic fungi from leaves of Pandanaceae based on their morphotypes and DNA sequence data from southern Thailand. MycoKeys 2018, 33, 25–67. [Google Scholar] [CrossRef]
  128. Farr, D.F.; Rossman, A.Y. Fungal Databases, US National Fungus Collections, ARS, USDA. 2023. Available online: https://nt.ars-grin.gov/fungaldatabases/ (accessed on 15 August 2023).
  129. Punithalingam, E. New species of Phomopsis. Trans. Br. Mycol. Soc. 1974, 63, 229–236. [Google Scholar] [CrossRef]
  130. Zerova, M.Y. Dekilyka novikh dlya SSSR vidiv Phomopsis. Bot. Zhurn. SSSR 1940, 1, 305–312. [Google Scholar]
  131. Taylor, J.W.; Turner, E.; Townsend, J.P.; Dettman, J.R.; Jacobson, D. Eukaryotic microbes, species recognition and the geographic limits of species: Examples from the kingdom Fungi. Philos. Trans. R. Soc. Lond. B Biol. Sci. 2006, 361, 1947–1963. [Google Scholar] [CrossRef]
  132. Giraud, T.; Refrégier, G.; Le Gac, M.; de Vienne, D.M.; Hood, M.E. Speciation in fungi. Fungal Genet. Biol. 2008, 45, 791–802. [Google Scholar] [CrossRef]
  133. Cai, L.; Giraud, T.; Zhang, N.; Begerow, D.; Cai, G.; Shivas, R.G. The evolution of species concepts and species recognition criteria in plant pathogenic fungi. Fungal Divers. 2011, 50, 121–133. [Google Scholar] [CrossRef]
  134. Coetzee, M.P.A.; Wingfield, B.D.; Bloomer, P.; Wingfield, M.J. Phylogenetic analyses of DNA sequences reveal species partitions amongst isolates of Armillaria from Africa. Mycol. Res. 2005, 109, 1223–1234. [Google Scholar] [CrossRef] [PubMed]
  135. Aoki, T.; O’Donell, K.; Scandiani, M.M. Sudden death syndrome of soybean in South America is caused by four species of Fusarium: Fusarium brasiliense sp. nov., F. cuneirostrum sp. nov., F. tucumaniae, and F. virguliforme. Mycoscience 2005, 46, 162–183. [Google Scholar] [CrossRef]
  136. Laurence, M.H.; Summerell, B.A.; Burgess, L.W.; Liew, E.C.Y. Genealogical concordance phylogenetic species recognition in the Fusarium oxysporum species complex. Fungal Biol. 2014, 118, 374–384. [Google Scholar] [CrossRef] [PubMed]
  137. Mejia, L.C.; Castlebury, L.A.; Rossman, A.Y.; Sogonov, M.V.; White, J.F. A systematic account of the genus Plagiostoma (Gnomoniaceae, Diaporthales) based on morphology, host associations and a four gene phylogeny. Stud. Mycol. 2011, 68, 211–235. [Google Scholar] [CrossRef]
  138. Wang, X.H.; Chen, G.Q.; Huang, F.; Zhang, J.Z.; Hyde, K.D.; Li, H.G. Phyllosticta species associated with citrus diseases in China. Fungal Divers. 2011, 52, 209–224. [Google Scholar] [CrossRef]
  139. Cai, L.; Hyde, K.D.; Taylor, P.W.J.; Weir, B.S.; Waller, J.; Abang, M.M.; Zhang, J.Z.; Yang, Y.L.; Phoulivong, S.; Liu, Z.Y.; et al. A polyphasic approach for studying Colletotrichum. Fungal Divers. 2009, 39, 183–204. [Google Scholar]
  140. Crouch, J.A.; Clarke, B.B.; Hillman, B.I. What is the value of ITS sequence data in Colletotrichum systematics and species diagnosis? A case study using the falcate-spored graminicolous Colletotrichum group. Mycologia 2009, 101, 648–656. [Google Scholar] [CrossRef]
  141. Phoulivong, S.; Cai, L.; Chen, H.; McKenzie, E.H.C.; Abdelsalam, K.; Chukeatirote, E.; Hyde, K.D. Colletotrichum gloeosporioides is not a common pathogen on tropical fruits. Fungal Divers. 2010, 44, 33–43. [Google Scholar] [CrossRef]
  142. Lombard, L.; Crous, P.W.; Wingfield, B.D.; Wingfield, M.J. Phylogeny and systematics of the genus Calonectria. Stud. Mycol. 2010, 66, 31–69. [Google Scholar] [CrossRef] [PubMed]
  143. Hipp, A.L.; Hall, J.C.; Sytsma, K.J. Congruence versus phylogenetic accuracy: Revisiting the incongruence length difference test. Syst. Biol. 2004, 53, 81–89. [Google Scholar] [CrossRef]
  144. Milgroom, M.G. Recombination and the multilocus structure of fungal populations. Annu. Rev. Phytopathol. 1996, 34, 457–477. [Google Scholar] [CrossRef]
  145. Geiser, D.M.; Pitt, J.I.; Taylor, J.W. Cryptic speciation and recombination in the aflatoxin-producing fungus Aspergillus flavus. Proc. Natl. Acad. Sci. USA 1998, 95, 388–393. [Google Scholar] [CrossRef] [PubMed]
  146. O’Donnell, K.; Kistler, H.C.; Tacke, B.K.; Casper, H.C. Gene genealogies reveal global phylogeographic structure and reproductive isolation among lineages of Fusarium graminearum, the fungus causing wheat scab. Proc. Natl. Acad. Sci. USA 2000, 97, 7905–7910. [Google Scholar] [CrossRef]
  147. Matute, D.R.; McEwen, J.G.; Puccia, R.; Montes, B.A.; San-Blas, G.; Bagagli, E.; Taylor, J.W. Cryptic speciation and recombination in the fungus Paracoccidioides brasiliensis as revealed by gene genealogies. Mol. Biol. Evol. 2006, 23, 65–73. [Google Scholar] [CrossRef] [PubMed]
  148. Mendez-Harclerode, F.M.; Strauss, R.E.; Fulhorst, C.F.; Milazzo, M.L.; Ruthven, D.C.; Bradley, R.D. Molecular evidence for high levels of intrapopulation genetic diversity in woodrats (Neotoma micropus). J. Mammal. 2007, 88, 360–370. [Google Scholar] [CrossRef]
  149. Grant, W.S.; Bowen, B.W. Shallow population histories in deep evolutionary lineages of marine fishes: Insights from sardines and anchovies and lessons for conservation. Genetics 1998, 89, 415–426. [Google Scholar] [CrossRef]
  150. Korneliussen, T.S.; Moltke, I.; Albrechtsen, A.; Nielsen, R. Calculation of Tajima’s D and other neutrality test statistics from low depth next-generation sequencing data. BMC Bioinf. 2013, 14, 289. [Google Scholar] [CrossRef]
  151. Carlson, C.S.; Thomas, D.J.; Eberle, M.; Livingston, R.; Rieder, M.; Nickerson, D.A. Genomic regions exhibiting positive selection identified from dense genotype data. Genome Res. 2005, 15, 1553–1565. [Google Scholar] [CrossRef]
  152. van Iersel, L.; Kelk, S.; Rupp, R.; Huson, D. Phylogenetic networks do not need to be complex: Using fewer reticulations to represent conflicting clusters. Bioinformatics 2010, 26, i124–i131. [Google Scholar] [CrossRef]
  153. Chen, S.; Kim, D.-K.; Chase, M.W.; Kim, J.-H. Networks in a large-scale phylogenetic analysis: Reconstructing evolutionary history of Asparagales (Lilianae) based on four plastid genes. PLoS ONE 2013, 8, e59472. [Google Scholar] [CrossRef]
  154. Linde, C.C. Population genetic analyses of plant pathogens: New challenges and opportunities. Australas. Plant Pathol. 2010, 39, 23e28. [Google Scholar] [CrossRef]
  155. Barton, N.H. Mutation and the evolution of recombination. Philos. Trans. R. Soc. Lond. B Biol. Sci. 2010, 365, 1281–1294. [Google Scholar] [CrossRef]
  156. Croll, D.; Lendenmann, M.H.; Stewart, E.; McDonald, B.A. The impact of recombination hotspots on genome evolution of a fungal plant pathogen. Genetics 2015, 201, 1213–1228. [Google Scholar] [CrossRef] [PubMed]
  157. Matute, D.R.; Sepúlveda, V.E. Fungal species boundaries in the genomics era. Fungal Genet. Biol. 2019, 131, 103249. [Google Scholar] [CrossRef] [PubMed]
  158. Schoch, C.L.; Seifert, K.A.; Huhndorf, S.; Robert, V.; Spouge, J.L.; Levesque, C.A.; Chen, W.; Fungal Barcoding Consortium. Nuclear ribosomal internal transcribed spacer (ITS) region as a universal DNA barcode marker for fungi. Proc. Natl. Acad. Sci. USA 2012, 109, 6241–6246. [Google Scholar] [CrossRef] [PubMed]
  159. Vu, D.; Groenewald, M.; de Vries, M.; Gehrmann, T.; Stielow, B.; Eberhardt, U.; Al-Hatmi, A.; Groenewald, J.Z.; Cardinali, G.; Houbraken, J.; et al. Large-scale generation and analysis of filamentous fungal DNA barcodes boosts coverage for kingdom fungi and reveals thresholds for fungal species and higher taxon delimitation. Stud. Mycol. 2019, 92, 135–154. [Google Scholar] [CrossRef]
  160. Gazis, R.; Rehner, S.; Chaverri, P. Species delimitation in fungal endophyte diversity studies and its implications in ecological and biogeographic inferences. Mol. Ecol. 2011, 20, 3001–3013. [Google Scholar] [CrossRef]
  161. Hibbett, D.S.; Ohman, A.; Glotzer, D.; Nuhn, M.; Kirk, P.; Nilsson, R.H. Progress in molecular and morphological taxon discovery in fungi and options for forma classification of environmental sequences. Fungal Biol. Rev. 2011, 25, 38–47. [Google Scholar] [CrossRef]
  162. Hughes, K.W.; Tulloss, R.H.; Petersen, R.H. Intragenomic nuclear RNA variation in a cryptic Amanita taxon. Mycologia 2018, 110, 93–103. [Google Scholar] [CrossRef]
  163. Piganeau, G.; Eyre-Walker, A. A reanalysis of the indirect evidence for recombination in human mitochondrial DNA. Heredity 2004, 92, 282–288. [Google Scholar] [CrossRef] [PubMed]
  164. Naranjo-Ortiz, M.A.; Gabaldón, T. Fungal evolution: Major ecological adaptations and evolutionary transitions. Biol. Rev. Camb. Philos. Soc. 2019, 94, 1443–1476. [Google Scholar] [CrossRef]
  165. Chethana, K.W.T.; Manawasinghe, I.S.; Hurdeal, V.G.; Bhunjun, C.S.; Appadoo, M.A.; Gentekaki, E.; Raspé, O.; Promputtha, I.; Hyde, K.D. What are fungal species and how to delineate them? Fungal Divers. 2021, 109, 1–25. [Google Scholar] [CrossRef]
  166. Stengel, A.; Stanke, K.M.; Quattrone, A.C.; Herr, J.R. Improving taxonomic delimitation of fungal species in the age of genomics and phenomics. Front. Microbiol. 2022, 13, 847067. [Google Scholar] [CrossRef]
  167. Harrington, T.C.; Rizzo, D.M. Defining species in the fungi. In Structure and Dynamics of Fungal Populations; Worrall, J.J., Ed.; Springer Science & Business Media: Dordrecht, The Netherlands, 1999; Volume 25, pp. 43–71. [Google Scholar]
  168. Steenkamp, E.T.; Wingfield, M.J.; McTaggart, A.R.; Wingfield, B.D. Fungal species and their boundaries matter e definitions, mechanisms and practical implications. Fung. Biol. Rev. 2018, 32, 104–116. [Google Scholar] [CrossRef]
  169. Brayford, D. Variation in Phomopsis isolates from Ulmus species in the British Isles and Italy. Mycol. Res. 1990, 94, 691–697. [Google Scholar] [CrossRef]
  170. Crous, P.W.; Groenewald, J.Z. Hosts, species and genotypes: Opinions versus data. Australas. Plant Pathol. 2005, 34, 463–470. [Google Scholar] [CrossRef]
  171. Hyde, K.D.; Jeewon, R.; Chen, Y.J.; Bhunjun, C.S.; Calabon, M.S.; Jiang, H.B.; Lin, C.-G.; Norphanphoun, C.; Sysouphathong, P.; Pem, D.; et al. The numbers of fungi: Is the descriptive curve flattening? Fungal Divers. 2020, 103, 219–271. [Google Scholar] [CrossRef]
  172. Hilário, S.; Gonçalves, M.F.M. Mechanisms underlying the pathogenic and endophytic lifestyles in Diaporthe: An omics-based approach. Horticulturae 2023, 9, 423. [Google Scholar] [CrossRef]
  173. McCartney, H.A.; Foster, S.J.; Fraaije, B.A.; Ward, E. Molecular diagnostics for fungal plant pathogens. Pest. Manag. Sci. 2003, 59, 129–142. [Google Scholar] [CrossRef] [PubMed]
  174. Anderson, P.K.; Cunningham, A.A.; Patel, N.G.; Morales, F.J.; Epstein, P.R.; Daszak, P. Emerging infectious diseases of plants: Pathogen pollution, climate change and agrotechnology drivers. Trends Ecol. Evol. 2004, 19, 535–544. [Google Scholar] [CrossRef] [PubMed]
  175. Desprez-Loustau, M.-L.; Marçais, B.; Nageleisen, L.-M.; Piou, D.; Vannini, A. Interactive effects of drought and pathogens in forest trees. Ann. For. Sci. 2006, 63, 597–612. [Google Scholar] [CrossRef]
  176. Desprez-Loustau, M.-L.; Robin, C.; Reynaud, G.; Déqué, M.; Badeau, V.; Piou, D.; Husson, C.; Marcais, B. Simulating the effects of a climate-change scenario on the geographical range and activity of forest-pathogenic fungi. Can. J. Plant Pathol. 2007, 29, 101–120. [Google Scholar] [CrossRef]
Figure 1. Phylogenetic tree generated from maximum likelihood analysis based on combined ITS, tef1, tub2, cal and his3 sequence data for the Diaporthe arecae species complex and related species. Bootstrap support values for maximum likelihood, maximum parsimony (ML-BS/MP-BS ≥ 70%) and Bayesian posterior probabilities (PP ≥ 0.90) are shown at the nodes. Strains with type status are indicated in bold font. The isolates from this study are presented in brown typeface and the additional isolates from palm tissues included in the analyses are presented in green typeface. Species boundaries within the D. arecae species complex are delimited by colored blocks and their respective branches are indicated by lettered circles (A–C). The scale bar represents the expected number of nucleotide changes per site. The tree is rooted to D. citri (CBS 134239 and CBS 135422).
Microorganisms 11 02717 g001aMicroorganisms 11 02717 g001b
Figure 2. Phylogenetic trees generated from maximum likelihood analysis of the Diaporthe arecae species complex and related species. (A). Based on combined dataset of 5 loci (ITS, tef1, tub2, cal and his3). (B). Based on combined dataset of 4 loci (ITS, tef1, tub2 and cal). (C). Based on combined dataset of 3 loci (ITS, tef1 and tub2). Bootstrap support values for maximum likelihood, maximum parsimony (ML-BS/MP-BS ≥ 70%) and Bayesian posterior probabilities (PP ≥ 0.90) are shown at the nodes. Taxa numbers were generated, and the corresponding strains and species are shown in the 3-loci phylogram (panel (C)). Underlined numbers denote taxa that were excluded in the previous dataset due to lack of sequence data. Strains with type status are indicated in bold font. The isolates from this study are presented in brown typeface and the additional isolates from palm tissues included in the analyses are presented in green typeface. Species boundaries within the D. arecae species complex are delimited with colored blocks and referred to in the chart legend. The scale bars represent the expected number of nucleotide changes per site. The trees are rooted to D. citri (CBS 134239 and CBS 135422).
Microorganisms 11 02717 g002
Figure 3. Phylogenetic informativeness profiles of the Diaporthe arecae species complex and related species through a relative time scale for a combined dataset of five loci (ITS, tef1, tub2, cal and his3). (A). Time tree inferred by applying the RelTime-ML method. All divergence times shown are relative times as no calibrations were used. Strains with type status are indicated in bold font. Species boundaries within the D. arecae species complex are delimited by colored blocks and referred to in the chart legend. The tree is rooted to D. citri (CBS 134239 and CBS 135422). (B). Net phylogenetic informativeness profiles in arbitrary units matched to the time tree scale with lines representing individual loci profiles and referred to in the chart legend. Nodes of interest are highlighted by blue and green dots and dashed lines through both panels, and the corresponding graph areas are emphasized by colored blocks.
Microorganisms 11 02717 g003
Figure 4. Maximum-likelihood species delimitation scheme obtained from the Poisson tree process (PTP) analysis of the Diaporthe arecae species complex and related species, based on combined dataset of 5 loci (ITS, tef1, tub2, cal and his3). Blue-colored branches illustrate the speciation process and red-colored branches illustrate the coalescent/population process. Putative species clusters are represented as transitions from blue-colored to red-colored branches or as terminal, blue-colored branches and are highlighted by numbered circles (1–7). Strains with type status are indicated in bold font. The scale bar represents the expected number of nucleotide changes per site.
Microorganisms 11 02717 g004
Figure 5. Maximum-likelihood species delimitation scheme obtained from the multi-rate Poisson Tree Process (mPTP) analysis of the Diaporthe arecae species complex and related species, based on combined dataset of 5-loci (ITS, tef1, tub2, cal and his3). Green-colored branches illustrate the speciation process and red-colored branches illustrate the coalescent process. Putative species clusters are represented as transitions from green-colored to red-colored branches or as terminal, green-colored branches and are highlighted by numbered circles (1–7). Strains with type status are indicated in bold font. The scale bar represents the expected number of nucleotide changes per site.
Microorganisms 11 02717 g005
Figure 6. Pairwise homoplasy index (PHI) test for recombination among taxa within the Diaporthe arecae subclade. (A). Phylogenetic tree generated from maximum likelihood analysis of the D. arecae species complex and related species based on combined dataset of 5 loci (ITS, tef1, tub2, cal and his3). Bootstrap support values for maximum likelihood, maximum parsimony (ML-BS/MP-BS ≥ 70%) and Bayesian posterior probabilities (PP ≥ 0.90) are shown at the nodes. Strains with type status are indicated in bold font. The additional isolates from palm tissues included in the analyses are presented in green typeface. Species names within the D. arecae species complex are followed by the host genus/species from which it was isolated (green) and the country of origin (red). Species boundaries within the D. arecae species complex are delimited by colored blocks and referred to in the chart legend. Black circles represent hypothetical populations or “species” within the D. arecae species complex as inferred by either the support values of ML, MP or BA. The support values and the branches of each hypothetical population or “species” are highlighted by alternating blue and red colours. The scale bar represents the expected number of nucleotide changes per site. The tree is rooted to D. citri (CBS 134239 and CBS 135422). (B). Matrix of recombination results of paired branches in the D. arecae species complex based on combined dataset of 5 loci (ITS, tef1, tub2, cal and his3). Green squares indicate positive results for recombination (p < 0.05), red squares indicate negative results for recombination (p ≥ 0.05) and grey squares indicate that the PHI test was not performed as only one isolate was available, or there were too few informative characters.
Microorganisms 11 02717 g006aMicroorganisms 11 02717 g006b
Figure 7. NeighborNet phylogenetic network of the Diaporthe arecae species complex and related species based on the LogDet transformation for a combined dataset of 5 loci (ITS, tef1, tub2, cal and his3). Diaporthe arecae species complex and D. arecae are delimited by colored blocks. The scale bar represents the expected number of nucleotide changes per site.
Microorganisms 11 02717 g007
Figure 8. Dendrograms obtained by hierarchical cluster analysis of the Diaporthe arecae species complex using Euclidean distance and UPGMA algorithm. (A). Based on the length-to-width ratio (L/W) of alpha conidia. (B). Based on the L/W ratio of beta conidia. (C). Based on the L/W ratios of alpha and beta conidia. The species or strains included in each analysis were those with available measurements for the micromorphological structure(s) used to infer the respective dendrogram. The horizontal dashed lines indicate the distance cut-of level used to produce clusters. Euclidean distance values greater than 0.00 are shown at the nodes. Clusters are highlighted by colored lines and referred to in the chart legend. The number (#) of taxa in each cluster is noted in brackets. The cophenetic correlation coefficients (c) are noted below the chart legend.
Microorganisms 11 02717 g008aMicroorganisms 11 02717 g008b
Figure 9. Diaporthe arecae. (AI): CDP 0358; (J): CDP 0047; (K): CDP 0460. (AC). Conidiogenous layer. (DH). Conidiogenous cells. (IK). Conidia. Scale bars: (AE,G,IK) = 5 μm, (F,H) = 2.5 μm.
Microorganisms 11 02717 g009
Table 1. Collection details and GenBank accession numbers of taxa included in the phylogenetic analyses.
Taxon 1Culture 2 and Status 3HostCountryGenBank Accession Number 4
ITStef1tub2calhis3
Diaporthe arecaeCBS 535.75Citrus sp.SurinameKC343033KC343759KC344001KC343275KC343517
CBS 161.64ITAreca catechuIndiaKC343032KC343758KC344000KC343274KC343516
SM30Calamus castaneusMalaysiaMN651492MT077090MT077061N/AN/A
D. arecae (“D. eugeniae”)CBS 444.82Eugenia aromaticaIndonesiaKC343098KC343824KC344066KC343340KC343582
D. arecae (“D. perseae”)CBS 151.73Persea americanaNetherlandsKC343173KC343899KC344141KC343415KC343657
D. arecae (syn. D. acuta)CGMCC 3.19600TPyrus pyrifoliaChinaMK626957MK654802MK691124MK691225MK726161
PSCG 045Pyrus pyrifoliaChinaMK626956MK654809MK691223MK691123MK726160
D. arecae (syn. D. anhuiensis)CNUCC 201901TCunninghamia lanceolataChinaMN219718MN224668MN227008MN224549MN224556
CNUCC 201902PTCunninghamia lanceolataChinaMN219727MN224669MN227009MN224550MN224557
D. arecae (syn. D. arengae)CBS 114979TArenga engleriHong KongKC343034KC343760KC344002KC343276KC343518
SM28Calamus castaneusMalaysiaMN651480MT077093MT077062N/AN/A
SM29Calamus castaneusMalaysiaMN651482MT077094MT077063N/AN/A
SM35Calamus castaneusMalaysiaMN651483MT077099MT077068N/AN/A
SM38Calamus castaneusMalaysiaMN651484MT077097MT077066N/AN/A
SM39Calamus castaneusMalaysiaMN651485MT077098MT077067N/AN/A
SM41Calamus castaneusMalaysiaMN651481MT077095MT077064N/AN/A
SM45Calamus castaneusMalaysiaMN651486MT077096MT077065N/AN/A
SM49Calamus castaneusMalaysiaMN651487MT077089MT077069N/AN/A
D. arecae (syn. D. averrhoae)SCHM 3605HAverrhoa carambolaChinaAY618930N/AN/AN/AN/A
D. arecae (syn. D. bounty)BRIP 59361aHMalus domesticaAustraliaOM918690OM960599OM960617N/AN/A
D. arecae (syn. D. camelliae-oleiferae)HNZZ027TCamellia oleiferaChinaMZ509555MZ504707MZ504718MZ504685MZ504696
HNZZ030Camellia oleiferaChinaMZ509556MZ504708MZ504719MZ504686MZ504697
D. arecae (syn. D. ceratozamiae)CBS 131306TCeratozamia robustaAustraliaJQ044420N/AN/AN/AN/A
D. arecae (syn. D. cercidis)CFCC 52565TCercis chinensisChinaMH121500MH121542MH121582MH121424MH121460
CFCC 52566Cercis chinensisChinaMH121501MH121543MH121583MH121425MH121461
D. arecae (syn. D. chamaeropicola)CDP 0460TChamaerops humilisPortugalMT022111MT011074MT011080MT011068N/A
D. arecae (syn. D. chrysalidocarpi)SAUCC 194.33PTN/AChinaMT822561MT855874MT855758MT855645MT855530
SAUCC 194.35TN/AChinaMT822563MT855876MT855760MT855646MT855532
D. arecae (syn. D. delonicis)MFLU 16-1059HDelonix regiaThailandMT215490N/AMT212209N/AN/A
D. arecae (syn. D. drenthii)BRIP 66523Macadamia sp.South AfricaMN708228MN696525MN696536N/AN/A
BRIP 66524TMacadamia sp.South AfricaMN708229MN696526MN696537N/AN/A
D. arecae (syn. D. endocitricola)ZHKUCC 20-0012TCitrus grandisChinaMT355682MT409336MT409290MT409312N/A
ZHKUCC 20-0013PTCitrus grandisChinaMT355683MT409337MT409291MT409313N/A
D. arecae (syn. D. fraxini-angustifoliae)BRIP 54781ITFraxinus angustifoliaAustraliaJX862528JX862534KF170920N/AN/A
MFLUCC 15-0748Vitis viniferaChinaKT459428KT459446KT459430KT459462N/A
D. arecae (syn. D. fulvicolor)CGMCC 3.19601TPyrus pyrifoliaChinaMK626859MK654806MK691236MK691132MK726163
PSCG 057Pyrus pyrifoliaChinaMK626858MK654810MK691233MK691131MK726164
D. arecae (syn. D. gossiae)BRIP 59730aHSesbania sp.AustraliaOM918693OM960602OM960620N/AN/A
D. arecae (syn. D. guangxiensis)JZB 320091Vitis viniferaChinaMK335769MK523564MK500165MK736724N/A
JZB 320094TVitis viniferaChinaMK335772MK523566MK500168MK736727N/A
D. arecae (syn. D. hongheensis)KUMCC 21-0457TMangifera indicaChinaOM001331ON468649ON468658ON715010N/A
KUMCC 21-0458Mangifera indicaChinaOM001330ON468650ON468659ON715009N/A
D. arecae (syn. D. howardiae)BRIP 59697aHAgave sp.AustraliaOM918695OM960604OM960622N/AN/A
D. arecae (syn. D. huangshanensis)CNUCC 201903TCamellia oleiferaChinaMN219729MN224670MN227010N/AMN224558
CNUCC 201904PTCamellia oleiferaChinaMN219730MN224671MN227011N/AMN224559
D. arecae (syn. D. hunanensis)HNZZ023TCamellia oleiferaChinaMZ509550MZ504702MZ504713MZ504680MZ504691
HNZZ025Camellia oleiferaChinaMZ509551MZ504703MZ504714MZ504681MZ504692
D. arecae (syn. D. krabiensis)MFLUCC 17-2481TSubmerged woodThailandMN047101MN433215MN431495N/AN/A
D. arecae (syn. D. limonicola)CBS 142549TCitrus limonMaltaNR_154980MF418501MF418582MF418256MF418342
CBS 142550Citrus limonMaltaMF418423MF418502MF418583MF418257MF418343
CPC 27869Citrus limonMaltaMF418419MF418498MF418579MF418253MF418339
HNHK02Areca catechuChinaMN424515MN424557MN424529MN424571MN424543
HNQH03Areca catechuChinaMN424526MN424568MN424540MN424582MN424554
HNQH02Areca catechuChinaMN424525MN424567MN424539MN424581MN424553
D. arecae (syn. D. liquidambaris)SCHM 3621HLiquidambar formosanaChinaAY601919N/AN/AN/AN/A
D. arecae (syn. D. litchiicola)BRIP 54900TLitchi chinensisAustraliaJX862533JX862539KF170925N/AN/A
D. arecae (syn. D. loropetali)SCHM 3615HLoropetalum chinenseChinaAY601917N/AN/AN/AN/A
D. arecae (syn. D. meliae)CFCC 53089TMelia azedarachChinaMK432657ON081654MK578057N/AON081662
CFCC 53090Melia azedarachChinaMK432658ON081655MK578058N/AON081663
D. arecae (syn. D. melitensis)CBS 142551TCitrus limonMaltaMF418424MF418503MF418584MF418258MF418344
CPC 27875Citrus limonMaltaMF418425MF418504MF418585MF418259MF418345
D. arecae (syn. D. millettiae)GUCC 9167TPlant foliageChinaMK398674MK480609MK502089MK502086N/A
MFLUCC 20-0183Celtis formosanaChinaMW114351MW192214MW148271MW151589N/A
D. arecae (syn. D. musigena)CBS 129519TMusa sp.AustraliaKC343143KC343869KC344111KC343385KC343627
D. arecae (syn. D. nelumbonis)BCRC FU30382RNelumbo nuciferaChinaKT821501N/ALC069368N/AN/A
D. arecae (syn. D. norfolkensis)BRIP 59718aHMangifera indicaAustraliaOM918699OM960608OM960626N/AN/A
D. arecae (syn. D. oculi)MAFF 246252THomo sapiensJapanLC373514LC373516LC373518N/AN/A
D. arecae (syn. D. osmanthi)GUCC 9165TCamellia sinensisChinaMK398675MK480610MK502091MK502087N/A
SAUCC 194.21Camellia sinensisChinaMT822549MT855862MT855746MT855634MT855518
D. arecae (syn. D. pandanicola)MFLUCC 17-0607TPandanus sp.ThailandMG646974N/AMG646930N/AN/A
SAUCC 194.82Milletia reticulataChinaMT822610MT855922MT855807MT855689MT855578
D. arecae (syn. D. pascoei)BRIP 54847ITPersea americanaAustraliaJX862532JX862538KF170924N/AN/A
D. arecae (syn. D. pescicola)MFLUCC 16-0105TPrunus persicaChinaKU557555KU557623KU557579KU557603N/A
MFLUCC 16-0108Prunus persicaChinaKU557558KU557626KU557582KU557606N/A
PSCG 036Pyrus × bretschneideriChinaMK626855MK654796MK691226MK691116MK726159
PSCG 037Pyrus × bretschneideriChinaMK626857MK654799MK691230MK691130MK726157
D. arecae (syn. D. phyllanthicola)SCHM 3680HPhyllanthus emblicaeChinaAY620819N/AN/AN/AN/A
D. arecae (syn. D. podocarpi-macrophylli)CGMCC 3.18281TPodocarpus macrophyllusJapanKX986774KX999167KX999207KX999278KX999246
LC 6229Olea europaeaItalyKX986771KX999164KX999204KX999277KX999243
D. arecae (syn. D. pseudomangiferae)CBS 101339TMangifera indicaDominican RepublicKC343181KC343907KC344149KC343423KC343665
CBS 388.89Mangifera indicaMexicoKC343182KC343908KC344150KC343424KC343666
D. arecae (syn. D. pseudooculi)MAFF 246452THomo sapiensJapanLC373515LC373517LC373519N/AN/A
D. arecae (syn. D. pseudophoenicicola)CBS 176.77Mangifera indicaIraqKC343183KC343909KC344151KC343425KC343667
CBS 462.69TPhoenix dactyliferaSpainKC343184KC343910KC344152KC343426KC343668
CDP 0047Chamaerops humilisPortugalMT002357MT011069MT011075MT011065N/A
CDP 0358Phoenix dactyliferaPortugalMT004743MT011073MT011079MT011067N/A
HNHK01Areca catechumChinaMN424514MN424556MN424528MN424570MN424542
HNHK03Areca catechumChinaMN424516MN424558MN424530MN424572MN424544
HNQZ01Areca catechumChinaMN424520MN424562MN424534MN424576MN424548
HNWC01Areca catechumChinaMN424517MN424559MN424531MN424573MN424545
HNWC02Areca catechumChinaMN424518MN424560MN424532MN424574MN424546
HNWN03Areca catechumChinaMN424524MN424566MN424538MN424580MN424552
LC 6150Phoenix canariensisUruguayKY011891KY011902N/AN/AN/A
LC 6151Phoenix canariensisUruguayKY011892KY011903N/AN/AN/A
D. arecae (syn. D. pterocarpicola)MFLUCC 10-0580aTPterocarpus indicusThailandJQ619887JX275403JX275441JX197433N/A
MFLUCC 10-0580bITPterocarpus indicusThailandJQ619888JX275404JX275442JX197434N/A
D. arecae (syn. D. schimae)CFCC 53103TSchima superbaChinaMK432640MK578116MK578043MK442962MK442987
CFCC 53104Schima superbaChinaMK432641MK578117MK578044MK442963MK442988
D. arecae (syn. D. searlei)BRIP 66528TMacadamia sp.South AfricaMN708231N/AMN696540N/AN/A
D. arecae (syn. D. sennae)CFCC 51636TCassia bicapsularisChinaKY203724KY228885KY228891KY228875N/A
CFCC 51637PTCassia bicapsularisChinaKY203725KY228886KY228892KY228876N/A
D. arecae (syn. D. spinosa)CGMCC 3.19602TPyrus pyrifoliaChinaMK626849MK654811MK691234MK691129MK726156
PSCG 388Pyrus pyrifoliaChinaMK626860MK654798MK691229MK691128MK726171
D. arecae (syn. D. taiwanensis)NTUCC 18-105-1TIxora sp.ChinaMT241257MT251199MT251202MT251196N/A
NTUCC 18-105-2Ixora sp.ChinaMT241258MT251200MT251203MT251197N/A
D. arecae (syn. D. taoicola)MFLUCC 16-0117TPrunus persicaChinaKU557567KU557635KU557591N/AN/A
MFLUCC 16-0118Prunus persicaChinaKU557568KU557636KU557592N/AN/A
PSCG 485Pyrus pyrifoliaChinaMK626869MK654812MK691227MK691120MK726173
D. arecae (syn. D. viciae)JZB 320179TVicia villosaChinaOP626092OP627280OP627281N/AOP627279
D. arecae (syn. D. viniferae)JZB 320071TVitis viniferaChinaMK341550MK500107MK500112MK500119N/A
JZB 320072Vitis viniferaChinaMK341551MK500108MK500113MK500120N/A
D. arecae (syn. D. annellsiae)BRIP 59731aHMangifera indicaAustraliaOM918687OM960596OM960614N/AN/A
D. chiangmaiensisMFLUCC 18-0544TMagnolia liliiferaThailandOK393703OL439483N/AN/AN/A
MFLUCC 18-0935Magnolia liliiferaThailandOK393704OL439484N/AN/AN/A
D. chiangmaiensis (“D. cf. heveae 2”)CBS 681.84Hevea brasiliensisIndiaKC343117KC343843KC344085KC343359KC343601
D. chiangmaiensis (“D. cf. heveae”)BR74Calamus castaneusMalaysiaMN651490MT077091MT077079N/AN/A
SM36Calamus castaneusMalaysiaMN651489MT077092MT077080N/AN/A
D. citriCBS 134239Citrus sinensisUSAKC357553KC357522KC357456KC357488MF418280
CBS 135422ETCitrus sp.USAKC843311KC843071KC843187KC843157MF418281
D. corylicolaCFCC 53986TCorylus heterophyllaChinaMW839880MW815894MW883977MW836684MW836717
CFCC 54696Corylus heterophyllaChinaMW839881MW815907MW883990MW836697MW836730
D. longicollaATCC 60325TGlycine maxUSAKJ590728KJ590767KJ610883KJ612124KJ659188
CBS 116023Glycine maxUSAKC343198KC343924KC344166KC343440KC343682
D. sennicolaCFCC 51634TCassia bicapsularisChinaKY203722KY228883KY228889KY228873KY228879
CFCC 51635Cassia bicapsularisChinaKY203723KY228884KY228890KY228874KY228880
D. smilacicolaCFCC 54582TSmilax glabraChinaOP955933OP959770OP959776OP959779OP959788
CFCC 58764Smilax glabraChinaOP955934OP959769OP959775OP959778OP959787
1 Taxon or strain’s previous name is noted in brackets if different from current name for taxa which were synonymized (indicated by syn.) or resolved in the present study; 2 Acronyms of culture collections, ATCC: American Type Culture Collection, Virginia, USA; BCRC: Bioresource Collection and Research Center, Taiwan; BRIP: Plant Pathology Herbarium, Department of Primary Industries, Dutton Park, Queensland, Australia; CBS: CBS-KNAW Fungal Biodiversity Centre, Utrecht, The Netherlands; CDP: culture collection of D.S. Pereira, housed at the Lab Bugworkers|M&B-BioISI|Tec Labs—Innovation Centre, Faculty of Sciences, University of Lisbon, Lisbon, Portugal; CFCC: China Forestry Culture Collection Center, Beijing, China; CGMCC: China General Microbiological Culture Collection Center, China; CNUCC: Capital Normal University Culture Collection Center, Beijing, China; CPC: working collection of P.W. Crous, housed at CBS; GUCC: Guizhou University Culture Collection; JZB: culture collection of Institute of Plant and Environmental Protection, Beijing Academy of Agriculture and Forestry Sciences, Beijing 100097, China; KUMCC: Culture Collection of Kunming Institute of Botany, Kunming, China; LC: working collection of Lei Cai, housed at Laboratory State Key Laboratory of Mycology, Institute of Microbiology, Chinese Academy of Sciences, China; MAFF: Gene Bank Project, Ministry of Agriculture, Forestry and Fisheries, Tsukuba, Japan; MFLU: Herbarium of Mae Fah Luang University, Chiang Rai, Thailand; MFLUCC: Mae Fah Luang University Culture Collection, Chiang Rai, Thailand; NTUCC: Department of Plant Pathology and Microbiology, National Taiwan University Culture Collection, Taiwan, China; PSCG: personal culture collection of Y.S. Guo, China; SAUCC: Shandong Agricultural University Culture Collection, China; SCHM: Mycological Herbarium of South China Agricultural University, Guangzhou, China; ZHKUCC: University of Agriculture and Engineering Culture Collection, China. 3 Status of the strains or specimens are noted by bold superscript ET (ex-epitype), H (holotype), IT (ex-isotype), PT (ex-paratype), R (reference) and T (ex-type); 4 N/A: sequences not available; cal: partial calmodulin gene; ITS: partial cluster of nrRNA genes, including the nuclear 5.8S rRNA gene and its flanking internal transcribed spacer regions ITS1 and ITS2; tef1: partial translation elongation factor 1-alpha gene; tub2: partial beta-tubulin gene.
Table 2. Synopsis of the alignment properties, statistics, results and nucleotide substitution models used for phylogenetic analyses.
Analysis 1Characters Summary5-loci Dataset 2
ITStef1tub2calhis3Combined
Number of strains/number of species60/29, including 8/4 as outgroup taxa
Total characters4903413764614562124
Invariable characters (%)394 (80.4%)168
(49.3%)
247
(65.7%)
292
(63.3%)
323
(70.8%)
1424
(67.0%)
MPParsimony-informative characters (%) 85
(17.3%)
165
(48.4%)
115
(30.6%)
155
(33.6%)
116
(25.4%)
636
(29.7%)
Parsimony-uninformative characters11814141764
Tree length (TL)2063222313642361655
Consistency index (CI)0.5580.7300.6930.6290.7630.555
Homoplasy index (HI)0.4420.2700.3070.3710.2370.445
Retention index (RI)0.8750.8850.8720.8210.8930.778
Rescaled consistency index (RC)0.4880.6460.6040.5160.6810.431
ML/BAUnique alignment patterns/alignment sites (%)112/484
(23.1%)
173/331
(52.3%)
132/373
(35.4%)
183/461
(39.7%)
151/456
(33.1%)
751/2105
(35.7%)
Invariant sites (%)80.2%47.7%65.4%63.3%70.8%66.5%
Undetermined characters or gaps (%)7.8%8.6%7.9%8.4%7.4%8.0%
Nucleotide substitution models *TN93
+G+I
HKY
+G
TN93
+G
GTR
+G+I
GTR
+G
Partitioned
Analysis 1Characters summary4-loci dataset 2
ITStef1tub2calCombined
Number of strains/number of species83/39, including 8/4 as outgroup taxa
Total characters4903413764611668
Invariable characters (%)383
(78.2%)
167
(49.0%)
241
(64.1%)
269
(58.4%)
1060
(63.5%)
MPParsimony-informative characters (%)94
(19.2%)
169
(49.6%)
119
(31.6%)
159
(34.5%)
541
(32.4%)
Parsimony-uninformative characters135163367
Tree length (TL)2503442614311642
Consistency index (CI)0.5320.6920.6440.6080.488
Homoplasy index (HI)0.4680.3080.3560.3920.512
Retention index (RI)0.8870.8880.8670.8190.767
Rescaled consistency index (RC)0.4720.6140.5580.4980.374
ML/BAUnique alignment patterns/alignment sites (%)130/488
(26.6%)
182/331
(55.0%)
145/374
(38.8%)
201/461
(43.6%)
658/1654
(39.78%)
Invariant sites (%)78.1%47.4%63.9%58.4%63.3%
Undetermined characters or gaps (%)8.3%8.6%8.4%8.3%8.4%
Nucleotide substitution models *TN93
+G+I
GTR
+G
GTR
+G+I
GTR
+G+I
Partitioned
Analysis 1Characters summary3-loci dataset 2
ITStef1tub2Combined
Number of strains/number of species114/53, including 8/4 as outgroup taxa
Total characters4903413761207
Invariable characters (%)374
(76.3%)
156
(45.7%)
224
(59.6%)
754
(62.5%)
MPParsimony-informative characters (%)98
(20.0%)
174
(51.0%)
130
(34.6%)
402
(33.3%)
Parsimony-uninformative characters18112251
Tree length (TL)3034763581518
Consistency index (CI)0.4880.5920.5670.417
Homoplasy index (HI)0.5120.4080.4330.583
Retention index (RI)0.8910.8510.8350.758
Rescaled consistency index (RC)0.4350.5040.4730.316
ML/BAUnique alignment patterns/alignment sites (%)143/490
(29.2%)
206/341
(60.4%)
167/376
(44.4%)
516/1207
(42.8%)
Invariant sites (%)8.3%11.1%8.9%9.3%
Undetermined characters or gaps (%)76.3%45.8%59.6%62.5%
Nucleotide substitution models *TN93
+G+I
GTR
+G+I
GTR
+G+I
Partitioned
1 BA: Bayesian analysis; ML: maximum likelihood; MP: maximum parsimony; 2 cal: partial calmodulin gene; his3: partial histone H3 gene; ITS: partial cluster of nrRNA genes, including the nuclear 5.8S rRNA gene and its flanking internal transcribed spacer regions ITS1 and ITS2; tef1: partial translation elongation factor 1-alpha gene; tub2: partial beta-tubulin gene; * G, I: models of evolution assuming a discrete gamma distribution (G) and/or estimation of proportion of invariable sites (I); GTR: general time reversible model; HKY: Hasegawae–Kishonoe–Yano model; TN93: Tamura–Nei model.
Table 3. Pairwise homoplasy index (PHI) test results for recombination of the Diaporthe arecae species complex based on concatenated and single gene sequence alignments of the 5-, 4- and 3-loci combined datasets.
Dataset Tested 1Φw-Statistic (p-Value) 2
5-loci4-loci3-loci
ITS0.19 (4.34 × 10−4) *0.23 (0.01) *0.27 (0.02) *
tef10.11 (0.02) *0.13 (2.94 × 10−3) *0.17 (1.12 × 10⁻³) *
tub20.10 (0.07)0.12 (9.92 × 10−3) *0.14 (0.23)
cal0.20 (0.10)0.19 (0.99)N/A
his30.13 (0.61)N/AN/A
Combined0.16 (0.00) *0.19 (0.00) *0.22 (0.00) *
1 cal: partial calmodulin gene; his3: partial histone H3 gene; ITS: partial cluster of nrRNA genes, including the nuclear 5.8S rRNA gene and its flanking internally transcribed spacer regions ITS1 and ITS2; tef1: partial translation elongation factor 1-alpha gene; tub2: partial beta-tubulin gene; 2 5-loci: combined dataset based on ITS, tef1, tub2, cal and his3 loci; 4-loci: combined dataset based on ITS, tef1, tub2 and cal loci; 3-loci: combined dataset based on ITS, tef1 and tub2 loci; N/A: not applicable, locus excluded from the dataset; * Positive for recombination, PHI test yielded a p < 0.05.
Table 4. Genetic diversity and neutrality analysis of the Diaporthe arecae species complex.
Dataset Tested 1N 2Measures of Genetic Diversity 2Tajima’s D 3
hSHd ± SDπ ± SDηθ
5-lociITS5231510.977 ± 0.0080.030 ± 0.002570.031−0.09823 ns
tef15231720.961 ± 0.0160.037 ± 0.003750.060−1.31045 ns
tub25227670.963 ± 0.0120.033 ± 0.001710.047−1.06861 ns
cal5233730.965 ± 0.0150.032 ± 0.002910.057−1.52753 ns
his35227580.963 ± 0.0110.021 ± 0.003620.035−1.43297 ns
Combined52423210.992 ± 0.0050.030 ± 0.0023560.045−1.18300 ns
4-lociITS7540520.980 ± 0.0050.028 ± 0.001580.029−0.09624 ns
tef17538630.969 ± 0.0090.034 ± 0.002670.054−1.19098 ns
tub27536670.967 ± 0.0090.028 ± 0.001710.047−1.32256 ns
cal7543990.975 ± 0.0080.031 ± 0.0021220.071−1.92574 ss
Combined75572810.993 ± 0.0030.030 ± 0.0013180.049−1.33832 ns
3-lociITS10660590.987 ± 0.0030.028 ± 0.001650.031−0.25953 ns
tef110652850.974 ± 0.0060.035 ± 0.0021050.081−1.86768 ss
tub210656880.980 ± 0.0050.029 ± 0.0011070.066−1.83873 ss
Combined106812330.995 ± 0.0020.030 ± 0.0012770.055−1.51365 ns
1 cal: partial calmodulin gene; his3: partial histone H3 gene; ITS: partial cluster of nrRNA genes, including the nuclear 5.8S rRNA gene and its flanking internally transcribed spacer regions ITS1 and ITS2; tef1: partial translation elongation factor 1-alpha gene; tub2: partial beta-tubulin gene; 2 h: number of haplotypes; Hd: haplotype (gene) diversity; N: sample size, i.e., number of sequences (taxa); S: number of polymorphic (segregating) sites; SD: standard deviation; η: total number of mutations, Eta; π: nucleotide diversity (per site), Pi; θ: Watterson estimator (theta (per site) from Eta); 3 Statistical significance is noted as superscript ns (not statistically significant, p > 0.10) and superscript ss (statistically significant, p < 0.05).
Table 5. Synopsis of the morphological data on asexual morphs of Diaporthe arecae, including the synonyms proposed in this study.
Taxon 1ConidiomataConidiogenous Layer 2ConidiaReference
Diaporthe arecae (H.C. Srivast., Zakia & Govindar.) R.R. Gomes, C. Glienke & Crous
Subramanella arecae H.C. Srivast., Zakia & Govindar.
(CBS H-7808IH)
Pycnosclerotium formed along the sclerotium cortex, lacking ostiole, exuding conidia through irregular openings,
160–360 × 240–860 μm
Conidiophores distinct, long, thin, hyaline, simpleAlpha conidia elliptic, hyaline, aseptate,
7.2–9.6 × 2.4 μm
Beta-conidia needle-shaped, slightly curved, hyaline, aseptate, 14.4–24 × 1.2 μm
Gamma conidia not observed
[24,38]
Diaporthe acuta Y.S. Guo & G.P. Wang *
(CGMCC 3.19600T)
Pycnidia globose or irregular, dark brown to black, 230–544 μm diam.N/A Alpha conidia fusiform to oval, acutely rounded ends, hyaline, aseptate, bi- or multiguttulate, 6–9.5 × 2–3 μm
( x - = 7.8 × 2.6 μm, n = 50; L/W = 3)
Beta and gamma conidia not observed
[104]
Diaporthe anhuiensis H. Zhou & C.L. Hou *
(CNUCC 201901T)
Pycnidia globose, fuscous to black, exuding whitish to cream conidial droplets from ostiole,
250–340 μm diam.
Conidiophores cylindrical, tapering towards apex, hyaline, unbranched,
10.5–25.2 × 1.5–2.7 μm
Alpha conidia spindly or fusoid, hyaline, aseptate, bi-guttulate, rarely multiguttulate,
7.6–10.4 × 2.2–3.6 μm ( x - = 8.8 × 2.8 μm,
n = 40)
Beta and gamma conidia not observed
[105]
Diaporthe arengae R.R. Gomes, C. Glienke & Crous *
(CBS 114979T)
Pycnidia subglobose, black, exuding cream conidial droplets through central ostiole, up to 250 μm diam.Conidiophores cylindrical, straight to sinuous, hyaline apex, pale brown base, 0–6-septate smooth, branched, densely aggregated,
10–60 × 2.5–4 μm
Conidiogenous cells cylindrical, terminal and lateral, slightly tapering towards apex
(1–1.5 μm), phialidic (with periclinal thickening), with collarette not flared (up to 2 μm long), 8–15 × 1.5–2.5 μm
Alpha conidia fusoid-ellipsoid, tapering towards ends, subobtuse apex, flattened hilum at base, hyaline, aseptate, guttulate,
(5–)6–7(–9) × (2–)2.5(–3) μm
Beta conidia rarely observed, subcylindrical, bluntly rounded apex, truncate base, hyaline, aseptate, smooth, 20–25 × 1.5 μm
Gamma conidia not observed
[24]
Diaporthe averrhoae (C.Q. Chang, Z.D. Jiang & P.K. Chi) Y.H. Gao & L. Cai *
Phomopsis averrhoae C.Q. Chang, Z.D. Jiang & P.K. Chi
(SCHM 3605H)
Pycnidia of eustroma, compressed triangle or triangle, unilocular, brown to dark brown, with thinner wall at the base,
188–388 × 83–175 μm
Conidiophores hyaline, septate, branched,
8.5–36 × 1.4–2.0 μm
Conidiogenous cells hyaline, phialidic
Alpha conidia fusiform, hyaline, aseptate, biguttulate, 6.0–8.4 × 1.4–1.8 μm
Beta conidia filiform, mostly hamate, hyaline, aseptate, 10–25.5 × 0.5–0.9 μm
Gamma conidia not observed
[26,106]
Diaporthe
camelliae-oleiferae Q. Yang *
(HNZZ027T)
Pycnidia globose, dark brown to black, exuding pale-yellow conidial droplets from ostiole, 500–660 μm diam.Conidiophores reduced to conidiogeneous cells.
Conidiogenous cells cylindrical, tapering towards apex, straight, terminal, aseptate, densely aggregated,
(7.5–)10–14(–15.5) × 1.5–2.3 μm (n = 30)
Alpha conidia ellipsoidal to fusiform, hyaline, aseptate, bi-guttulate,
5–6.5(–7.5) × 1.9–2.3 μm (n = 30)
Beta conidia filiform, sinuous at one end, hyaline, aseptate, eguttulate,
(26.5–)28.5–31(–33) × 0.8–1.2 μm (n = 30)
Gamma conidia not observed
[107]
Diaporthe ceratozamiae Crous & R.G. Shivas *
(CBS 131306T)
Pycnidia subglobose, black, exuding yellow conidial droplets from ostiole, up to 300 μm diam.Conidiophores cylindrical, straight to sinuous, hyaline, 1–3-septate, smooth, branched, densely aggregated, 15–30 × 3–4 μm
Conidiogenous cells cylindrical, terminal, and lateral, slightly tapering towards apex
(1–1.5 μm), phialidic (with periclinal thickening), with collarette not flared (1 μm long)
Paraphyses cylindrical, straight, flexuous, hyaline, usually 1–2-septate at base, smooth, wall thickened, unbranched or branched at base, extending above conidiophores, up to 60 μm long and 1.5–2.5 μm wide at base
Alpha conidia fusiform, tapering towards ends, acutely rounded apex, subtruncate base, hyaline, aseptate,
(6.5–)8–9(–10) × 2–2.5(–3) μm
Beta conidia and gamma conidia not observed
[108]
Diaporthe cercidis C.M. Tian & Q. Yang *
(CFCC 52565T)
Pycnidia discoid (ectostromatic disc), with a solitary undivided circular locule, nearly flat, grey to brown, with one ostiole, 135–200 μm diam.Conidiophores cylindrical, tapering towards apex, straight or slightly curved, unbranched, phialidic, 7–17 × 1.4–2.1 μmAlpha conidia fusiform to oval, hyaline, aseptate, bi-guttulate,
6.5–10 × 3–3.5 μm ( x - = 8.6 × 3.3 μm, n = 30)
Beta conidia filiform, straight or hamate, hyaline, aseptate, eguttulate, 20–28.5 × 1–1.3 μm
( x - = 25.5 × 1.2 μm, n = 30)
Gamma conidia not observed
[109]
Diaporthe chamaeropicola D.S. Pereira & A.J.L. Phillips *
(CDP 0460T)
Pycnidia subglobose, dark-brown to black, lacking an ostiole, exuding a creamy mucoid conidial mass through irregular fissures on pycnidial wall, up to 4 mm diam.Conidiophores reduced to conidiogenous cells
Conidiogenous cells cylindrical, occasionally ampulliform, tapering towards apex, straight, hyaline, aseptate or 1–3-septate, smooth, unbranched or branched, with collarette (up to 1 µm long), enteroblastic (with periclinal thickening and 1–2 annellations), dimorphic, short conidiogenous cells 4.9–19.4 × 0.9–2.6 µm ( x - = 13.66 × 1.75 µm), long conidiogenous cells 15.2–49.2 × 1.1–2.7 µm ( x - = 29.54 × 1.75 µm)
Paraphyses cylindrical, straight, flexuous, tapering towards apex, hyaline, 1–2(–3)-septate at base, smooth, unbranched or branched at base, extending above conidiogeneous cells, 26.6–78.8 μm
( x - = 53.57 µm) long
Alpha conidia cylindrical to ellipsoidal, rounded apex, obtuse to truncate base, straight to slightly curved, hyaline, aseptate, smooth, biguttulate, 5.6–9.4 × 1.7–3 μm
( x - = 7.53 × 2.31 µm, L/W = 3.33)
Beta and gamma conidia not observed
[64]
Diaporthe chrysalidocarpi S.T. Huang, J.W. Xia, W.X. Sun, & X.G. Zhang *
(SAUCC 194.35T)
Pycnidia subglobose, black, exuding white or yellowish creamy conidial droplets from central ostioleConidiophores subcylindrical, swelling at base, straight or curved, hyaline, septate, smooth, branched, 27.5–35 × 1.4–2 μm
Conidiogenous cells cylindrical, tapering towards apex, terminal, straight or sinuous, phialidic, 10.5–23 × 1.4–1.8 μm
Beta conidia filiform, subtruncate base, tapering towards base, straight or slightly curved, hyaline, aseptate,
28–32.5 × 1.2–1.6 μm
( x - = 30.3 × 1.3 μm, n = 20)
Alpha and gamma conidia not observed
[110]
Diaporthe delonicis R.H. Perera, E.B.G. Jones & K.D. Hyde *
(MFLU 16-1059H)
Pycnidia globose or near-globose, brown to dark brown, exuding white creamy conidial droplets, 78–190 μm ( x - = 120 μm) diam.Conidiophores subcylindrical, hyaline,
6.4–15.2 × 1.4–2.2 μm ( x - = 11.6 × 1.9 μm)
Conidiogenous cells cylindrical, tapering towards apex, with prominent collarette, phialidic, 5.3–10.5 × 1.3–2.5 μm
( x - = 7.9 × 1.9 μm)
Alpha conidia fusoid, obtuse ends, hyaline, aseptate, 4-guttulate, smooth,
4.4–9 × 1.3–2.2 μm ( x - = 7.7 × 1.8 μm)
Beta conidia filiform, slightly curved at one end, rounded ends, hyaline, aseptate, smooth,
16–23 × 1–1.7 μm ( x - = 19.4 × 1.2 μm)
Gamma conidia not observed
[111]
Diaporthe drenthii Y.P. Tan, Akinsanmi & R.G. Shivas *
(BRIP 66524T)
Pycnidia globose or irregular, dark brown to black, up to 1 mm diam.Conidiophores hyaline, smooth, densely aggregated, 15–25 μm long
Conidiogeneous cells cylindrical, straight or flexuous, hyaline, phialidic,
10–20 × 1–2.5 μm
Alpha conidia fusiform, acute ends, hyaline, aseptate, 5.5–8.5 × 1.5–2 μm
Beta conidia sparse, curved, 25–35 × 1 μm
Gamma conidia not observed
[112]
Diaporthe endocitricola Z.Y. Dong, M. Luo, M.M. Xiang & K.D. Hyde *
(ZHKUCC 20-0012T)
Pycnidia subglobose or lageniform, multilocular, exuding hyaline to dark black creamy conidial droplets from ostiole,
124–790 × 111–635 μm
( x - = 353 × 289 μm)
Conidiophores cylindrical, hyaline,
12–40 × 1–3 μm ( x - = 26 × 2 μm)
Alpha conidia cylindrical to ellipsoid, hyaline, aseptate, multi-guttulate,
6–8 × 2–3 μm ( x - = 7 × 3 μm)
Beta conidia filiform, straight or slightly curved at one end, hyaline, aseptate,
12–30 × 1–2 μm ( x - = 19 × 2 μm)
Gamma conidia fusiform, hyaline, multi-guttulate
[113]
Diaporthe fraxini-angustifoliae R.G. Shivas, J. Edwards & Y.P. Tan *
(BRIP 54781IT)
Pycnidia subglobose, rarely with ostiolar beaks (up to 100 μm high), exuding tan to white conidial droplets from ostioleConidiophores reduced to conidiogenous cells or cylindrical to lageniform, straight to sinuous, hyaline to pale brown,
1-septate, 5–30 × 1.5–4 μm
Conidiogenous cells cylindrical, hyaline, tapering towards apex, phialidic,
5–15 × 1–2 μm
Alpha conidia scarce, cylindrical to oval, attenuated ends, hyaline to subhyaline,
(4–)5–8.5(–10) × 2–3 μm
Beta conidia abundant, flexuous to lunate, mostly curved through 45°–180° in upper third, truncate base, narrowed towards acute apex, hyaline, aseptate, (16–)17–21(–22) × 1 μm
Gamma conidia not observed
[39]
Diaporthe fulvicolor Y.S. Guo & G.P. Wang *
(CGMCC 3.19601T)
Pycnidia globose or irregular, dark brown to black, 174–316 μm diam.Conidiophores cylindrical, straight, hyaline, 1-septate, unbranched, smooth, densely aggregated, 5.5–8 × 2.5–3.5 μm
Conidiogeneous cells ampulliform, terminal, tapering towards apex, hyaline,
6.5–10 × 1.5–2.5 μm
Alpha conidia fusiform to oval, acutely rounded ends, hyaline, aseptate, bi- or multi-guttulate,
7–9 × 2–3 μm ( x - = 7.8 × 2.5 μm,
n = 50; L/W = 3.1)
Beta and gamma conidia not observed
[104]
Diaporthe guangxiensis Dissanayake, X.H. Li & K.D. Hyde *
(JZB 320094T)
Pycnidia globose, dark brown to black, 250–1550 μm
( x - = 1.1 mm, n = 20) diam.
Conidiophores cylindrical, straight or sinuous, slightly tapering towards apex, terminal, aseptate, densely aggregated,
21–35 × 1.5–2.5 μm ( x - = 27 × 2 μm)
Alpha conidia fusiform or oval, obtuse ends, hyaline, 5.3–7.8 × 1.5–3.2 μm
( x - = 6.8 × 2.5 μm, n = 40)
Beta conidia filiform, hamate, tapering towards ends, hyaline, aseptate, guttulate,
20–32 × 1–1.5 μm ( x - = 27 × 1.5 μm, n = 20)
Gamma conidia not observed
[21]
Diaporthe huangshanensis H. Zhou & C. L. Hou *
(CNUCC 201903T)
Pycnidia globose, brown to black, exuding whitish translucent conidial droplets from apex, 210–270 μm diam.Conidiophores cylindrical, straight to sinuous, hyaline, branched, 12.1–23.5 × 1.1–2.9 μmAlpha conidia ellipsoidal to olivary body, hyaline, aseptate, bi-to multi-guttulate,
5.7–8.4 × 2.7–4.5 μm
( x - = 6.9 × 3.5 μm, n = 40)
Beta conidia filiform, straight or hamate, partially guttulate, one end rounded and other acute and curved,
19.5–30 × 1.1–2.1 μm
( x - = 24.1 × 1.5 μm, n = 30)
Gamma conidia not observed
[105]
Diaporthe hunanensis Q. Yang *
(HNZZ023T)
Pycnidia globose, black,
180–300 μm diam.
Conidiophores reduced to conidiogeneous cells.
Conidiogenous cells cylindrical, straight or slightly curved, aseptate, phialidic,
(8–)9–15(–16.5) × 1.7–2.1 μm (n = 30)
Alpha conidia ellipsoidal, obtuse ends, hyaline, aseptate, bi-guttulate,
6.5–7.5(–8.5) × 2.4–2.9 μm (n = 30)
Beta and gamma conidia not observed
[107]
Diaporthe krabiensis Dayarathne *
(MFLUCC 17-2481T)
Pycnidia globose or irregular, uniloculate or multiloculate, black,
117–145 × 130–140 μm
Conidiophores cylindrical, straight to sinuous, 2–3-septate, branched, densely aggregated, rarely reduced to conidiogenous cells
Conidiogenous cells subcylindrical, tapering towards apex, hyaline, phialidic (with periclinal thickening), with flared collarette,
15–32 × 0.9–1.4 μm
( x - = 28.5 × 1.2 μm, n = 20)
Beta conidia fusiform to hooked, hyaline, aseptate, smooth,
15–32 × 0.9–1.4 μm
( x - = 28.5 × 1.2 μm, n = 20)
Alpha and gamma conidia not observed
[114]
Diaporthe limonicola Guarnaccia & Crous *
(CBS 142549T)
Pycnidia dark brown to black, exuding whitish translucent to cream conidial droplets from ostiole, 250–670 μm diam.Conidiophores cylindrical, straight, hyaline, 1-septate, smooth, densely aggregated,
5–20 × 1.5–4 μm
Conidiogenous cells cylindrical, terminal, tapering towards apex, hyaline, phialidic,
5–12 × 1–2 μm
Paraphyses hyaline,
1–3-septate, smooth, intermingled among conidiophores, up to 90 μm long and
1–2 μm diam. at apex
Alpha conidia fusiform, acute ends, hyaline, aseptate, mono- to biguttulate
5.5–8.5 × 1.5–2.5 μm
( x - = 6.8 × 2.1 μm, L/W = 2.8)
Beta conidia filiform, curved, tapering towards ends, hyaline, aseptate, eguttulate,
15–26.5 × 1–2 μm
( x - = 22.7 × 1.4 μm, L/W = 16.2)
Gamma conidia fusiform to subcylindrical, acute or rounded apex, hyaline, multiguttulate,
9–15.5 × 1–2 μm
( x - = 10.7 × 1.4 μm, L/W = 7.6)
[10]
Diaporthe liquidambaris (C.Q. Chang, Z.D. Jiang & P.K. Chi) Udayanga & Castl. *
≡ Phomopsis liquidambaris C.Q. Chang, Z.D. Jiang & P.K. Chi
(SCHM 3621H)
Pycnidia of eustroma, tuberous or irregular, unilocular to multilocular,
143–350 × 88–250 μm
Conidiophores hyaline, septate, sympodially branched, 10–25 × 1.7–3.0 μm
Conidiogenous cells hyaline, phialidic
Alpha conidia fusiform, acute ends, hyaline, aseptate, biguttulate, 6.5–8.1 × 1.7–2.2 μm
Beta conidia filiform, hamate, hyaline, aseptate, 10.5–24.5 × 0.6–1 μm
Gamma conidia not observed
[106,115]
Diaporthe litchiicola R.G. Shivas, Grice & Y.P. Tan [as “litchicola”] *
(BRIP 54900T)
Pycnidia subglobose, with black cylindrical ostiolate neck (up to 1.5 mm), up to 400 μm diam.Conidiophores reduced to conidiogeneous cells
Conidiogenous cells cylindrical, straight to sinuous, hyaline, tapering towards apex, smooth, 20–45 × 1.5–2 μm
Alpha conidia fusiform to oval, tapered at ends, cylindrical to ellipsoidal, hyaline, smooth, guttulate,
(5–)6.5–9.5(–10) × 1.5–2(–2.5) μm
Beta conidia flexuous to lunate,
(17–)20–32(–37) × 1–1.5 μm
Gamma conidia not observed
[39]
Diaporthe loropetali (C.Q. Chang, Z.D. Jiang & P.K. Chi) Y.H. Gao & L. Cai *
≡ Phomopsis loropetali C.Q. Chang, Z.D. Jiang & P.K. Chi
(SCHM 3615H)
Pycnidia of eustroma, ampullate or tuberous, unilocular, with darker and thicker wall near the ostiole,
163–338 × 88–218 μm
Conidiophores filiform, hyaline, septate, branched,
10–29 × 1.4–2.1 μm
Conidiogenous cells hyaline, phialidic
Alpha conidia fusiform to lanceolate, acute apex, obtuse base, hyaline, aseptate, biguttulate,
6.2–8.4 × 1.5–1.9 μm
Beta conidia filiform, straight or curved, hyaline, aseptate, 14–31 × 0.6–1.2 μm
Gamma conidia not observed
[26,116]
Diaporthe meliae C.M. Tian & Qin Yang *
(CFCC 53089T)
Pycnidia discoid (ectostromatic disc), with an undivided locule, dark brown, with one ostiole,
(325–)135–200(–385) μm diam. (n = 30)
Conidiophores reduced to conidiogeneous cells.
Conidiogenous cells cylindrical, tapering towards apex, straight or slightly curved, branched, hyaline,
(13.5–)15–26.5(–28) × 1.3–2.1(–2.3) μm
(n = 30)
Alpha conidia fusiform, hyaline, aseptate, multiguttulate,
(6.7–)8–9.5(–10) × (2–)2.1–2.3 μm
(L/W = 3.4–4.5, n = 30)
Beta and gamma conidia not observed
[117]
Diaporthe melitensis Guarnaccia & Crous *
(CBS 142551T)
Pycnidia dark brown to black, exuding whitish translucent to yellowish conidial droplets from ostiole, 250–650 μm diam.Conidiophores cylindrical, straight, hyaline, 1-septate, smooth, densely aggregated,
5–15 × 1.5–5.5 μm
Conidiogenous cells cylindrical, terminal, tapering towards apex, hyaline, phialidic,
6–12 × 1–3 μm
Alpha conidia fusiform, acute ends, hyaline, aseptate, 1–4-guttulate, 4.5–7 × 1.5–3 μm
( x - = 5.9 × 2.2 μm, L/W = 2.7)
Beta and gamma conidia not observed
[10]
Diaporthe millettiae H. Long, K.D. Hyde & Yong Wang bis *
(GUCC 9167T)
Pycnidia subglobose to irregular, with up to 1 mm necks when present, multilocular, ostiolate,
1.5–1.8 mm diam.
Conidiophores reduced to conidiogeneous cells or cylindrical, hyaline to pale yellowish-brown, 1-septate, 10–23 × 1–2.5 μm
Conidiogenous cells cylindrical to flexuous, tapering towards apex, hyaline,
8–18 × 1.5–3 μm
Alpha conidia fusiform, narrowed towards ends, hyaline, mostly biguttulate, 4.5–9 × 2–3.5 μm
Beta conidia scarce to abundant, flexuous to J-shaped, hyaline, 17.5–32 × 1–2 μm
Gamma conidia not observed
[118]
Diaporthe musigena Crous & R.G. Shivas *
(CBS 129519T)
Pycnidia subglobose, with elongated black necks, exuding yellow conidial droplets through ostiole, up to 250 μm diam.Conidiophores cylindrical, straight to sinuous, hyaline, 1–3-septate, smooth, branched, densely aggregated, 15–40 × 1.5–2.5 μm
Conidiogenous cells cylindrical, terminal and lateral, slightly tapering towards apex (0.5–1 μm), phialidic (with periclinal thickening), with collarette not flared (2–5 μm long)
Paraphyses cylindrical, straight, flexuous, hyaline, septate, unbranched or branched, extending above conidiophores, up to 80 μm long and 2–2.5 μm wide at base
Alpha conidia fusiform, tapering towards ends, straight to slightly curved, acutely rounded apex, subobtuse base, hyaline, aseptate, smooth, guttulate,
(7–)8–10(–12) × (2–)2.5(–3) μm
Beta conidia observed in older cultures, spindle-shaped, acutely rounded apex, truncate base, tapering more prominently in upper third, straight to curve, hyaline, aseptate, smooth,
(14–)19–22(–25) × (1.5–)2 μm
Gamma conidia ellipsoid to fusoid, acutely rounded apex, subtruncate to acutely rounded base, hyaline, aseptate, smooth, 7–9 × 4–5 μm
[119]
Diaporthe nelumbonis Sawada ex R. Kirschner *
Phyllosticta nelumbonis Sawada
(BPI 352726H)
(R. Kirschner 4114R)
Pycnidia slightly applanate, brown, ostiolate,
55–87 × 80–125 μm
Conidiophores reduced to conidiogenous cells or with a separate basal cell that often turns into an intercalary conidiogenous cell
Conidiogenous cells pyriform to obclavate or lageniform, conspicuously narrowed apex, terminal or intercalary, with minute periclinal thickening,
(3–)4.5–7.5(−9) × 2–3 μm (n = 30) in H,
(6–)6.5–10(−11) × (1.5–)2–3 (n = 20) in R
Alpha conidia oblong-ellipsoidal, straight or slightly curved, rounded apex, attenuated towards base, hyaline, aseptate, mostly biguttulate,
(6–)6.5–8(−9) × 2–2.5 μm (n = 30) in H,
(5–)6–7 × (1.5–)2 μm (n = 30) in R
Beta and gamma conidia not observed
[120]
Diaporthe oculi
Mochiz. & Kaz. Tanaka *
(MAFF 246252T)
Pycnidia globose to depressed globose, with cylindrical, central, dark brown ostiolar neck (150–480 × 80–140 μm diam.), exuding yellow to pink conidial mass,
90–250 × 110–310 μm diam.
Conidiophores reduced to conidiogenous cells
Conidiogeneous cells cylindrical to lageniform, phialidic, 6–15 × 2–5 μm
Alpha conidia fusoid-ellipsoid, hyaline, aseptate, 5–8.5 × 2–3 μm
( x - = 6.7–2.4 μm, L/W = 2.3–3.2, n = 50),
Beta and gamma conidia not observed
[42]
Diaporthe osmanthi H. Long, K.D. Hyde & Yong Wang bis *
(GUCC 9165T)
Pycnidia globose, subglobose or irregular, with up to 1 mm necks when present, multilocular, ostiolate,
up to 1–1.5 mm diam.
Conidiophores reduced to conidiogeneous cells or cylindrical, hyaline to pale yellowish-brown, 1-septate, 20.5–61 × 1–3 μm
Conidiogenous cells cylindrical to flexuous, tapering towards apex, hyaline,
10–15 × 1.5–3 μm
Alpha conidia fusiform, narrowed towards ends, hyaline, biguttulate, 5.5–8.5 × 2–3 μm
Beta conidia scarce to abundant, flexuous to
J-shaped, hyaline, 20–31.5 × 1–2.5 μm
Gamma conidia not observed
[118]
Diaporthe pascoei R.G. Shivas, J. Edwards & Y.P. Tan *
(BRIP 54847IT)
Pycnidia with ostiolar beaks (mostly up to 1.5 mm high), exuding conidial droplets from ostioleConidiophores cylindrical, straight, hyaline, 1–2-septate near base, unbranched,
5–40 × 2–3 μm
Conidiogenous cells cylindrical, terminal, hyaline, tapering towards apex, phialidic,
5–30 × 2–3 μm
Alpha conidia scarce, cylindrical, rounded apex, slightly attenuated base, hyaline,
(3.5–)4–5 × 1–2 μm
Beta conidia abundant, flexuous to lunate, often curved up to 90° at apex, truncated base, narrowed towards apex, hyaline,
(15–)19–31(–39) × 1–1.5 μm
Gamma conidia not observed
[39]
Diaporthe perseae
(CBS 151.73)
Pycnidia globose, black, exuding cream conidial droplets through central ostiole, up to 400 μm diam.Conidiophores cylindrical, straight to sinuous, hyaline, 1–3-septate, smooth, branched, densely aggregated, 15–35 × 3–4 μm
Conidiogenous cells cylindrical, terminal and lateral, slightly tapering towards apex (1–1.5 μm), phialidic (with periclinal thickening), with prominent collarette (up to 5 μm long),
8–17 × 1.5–2.5 μm
Paraphyses subcylindrical, obtuse ends, hyaline, 2–4-septate, smoooth, up to 60 μm long and 3 μm diam.
Alpha conidia fusoid to ellipsoid, tapering towards ends, straight, subobtuse apex, subtruncate base, hyaline, aseptate, smooth, guttulate, (6–)7–8(–9) × 2(–2.5) μm
Beta conidia spindle-shaped, tapering from lower third towards apex, curved, acutely rounded apex, truncate base, hyaline, aseptate, smooth,
(15–)22–25(–28) × 1.5(–2) μm
Gamma conidia ellipsoid to fusoid, acutely rounded apex, subtruncate base, hyaline, aseptate, smooth, 9–14× 1.5–2 μm
[24]
Diaporthe pescicola Dissanayake, J.Y. Yan, X.H. Li & K.D. Hyde *
(MFLUCC 16-0105T)
Pycnidia globose, dark brown to black, up to 300 μm diam.Conidiophores cylindrical, straight or sinuous, terminal, slightly tapering towards apex, aseptate, densely aggregated,
21–35 × 1.5–2.5 μm ( x - = 27 × 2 μm)
Alpha conidia fusiform or oval, obtuse ends, hyaline, biguttulate,
6–8.5 × 2–3 μm ( x - = 8 × 3 μm)
Beta conidia filiform, hamate, tapering towards ends, hyaline, aseptate,
18–37 × 1–1.5 μm ( x - = 27 × 1.5 μm)
Gamma conidia not observed
[41]
Diaporthe phyllanthicola (C.Q. Chang, Z.D. Jiang & P.K. Chi) Y.H. Gao & L. Cai *
Phomopsis phyllanthicola C.Q. Chang, Z.D. Jiang & P.K. Chi
(SCHM 3680H)
Pycnidia of eustroma, triangle, tuberous or irregular, unilocular to multilocular, with darker and thicker wall at the base,
185–425 × 100–125 μm
Conidiophores hyaline, septate, branched,
12.5–29 × 1.7–2.6 μm
Conidiogenous cells hyaline, phialidic
Alpha conidia fusiform, hyaline, aseptate, eguttulate or biguttulate,
6.6–8.2 × 1.5–1.8 μm
Beta conidia filiform, curved or hamate, hyaline, aseptate, 13.5–26.5 × 0.6–0.9 μm
Gamma conidia not observed
[26,106]
Diaporthe podocarpi-
-macrophylli Y.H. Gao & L. Cai *
(CGMCC 3.18281T)
Pycnidia subglobose, dark brown to black, exuding yellowish translucent conidial droplets from ostiole, 250–699 μm diam.Alpha conidiophores cylindrical, straight to sinuous, sometimes inflated, hyaline, septate, branched, in dense clusters,
6–18 × 1.5–3 μm ( x - = 12.3 × 2.1 μm, n = 30)
Beta conidiophores cylindrical to clavate, straight, hyaline, septate, branched, smooth,
10.5–27 × 1.5–2.5 μm
( x - = 15.3 × 2.1 μm, n = 30)
Alpha conidia fusiform, acute ends, hyaline, aseptate, biguttulate,
3.5–8.5 × 1–3 μm ( x - = 6.3 × 2.1 μm, n = 50)
Beta conidia filiform, curved, tapering towards ends, truncate base, hyaline, aseptate, eguttulate, 8.5–31.5 × 0.5–2 μm
( x - = 19.5 × 1.1 μm, n = 30)
Gamma conidia not observed
[26]
Diaporthe pseudomangiferae R.R. Gomes, Glienke & Crous *
(CBS 101339T)
Pycnidia globose, with elongated necks with central ostioles, exuding yellow–orange to cream conidial droplets, up to 300 μm diam.Conidiophores cylindrical, straight to sinuous, hyaline, 1–3-septate, smooth, branched, densely aggregated, 20–30 × 2–2.5 μm
Conidiogenous cells cylindrical, terminal and lateral, slightly tapering towards apex, phialidic, with flared collarette (up to 3 μm long), 10–15 × 2–3 μm
Paraphyses cylindrical, straight to flexuous, hyaline, septate, smooth, unbranched or branched at base, extending above conidiophores, up to 80 μm long and 2–3 μm wide at base
Alpha conidia fusiform, tapering towards ends, acutely rounded apex, truncate base, hyaline, aseptate, smooth, guttulate to granular,
(6–)7–9(–10) × (2–)2.5(–3) μm
Beta and gamma conidia not observed
[24]
Diaporthe pseudooculi Mochiz. and Kaz. Tanaka *
(MAFF 246452T)
Pycnidia globose to depressed globose, with cylindrical to papillate, central ostiolar neck (100–220 × 45–130 μm diam.), exuding white to yellow conidial mass,
220–330 × 180–280 μm diam.
Conidiophores hyaline, 5–12 × 2–5 μm
Conidiogeneous cells cylindrical, phialidic,
12–18 × 2 μm
Paraphyses filamentous, 50–65 × 1.5–2.5 μm
Alpha conidia ellipsoid, hyaline, aseptate,
6–9 × 2–3.5 μm
( x - = 7.3–2.8 μm, L/W = 2.1–3.2, n = 50)
Beta conidia sigmoid, hyaline, aseptate,
21.5–33.5 × 1.2–1.7 μm
( x - = 27–1.4 μm, n = 30)
Gamma conidia not observed
[42]
Diaporthe pseudophoenicicola R.R. Gomes, C. Glienke & Crous *
(CBS 462.69T)
Pycnidia globose, with neck, exuding yellow-orange conidial droplets through ostiole, up to
400 μm diam.
Conidiophores cylindrical, straight to curved, hyaline, 1–3-septate, smooth, branched, densely aggregated, 12–45 × 1.5–3 μm
Conidiogenous cells cylindrical, terminal and lateral, slightly tapering towards apex, phialidic (with periclinal thickening), with collarette flared (2–5 μm long),
8–15 × 1.5–2.5 μm
Paraphyses cylindrical, hyaline, 1–3-septate, smoooth, straigh to flexuous, extending above conidiophores, up to 100 μm long and 3 μm wide at base
Alpha conidia fusiform, tapering towards ends, straight, acutely rounded apex, truncate base, hyaline, aseptate, smooth, granular,
(6–)7–8(–9) × (2–)2.5(–3) μm
Beta and gamma conidia not observed
[24]
Diaporthe pterocarpicola Udayanga, Xing Z. Liu and K.D. Hyde *
(MFLUCC 10-0580aT)
Pycnidia hemi-spherical, with slightly elongated black neck, exuding yellowish translucent conidial droplets from ostiole, up to
75 × 120 μm
Conidiophores subcylindrical to cylindrical, wide at base, straight to sinuous, hyaline, unbranched, densely aggregated,
7–18 × 1.5–3.5 μm, 2.5–3.5 wide at base
Conidiogenous cells cylindrical, terminal, slightly tapering towards apex, phialidic (with periclinal thickening), 1–2 μm diam.
Paraphyses occasionally present, cylindrical, straight to flexuous, hyaline, septate, smooth, unbranched, extending above conidiophores, up to 25 μm long and
1.5–2 μm wide at base
Alpha conidia ellipsoid or clavate, subtruncate base, hyaline, aseptate, multiguttulate,
(5–)6–7(–8) × (2–)2.5(–3.5) μm
Beta and gamma conidia not observed
[31]
Diaporthe schimae C.M. Tian and Q. Yang *
(CFCC 53103T)
Pycnidia globose, exuding cream to yellowish translucent conidial droplets from ostiole,
(150–)180–300(–373) μm diam.
Conidiophores reduced to conidiogeneous cells.
Conidiogenous cells straight, slightly tapering towards apex, hyaline, septate, unbranched
Alpha conidia scarce, ellipsoidal to spindle-shaped, hyaline, aseptate, 4-guttulate,
(7.5–)8–8.5(–9) × 2.5–3 μm
Beta conidia filiform, straight to sinuous at one end, hyaline, aseptate, eguttulate,
(25–)27.5–38.5(–40.5) × 1–1.5 µm
Gamma conidia not observed
[121]
Diaporthe searlei R.G. Shivas, Akinsanmi & Y.P. Tan *
(BRIP 66528T)
Pycnidia globose or irregular, dark brown to black, up to 1 mm diam.Conidiophores hyaline, smooth, densely aggregated, 15–45 μm long
Conidiogeneous cells cylindrical, straight or flexuous, hyaline, phialidic,
10–35 × 1–2.5 μm
Alpha conidia fusiform, acute ends, hyaline, aseptate, 5–9 × 1.5–2 μm
Beta and gamma conidia not observed
[112]
Diaporthe sennae C.M. Tian and Qin Yang *
(CFCC 51636T)
Pycnidia circular to ovoid, uniloculate and undivided, ectostromatic disc brown to dark, with one ostiole,
(400–)500–600(–680) μm
( x - = 570 μm, n = 20) diam.
Conidiophores reduced to conidiogeneous cells.
Conidiogenous cells straight or slightly curved, hyaline, phialidic
Alpha conidia ellipsoidal to oval, hyaline, aseptate, smooth, biguttulate, rarely
3-guttulate,
(5–)5.5–6.3(–6.5) × 1.5–1.7(–1.8) μm
( x - = 6 × 1.6 μm, n = 50)
Beta conidia straight to hamate, hyaline, aseptate, smooth, (17.3–)18.4–20(–23.3) × 0.9 μm
( x - = 19.1 × 0.9 μm, n = 50)
Gamma conidia not observed
[122]
Diaporthe spinosa Y.S. Guo and G.P. Wang *
(CGMCC 3.19602T)
Pycnidia globose, dark brown to black, 124–172 μm diam.Conidiophores ampulliform, hyaline, 1-septate, smooth, unbranched, densely aggregated,
6–9 × 3–4.5 μm
Conidiogeneous cells cylindrical, straight, terminal, tapering towards apex, hyaline,
8–29 × 1.5–2.5 μm
Alpha conidia fusiform to oval, acutely rounded ends, hyaline, aseptate, bi- or multi-guttulate,
5.5–8 × 2–3.5 μm
( x - = 7 × 2.6 μm, n = 50; L/W = 2.7)
Beta conidia filiform, curved, tapering towards ends, multi-guttulate,
18.5–30.5 × 1–1.5 μm
( x - = 25.1 × 1.3 μm, n = 38; L/W = 19.3)
Gamma conidia not observed
[104]
Diaporthe taiwanensis H.A. Ariyaw. and I. Tsai *
(NTUCC 18-105-1T)
Pycnidia irregular, with hairy neck, exuding yellowish conidial droplets, up to 270 μm diam.Conidiophores cylindrical, hyaline, septate, branched, 11–15 × 1–2.5 μm
Conidiogenous cells subcylindrical, straight to curved, tapering towards apex, hyaline,
7–8.5 × 1–2.5 μm
Alpha conidia fusiform, acute ends, hyaline, aseptate, 1–3-guttulate,
7–9.5 × 2.5–3 μm
Beta conidia acutely rounded and curved apex, hyaline, smooth,
24–30 × 1–2 μm
Gamma conidia not observed
[123]
Diaporthe taoicola Dissanayake, X.H. Li & K.D. Hyde *
(MFLUCC 16-0117T)
Pycnidia globose, black, multilocular, exuding cream conidial droplets from central ostiole, up to 300 μm diam.Conidiophores cylindrical, straight to sinuous, hyaline, smooth, densely aggregated,
10–25 × 2–3 μm
Conidiogenous cells cylindrical, terminal and lateral, slightly tapering towards apex, phialidic, 9–16 × 1.5–2 μm
Paraphyses cylindrical, with obtuse ends, hyaline, 1–3-septate, smooth, extending above conidiophores
Alpha conidia fusoid to ellipsoid, subobtuse apex, bluntly rounded base with flattened hilum, tapering towards ends, straight, hyaline, smooth, guttulate,
7–9 × 2–3 μm ( x - = 8 × 3 μm)
Beta conidia spindle-shaped, curved, tapering towards subacutely rounded apex, truncate base, hyaline, aseptate,
20–25 × 1.5–2 μm ( x - = 19 × 2 μm)
Gamma conidia not observed
[41]
Diaporthe viciae W.S. Zhao, Q. Ning and J.Y. Yan *
(JZB 320179T)
Pycnidia oval to round, black, 150–200 × 150–250 μmConidiophores cylindrical, aseptate, densely aggregated, 15–32.5 μm long
Conidiogenous cells cylindrical, terminal and lateral, phialidic
Alpha conidia fusiform or oval, hyaline,
2–5-guttulate, 7–10 × 2–4 μm
( x - = 8.3 × 3 μm, n = 50)
Beta and gamma conidia not observed
[124]
Diaporthe viniferae Dissanayake, X.H. Li & K.D. Hyde *
(JZB 320071T)
Pycnidia globose, dark brown to black, 363–937 μm
( x - = 529 μm, n = 20) diam.
Conidiophores not observed
Conidiogenous cells not observed
Alpha conidia fusiform or oval, obtuse ends, hyaline, bi-guttulate,
5–8.3 × 1.3–2.5 μm ( x - = 6.4 × 2.1 μm)
Beta conidia filiform, hamate, tapering towards ends, hyaline, aseptate,
23–35 × 1–1.5 μm ( x - = 28 × 1.3 μm, n = 40)
Gamma conidia not observed
[21]
1 Species synonymized in the present study under Diaporthe arecae are noted with a superscript asterisk (*); status of the strains or specimens are noted by superscript H (holotype), IH (isotype), IT (ex-isotype), R (reference) and T (ex-type); 2 N/A = not available, i.e., feature not mentioned by the respective authors in the taxonomic description of the species; Note: seven species synonymized in the present study under Diaporthe arecae were excluded from this synopsis due to lack of morphological data regarding their asexual morphs. Diaporthe annellsiae Y.P. Tan and R.G. Shivas, Diaporthe bounty Y.P. Tan and R.G. Shivas, Diaporthe gossiae Y.P. Tan and R.G. Shivas, Diaporthe howardiae Y.P. Tan & R.G. Shivas and Diaporthe norfolkensis Y.P. Tan & R.G. Shivas were introduced by Tan and Shivas [125] based on the diagnosis of sequence data obtained apparently from the type specimens and no taxonomic descriptions were provided. Diaporthe hongheensis E.F. Yang and Tibpromma (KUMCC 21-0457T) was introduced by Yang et al. [126] based on morpho-molecular analyses, but only the sexual morph was observed on the host tissue, and no sporulation was observed in culture. Diaporthe pandanicola Tibpromma and K.D. Hyde was introduced by Tibpromma et al. [127] based on the diagnosis of sequence data, since no sporulation was observed in culture.
Table 6. Summary of host, country and ecological group for all type specimens proposed as synonymous to Diaporthe arecae.
Taxon 1HostCountryEcological Group 2Reference
Diaporthe arecaeFruit of Areca catechu (Arecaceae)IndiaPotential pathogen[38]
Diaporthe acuta *Diseased branches of Pyrus pyrifolia (Rosaceae)China (Hubei)Pathogen[104]
Diaporthe annellsiae *Fruit of Mangifera indica (Anacardiaceae)Australia (Western Australia)UN[125]
Diaporthe anhuiensis *Leaves of Cunninghamia lanceolata (Cupressaceae)China (Anhui)Endophyte[105]
Diaporthe arengae *Arenga engleri (Arecaceae)China (Hong Kong)UN[24]
Diaporthe averrhoae *Branches of Averrhoa carambola (Oxalidaceae)China (Fujian)UN[106]
Diaporthe bounty *Leaf spots of Malus domestica (Rosaceae)Australia (Norfolk Island)Potential pathogen[125]
Diaporthe camelliae-oleiferae *Leaf spots of Camellia oleifera (Theaceae)China (Hunan)Potential pathogen[107]
Diaporthe ceratozamiae *Leaf spots of Ceratozamia robusta (Zamiaceae)Australia (Queensland)Potential pathogen[108]
Diaporthe cercidis *Twigs and branches of Cercis chinensis (Fabaceae)China (Jiangsu)UN[109]
Diaporthe chamaeropicola *Leaf spots of Chamaerops humilis (Arecaceae)Portugal (Lisbon)Potential pathogen[64]
Diaporthe chrysalidocarpi *Leaf spots of Chrysalidocarpus lutescens (Arecaceae)China (Yunnan)Potential pathogen[110]
Diaporthe delonicis *Seed pods of Delonix regia (Fabaceae)Thailand (Chiang Rai)Saprophyte[111]
Diaporthe drenthii *Rotten husk of Macadamia sp. (Proteaceae)South Africa (KwaZulu-Natal)Pathogen[112]
Diaporthe endocitricola *Fruits of Citrus grandis (Rutaceae)China (Guangdong)Endophyte[113]
Diaporthe fraxini-angustifoliae *Diseased stems of Fraxinus angustifolia (Oleaceae)Australia (Victoria)Potential pathogen[39]
Diaporthe fulvicolor *Diseased branches of Pyrus pyrifolia (Rosaceae)China (Hubei)Pathogen[104]
Diaporthe gossiae *Stem of Sesbania sp. (Fabaceae)Australia (Western Australia)UN[125]
Diaporthe guangxiensis *Diseased trunk of Vitis vinifera (Vitaceae)China (Guangxi)Pathogen[21]
Diaporthe hongheensis *Branch of Mangifera indica (Anacardiaceae)China (Yunnan)Saprophyte[126]
Diaporthe howardiae *Leaf spots of Agave sp. (Asparagaceae)Australia (Norfolk Island)Potential pathogen[125]
Diaporthe huangshanensis *Leaves of Camellia oleifera (Theaceae)China (Anhui)Endophyte[105]
Diaporthe hunanensis *Leaf spots of Camellia oleifera (Theaceae)China (Hunan)Potential pathogen[107]
Diaporthe krabiensis *Submerged wood of Bruguiera sp. (Rhizophoraceae)Thailand (Krabi)Saprophyte[114]
Diaporthe limonicola *Branch canker of Citrus limon (Rutaceae)Malta (Gozo)Pathogen[10]
Diaporthe liquidambaris *Branches of Liquidambar formosana (Altingiaceae)China (Fujian)UN[106]
Diaporthe litchiicola *Diseased Litchi chinensis (Sapindaceae)Australia (Queensland)Potential pathogen[39]
Diaporthe loropetali *Branches of Loropetalum chinense (Hamamelidaceae)China (Hunan)UN[116]
Diaporthe meliae *Branche canker of Melia azedarach (Meliaceae)China (Shandong)Potential pathogen[117]
Diaporthe melitensis *Branch canker of Citrus limon (Rutaceae)Malta (Gozo)Pathogen[10]
Diaporthe millettiae *Leaves of Millettia reticulata (Fabaceae)China (Guangxi)UN[118]
Diaporthe musigena *Necrotic leaves of Musa sp. (Musaceae)Australia (Queensland)Potential pathogen[119]
Diaporthe nelumbonis *Leaf spots of Nelumbo nucifera (Nelumbonaceae)China (Taiwan, Taipei)Potential pathogen[120]
Diaporthe norfolkensis *Panicle of Mangifera indica (Anacardiaceae)Australia (Norfolk Island)UN[125]
Diaporthe oculi *Diseased human eyeJapan (Gifu)Pathogen[42]
Diaporthe osmanthi *Leaves of Osmanthus fragrans (Oleaceae)China (Guangxi)UN[118]
Diaporthe pandanicola *Leaves of Pandanus sp. (Pandanaceae)Thailand (Chumphon)Endophyte[127]
Diaporthe pascoei *Roten fruit of Persea Americana (Lauraceae)Australia (Victoria)Potential pathogen[39]
Diaporthe pescicola *Shoots of Prunus persica (Rosaceae)China (Hubei)Pathogen[41]
Diaporthe phyllanthicola *Branches of Phyllanthus emblica (Phyllanthaceae)China (Fujian)UN[106]
Diaporthe podocarpi-macrophylli *Leaves of Podocarpus macrophyllus (Podocarpaceae)JapanUN[26]
Diaporthe pseudomangiferae *Mangifera indica (Anacardiaceae)Dominican RepublicUN[24]
Diaporthe pseudooculi *Diseased human eyeJapan (Gifu)Pathogen[42]
Diaporthe pseudophoenicicola *Dead tops of green leaves on Phoenix dactylifera (Arecaceae)Spain (Mallorca)UN[24]
Diaporthe pterocarpicola *Leaf spot of Pterocarpus indicus (Fabaceae)Thailand (Chiang Rai)Potential pathogen[31]
Diaporthe schimae *Leaf spots of Schima superba (Theaceae)China (Jiangxi)Potential pathogen[121]
Diaporthe searlei *Rotten husk of Macadamia sp. (Proteaceae)South Africa (Mpumalanga)Pathogen[112]
Diaporthe sennae *Diseased twigs and branches of Senna bicapsularis (Fabaceae)China (Guangxi)Potential pathogen[122]
Diaporthe spinosa *Diseased branches of Pyrus pyrifolia (Rosaceae)China (Jiangsu)Pathogen[104]
Diaporthe taiwanensis *Leaf spots of Ixora chinensis (Rubiaceae)China (Taiwan, Taoyuan)Pathogen[123]
Diaporthe taoicola *Shoots of Prunus persica (Rosaceae)China (Hubei)Pathogen[41]
Diaporthe viciae *Stems of Vicia villosa (Fabaceae)China (Guangxi)Endophyte[124]
Diaporthe viniferae *Diseased trunk of Vitis vinifera (Vitaceae)China (Guangxi)Pathogen[21]
1 Species synonymized in the present study under Diaporthe arecae are noted with a superscript asterisk (*); species originally described from Arecaceae hosts are highlighted in bold; 2 UN: unknown, information not mentioned by the respective authors; the ecological group “potential pathogen” stands for those species recovered from symptomatic tissues, but for which pathogenicity tests were not conducted to prove their pathogenicity.
Disclaimer/Publisher’s Note: The statements, opinions and data contained in all publications are solely those of the individual author(s) and contributor(s) and not of MDPI and/or the editor(s). MDPI and/or the editor(s) disclaim responsibility for any injury to people or property resulting from any ideas, methods, instructions or products referred to in the content.

