
Phylotypic Diversity of Bacteria Associated with Speleothems of a Silicate Cave in a Guiana Shield Tepui


 , ,
, ,
Abstract
:1. Introduction
2. Materials and Methods
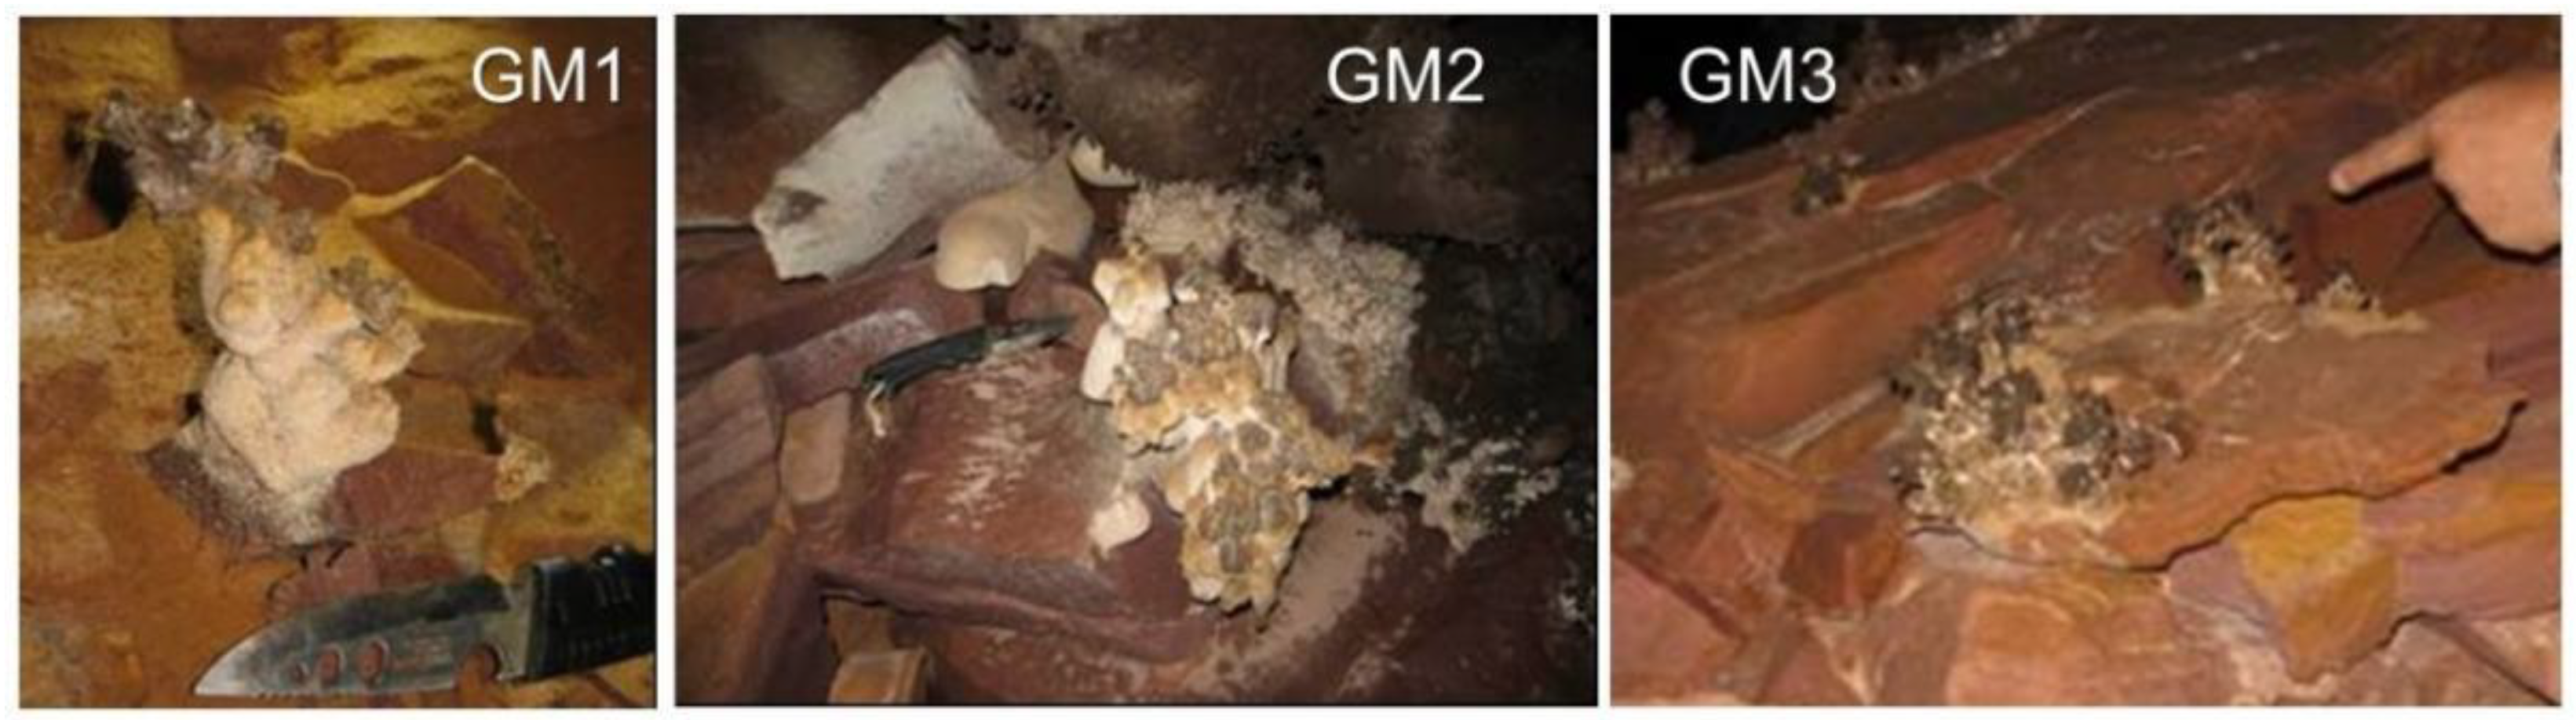
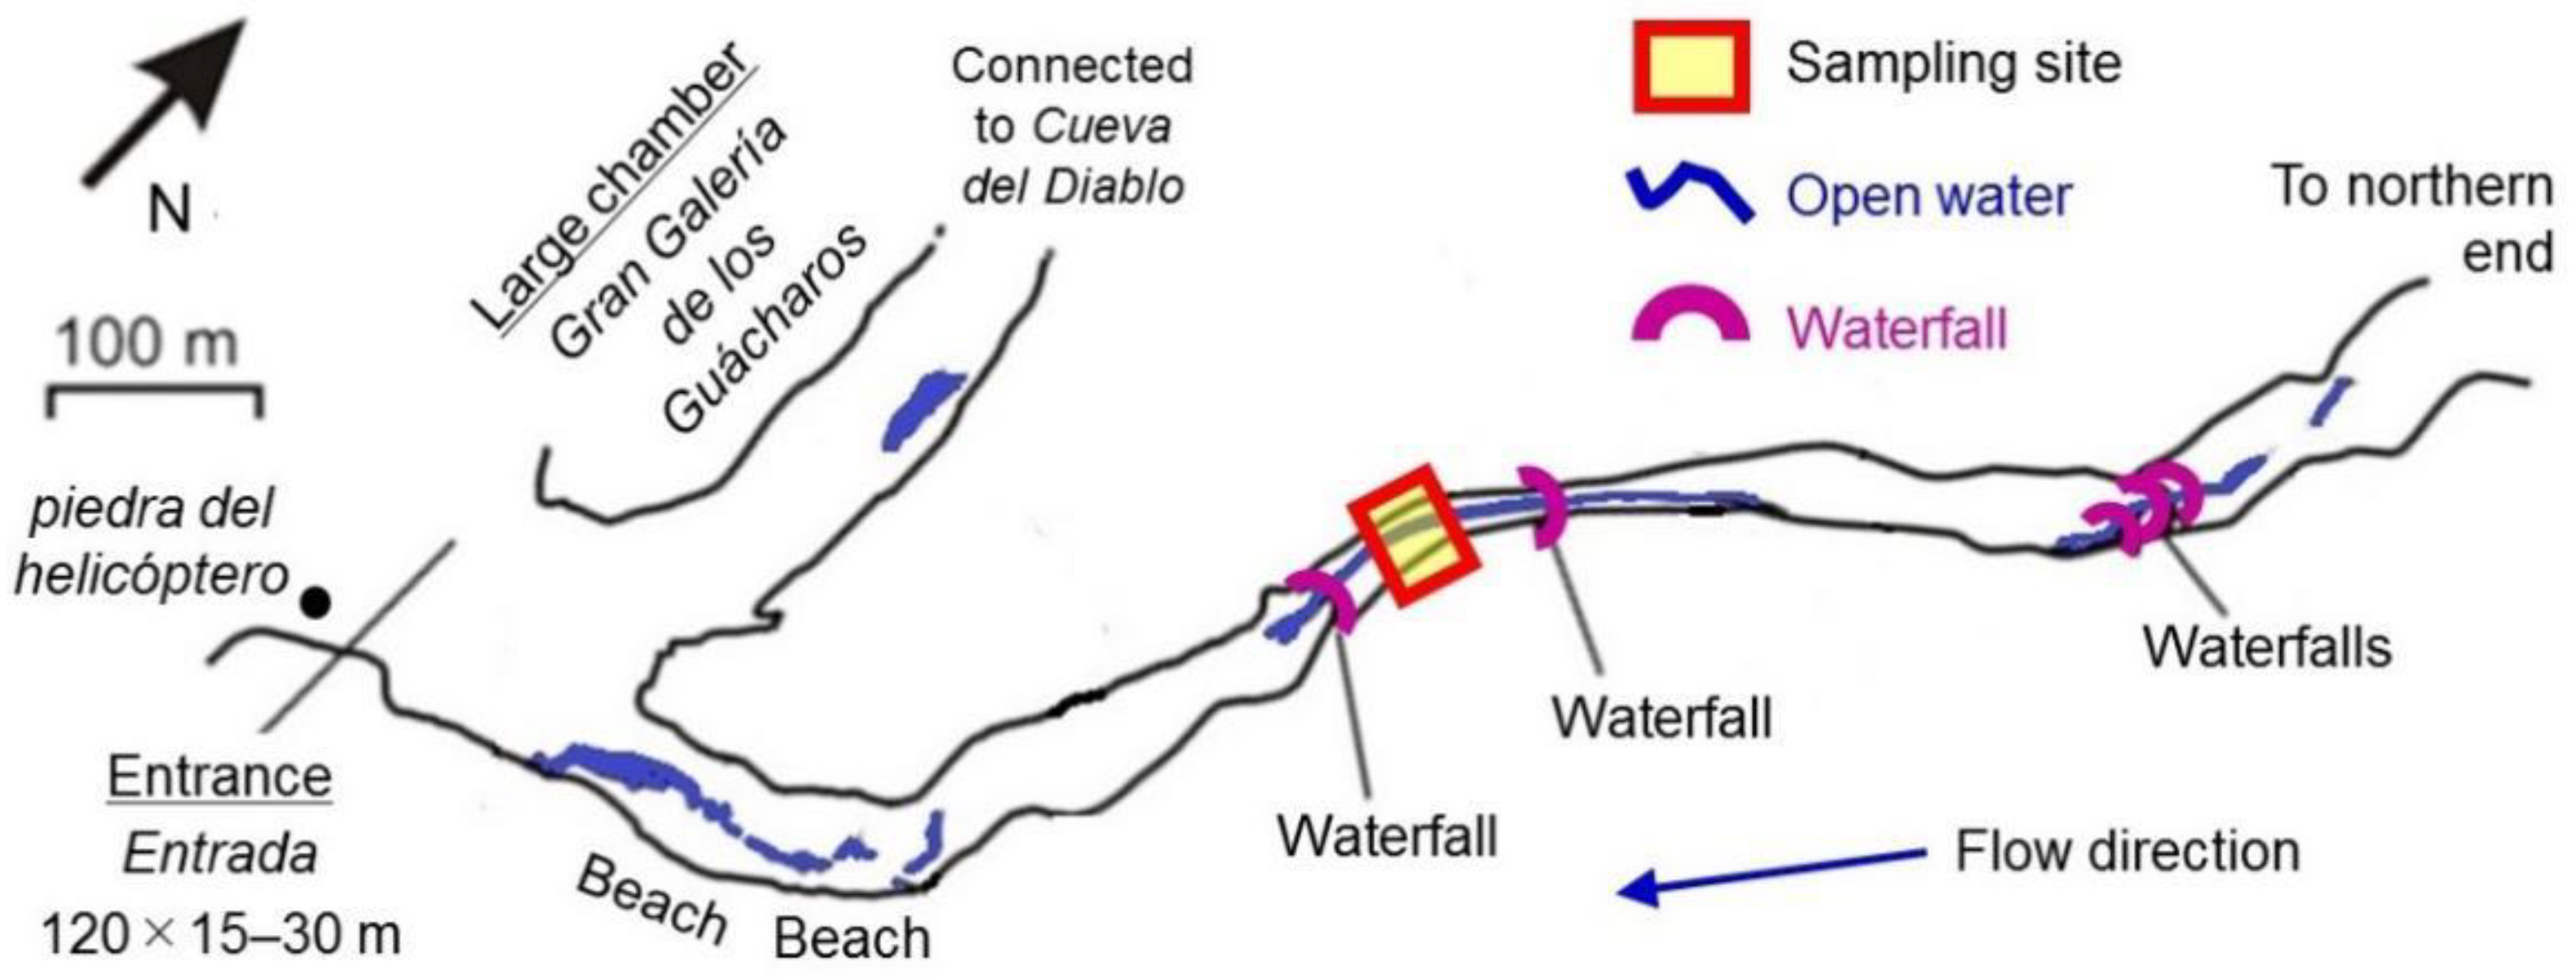
2.1. Speleothem Sample Collection
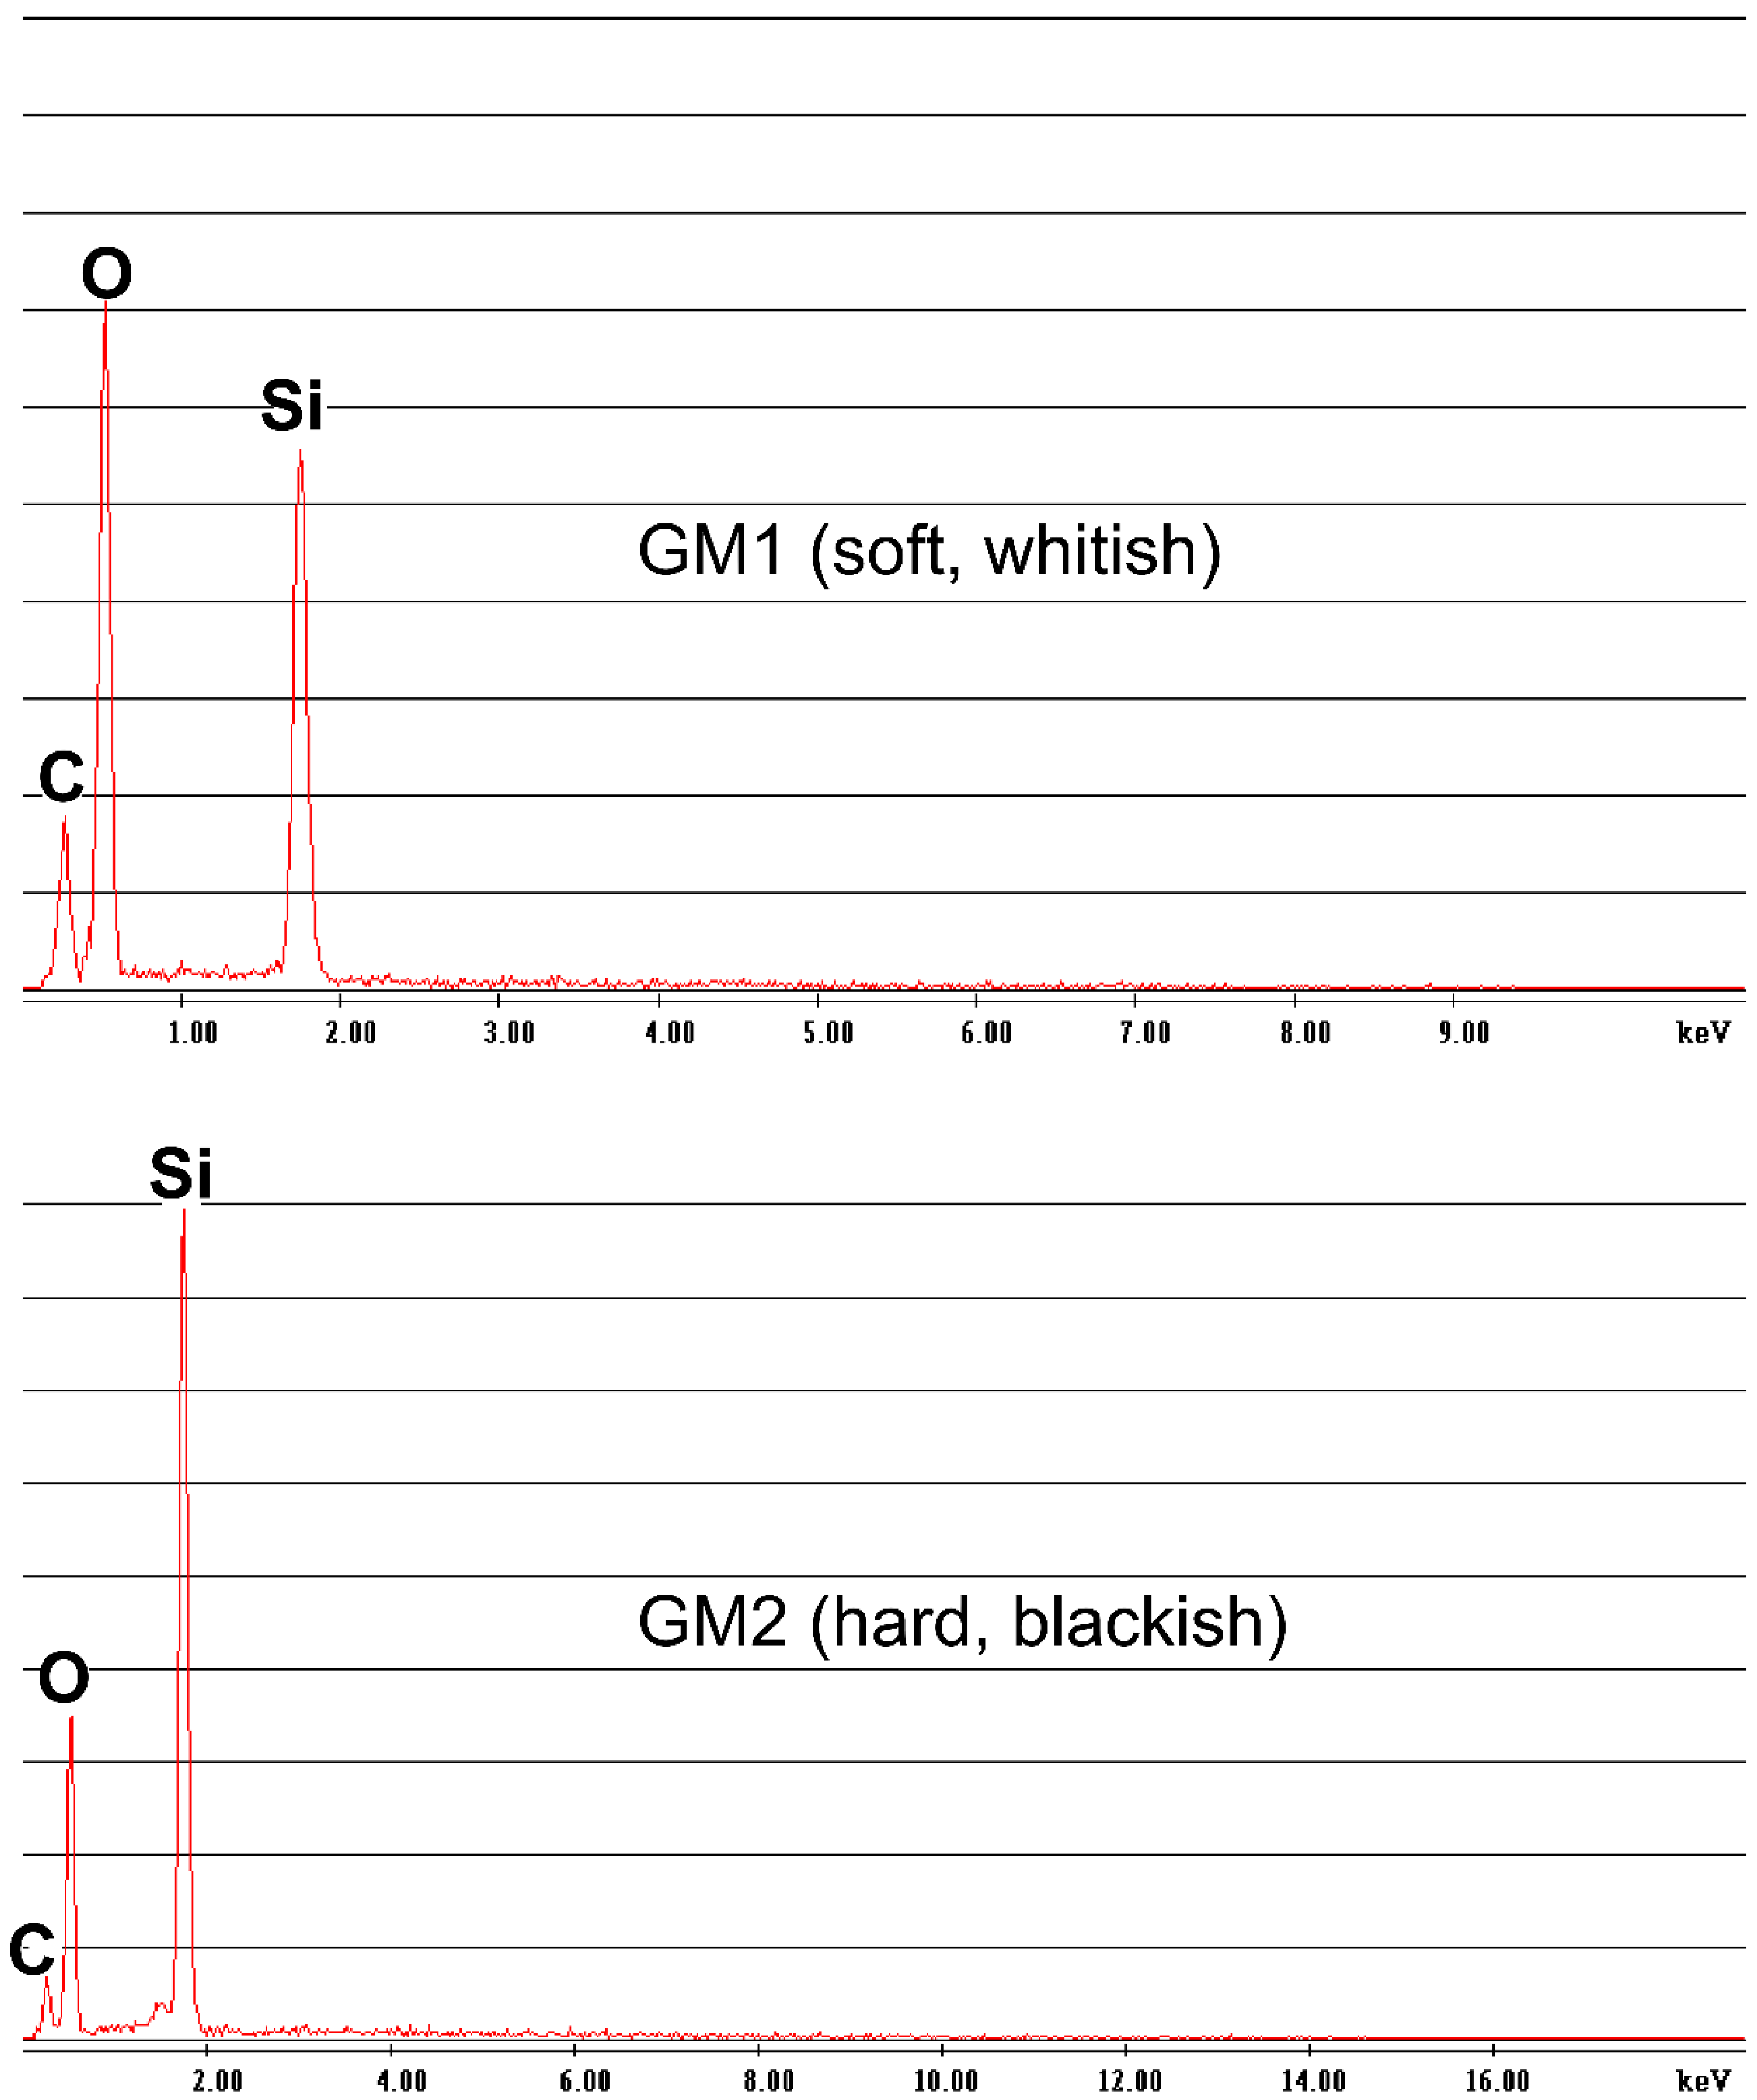
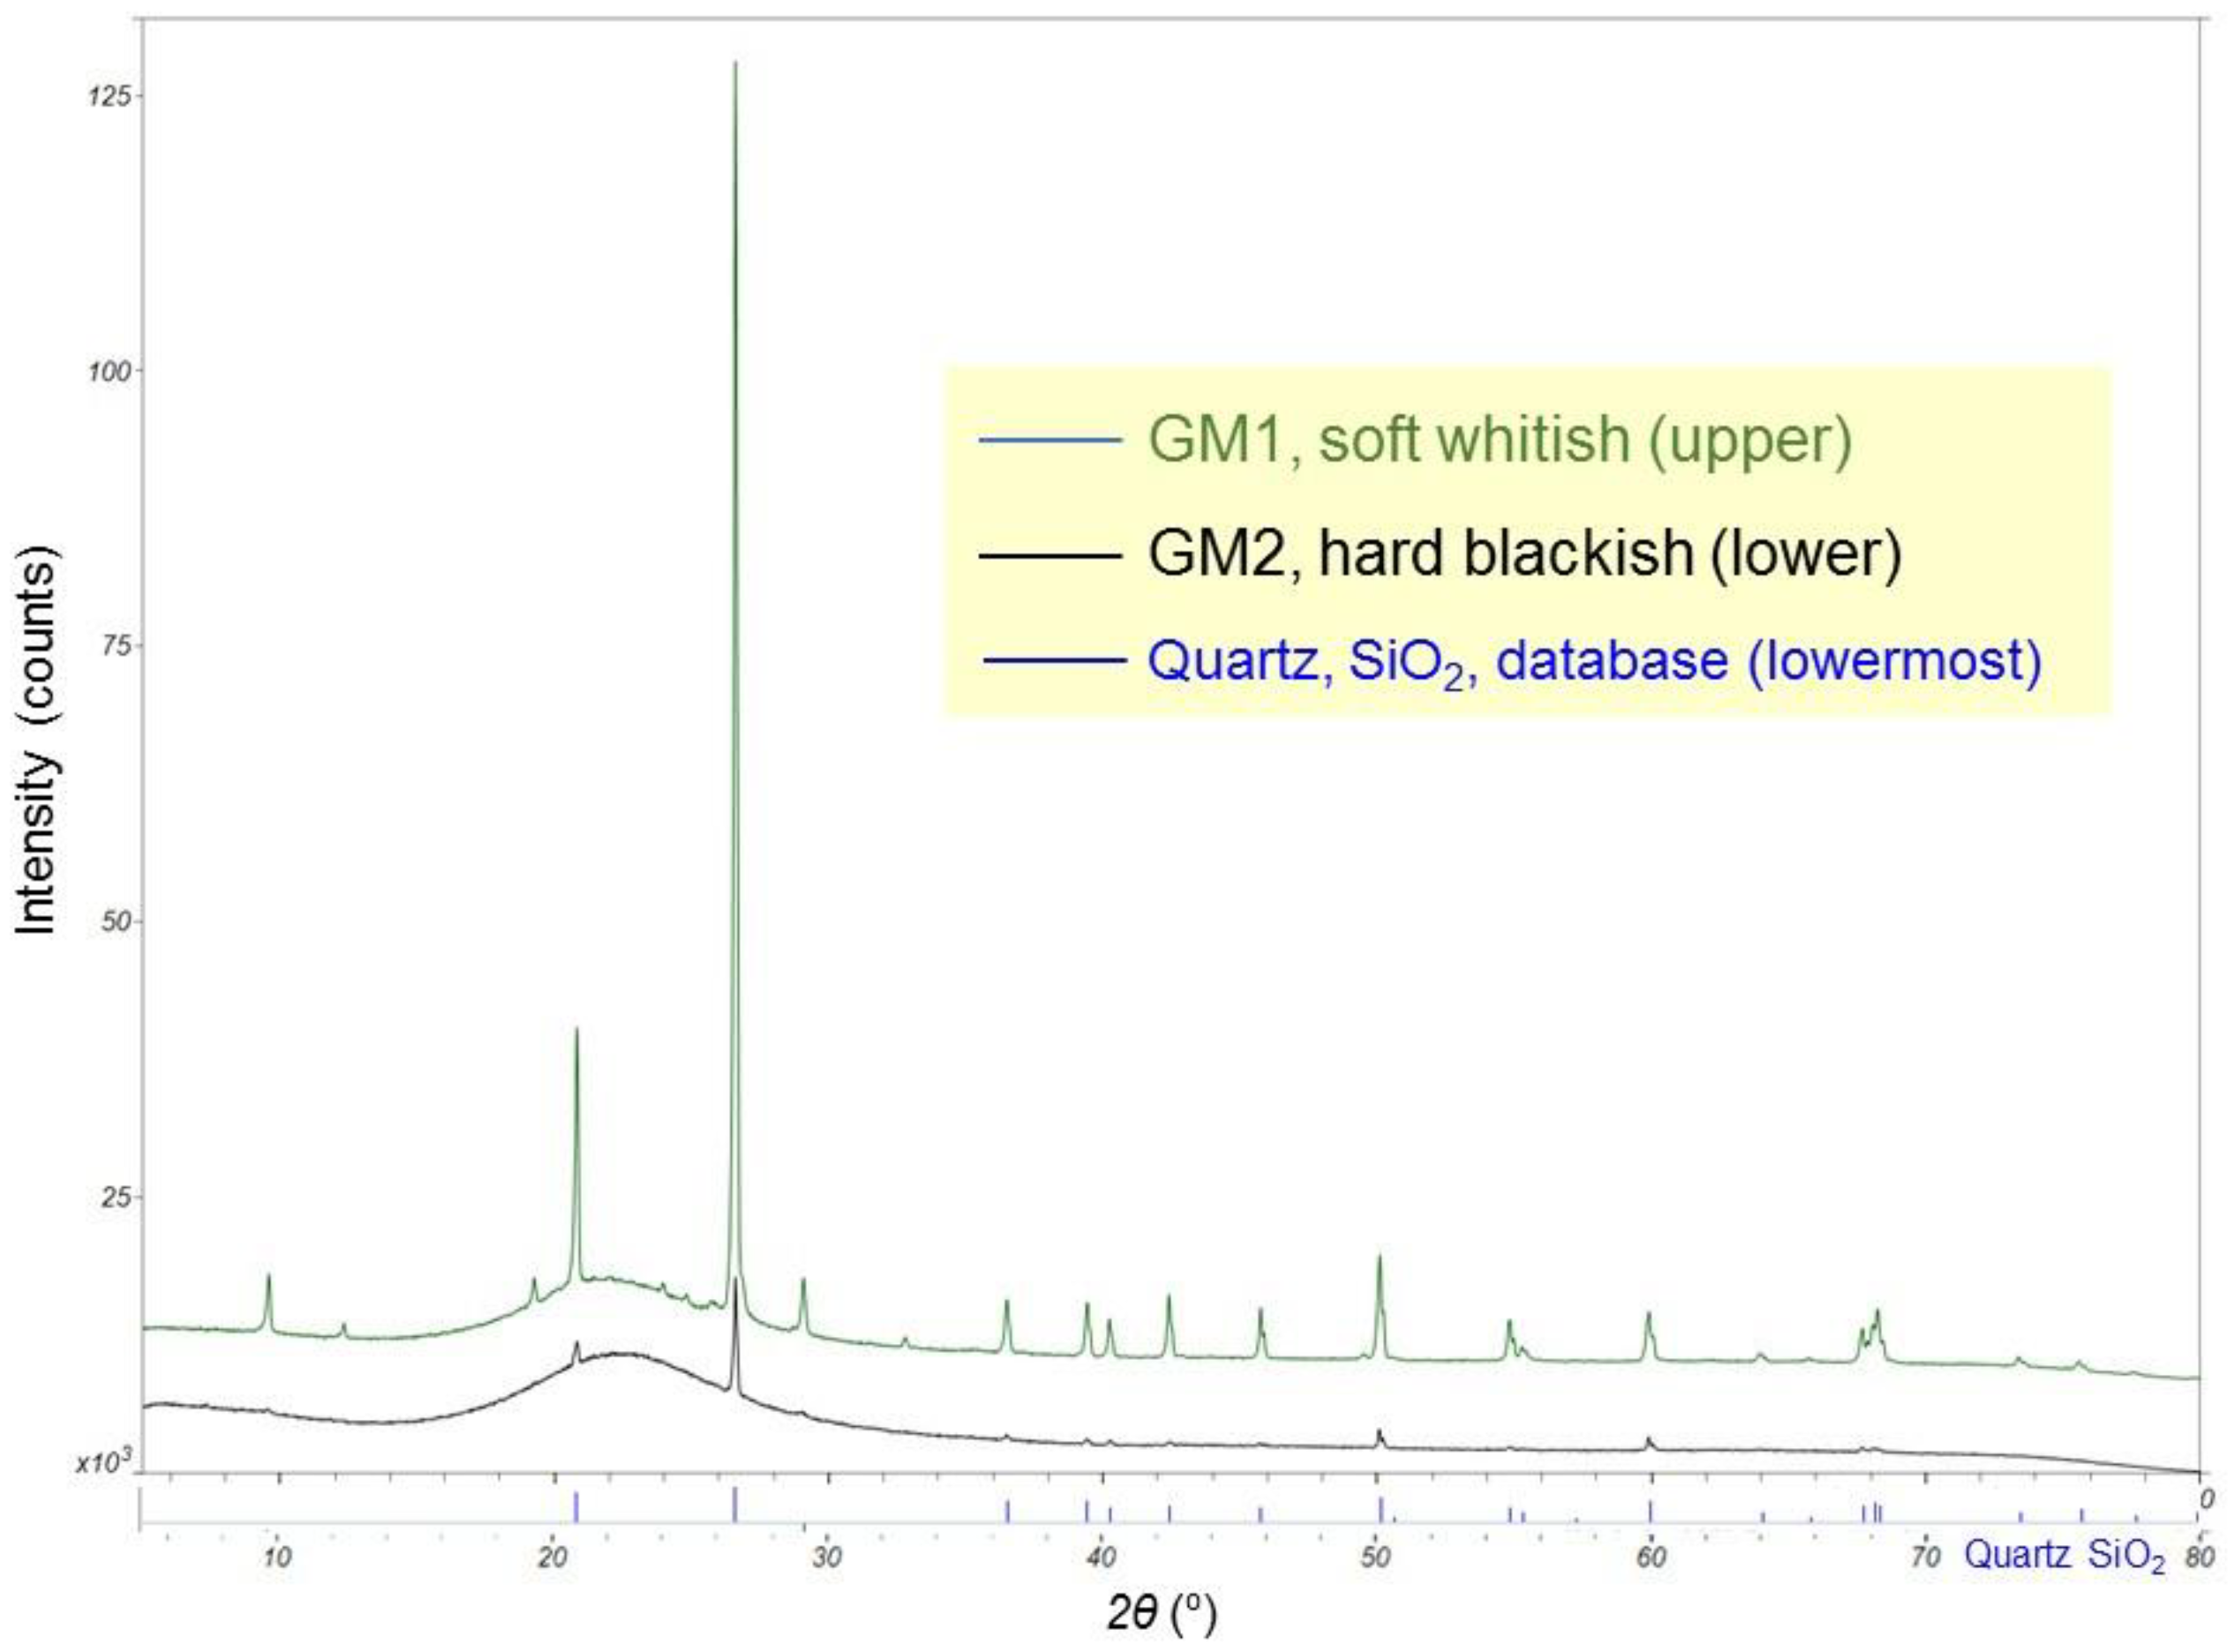
2.2. Crystallographic and Geochemical Analyses
2.3. DNA Extraction, PCR Amplification, and MiSeq Sequencing
2.4. Statistical and Bioinformatic Analyses of the MiSeq-Generated V3–V4 Sequences
2.5. Sequence Data Deposition
3. Results
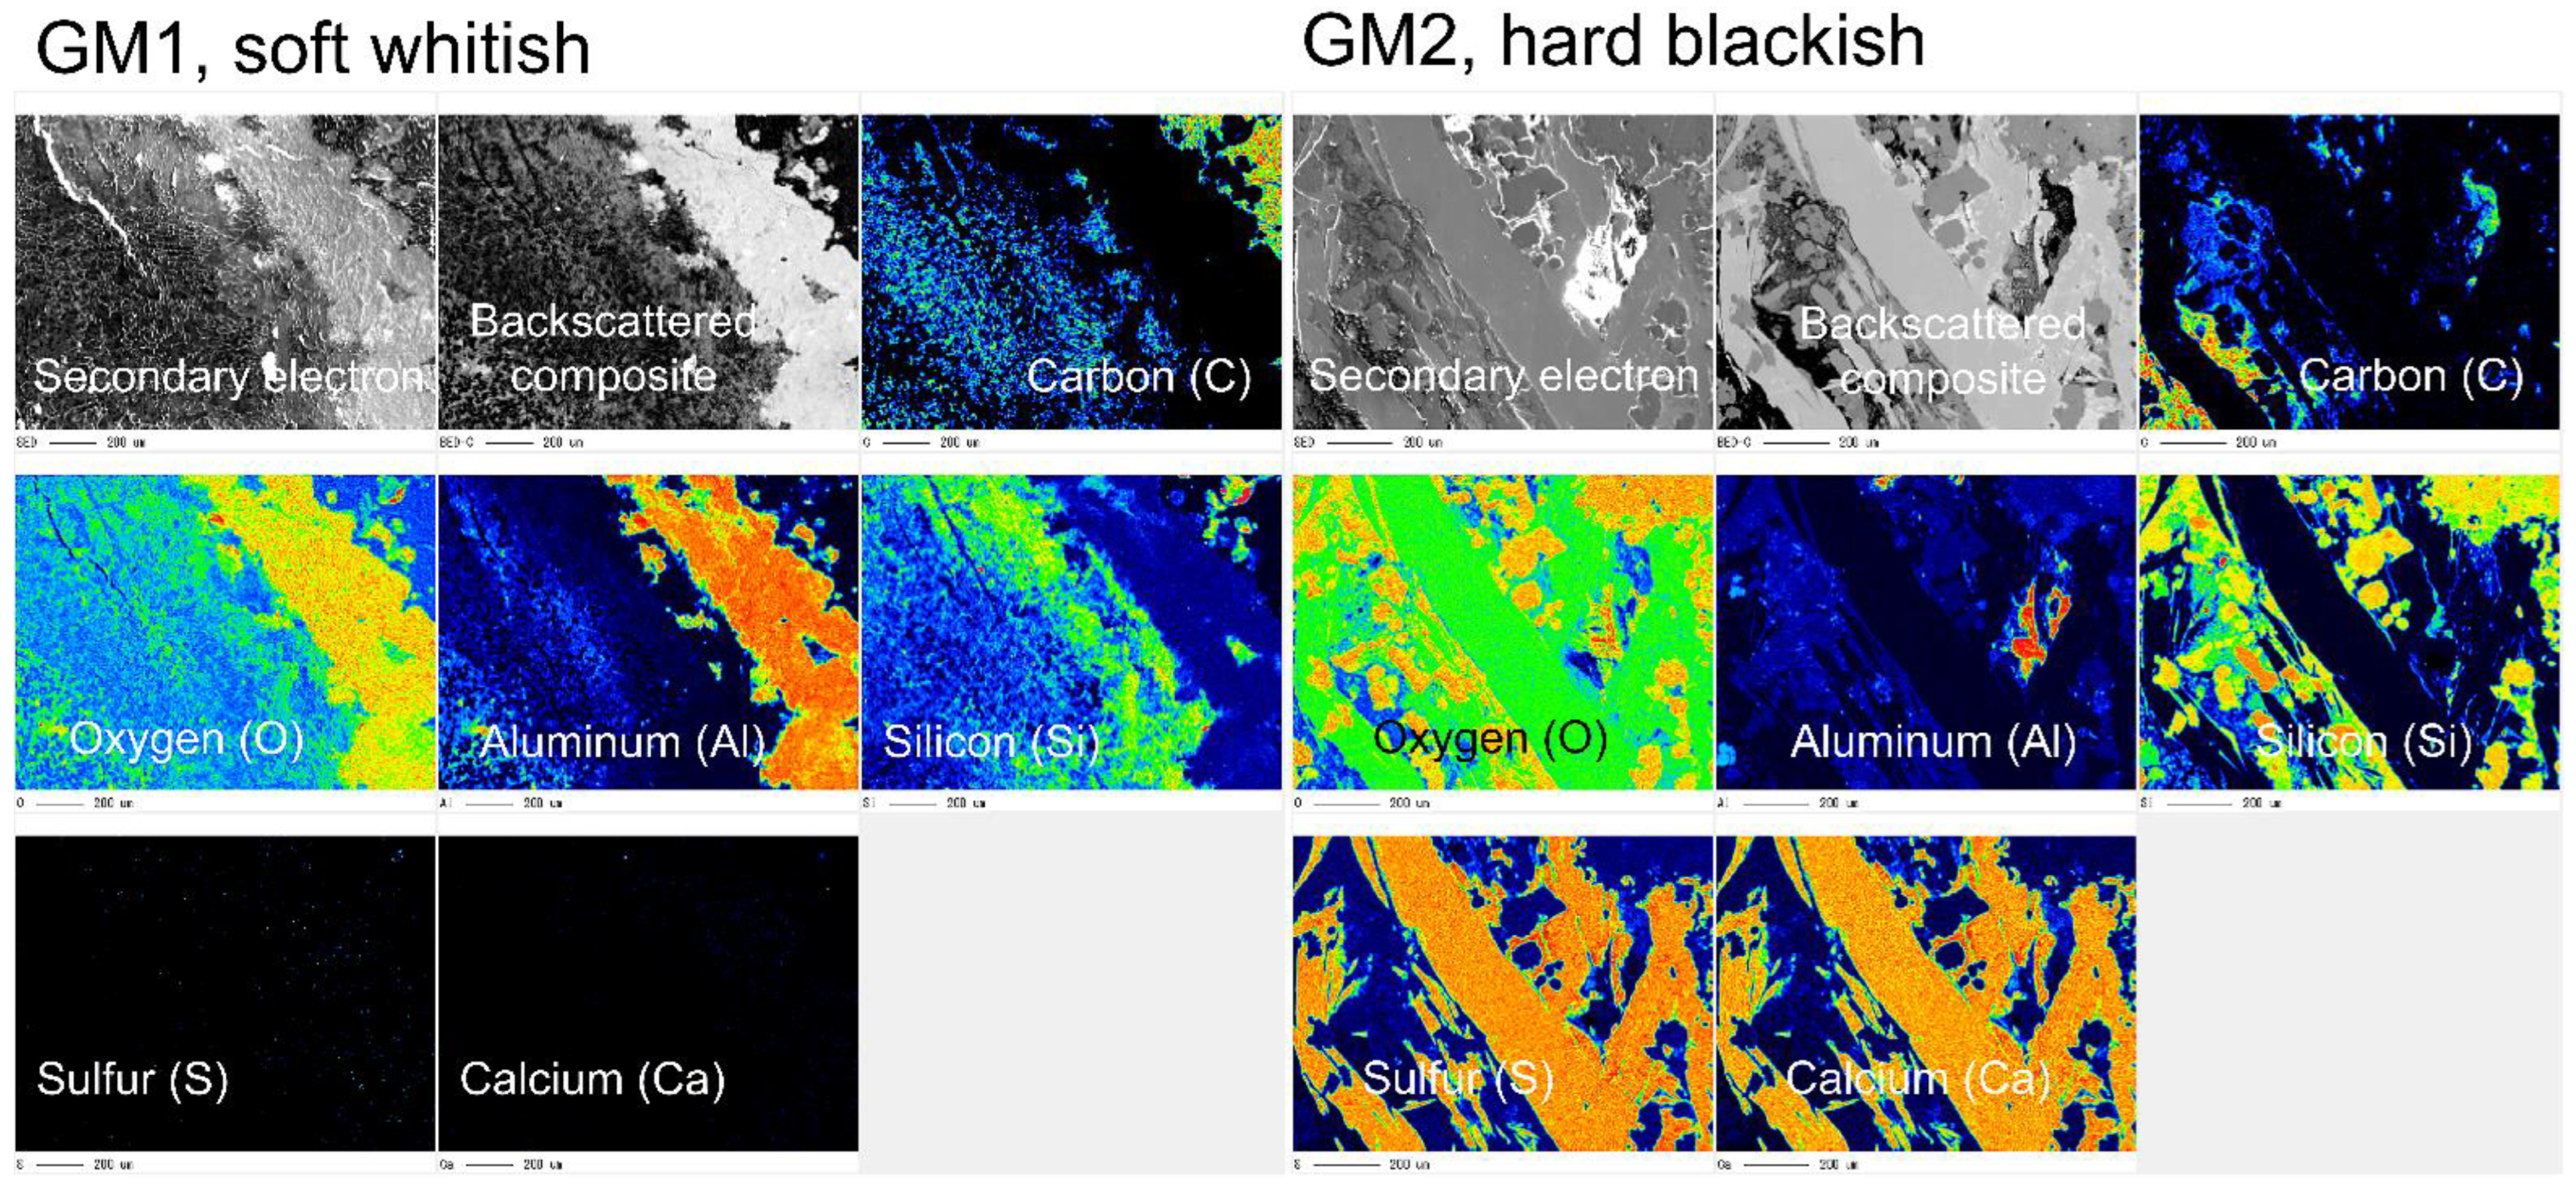
3.1. Crystallographic and Geochemical Characteristics of Speleothems
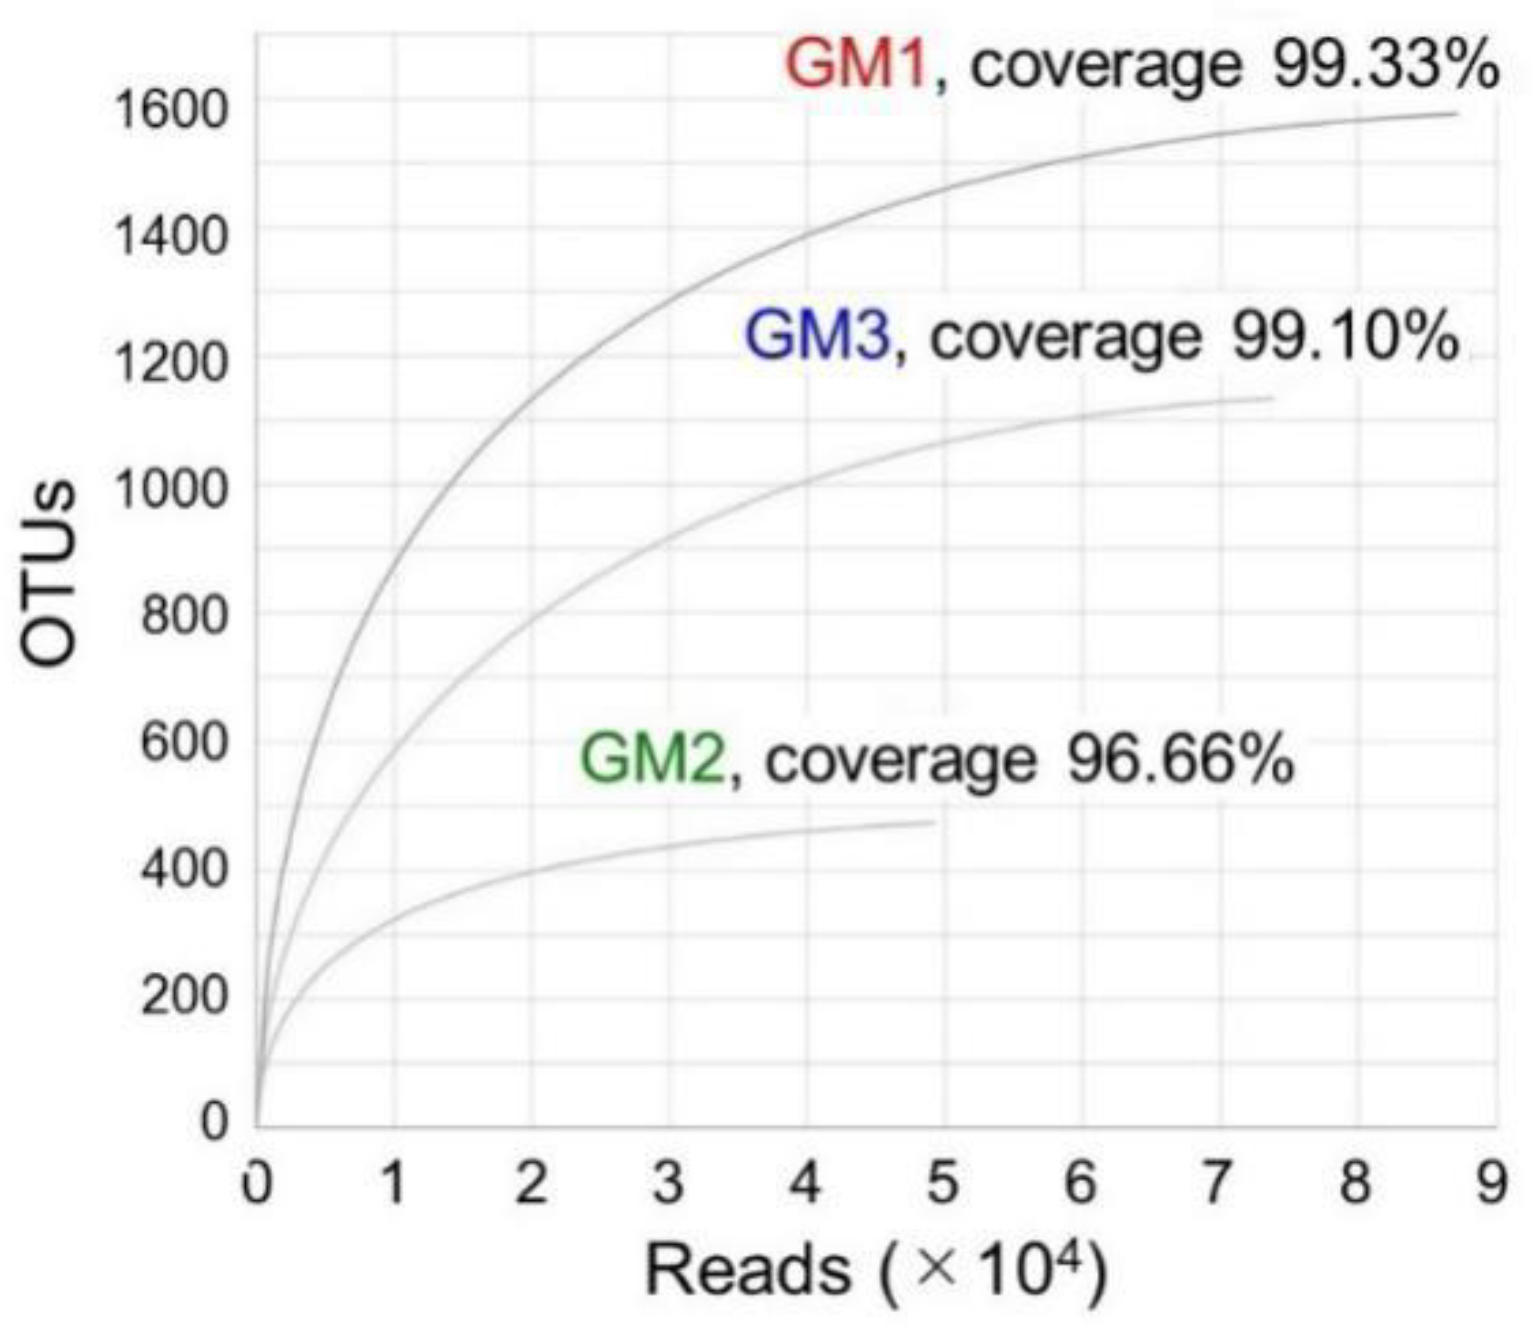
3.2. Evaluation of MiSeq-Generated V3–V4 Sequences (Reads) and OTUs
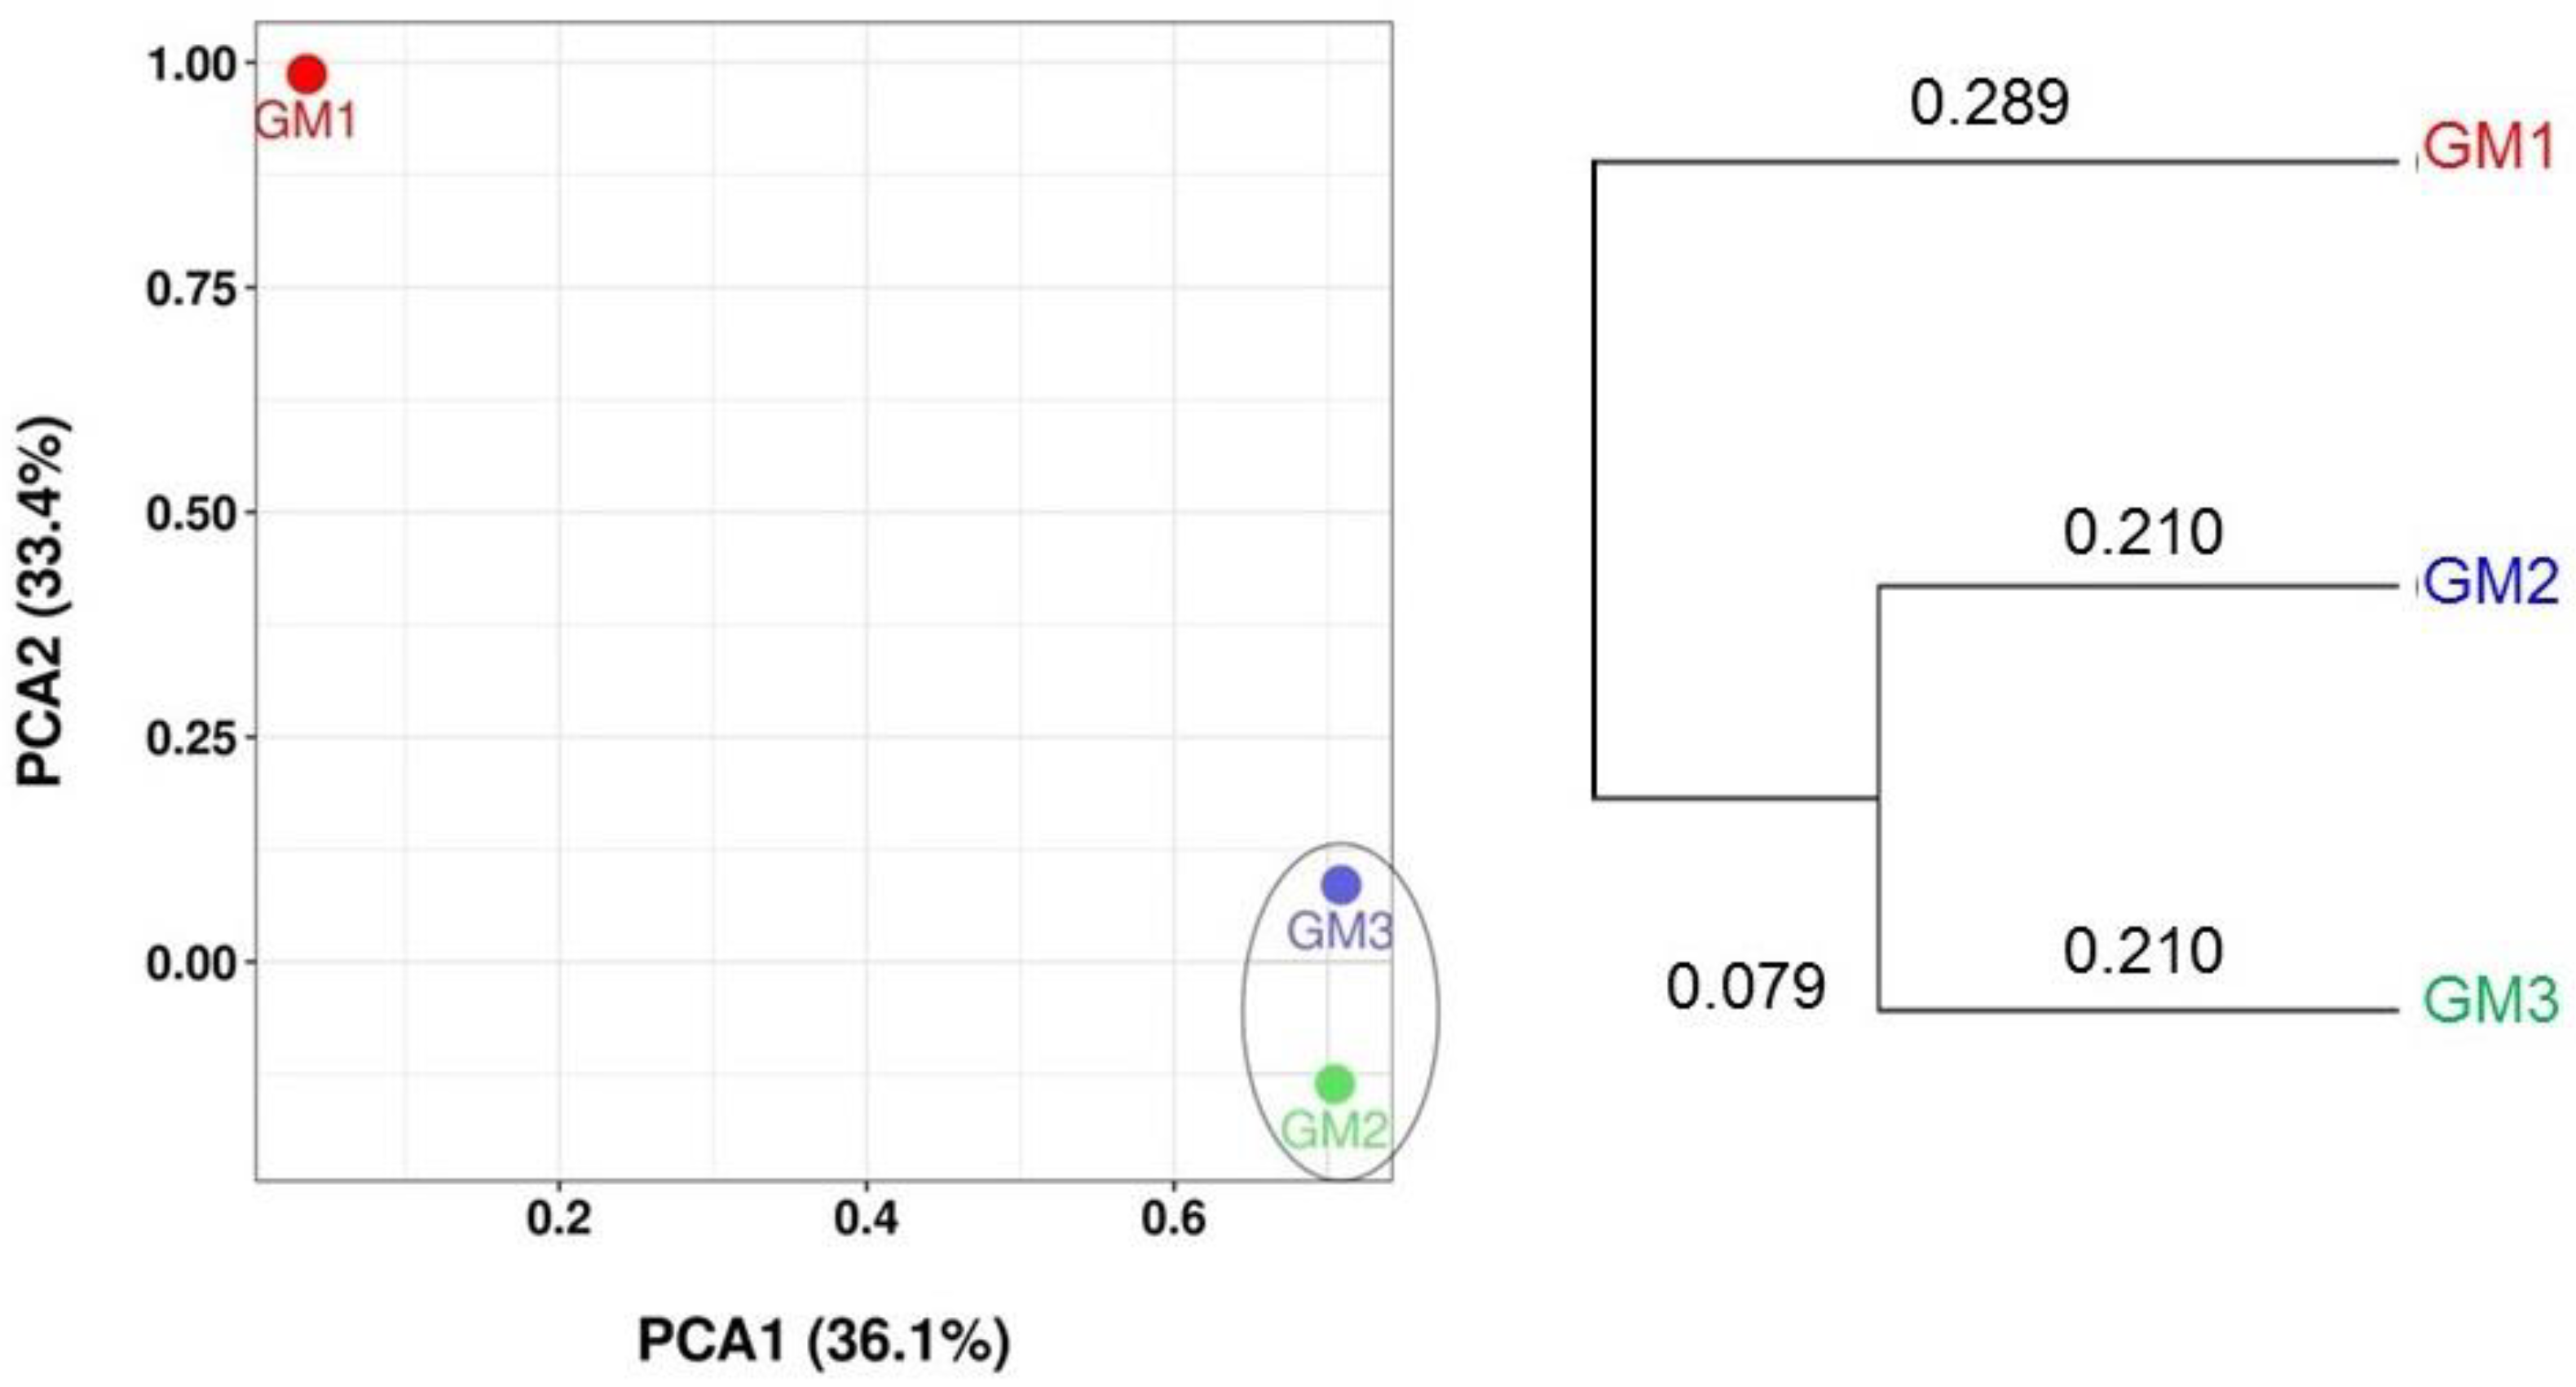
3.3. Alpha and Beta Diversity Analyses
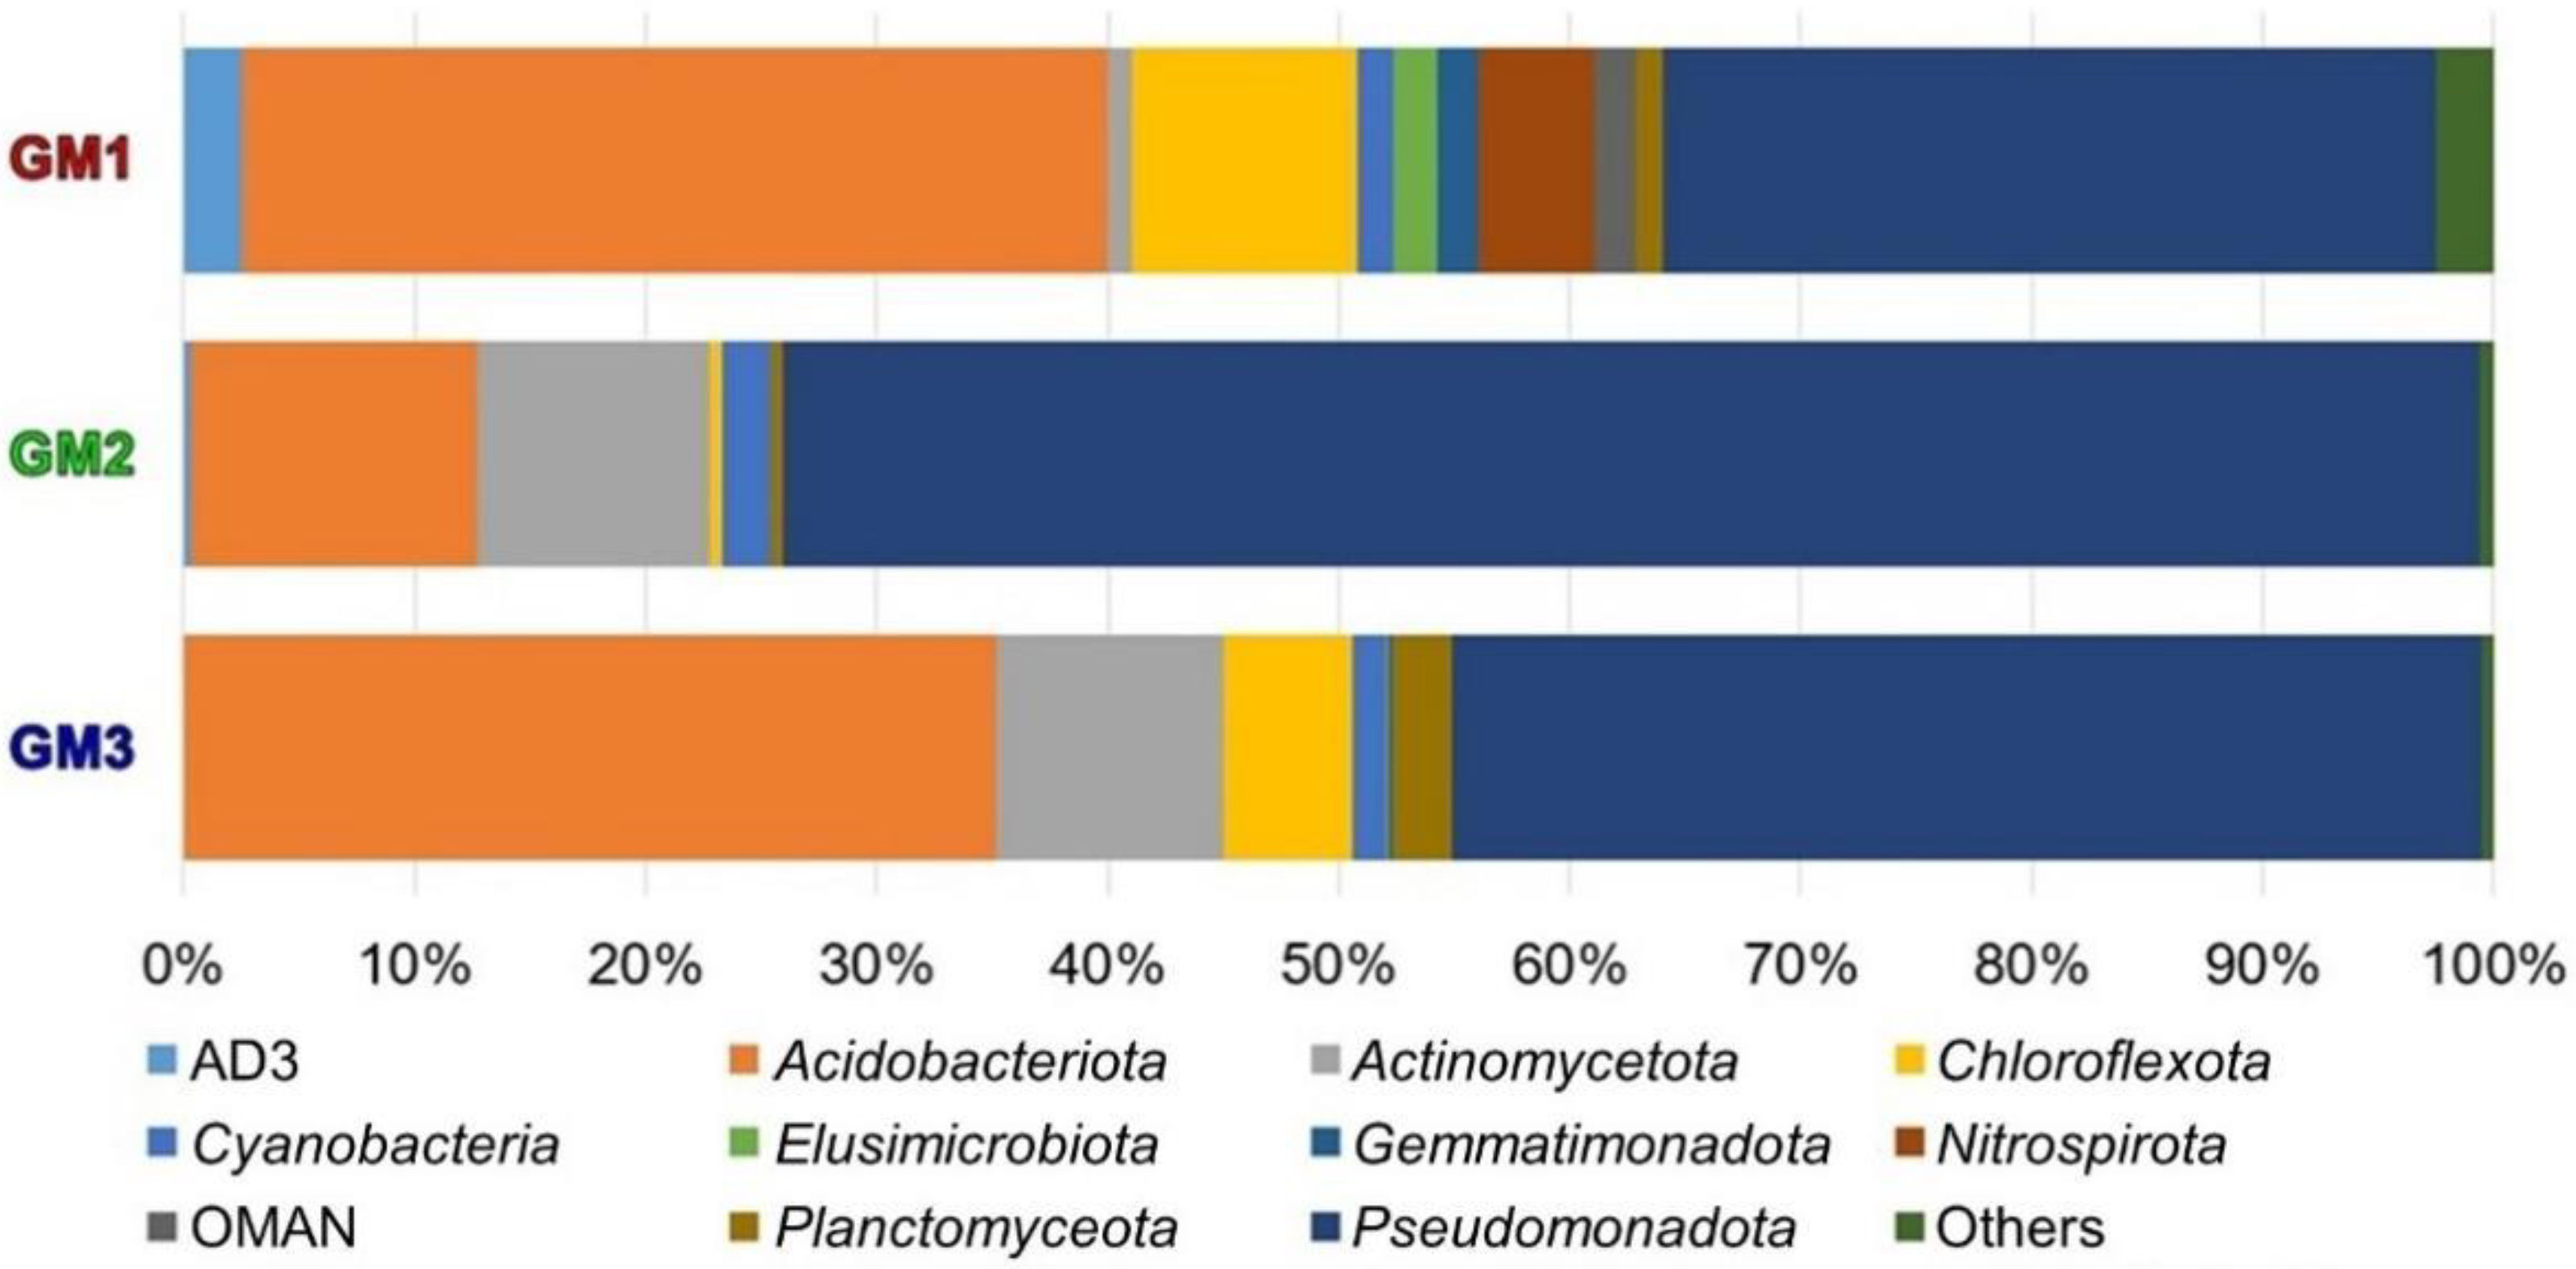
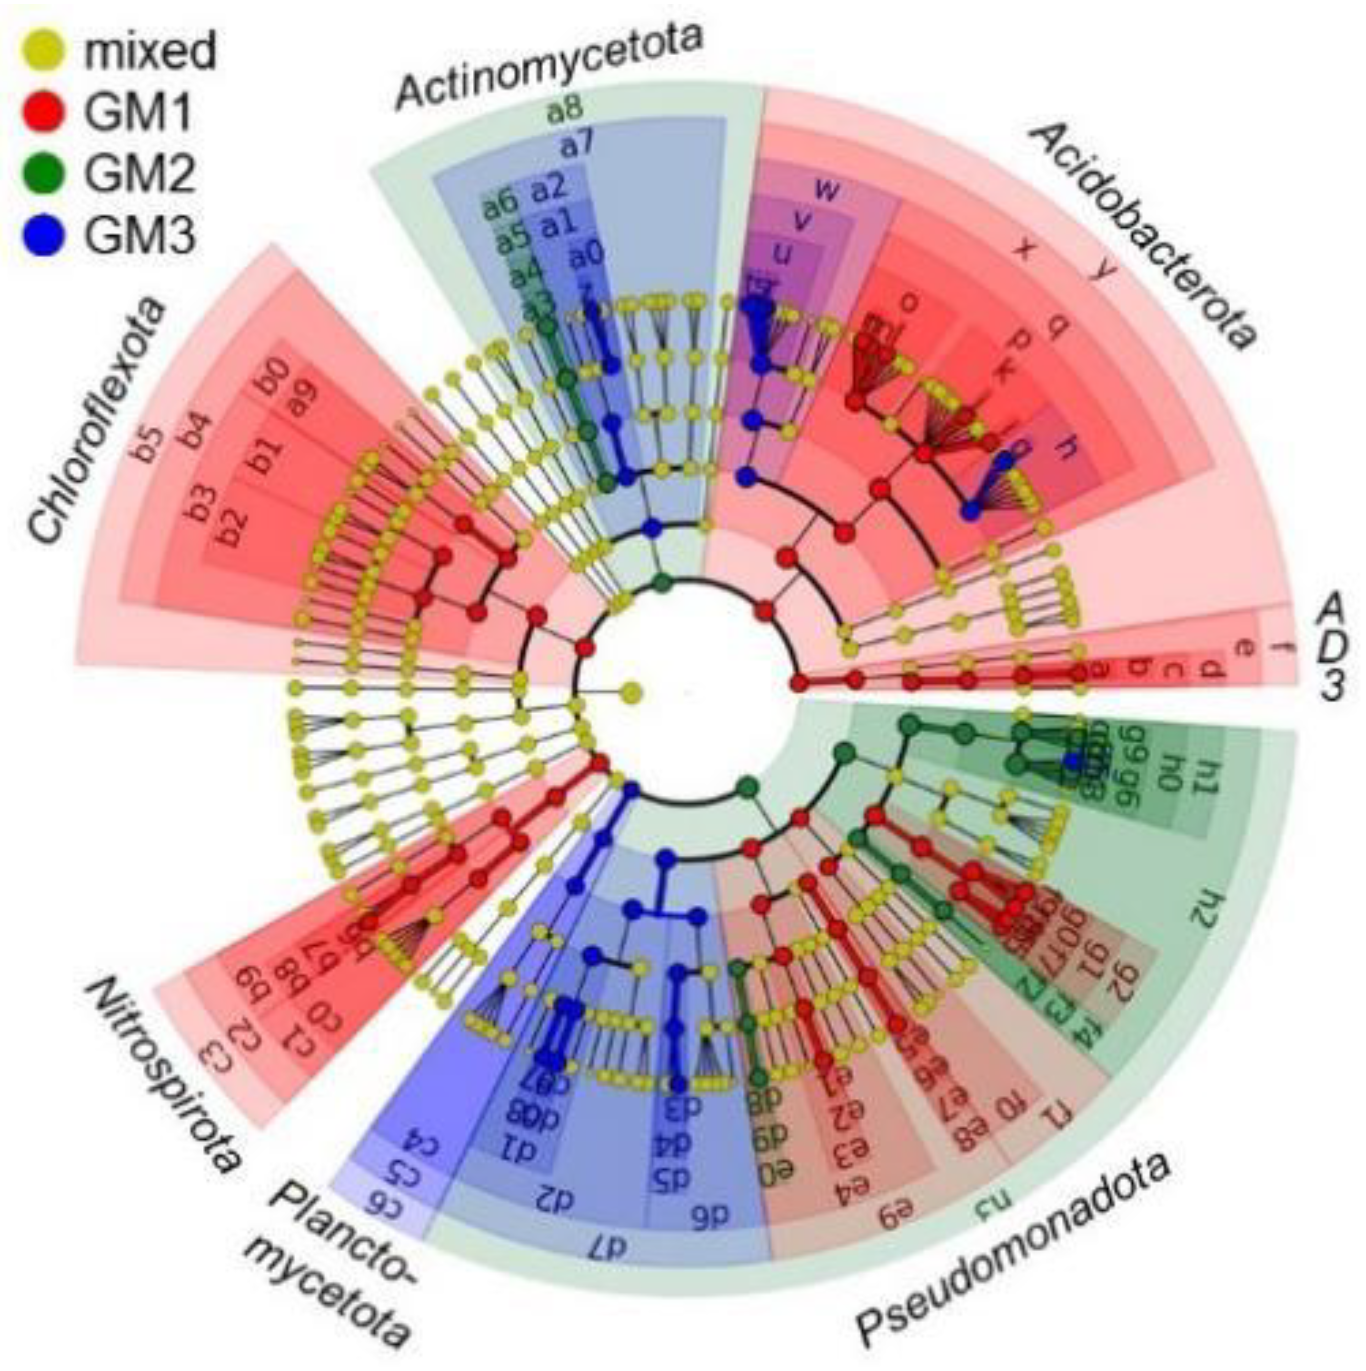
3.4. Microbiome Taxonomic Compositions
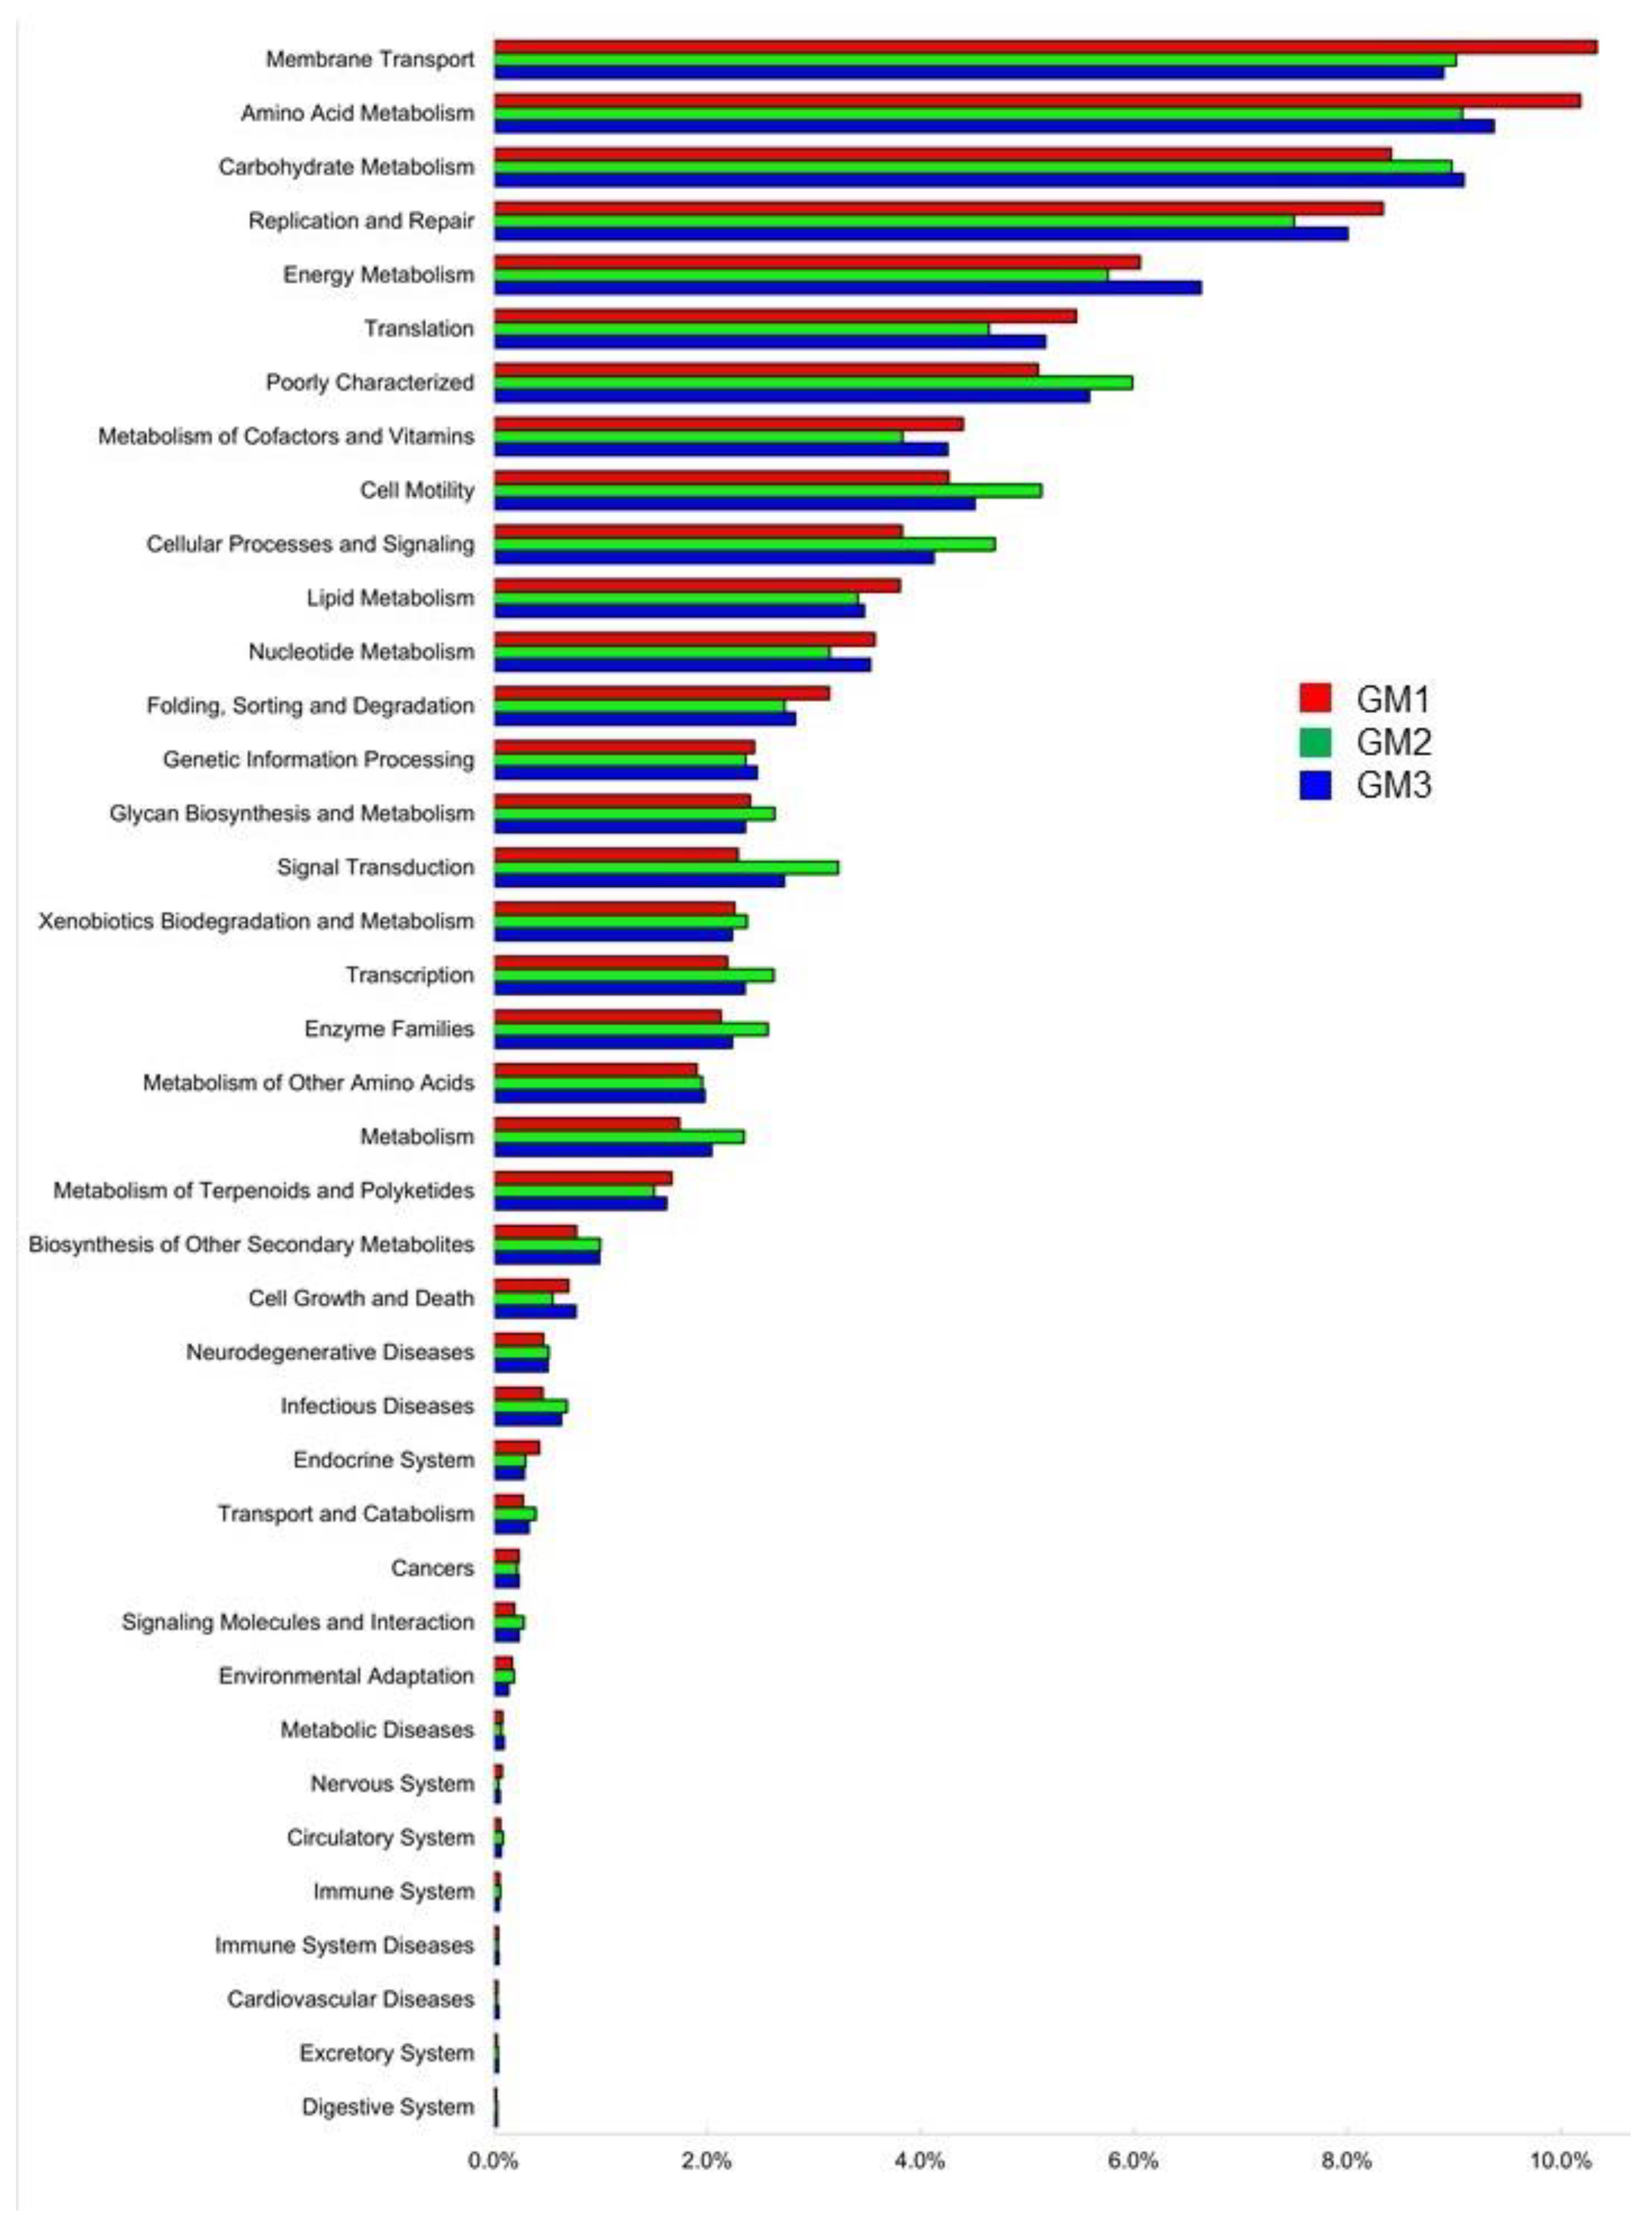
3.5. Microbial Metabolic Functions Predicted by PICRUSt2
4. Discussion

| Source Cave/Site | Seq. | Target | Phylum | Reference | |
|---|---|---|---|---|---|
| No. | Representatives | ||||
| Silicate cave | MiSeq | V3–V4 | 30 | Acidobacteriota, Pseudomonadota, Actinomycetota, Chloroflexota, Nitrospirota | This study |
| Silicate cave | Sanger | 16S rRNA gene | 9 | Chloroflexota, Thaumarchaeota, Acidobacteriota, Pseudomonadota, Actinomycetota | [23] |
| Silicate cave | MiSeq | V4–V5 | 17 | Pseudomonadota, Acidobacteriota, Actinomycetota, Planctomycetota, Chloroflexota | [24] |
| Lava tube | Pyro | V1–V3 | 18 | Actinomycetota, Pseudomonadota, Nitrospirota, Acidobacteriota, Bacteroidota | [54] |
| Limestone cave | Pyro | V6 | 33 | Actinomycetota, Pseudomonadota, Acidobacteriota | [1] |
| Limestone cave | Pyro | Metagenome | 17 | Pseudomonadota, Actinomycetota, Planctomycetota, Thaumarchaeota, Bacillota | [2] |
| Limestone cave | Sanger | V3 | 6 | Pseudomonadota, Acidobacteriota, Actinomycetota, Planctomycetota, Bacteroidota | [3] |
| Limestone cave | Sanger | 16S rRNA gene | 5 | Pseudomonadota, Actinomycetota, Bacteroidota, Chloroflexota | [6] |
| Limestone cave | MiSeq | V3–V4 | 19 | Pseudomonadota, Actinomycetota, Bacillota, Acidobacteriota, Bacteroidota | [8] |
| Limestone cave | Pyro | V4 | 41 | Pseudomonadota, Bacteroidota, Actinomycetota, Bacillota, Verrucomicrobiota | [44] |
| Limestone cave | Sanger | 16S rRNA gene | 6 | Pseudomonadota, Acidobacteriota, Actinomycetota, Planctomycetota, Bacteroidota | [47] |
| Limestone cave | Sanger | 16S rRNA gene | 4 | Pseudomonadota, Actinomycetota, Bacteroidota, Bacillota | [48] |
| Limestone cave | Sanger | 16S rRNA gene | 7 | Pseudomonadota, Actinomycetota, Bacteroidota, Bacillota, Nitrospirota | [49] |
| Limestone cave | MiSeq | V4 | 12 | Pseudomonadota, Acidobacteriota, Bacillota | [50] |
| Limestone cave | Sanger | 16S rRNA gene | 10 | Pseudomonadota, Bacteroidota, Verrucomicrobiota | [52] |
| Limestone cave | Pyro | V6 | 10 | Pseudomonadota, Actinobacterium, Acidobacterium, Bacteroidota, Verrucomicrobiota | [53] |
| Limestone cave | Pyro | Metagenome, V4 | 54 | Pseudomonadota, Thaumarchaeota, Actinomycetota, Planctimycetota, Euryarchaeota | [56] |
| Limestone cave | MiSeq | V3 | 48 | Actinomycetota, Pseudomonadota, Acidobacteriota, Bacillota | [57] |
| Building wall | MiSeq | V3–V4 | 32 | Actinomycetota, Cyanobacteria, Pseudomonadota, Euryarchaeota, Thaumarchaeota | [59] |
5. Conclusions
Supplementary Materials
Author Contributions
Funding
Data Availability Statement
Acknowledgments
Conflicts of Interest
References
- Ortiz, M.; Neilson, J.W.; Nelson, W.M.; Legatzki, A.; Byrne, A.; Yu, Y.; Wing, R.A.; Soderlund, C.A.; Pryor, B.M.; Pierson, L.S., III; et al. Profiling bacterial diversity and taxonomic composition on speleothem surfaces in Kartchner Caverns, AZ. Microb. Ecol. 2013, 65, 371–383. [Google Scholar] [CrossRef] [PubMed]
- Ortiz, M.; Legatzki, A.; Neilson, J.W.; Fryslie, B.; Nelson, W.M.; Wing, R.A.; Soderlund, C.A.; Pryor, B.M.; Maier, R.M. Making a living while starving in the dark: Metagenomic insights into the energy dynamics of a carbonate cave. ISME J. 2014, 8, 478–491. [Google Scholar] [CrossRef] [PubMed]
- Schabereiter-Gurtner, C.; Saiz-Jimenez, C.; Piñar, G.; Lubitz, W.; Rölleke, S. Phylogenetic 16S rRNA analysis reveals the presence of complex and partly unknown bacterial communities in Tito Bustillo cave, Spain, and on its Palaeolithic paintings. Environ. Microbiol. 2002, 4, 392–400. [Google Scholar] [CrossRef]
- Pašić, L.; Kovče, B.; Sket, B.; Herzog-Velikonja, B. Diversity of microbial communities colonizing the walls of a Karstic cave in Slovenia. FEMS Microbiol. Ecol. 2009, 71, 50–60. [Google Scholar] [CrossRef] [Green Version]
- Riquelme, C.; Marshall Hathaway, J.J.; Enes Dapkevicius, M.d.L.N.; Miller, A.Z.; Kooser, A.; Northup, D.E.; Jurado, V.; Fernandez, O.; Saiz-Jimenez, C.; Cheeptham, N. Actinobacterial diversity in volcanic caves and associated geomicrobiological interactions. Front. Microbiol. 2015, 6, 1342. [Google Scholar] [CrossRef] [PubMed] [Green Version]
- Barton, H.A.; Taylor, N.M.; Kreate, M.P.; Springer, A.C.; Oehrle, S.A.; Bertog, J.L. The impact of host rock geochemistry on bacterial community structure in oligotrophic cave environments. Int. J. Speleol. 2007, 36, 93–104. Available online: https://digitalcommons.usf.edu/kip_articles/2632 (accessed on 9 July 2022). [CrossRef] [Green Version]
- Adetutu, E.M.; Thorpe, K.; Bourne, S.; Cao, X.S.; Shahsavari, E.; Kirby, G.; Ball, A.S. Phylogenetic diversity of fungal communities in areas accessible and not accessible to tourists in Naracoorte Caves. Mycologia 2011, 103, 959–968. [Google Scholar] [CrossRef] [Green Version]
- Michail, G.; Karapetsi, L.; Madesis, P.; Reizopoulou, A.; Vagelas, I. Metataxonomic analysis of bacteria entrapped in a stalactite’s core and their possible environmental origins. Microorganisms 2021, 9, 2411. [Google Scholar] [CrossRef]
- Lundberg, J.; Brewer-Carías, C.; McFarlane, D.A. On biospeleothems from a Venezuelan tepui cave: U-Th dating, growth rates, and morphology. Int. J. Speleol. 2018, 47, 361–378. [Google Scholar] [CrossRef]
- Forti, P. Biogenic speleothems: An overview. Int. J. Speleol. 2001, 30, 39–56. [Google Scholar] [CrossRef]
- Šmída, B.; Audy, M.; Vlček, L. Expedícia Roraima, Venezuela, január 2003—Cueva Ojos de Cristal (Kryštálové oči). Slov. Speleol. Spoločnosť 2003, 34, 1–192. [Google Scholar]
- Aubrecht, R.; Brewer-Carías, C.; Šmída, B.; Audy, M.; Kováčik, Ľ. Anatomy of biologically mediated opal speleothems in the world’s largest sandstone cave: Cueva Charles Brewer, Chimantá Plateau, Venezuela. Sediment. Geol. 2008, 203, 181–195. [Google Scholar] [CrossRef]
- Piccini, L.; Mecchia, M. Solution weathering rate and origin of karst landforms and caves in the quartzite of Auyan-tepui (Gran Sabana, Venezuela). Geomorphology 2009, 106, 15–25. [Google Scholar] [CrossRef]
- Šmída, B.; Brewer-Carías, C.; Audy, M.; Mayoral, F.; Bakšić, D.; Vlček, L.; Stanković, J. Churi-tepui cave system: Inside the second largest quarzite cave in the world. Natl. Speleol. Soc. News 2010, 68, 16–23. [Google Scholar]
- Aubrecht, R.; Lánczos, T.; Gregor, M.; Schlögl, J.; Šmída, B.; Liščák, P.; Brewer-Carías, C.; Vlček, L. Sandstone caves on Venezuelan tepuis: Return to pseudokarst? Geomorphology 2011, 132, 351–365. [Google Scholar] [CrossRef]
- Mecchia, M.; Sauro, F.; Piccini, L.; De Waele, J.; Sanna, L.; Tisato, N.; Lira, J.; Vergara, F. Geochemistry of surface and subsurface waters in quartz-sandstones: Significance for the geomorphic evolution of tepui table mountains (Gran Sabana, Venezuela). J. Hydrol. 2014, 511, 117–138. [Google Scholar] [CrossRef]
- Urbani, F.; Carreño, R. Cuevas en cuarcitas proterozoicas de la Guayana Venezolana (1971–2021): Medio siglo de exploraciones y estudios geoespeleológicos. In Memorias II Congreso Colombiano de Espeleología; Bohórquez, G.E.V., Ed.; Asociación Espeleológica Colombiana: Bogotá, Columbia, 2021; pp. 203–209. [Google Scholar]
- Suárez, P.; Gutiérrez, A.V.; Salazar, V.; Puche, M.L.; Serrano, Y.; Martínez, S.; González, G.; Fernández-Delgado, M. Virulence properties and antimicrobial resistance of Pseudomonas aeruginosa isolated from cave waters at Roraima Tepui, Guayana Highlands. Lett. Appl. Microbiol. 2020, 70, 372–379. [Google Scholar] [CrossRef]
- Galán, C. Disolución y génesis del karst en rocas cabonáticas y rocas silíceas: Un estudio comparativo. Munibe 1991, 43, 43–72. [Google Scholar]
- Galán, C.; Herrera, F.; Carreño, R.; Pérez, M. Roraima Sur System, Venezuela: 10.8 km, world’s longest quartzite cave. Bol. Soc. Venez. Espeleol. 2004, 38, 53–60. [Google Scholar]
- Sauro, F. Structural and lithological guidance on speleogenesis in quartz–sandstone: Evidence of the arenisation process. Geomorphology 2014, 226, 106–123. [Google Scholar] [CrossRef]
- Kunicka-Goldfinger, W. Preliminary observations on the microbiology of karst caves of the Sarisariñama plateau in Venezuela. Bol. Soc. Venez. Espeleol. 1982, 19, 133–136. [Google Scholar]
- Barton, H.A.; Giarrizzo, J.G.; Suarez, P.; Robertson, C.E.; Broering, M.J.; Banks, E.D.; Parag, A.; Vaishampayan, P.A.; Kasthisuri Venkateswaran, K. Microbial diversity in a Venezuelan orthoquartzite cave is dominated by the Chloroflexi (Class Ktedonobacterales) and Thaumarchaeota Group I.1c. Front. Microbiol. 2014, 5, 615. [Google Scholar] [CrossRef] [Green Version]
- Sauro, F.; Cappelletti, M.; Ghezzi, D.; Columbu, A.; Hong, P.-Y.; Zowawi, H.M.; Carbone, C.; Piccini, L.; Vergara, F.; Zannoni, D.; et al. Microbial diversity and biosignatures of amorphous silica deposits in orthoquartzite caves. Sci. Rep. 2018, 8, 17569. [Google Scholar] [CrossRef]
- Douglas, G.M.; Maffei, V.J.; Zaneveld, J.R.; Yurgel, S.N.; Brown, J.R.; Taylor, C.M.; Huttenhower, C.; Langille, M.G.I. PICRUSt2 for prediction of metagenome functions. Nat. Biotechnol. 2020, 38, 685–688. [Google Scholar] [CrossRef] [PubMed]
- Huber, O. Geographical and physical features. In Flora of the Venezuelan Guayana. Vol. 1. Introduction; Steyermark, J.A., Berry, P.E., Holst, B.K., Eds.; Missouri Botanical Garden and Timber Press: Portland, OR, USA, 1995; pp. 1–61. [Google Scholar]
- Aubrecht, R.; Barrio-Amorós, C.L.; Breure, A.S.H.; Brewer-Carías, C.; Derka, T.; Fuentes-Ramos, O.A.; Gregor, M.; Kodada, J.; Kováčik, Ľ.; Lánczos, T.; et al. Venezuelan Tepuis: Their Caves and Biota; Acta Geologica Slovaca Monograph; Comenius University: Bratislava, Slovakia, 2012; 167p. [Google Scholar]
- Klindworth, A.; Pruesse, E.; Schweer, T.; Peplies, J.; Quast, C.; Horn, M.; Glöckner, F.O. Evaluation of general 16S ribosomal RNA gene PCR primers for classical and next-generation sequencing-based diversity studies. Nucleic Acids Res. 2013, 41, e1. [Google Scholar] [CrossRef] [PubMed]
- Faluaburu, M.S.; Nakai, R.; Imura, S.; Naganuma, T. Phylotypic characterization of mycobionts and photobionts of rock tripe lichen in East Antarctica. Microorganisms 2019, 7, 203. [Google Scholar] [CrossRef] [Green Version]
- Yoon, S.H.; Ha, S.M.; Kwon, S.; Lim, J.; Kim, Y.; Seo, H.; Chun, J. Introducing EzBioCloud: A taxonomically united database of 16S rRNA gene sequences and whole-genome assemblies. Int. J. Syst. Evol. Microbiol. 2017, 67, 1613–1617. [Google Scholar] [CrossRef] [PubMed]
- Yarza, P.; Yilmaz, P.; Pruesse, E.; Glöckner, F.O.; Ludwig, W.; Schleifer, K.H.; Whitman, W.B.; Euzéby, J.; Amann, R.; Rosselló-Móra, R. Uniting the classification of cultured and uncultured bacteria and archaea using 16S rRNA gene sequences. Nat. Rev. Microbiol. 2014, 12, 635–645. [Google Scholar] [CrossRef]
- Fisher, R.A. The use of multiple measurements in taxonomic problems. Ann. Eugenic. 1936, 7, 179–188. [Google Scholar] [CrossRef]
- Segata, N.; Izard, J.; Waldron, L.; Gevers, D.; Miropolsky, L.; Garrett, W.S.; Huttenhower, C. Metagenomic biomarker discovery and explanation. Genome Biol. 2011, 12, R60. [Google Scholar] [CrossRef] [Green Version]
- Esposito, A.; Borruso, L.; Rattray, J.E.; Brusetti, L.; Ahmed, E. Taxonomic and functional insights into rock varnish microbiome using shotgun metagenomics. FEMS Microbiol. Ecol. 2019, 95, fiz180. [Google Scholar] [CrossRef] [PubMed]
- Kanehisa, M.; Goto, S.; Sato, Y.; Kawashima, M.; Furumichi, M.; Tanabe, M. Data, information, knowledge and principle: Back to metabolism in KEGG. Nucleic Acids Res. 2014, 42, D199–D205. [Google Scholar] [CrossRef] [PubMed] [Green Version]
- Afgan, E.; Baker, D.; Batut, B.; van den Beek, M.; Bouvier, D.; Cech, M.; Chilton, J.; Clements, D.; Coraor, N.; Grüning, B.A.; et al. The Galaxy platform for accessible, reproducible and collaborative biomedical analyses: 2018 update. Nucleic Acids Res. 2018, 46, W537–W544. [Google Scholar] [CrossRef] [PubMed] [Green Version]
- Liesegang, M.; Milke, R. Australian sedimentary opal-A and its associated minerals: Implications for natural silica sphere formation. Am. Mineral. 2014, 99, 1488–1499. [Google Scholar] [CrossRef]
- Urbani, F. Venezuelan cave minerals. Bol. Soc. Venezolana Espeleol. 1996, 30, 1–13. [Google Scholar]
- Carreño, R.; Urbani, F. Observaciones sobre las espeleotemas del Sistema Roraima Sur. Bol. Soc. Venez. Espeleol. 2005, 38, 28–33. [Google Scholar]
- Sauro, F.; Tisato, N.; Waele, J.; Bernasconi, S.M.; Bontognali, T.R.R.; Galli, E.; Sheldon, N. Source and genesis of sulphate and phosphate–sulphate minerals in a quartz-sandstone cave environment. Sedimentology 2014, 61, 1433–1451. [Google Scholar] [CrossRef]
- Jost, L. Entropy and diversity. Oikos 2006, 113, 363–375. [Google Scholar] [CrossRef]
- Urbani, F. Notas sobre el origen de las cavidades en rocas cuarcíferas precámbricas del grupo Roraima, Venezuela. Interciencia 1986, 11, 298–300. [Google Scholar]
- González, L.; Gómez, R. High resolution speleothem paleoclimatology of northern Venezuela: A progress report. Bol. Soc. Venez. Espeleol. 2002, 36, 51–53. [Google Scholar]
- Lundberg, J.; Brewer-Carías, C.; McFarlane, D.A. Preliminary results from U-Th dating of glacial-interglacial deposition cycles in a silica speleothem from Venezuela. Quat. Res. 2010, 74, 113–120. [Google Scholar] [CrossRef]
- Yasir, M. Analysis of bacterial communities and characterization of antimicrobial strains from cave microbiota. Braz. J. Microbiol. 2018, 49, 248–257. [Google Scholar] [CrossRef] [PubMed]
- Brar, A.M.; Bergmann, D. Culture-based analysis of ‘Cave Silver’ biofilms on Rocks in the former Homestake mine in South Dakota, USA. Int. J. Speleol. 2019, 48, 145–154. [Google Scholar] [CrossRef] [Green Version]
- Schabereiter-Gurtner, C.; Saiz-Jimenez, C.; Pinar, G.; Lubitz, W.; Rolleke, S. Altamira cave Paleolithic paintings harbor partly unknown bacterial communities. FEMS Microbiol. Lett. 2002, 211, 7–11. [Google Scholar] [CrossRef] [Green Version]
- Barton, H.A.; Taylor, M.R.; Pace, N.R. Molecular phylogenetic analysis of a bacterial community in an oligotrophic cave environment. Geomicrobiol. J. 2004, 21, 11–20. [Google Scholar] [CrossRef]
- Schabereiter-Gurtner, C.; Saiz-Jimenez, C.; Piñar, G.; Lubitz, W.; Rölleke, S. Phylogenetic diversity of bacteria associated with Paleolithic paintings and surrounding rock walls in two Spanish caves (Llonín and La Garma). FEMS Microbiol. Ecol. 2004, 47, 235–247. [Google Scholar] [CrossRef]
- Zhu, H.-Z.; Zhang, Z.-F.; Zhou, N.; Jiang, C.-Y.; Wang, B.-J.; Cai, L.; Liu, S.-J. Diversity, distribution and co-occurrence patterns of bacterial communities in a karst cave system. Front. Microbiol. 2019, 10, 1726. [Google Scholar] [CrossRef] [Green Version]
- Hershey, O.S.; Barton, H.A. The microbial diversity of caves: Analysis and synthesis. In Cave Ecology; Ecological, Studies; Moldovan, O., Kováč, Ľ., Halse, S., Eds.; Springer: New York, NY, USA, 2018; Volume 235, pp. 69–90. [Google Scholar] [CrossRef]
- Macalady, J.L.; Lyon, E.H.; Koffman, B.; Albertson, L.K.; Meyer, K.; Galdenzi, S.; Mariani, S. Dominant microbial populations in limestone-corroding stream biofilms, Frasassi cave system, Italy. Appl. Environ. Microbiol. 2006, 72, 5596–5609. [Google Scholar] [CrossRef] [Green Version]
- Gulecal-Pektas, Y. Bacterial diversity and composition in Oylat Cave (Turkey) with combined Sanger/pyrosequencing approach. Pol. J. Microbiol. 2016, 65, 69–75. [Google Scholar] [CrossRef] [Green Version]
- Lavoie, K.H.; Winter, A.S.; Read, K.J.; Hughes, E.M.; Spilde, M.N.; Northup, D.E. Comparison of bacterial communities from lava cave microbial mats to overlying surface soils from Lava Beds National Monument, USA. PLoS ONE 2017, 12, e0169339. [Google Scholar] [CrossRef]
- Desai, M.S.; Assig, K.; Dattagupta, S. Nitrogen fixation in distinct microbial niches within a chemoautotrophy-driven cave ecosystem. ISME J. 2013, 7, 2411–2423. [Google Scholar] [CrossRef] [PubMed] [Green Version]
- Tetu, S.G.; Breakwell, K.; Elbourne, L.D.H.; Holmes, A.J.; Gillings, M.R.; Paulsen, I.T. Life in the dark: Metagenomic evidence that a microbial slime community is driven by inorganic nitrogen metabolism. ISME J. 2013, 7, 1227–1236. [Google Scholar] [CrossRef] [PubMed] [Green Version]
- De Mandal, S.; Chatterjee, R.; Kumar, N.S. Dominant bacterial phyla in caves and their predicted functional roles in C and N cycle. BMC Microbiol. 2017, 17, 90. [Google Scholar] [CrossRef] [PubMed] [Green Version]
- Riquelme, C.; Dapkevicius, M.D.E.; Miller, A.Z.; Charlop-Powers, Z.; Brady, S.; Mason, C.; Cheeptham, N. Biotechnological potential of Actinobacteria from Canadian and Azorean volcanic caves. Appl. Microbiol. Biotechnol. 2017, 101, 843–857. [Google Scholar] [CrossRef] [Green Version]
- Coelho, C.; Mesquita, N.; Costa, I.; Soares, F.; Trovão, J.; Freitas, H.; Portugal, A.; Tiago, I. Bacterial and archaeal structural diversity in several biodeterioration patterns on the limestone walls of the Old Cathedral of Coimbra. Microorganisms 2021, 9, 709. [Google Scholar] [CrossRef] [PubMed]
- Kosznik-Kwaśnicka, K.; Golec, P.; Jaroszewicz, W.; Lubomska, D.; Piechowicz, L. Into the unknown: Microbial communities in caves, their role, and potential use. Microorganisms 2022, 10, 222. [Google Scholar] [CrossRef] [PubMed]
- Oren, A.; Garrity, G.M. Valid publication of the names of forty-two phyla of prokaryotes. Int. J. Syst. Evol. Microbiol. 2021, 71, 005056. [Google Scholar] [CrossRef]


| Sample | Raw Read | Valid Read | Phylotype (OTU) | Species | Genus | Family | Order | Class | Phylum |
|---|---|---|---|---|---|---|---|---|---|
| GM1 | 94,205 | 87,168 | 1576 | 574 | 326 | 189 | 115 | 67 | 28 |
| GM2 | 49,763 | 49,279 | 474 | 298 | 166 | 90 | 61 | 37 | 20 |
| GM3 | 81,353 | 73,862 | 1134 | 365 | 239 | 137 | 83 | 48 | 19 |
| Overall | 225,321 | 210,309 | 3184 | 1122 | 516 | 262 | 142 | 76 | 30 |
| Speleothem | Phylum | |||
|---|---|---|---|---|
| GM1 | GM2 | GM3 | No. | Name |
| ● | 8 | Parcubacteria_OD1, Latescibacteria_WS3, Omnitrophica_OP3, Kazan, Spirochaetota, Peregrinibacteria, Aminicenantes_OP8, DQ499300_p | ||
| ● | 1 | Deinococcota | ||
| ● | 1 | DQ833500_p | ||
| ● | ● | 2 | Nitrospirota, Saccharibacteria_TM7 | |
| ● | ● | 1 | Gemmatimonadota | |
| ● | ● | 0 | ||
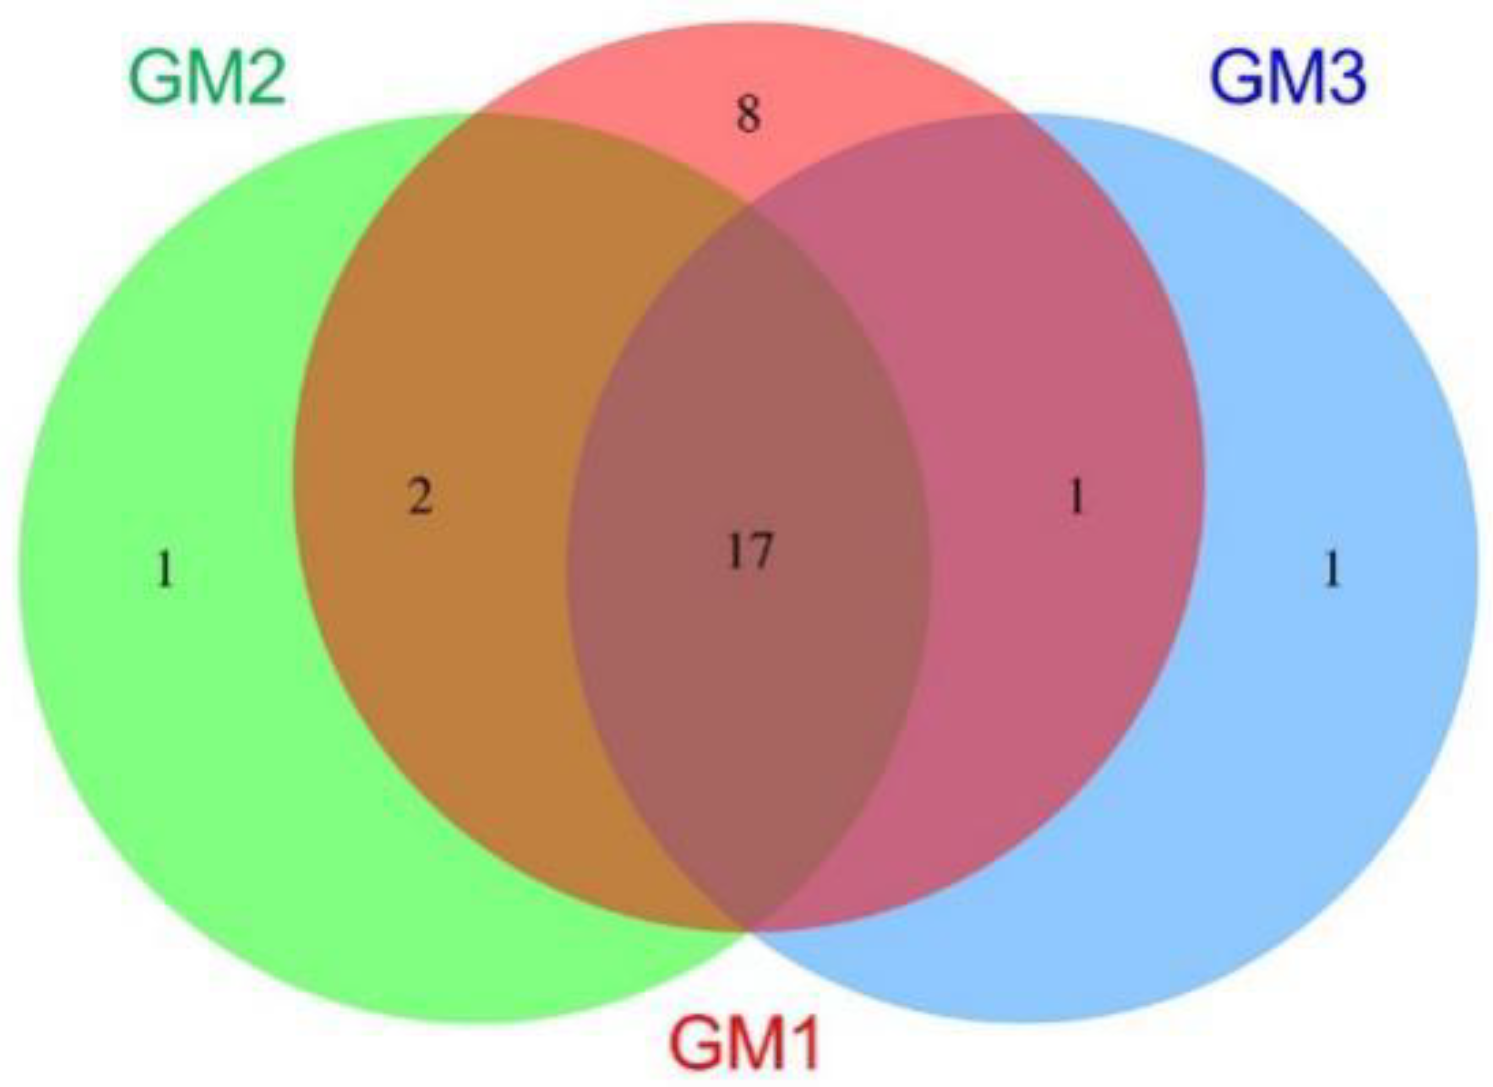
| ● | ● | ● | 17 | Pseudomonadota, Acidobacteriota, Actinomycetota, Chloroflexota, Cyanobacteria, Planctomycetota, AD3, Elusimicrobiota, OMAN, Chlamydiota, Bacteroidota, Chlorobiota, Verrucomicrobiota, Armatimonadota, TM6, Bacillota, Microgenomates_OP11 |
| 28 | 20 | 19 | 30 | |
| Sample | Valid Read | OTU | Chao1 | Shannon (ENS) | Simpson (ENS) |
|---|---|---|---|---|---|
| GM1 | 87,168 | 1576 | 1586.63 | 5.19 (179.47) | 0.02 (50) |
| GM2 | 49,279 | 474 | 490.40 | 3.06 (21.33) | 0.16 (6.25) |
| GM3 | 73,862 | 1134 | 1144.31 | 4.05 (57.40) | 0.07 (14.29) |
| Code in Figure 9 and Figure S12 | Rank of Biomarker | LDA Score | ||||||
|---|---|---|---|---|---|---|---|---|
| Phylum | Class | Order | Family | Genus | Species | |||
| GM1 | p | Acidobacteriota | Solibacteres | PAC000121_o | PAC000121_f | 5.224 | ||
| q | Acidobacteriota | Solibacteres | PAC000121_o | 5.222 | ||||
| y | Acidobacteriota | 5.161 | ||||||
| x | Acidobacteriota | Solibacteres | 5.154 | |||||
| GM2 | h0 | Pseudomonadota | Gammaproteobacteria | Xanthomonadales | Xanthomonadaceae | 5.502 | ||
| h1 | Pseudomonadota | Gammaproteobacteria | Xanthomonadales | 5.499 | ||||
| g6 | Pseudomonadota | Gammaproteobacteria | Xanthomonadales | Xanthomonadaceae | Dyella | 5.451 | ||
| h2 | Pseudomonadota | Gammaproteobacteria | 5.360 | |||||
| g4 | Pseudomonadota | Gammaproteobacteria | Xanthomonadales | Xanthomonadaceae | Dyella | D. kyungheensis | 5.283 | |
| h3 | Pseudomonadota | 5.276 | ||||||
| GM3 | g5 | Pseudomonadota | Gammaproteobacteria | Xanthomonadales | Xanthomonadaceae | Dyella | D. terrae | 5.077 |
| v | Acidobacteriota | Solibacteres | Solibacterales | PAC002115_f | 5.036 | |||
| u | Acidobacteriota | Solibacteres | Solibacterales | PAC002115_f | PAC002115_g | 5.021 | ||
| w | Acidobacteriota | Solibacteres | Solibacterales | 5.011 | ||||
Publisher’s Note: MDPI stays neutral with regard to jurisdictional claims in published maps and institutional affiliations. |
© 2022 by the authors. Licensee MDPI, Basel, Switzerland. This article is an open access article distributed under the terms and conditions of the Creative Commons Attribution (CC BY) license (https://creativecommons.org/licenses/by/4.0/).
Share and Cite
Liu, Q.; He, Z.; Naganuma, T.; Nakai, R.; Rodríguez, L.M.; Carreño, R.; Urbani, F. Phylotypic Diversity of Bacteria Associated with Speleothems of a Silicate Cave in a Guiana Shield Tepui. Microorganisms 2022, 10, 1395. https://doi.org/10.3390/microorganisms10071395
Liu Q, He Z, Naganuma T, Nakai R, Rodríguez LM, Carreño R, Urbani F. Phylotypic Diversity of Bacteria Associated with Speleothems of a Silicate Cave in a Guiana Shield Tepui. Microorganisms. 2022; 10(7):1395. https://doi.org/10.3390/microorganisms10071395
Chicago/Turabian StyleLiu, Qi, Zichen He, Takeshi Naganuma, Ryosuke Nakai, Luz María Rodríguez, Rafael Carreño, and Franco Urbani. 2022. "Phylotypic Diversity of Bacteria Associated with Speleothems of a Silicate Cave in a Guiana Shield Tepui" Microorganisms 10, no. 7: 1395. https://doi.org/10.3390/microorganisms10071395
APA StyleLiu, Q., He, Z., Naganuma, T., Nakai, R., Rodríguez, L. M., Carreño, R., & Urbani, F. (2022). Phylotypic Diversity of Bacteria Associated with Speleothems of a Silicate Cave in a Guiana Shield Tepui. Microorganisms, 10(7), 1395. https://doi.org/10.3390/microorganisms10071395