Article

A Promising Use of Trimethyl Chitosan for Removing Microcystis aeruginosa in Water Treatment Processes

by
Leda Giannuzzi
1,*,†,
Julián Bacciadone
2,† and
Graciela L. Salerno
2,†
1
Centro de Investigación y Desarrollo en Criotecnología de Alimentos (CIDCA-CONICET), La Plata 1900, Argentina
2
Fundación Para Investigaciones Biológicas Aplicadas (FIBA), Vieytes 3103, Mar del Plata 7600, Argentina
*
Author to whom correspondence should be addressed.
These authors contributed equally to this work.
Microorganisms 2022, 10(10), 2052; https://doi.org/10.3390/microorganisms10102052
Submission received: 31 August 2022 / Revised: 12 October 2022 / Accepted: 12 October 2022 / Published: 18 October 2022
(This article belongs to the Special Issue Advances in Microcystis aeruginosa)

Abstract

:
The increase in cyanobacterial blooms linked to climate change and the eutrophication of water bodies is a global concern. The harmful cyanobacterium Microcystis aeruginosa is one of the most common bloom-forming species whose removal from fresh water and, in particular, from that used for water treatment processes, remains a crucial goal. Different biodegradable and environmentally friendly coagulants/flocculants have been assayed, with chitosan showing a very good performance. However, chitosan in its original form is of limited applicability since it is only soluble in acid solution. The objective of this work was therefore to test the coagulant/flocculant capacity of trimethylchitosan (TMC), a chitosan derivative produced from residues of the fishing industry. TMC has a constitutively net positive charge enabling it to remain in solution regardless of the pH. Results show that even at alkaline pHs, common during cyanobacterial blooms, TMC is effective in removing buoyant cyanobacteria from the water column, both in test tube and Jar-Test experiments. Cell integrity was confirmed by fluorescent stain and electron microscopy. Our findings lead us to conclude that the use of TMC to remove bloom cells early in the treatment of drinking water is both feasible and promising.

1. Introduction

Toxic cyanobacterial blooms in freshwater systems are currently increasing globally in frequency, distribution, magnitude, and duration, due to anthropogenic eutrophication and climate change [1,2,3,4]. The impact of these events depends mainly on the extent and nature of the bloom and the presence of cyanotoxins such as microcystins (MCs), saxitoxins, and cylindrospermopsin. When blooms affect water supply systems, they become a major concern for human and animal health [4,5]. Another important problem caused by cyanobacterial blooms is that their cells interfere with drinking water production, causing filter-clogging, risks posed by disinfection byproducts, high residual levels of coagulants, unpleasant taste and odor, toxin generation, and a high organic content in raw material [6,7,8]. The elimination of cells is therefore a crucial step in the production of drinking water; cell removal not only facilitates the process but also can also significantly reduce the concentration of unpleasant tastes and odors, and the presence of toxic intracellular metabolites.
Among the bloom-forming cyanobacteria, Microcystis aeruginosa is the most common and widespread species found in freshwater bodies around the world and produces stable toxins as secondary metabolites [9]. MCs have a harmful impact on both ecological systems and humans. They specifically inhibit protein phosphatases, leading to increased phosphorylation in human cells, the liver being a target organ for their action. However, besides being hepatotoxins, MCs are also classified by the International Agency for Research on Cancer (IARC) as possibly carcinogenic to humans (group 2B). MCs usually show persistence, are stable in intact Microcystis cells, and are shown to degrade upon release [8]. However, in ageing blooms or after chemical treatments, MC concentrations may increase. The elimination of M. aeruginosa cells from water entering treatment plants maintaining cell integrity is therefore crucial [10].
The risk of cyanobacterial toxins in drinking water treatment plants (DWTP) can be minimized using a multi-barrier approach involving treatment of the water feeding the plant, reducing the level of toxin release from cells, optimizing the toxin elimination process, and monitoring the water at the outlet of the plant [10]. A key step at the beginning of the process is the removal of cells from the water column, which is usually carried out by chemical coagulation/flocculation (C/F), terms usually used interchangeably [11]. In the C/F procedure, coagulation occurs first, generating small colloids suspended in the water that become destabilized, followed by flocculation in which the particles aggregate to form flocs, which can be removed by sedimentation. The C/F process is now the most used process in water treatment since it has been shown to be safe and economical compared to other algae removal methods, and generally prevents cell damage by the subsequent release of toxins, a major concern for DWTP operators and water supply managers. Several types of C/F materials have been explored, such as inorganic salts of multivalent metals (e.g., polyaluminum chloride, ferric chloride, aluminum sulfate, and polymerized ferrous sulfate), and synthetic and natural organic polymers (e.g., polyacrylamide derivatives and chitosan, respectively). Chemical treatments have been widely used to control cyanobacterial cells in view of their low cost and high efficiency [12]. However, various chemicals such as copper sulfate and potassium permanganate cause cell lysis and the subsequent release of toxins [13]. In addition, inorganic coagulants must be used in high dosages for effective removal and generate secondary pollution, since the resulting sludge contains heavy metals, toxic to the environment and humans [14]. On the other hand, the use of polyacrylamide for C/F is the main source of drinking-water contamination by acrylamide monomer, which is considered a potential human carcinogen and mutagen, with low biodegradability [15,16]. Consequently, the development and application of natural polymers, such as chitosan, has been promoted as a possible alternative to traditional coagulants [17,18]. Chitosan is an advantageous agent for any water treatment, especially for drinking water, as it is considered non-toxic and safe [11].
Chitosan is a linear copolymer of 2-acetamido-2-deoxy-D-glucose (N-acetyl glucosamine, GlcNAc), and 2-amino-2-deoxy-D-glucose with ß-D-(1→4) glycoside linkages. It can be extracted from shellfish and crustaceans by enzymatic or chemical deacetylation of chitin, the most abundant aminopolysaccharide polymer occurring in nature [19]. The degree of N-acetylation has been used to differentiate chitin from chitosan [20].
The main natural sources of chitin are shrimp and crab shells, abundant by-products of the food-processing industry. The different hydrolysis conditions of chitin give rise to chitosan with different chain lengths, degrees of deacetylation, and molecular weight. Those biopolymers are used in different applications in biomedicine, food processing, and wastewater treatment [11]. In water treatment in particular, chitosan has been extensively applied as a non-toxic and biodegradable compound, acting simultaneously as a coagulant and flocculant, since under appropriate pH conditions its amino groups are protonated, generating a positive charge that neutralizes the negative charge of the cell membrane [11,21,22]. The use of chitosan for the C/F of M. aeruginosa was shown to effectively remove 99% of the cells while maintaining their integrity [11,18,23,24].
However, a significant drawback to the application of chitosan in its original form in DWTP is that it is soluble only in an acid solution due to its strong intermolecular and intramolecular hydrogen bonds [25].
A great disadvantage of the application of chitosan for cell coagulation in water treatment is that its solubilization requires an acidic pH [25]. The modification of chitosan to improve its solubility has been a focus of research in recent years. Jin et al. [26] proposed the use of chitosan quaternary ammonium salt, a water-soluble chitosan derivative, for the removal of M. aeruginosa cells from drinking water.
Chitosan derivate (CTS) was used with montmorillonite to form nanocomposites (CTS/NMMT) for the removal cells of M. aeruginosa [27]. The Box–Behnken response surface model was used to study various factors such as the weight ratio of NMMT to CTS and the necessary agitation time for the efficient removal of M. aeruginosa. The highest removal was found to be 94.9% using the nanocomposite.
The effect of different doses of a composite coagulant CTSAC (Chitosan and Aluminum Clorine premixed) on removal of M. aeruginosa cells was studied by Ma et al., 2016 [28]. Using the response surface methodology (RSM), the coagulation processes were modeled and optimized. The investigated coagulant produced a 97% reduction in cells and achieved better removal effects than coagulant applied individually.
A novel buoyant-bead flotation method using chitosan-coated fly ash cenospheres was developed to remove HABs in freshwater. An optimized removal efficiency of 98.50% for M. aeruginosa was reached at a pH of 6.0 [29].
Another study found that low concentrations of chitosan (2 mg L−1) combined with a ballast may be sufficient to flock and sink cyanobacteria (M. aeruginosa) effectively in freshwaters [30].
In Argentina, M. aeruginosa blooms are a growing health and environmental concern [31]. Our research aims at providing economical, safe, and ecological solutions for water treatment. Given that crustacean fishing is an important marine resource in the southwest Atlantic waters of Argentina, the processing residues, containing chitosan, constitute a very good source of raw material. In the present study, we evaluate the capacity of trimethylated chitosan (TMC), synthesized from a chitosan obtained from by-products of the sea food industry, to remove M. aeruginosa cells in a wide pH range for use in drinking water purification processes.

2. Materials and Methods

2.1. Biological Material and Culture

Two M. aeruginosa strains were used in this study: PCC 7806, from the Pasteur Culture Collection (France), and CAAT 2005-3 (FIBA collection, Mar del Plata, Argentina), a native strain isolated from Buenos Aires Province, Argentina [32]. M. aeruginosa cells were cultured in BG-11 medium [33] supplemented with 2 mM NaNO3 and 10 mM NaHCO3, under white fluorescent light (30 μE m−2s−1) with a 14:10 h light:dark photoperiod, at 27 ± 1 °C, with orbital shaking. For the experiments, cultures at the exponential phase (OD750 nm = 0.6–0.7, approximately 106–107 cellsmL−1) were used. The chosen cell concentration resembled that found in a bloom in a period of high cyanobacterial load, in accordance with the WHO guidance for a high probability of adverse health effects [5]. The coagulation/flocculation process was evaluated at three pHs (6, 8, and 10), adjusting the pH of the culture medium with HCl or NaOH, as appropriate.

2.2. Coagulation/Flocculation Materials

The chitosan was assayed at different molecular weights: low molecular weight chitosan (LMW, 250 kD avg., deacetylation degree > 90%) GP8523 Glentham Life Science, medium molecular weight chitosan (MMW, 1250 kD avg., deacetylation degree > 90%) GP8956 Glentham Life Science, and high molecular weight chitosan (HMW, >2000 kD avg.), deacetylation degree > 86%. The HMW was obtained by GIHON (kindly supplied by Dr Alberto Chevalier, GIHON, Laboratorios Químicos SRL, Mar del Plata, Argentina) from shrimp shell of local origin (Argentine Sea). Stock chitosan solutions of 0.5 % (w/v) were prepared by solubilizing the flakes in 1.5% (v/v) acetic acid at 20 °C under stirring until all the chitosan was dissolved. Bentonite clays used were type R53-1 and Bent025CS1H (pillared clay R53-1 with chitosan (HMW), prepared by the supporting of chitosan HMW on pillared bentonite) at concentrations between 0 to 30 mg L−1, kindly supplied by Vera Álvarez, Instituto de Investigaciones en Ciencia y Tecnología de Materiales (CONICET-Universidad Nacional de Mar del Plata, Argentina).

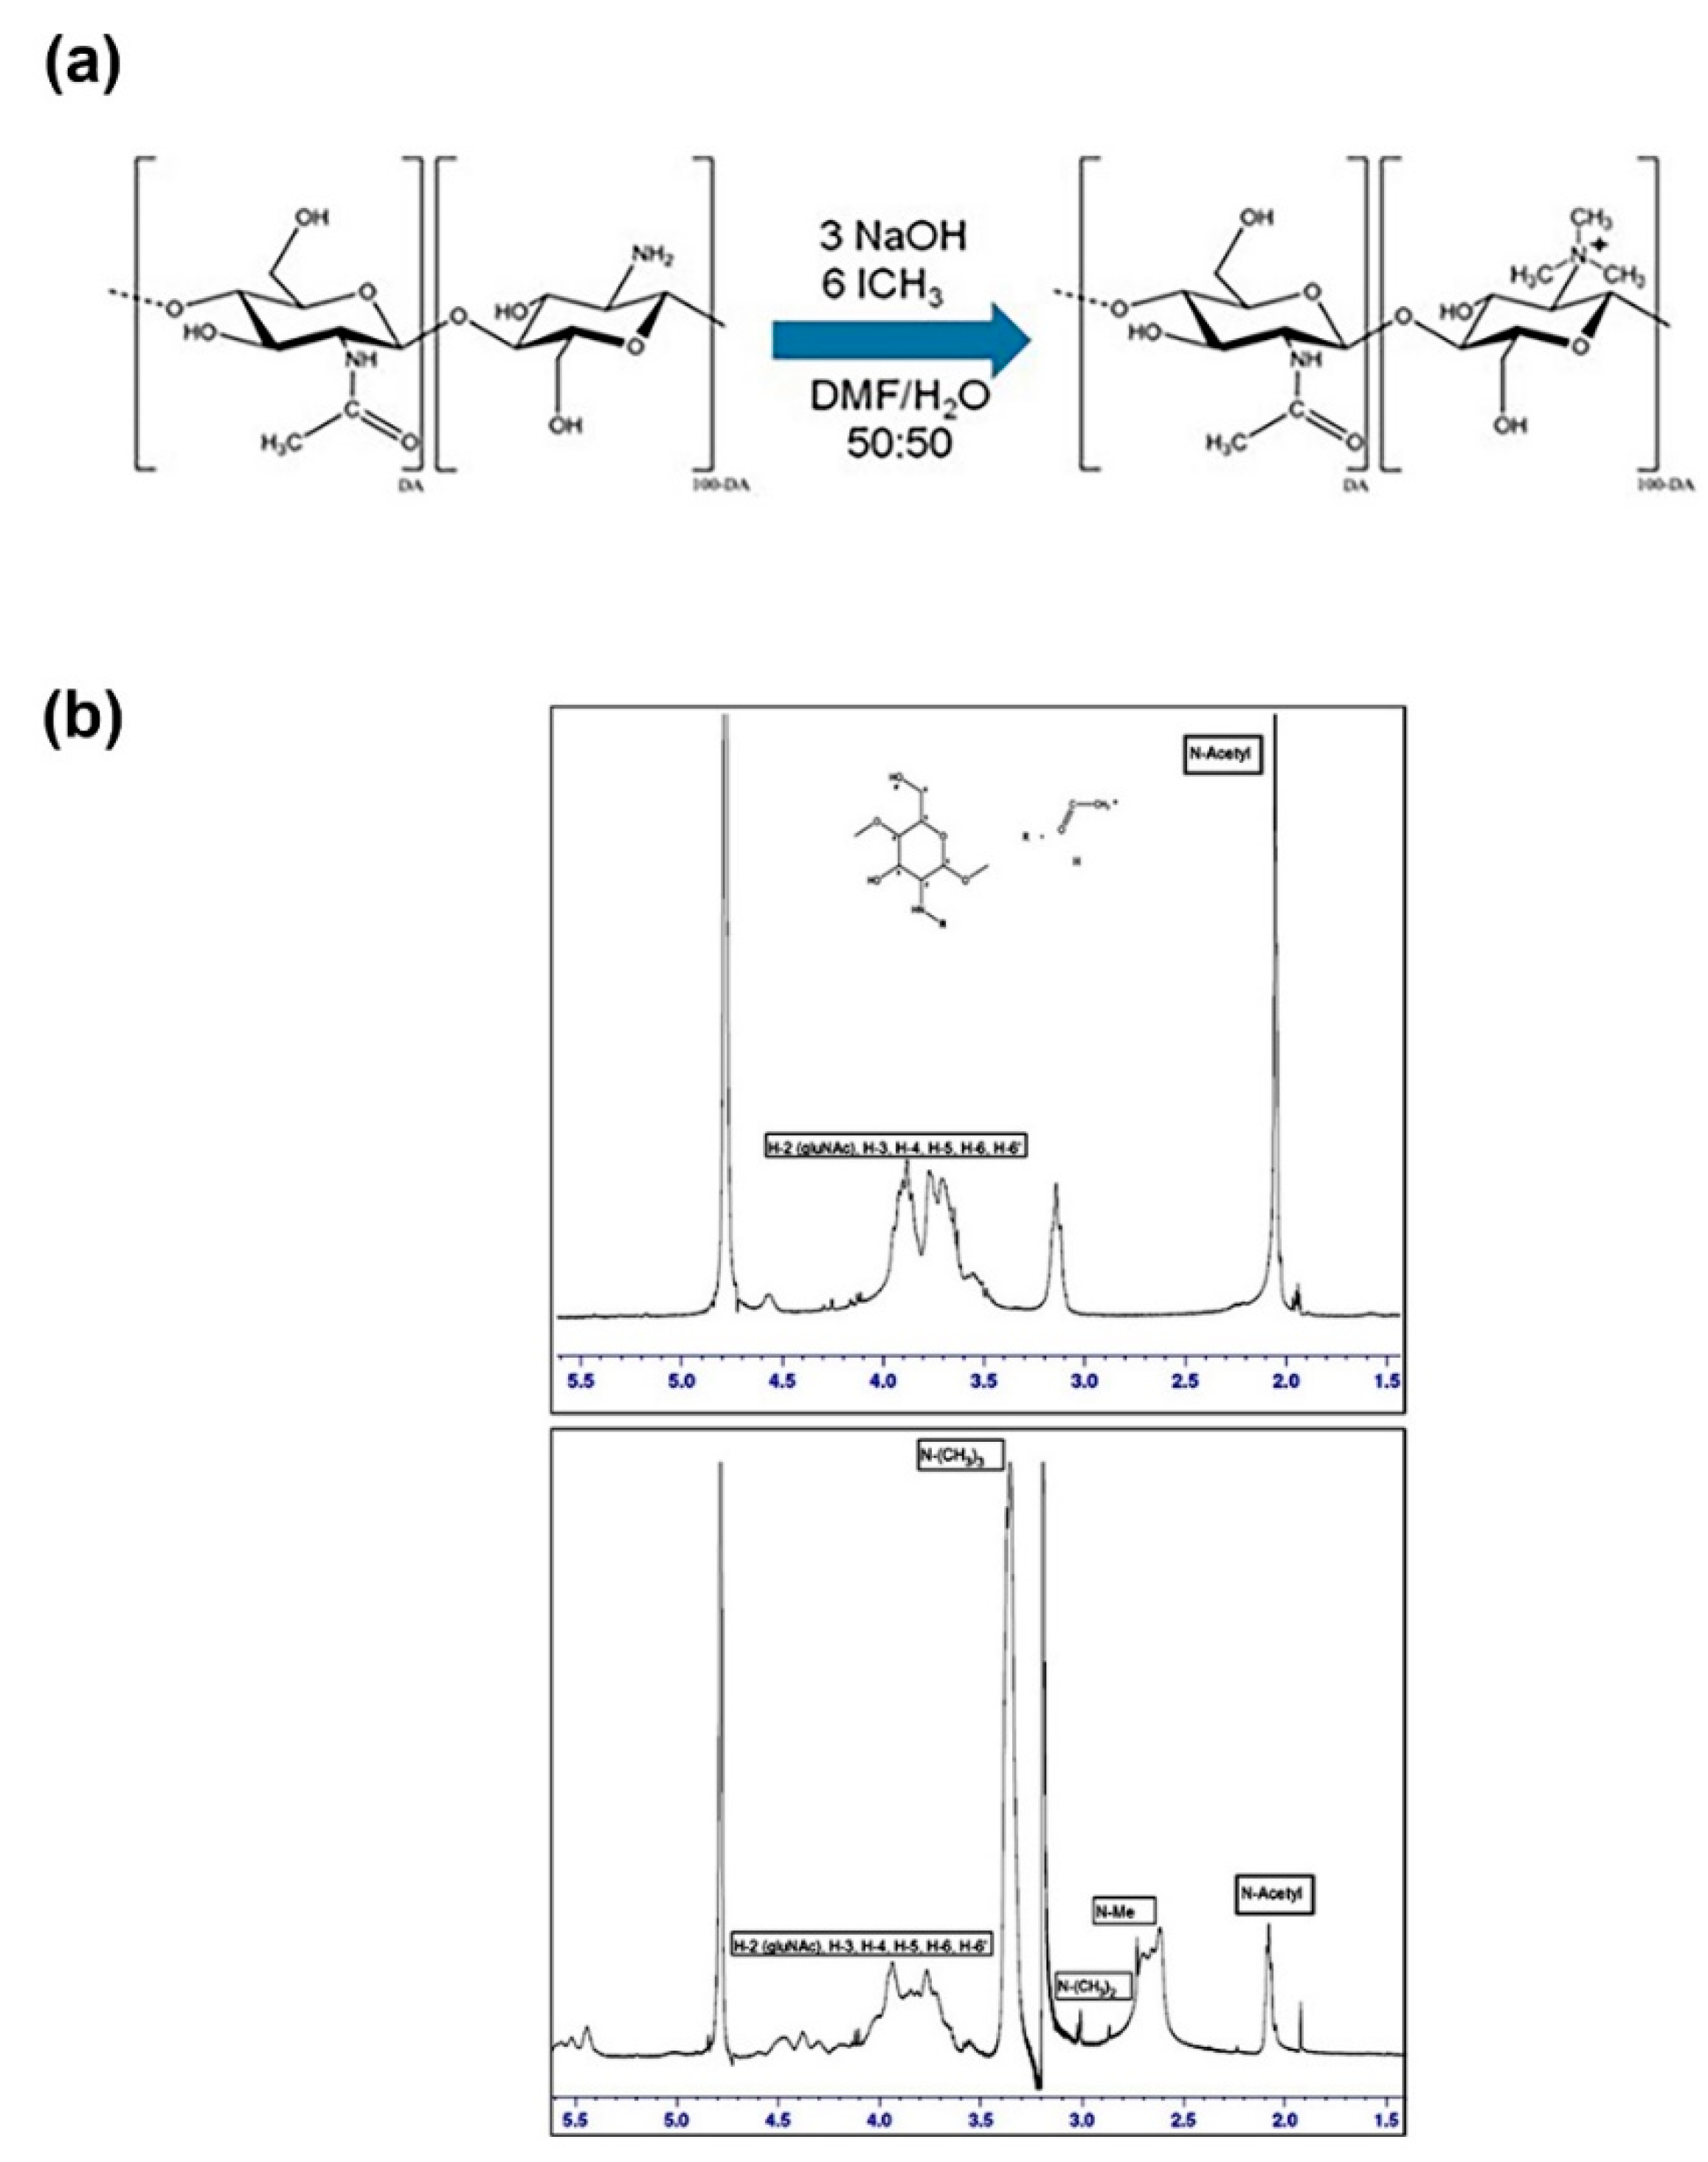
2.3. Synthesis and Characterization of N-Trimethyl Chitosan

A highly N-substituted trimethyl chitosan (TMC) was synthesized from HMW chitosan following the procedure previously described [34]. The obtained compound was analyzed by 2D NMR. The degree of substitution of TMC prepared using methyl iodide was determined by 1H NMR [20] at the Magnetic Resonance Laboratory, INTEQUI-CONICET, San Luis, Argentina, using a Bruker AVANCE 400 resonator (Bruker Biospin GmbH, Karlsruhe, Germany). It was operated at 400.13 MHz and 298 K. The concentration of the samples was 0.1 mg mL−1 in D2O for TMC and D2O/DCl for HMW chitosan.

2.4. C/F of M. aeruginosa Cells

Assays were conducted in test tubes and in a ‘Jar-Test’ apparatus. For this, different volumes of materials (bentonite clays, chitosan, and TMC) were added to M. aeruginosa cell suspensions.

2.4.1. Test Tube Assays

The experiments were conducted in glass tubes (16 × 150 mm) containing 4 mL of M. aeruginosa suspensions that were added with different concentrations of each chitosan (0–10 mg L−1), TMC (0–15 mg L−1) or bentonite (0–30 mg L−1), under different pH conditions (6, 8 and 10). Controls without coagulant addition were performed in parallel. Chitosan solutions were freshly prepared for each experiment to avoid degradation [35]. After the addition of each compound, the tubes were mixed with a Vortex for 15 s and kept under stagnant conditions for 3 h. At the end of the treatment, 0.5 mL samples were taken from the top of the tubes to measure the cell density(cells/mL−1), the residual turbidity of the clarified zone (%RT), and the Zeta potential (ZP). In addition, cells morphology was also analyzed by SEM and TEM microscopic, and viability.

2.4.2. Jar-Test Assays

C/F tests were performed using a six place multi-speed mixing unit ‘Jar-Test’ apparatus (Numak, model JT-6) with 2-L-jars. One liter of a M. aeruginosa culture, adjusted to pH 6 or 10, was transferred into 2-L-beakers and treated with 5 mg L−1 of HMW chitosan or 10 mg L−1 of TMC. Operating parameters were as follows: a rapid mixing at 300 rpm during 1 min, followed by 15 min at 60 rpm and 90 min of sedimentation. Then, a 1-mL-aliquot was taken from the top for counting buoyant cells.

2.4.3. Determination of Cell Density, Turbidity, and Zeta Potential

After C/F treatment, the number of cells in suspension was quantified in a Neubauer counting chamber under light microscope. The percentage of residual turbidity (%RT) of the clarified culture was determined by measuring the optical density at 750 nm (OD750) in a UV–visible 1240 Spectrometer (Shimadzu Corporation, Kyoto, Japan). %RT was obtained by Equation (1).
% RT = ( OD 750 ) clarified ( OD 750 ) control · 100
where (OD750)clarified corresponds to the OD of the culture after treatment, and (OD750)control was measured in the clarified culture before the addition of HMW chitosan or TMC.
The Zeta potential (ZP) was determined using a HORIBA SZ-100 Nanoparticle Analyzer. Measurements were made in quintuplicate in 6-mm electrode cells for 60 s, with a 5-s interval between measurements.

2.5. M. aeruginosa Cell Integrity after TMC Treatment

The viability and cell integrity were evaluated by fluorescent staining and electron microscopy, respectively.

2.5.1. Viability Determination

Aliquots of 10 mL of M. aeruginosa cultures were treated with 10 mg L−1 of TMC. After 3 h, the effect on membrane integrity was evaluated in the pellets by staining with 1 µM SYTOX® Green (Thermo Fisher Scientific, Waltham, MA, USA) for 10 min in the dark. The stain penetrates cells with compromised plasma membranes and binding to nucleic acids, but does not cross the membranes of live cells, thus making it an indicator of dead cells. Samples were examined under a fluorescence microscope (Nikon E600) equipped with a B-2A cube using the filter long pass for fluorescein (450–490 for excitation and 500–515 nm for emission). Cells were counted in a Neubauer chamber. Since a damaged membrane allows the stain to infiltrate, dead cells result in a green fluorescence color when analyzed under the fluorescence microscope. Negative control (untreated) and positive control (cells subjected to 70 °C for 10 min) were included. The images were captured by an Olympus DP72 digital camera, using the cellSens Entry–Microscopy Imaging Software. At least 10 random fields were taken for viability calculations in each experiment and quantified in Image [36].

2.5.2. Electron Microscopy of M. aeruginosa Cells

A drop of 25% glutaraldehyde was added to 1.5 mL of the M. aeruginosa culture in an Eppendorf tube. After 20 min, the suspension was centrifuged for 5 min at 3000 rpm and the supernatant was discarded. A solution composed of 1 mL of 25% glutaraldehyde and 6 mL of saline medium was added to the pellet. After 1 h, it was centrifuged for 5 min at 3000 rpm and the supernatant was discarded. Two drops of 1.2% agarose at 45 °C were added to the precipitate and mixed with a spatula. It was allowed to harden for 20 min at 4 °C. The Eppendorf tube was cut and the sample was then transferred to a bottle with a solution consisting of 1 part saline medium and 3 parts 0.1 M sodium phosphate buffer at pH 7.4 and washed 3 times for 10 min with this solution. A 1/1 solution of osmium/sodium phosphate buffer (2% OsO4) was added, and the sample was left overnight. The solution was then discarded, the samples were quickly washed three times with distilled water, and a 1/1 solution of sodium phosphate buffer/uranyl acetate was added, after which the samples were incubated for 30 min in the dark. After graded ethanol (70%, 90%, and 100%) and acetone, samples were embedded in Spurr resin for 24 h at 60 °C. Thin sections were made with an ultramicrotome, which were mounted on copper grids and contrasted with uranyl acetate and lead citrate [37]. The precipitates were washed in a phosphate buffer solution and preserved for electron microscopy analysis. Morphological changes in cells exposed to HMW chitosan or TMC were assessed by Transmission Electron Microscopy (TEM) (Zeiss Libra 120, Oberkochen, Germany), and Scanning Electron Microscopy (SEM) (Zeiss Supra 55VP) in the Centro Integral de Microscopía Electrónica (CIME) UNT-CONICET, San Miguel de Tucumán, Argentina.

2.6. Mathematical Model

A second order quadratic model (Equation (2)) was proposed for each of the dependent variables (log N/N0, % RT, and ZP, determined 3 h after the addition of HMW chitosan or TMC), where Y is the predicted response, x and y are the independent variables (pH and concentrations of chitosan (mg L−1), respectively, and y0, a, b, c, and d are the coefficients of the model.
Y = y 0 + ax + by + cx 2 + dy 2
The coefficient values were obtained using SYSTAT 12.0 (Systat Software, Evanston, IL, USA), with a stepwise elimination methodology to determine the significant terms of Equation (2). After fitting data with the model, the goodness of fit was evaluated considering the distribution of the residuals analysis, determination coefficient (R2), and the root-mean-square error (RMSE) defined in Equation (3).
RMSE = ( experimental predicted ) 2 c d
where ‘experimental’ is the experimental data, ‘predicted’ is the value predicted by the model, c is the number of experimental data, and d is the number of parameters of the assessed model. Lower RMSE values indicate a better fit of the model to describe the data [38].

2.7. Statistical Analysis

All experiments were performed in triplicate and the data were expressed as the respective mean ± standard deviation of three independent determinations (SD).
Analysis of variance (ANOVA) and comparison tests according to the Fisher significant differences table (least significant difference) were applied with significance levels of 0.05. The statistical requirements for the ANOVA (normal distribution, homogeneity of variance and independence) were performed prior to executing ANOVA. The statistical software Systat (Systat version 12.0, Inc., Herndon, WV, USA) was used and the statistical significance bands were defined as 0.01 < p < 0.05 (*) and p < 0.01 (**).

3. Results

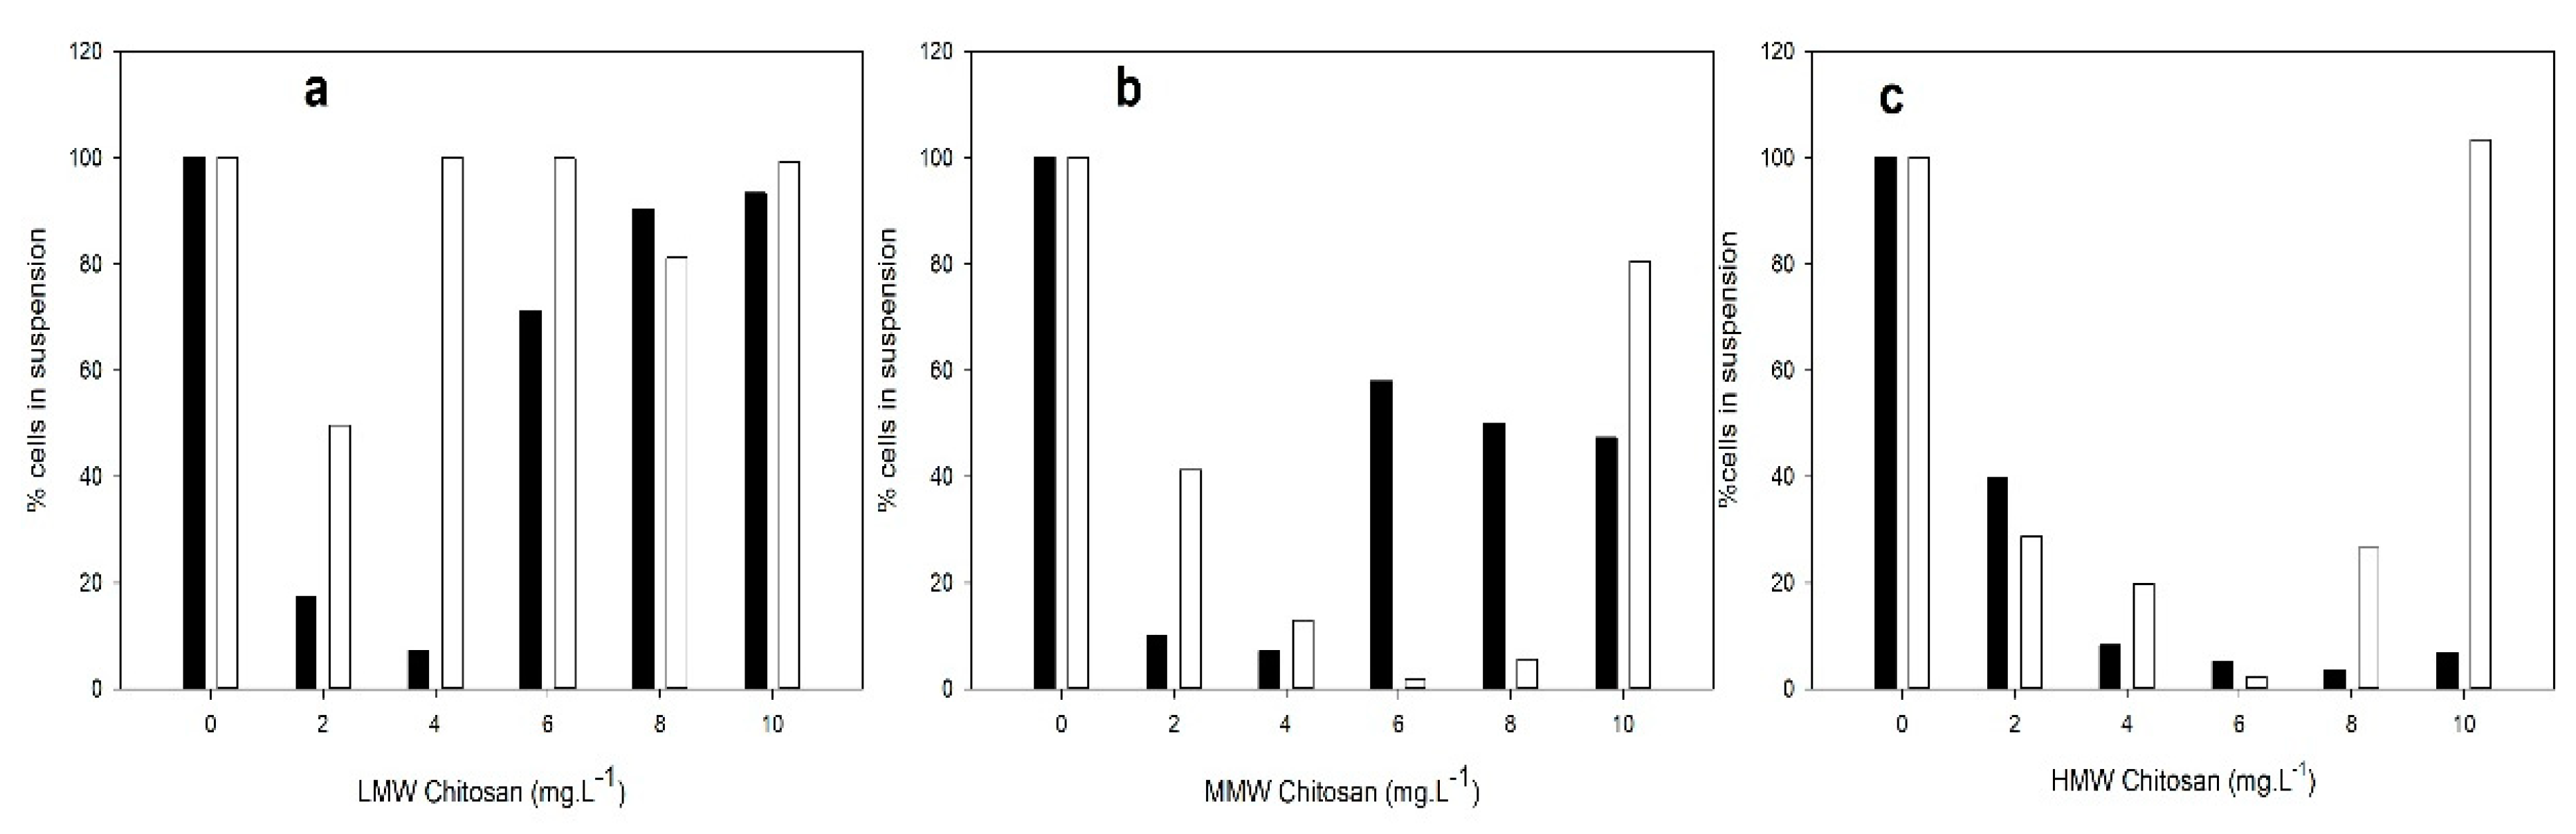
3.1. C/F Capacity of Chitosan with Different MW

We first investigated the effect of chitosan of different molecular weights at concentrations between 2 and 10 mg L1 on the capacity to flocculate cells from cultures of two M. aeruginosa strains (PCC 7806 and CAAT 2005-3) at the pH of the culture medium. As shown in Figure 1, chitosan concentrations of between 4 and 6 mg L1 were found to be the most efficient in removing more than 90% of the buoyant cells for both strains, similar to the efficiency reported previously [11,18,23,24,39]. The ANOVA analyses showed statistically significant differences between strains (p = 0.0001), different types (p = 0.000), and concentrations of chitosan (p = 0.000). In addition, the pairwise comparison showed statistically significant differences between LMW chitosan and MMW chitosan (p = 0.000), LMW chitosan and HMW chitosan (p = 0.000), and MMW chitosan and HMW chitosan (p = 0.000).
The response of the two strains differed according to the type of chitosan and the doses used. While HMW chitosan showed a better flocculant capacity for the native strain, both MMW and HMW chitosan were effective in removing cells from PCC 7806 cultures. In addition, we tested chitosan–bentonite prepared with a similar mass ratio used in a range between 2 and 30 mg L1 [40]. The ANOVA analyses showed significant statistical differences between the types of chitosan–bentonite (p = 0.698), and different concentrations (p = 0.666). The concentrations assayed were not effective for removing cyanobacterial cells (Figure S1, Supplementary Material).
As HMW chitosan showed a good performance, it was chosen to scale in a Jar-Test assay, using vessels with one liter of culture of M. aeruginosa strains PCC 7806 or CAAT 2005-3. Chitosan at a concentration of 5 mg L1 was added, and the removal effectiveness was greater than 95% (Figure S2, Supplementary Material).

3.2. Characterization of Trimethyl Chitosan (TMC)

TMC, a well-studied N-quaternary water-soluble chitosan derivative, was obtained from the HMW chitosan to give a stable positive charge polymer [34], allowing its use independently of pH. The structural changes in the chitosan molecules were confirmed by FT-IR spectroscopy and characterized by 2D NMR (Figure 2 and Figure S3, Supplementary material).
The strong signal at c.a. 3.3 ppm in TMC corresponding to N-methyl groups is not observed in HMW chitosan, which reflects a high degree of N-methylation, a condition produced by the TMC [34,41,42].

3.3. Determination of the C/F Capacity of TMC in Jar-Test Assays

The cell removal capacity of TMC on two M. aeruginosa strains (PCC 7806 and CAAT 2005-3) was assayed at pH 10 (a pH close to the values present in blooms [43,44,45]), in Jar-Test vessels (Figure 3). The percentage of buoyant cells with respect to the control was calculated after each treatment. The ANOVA analyses showed significant statistical differences between strains (p = 0.0000) and different types of chitosan (p = 0.000). In addition, there were significant statistical differences between HMW chitosan and TMC (p = 0.000).

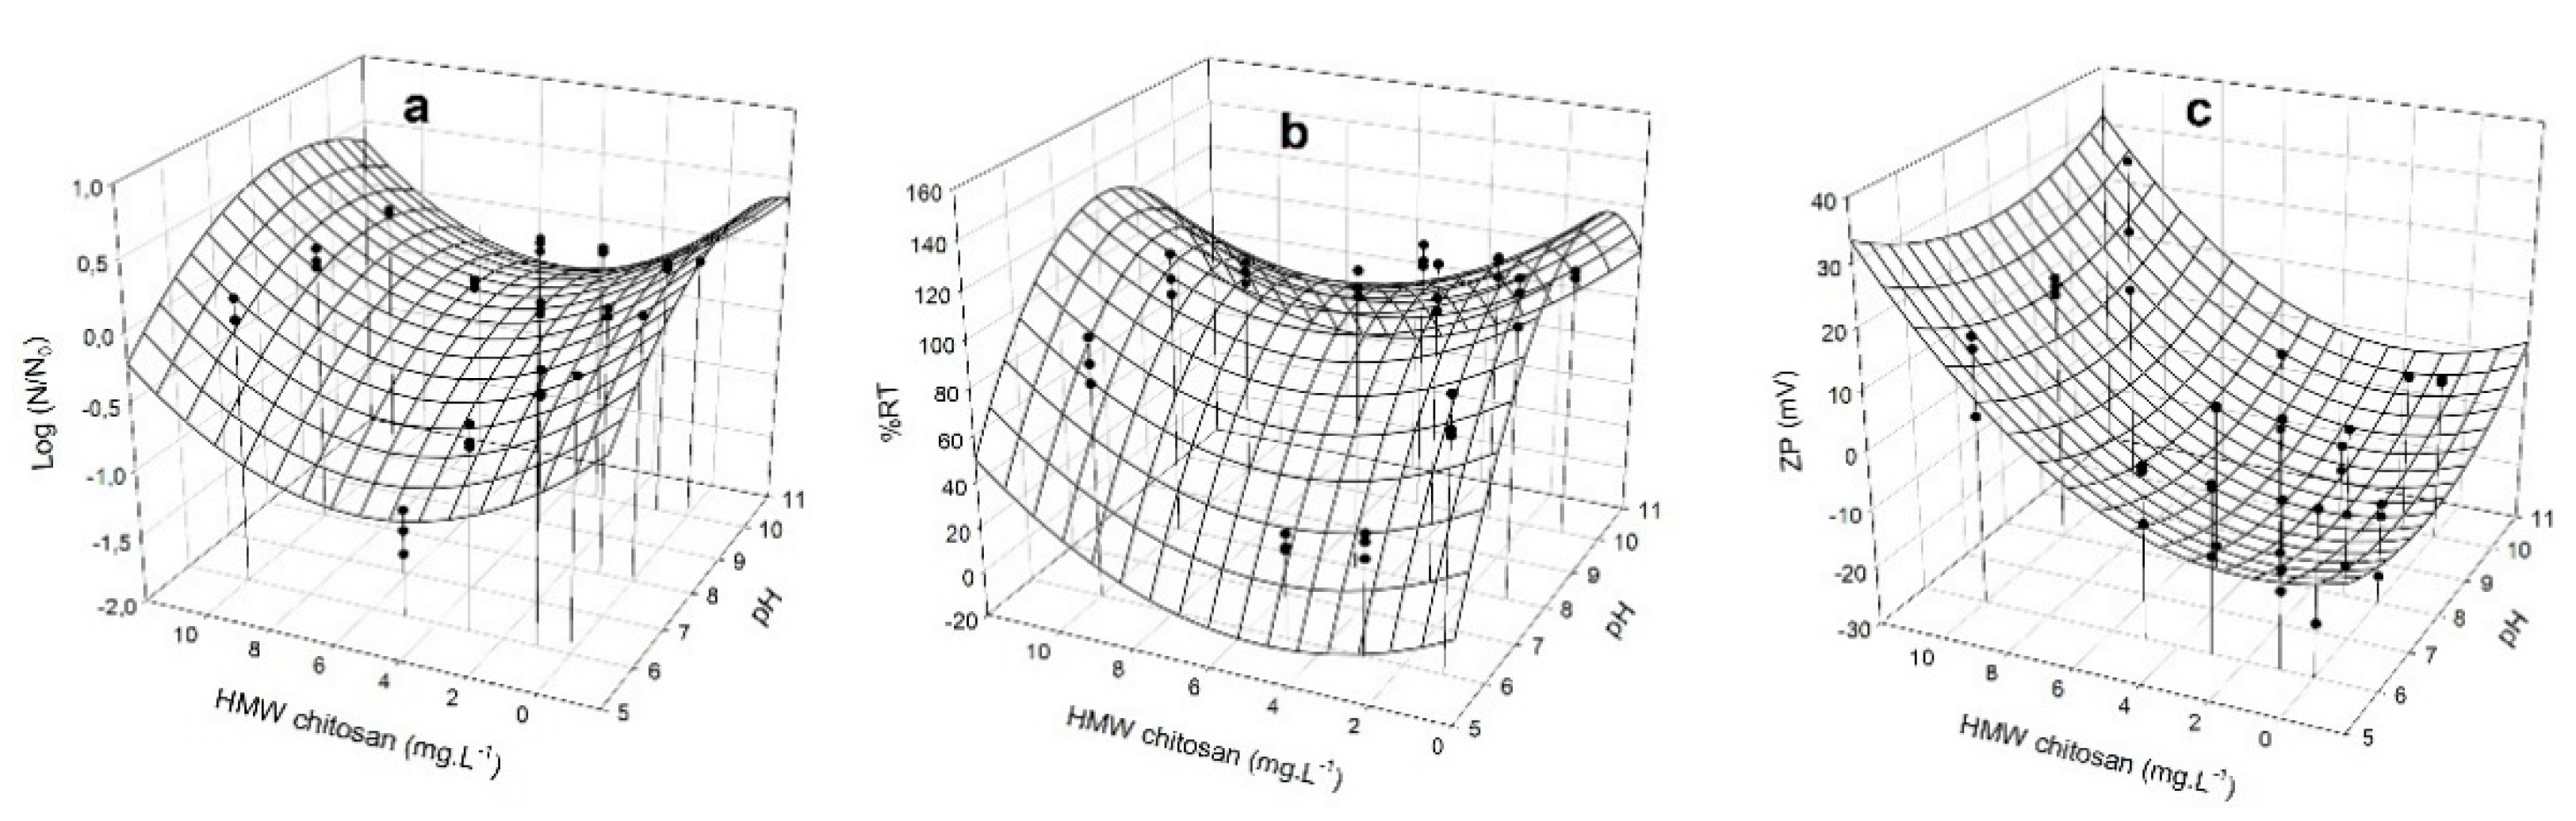
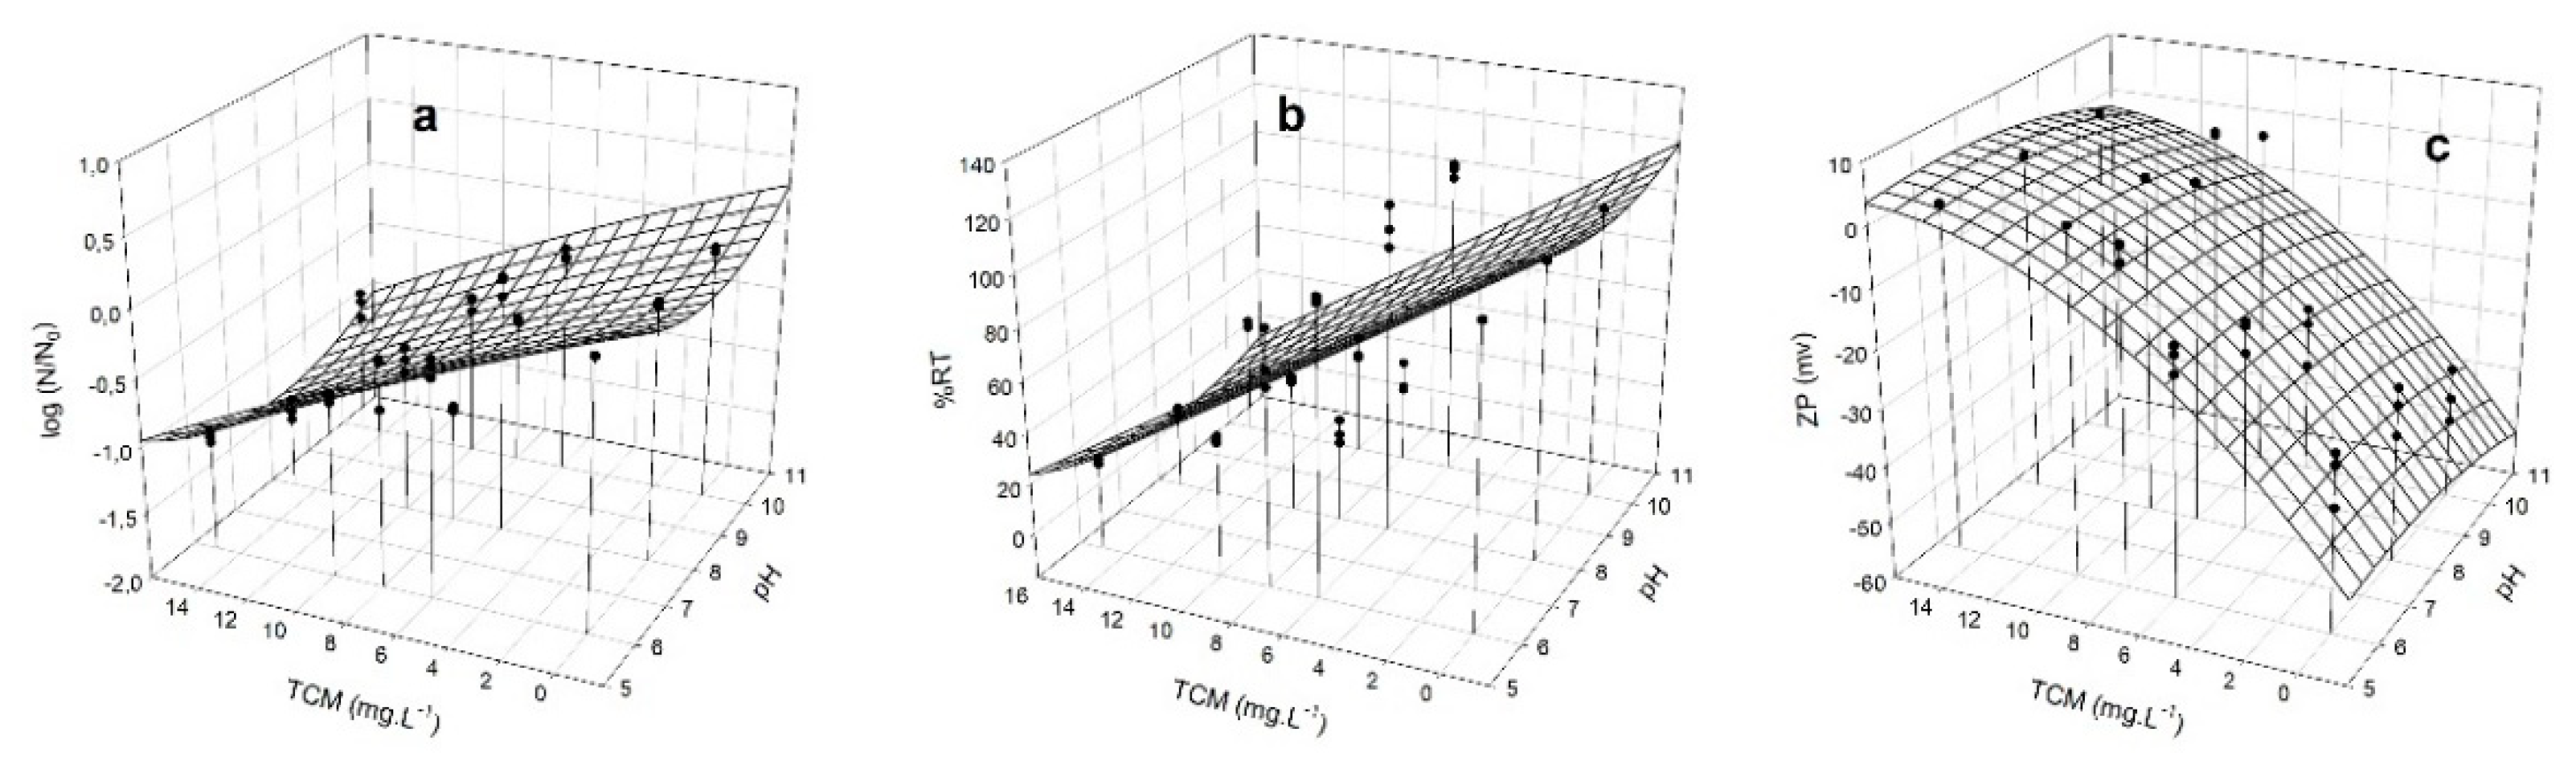
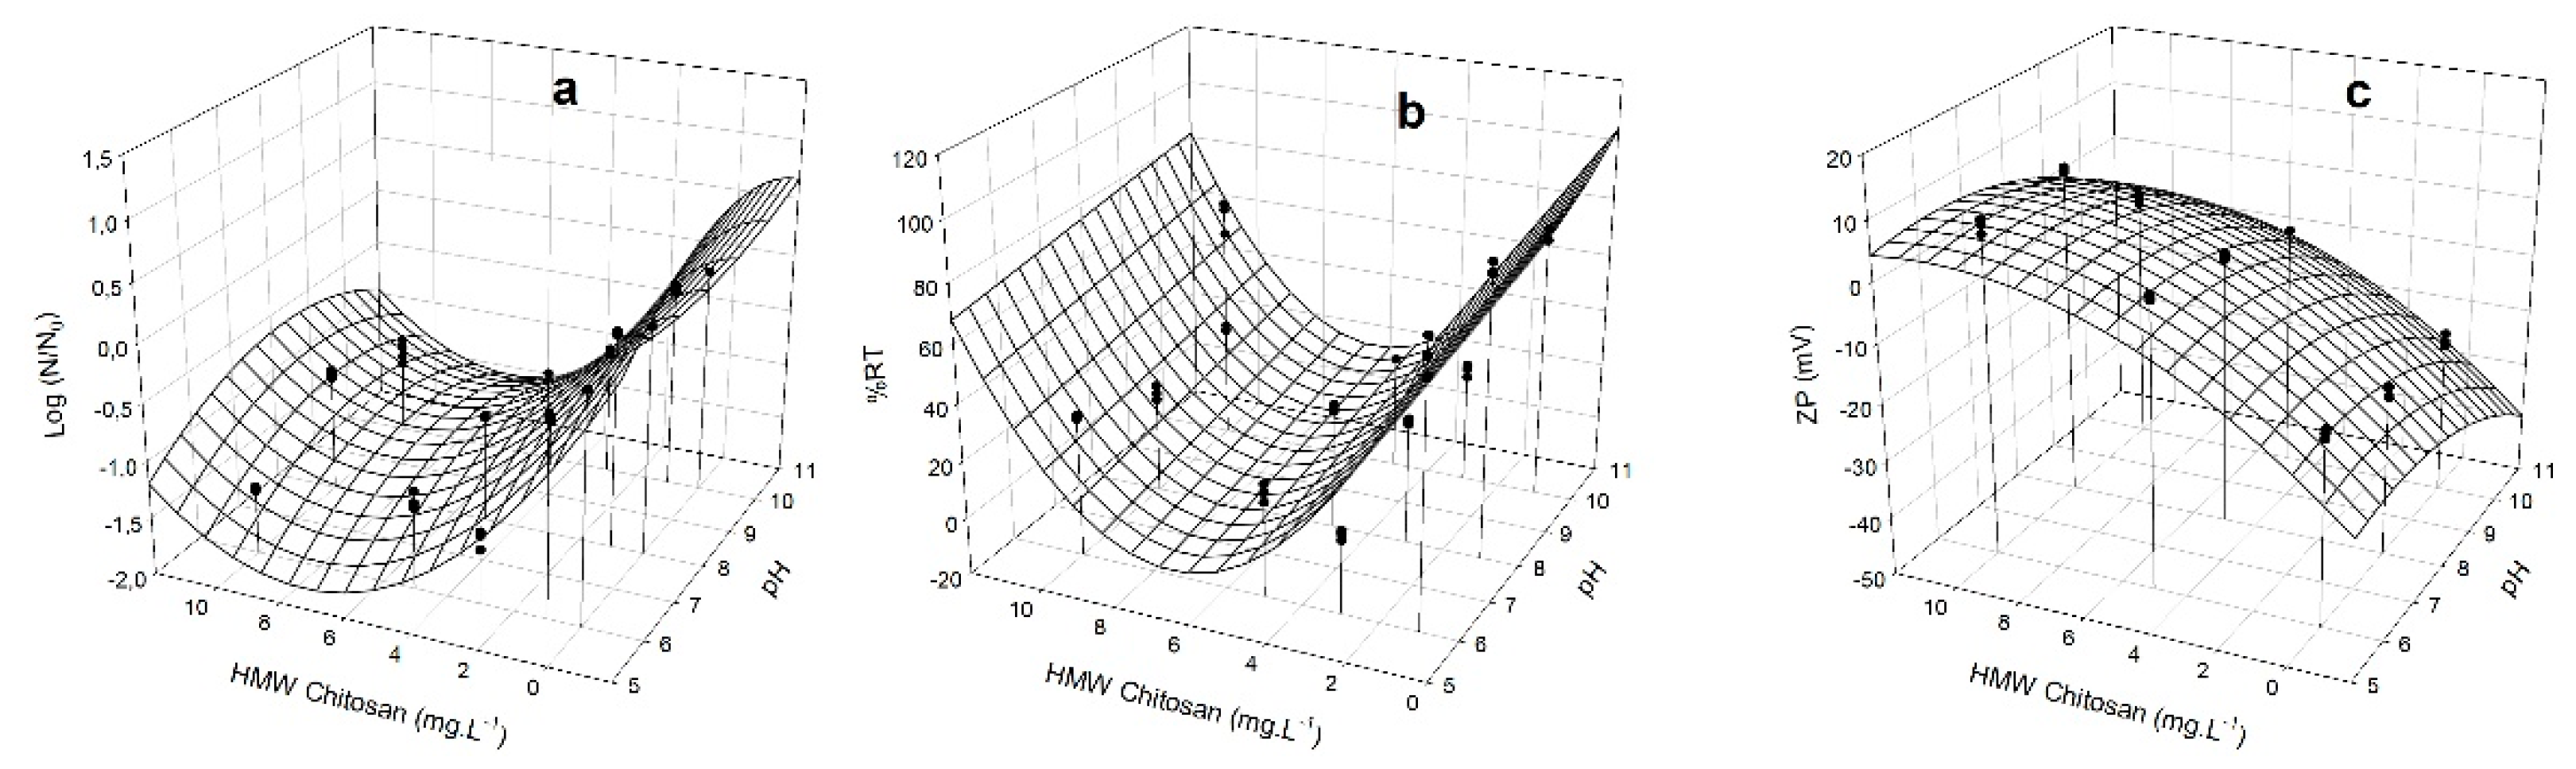
3.4. Removal Capacity of M. aeruginosa by HMW Chitosan and TMC

Since the flocculation process depends on the surface charge of the cells, we measured the Zeta potential (ZP) [24] together with changes of log (N/N0), and %RT in the supernatants at different doses of HMW chitosan and TMC, at different pHs. ZP gives an idea of charge neutralization and therefore of flocculation, since high ZP values reflect significant electrostatic repulsions between particles and small sedimentation volumes [46]. The obtained data enabled us to generate a model to predict the best condition of coagulation/flocculation. The dependence of the different responses (log (N/N0), %RT, and ZP) on HMW chitosan and TMC concentrations was analyzed in M. aeruginosa PCC 7806 (Figure 4 and Figure 5) and in CAAT 2005-3 (Figure 6 and Figure 7). The experimental measurements overlapped in Figure 4, Figure 5, Figure 6 and Figure 7 show the satisfactory agreement of the experimental values with the predicted functions describing the response surface plot of each dependent variable (log (N/N0), %RT, and ZP).
The coefficients (y0, a, b, c, and d) were obtained by applying the model of Equation (2) and the stepwise elimination methodology with the SYSTAT 12.0 software. The coefficient of determination (R2) and the root-mean-square error (RMSE) applied to the different responses showed a good fit of the model to the experimental data (Table 1).
The parameters y0, a, b, c, and d allow for prediction of the values of the dependent variables (log (N/N0), %RT, and ZP) using Equation (2), at any independent variable (pH and chitosan concentration values). The surface responses show that there is an optimal minimum value in the range of the study’s independent variables.
The optimal minimum values for ZP should be fixed close to 0 mV, allowing a greater chance of aggregation.
For M. aeruginosa CAAT 2005-3, the minimum values of log(N/N0), %RT, and ZP (−1.5, 0.79%, and 0.79 mV, respectively) were reached at concentrations of HMW chitosan ranging between 6.7–7.7 mg L1 and pH ranging between 6.1–7.2 mg L1. For M. aeruginosa PCC 7806, the minimum values of log (N/N0), %RT, and ZP (−0.54, 49%, and 0.122 mV, respectively) were reached at concentrations of HMW chitosan between 5.1 and 5.9 mg L1 and pH = 6.1 mg L1. The optimum pH range with HMW chitosan was 6.1 to 7.2.
For M. aeruginosa CAAT 2005-3, the minimum values of log (N/N0), %RT, and ZP (−0.18, 50%, and 0.25 mV, respectively) were reached at concentrations of TMC ranging between 10 to 14 mg L1 and pH in the range of 6.1 to 8.7. For M. aeruginosa PCC 7806, the minimum values of log (N/N0), %RT, and ZP (−1.27, 10%, and 0.17 mV, respectively) were reached at concentrations of TMC between 11 and 14 mg L1, and pH = 8.0 to 9.8 mg L1.

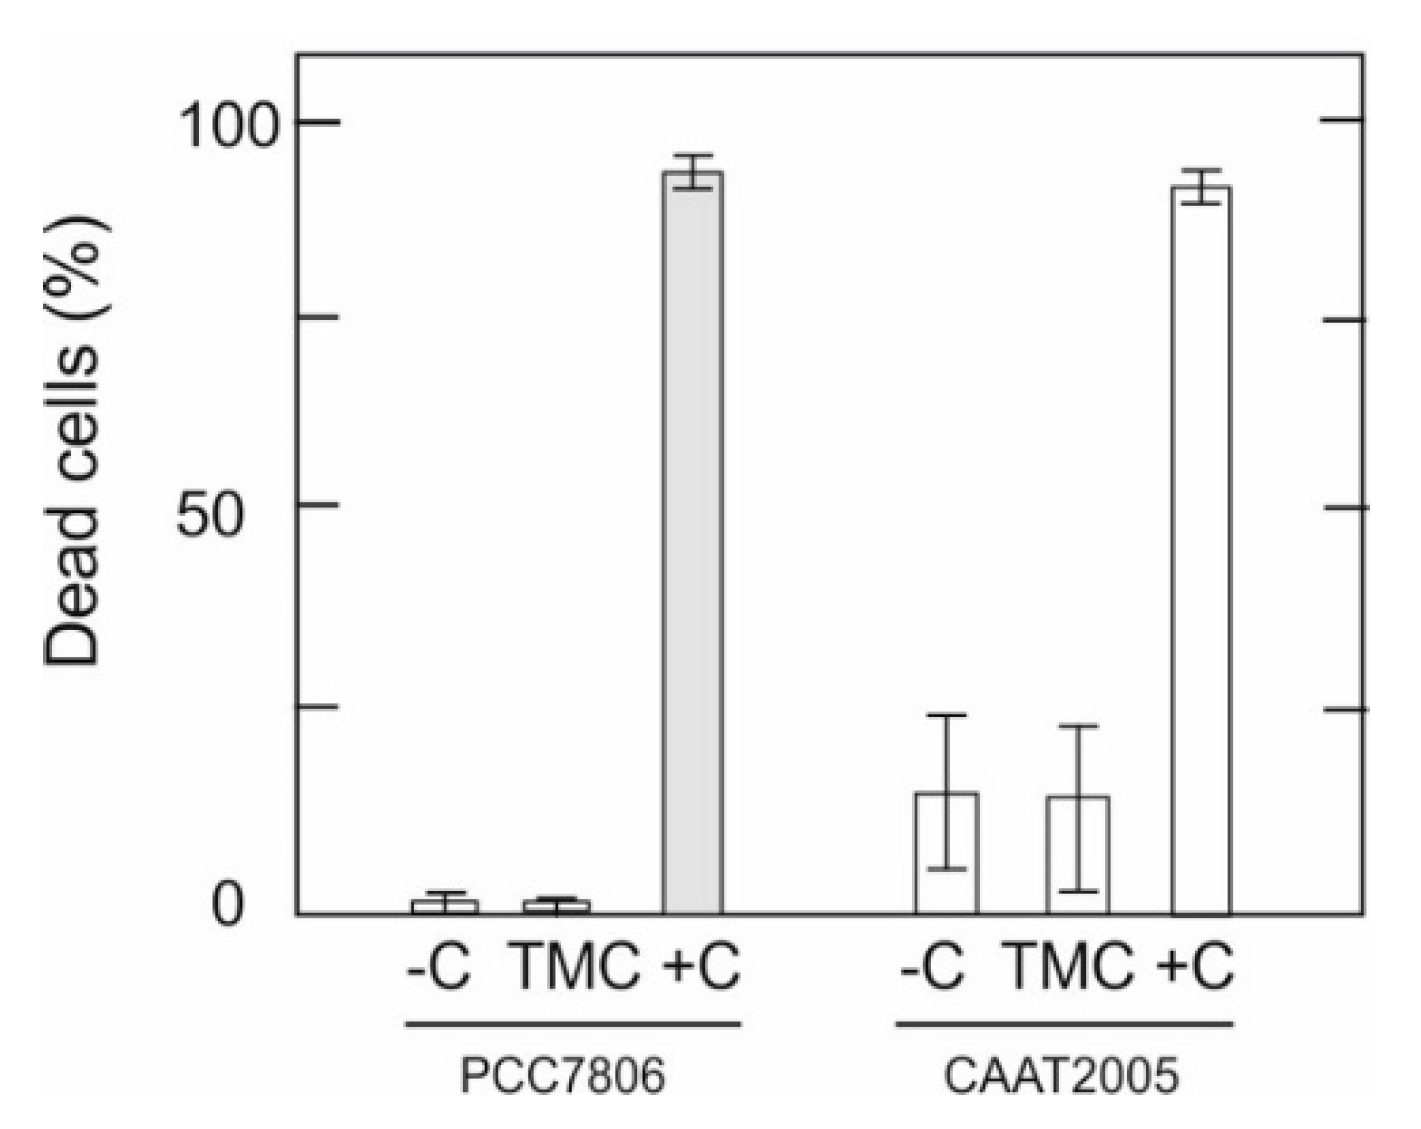
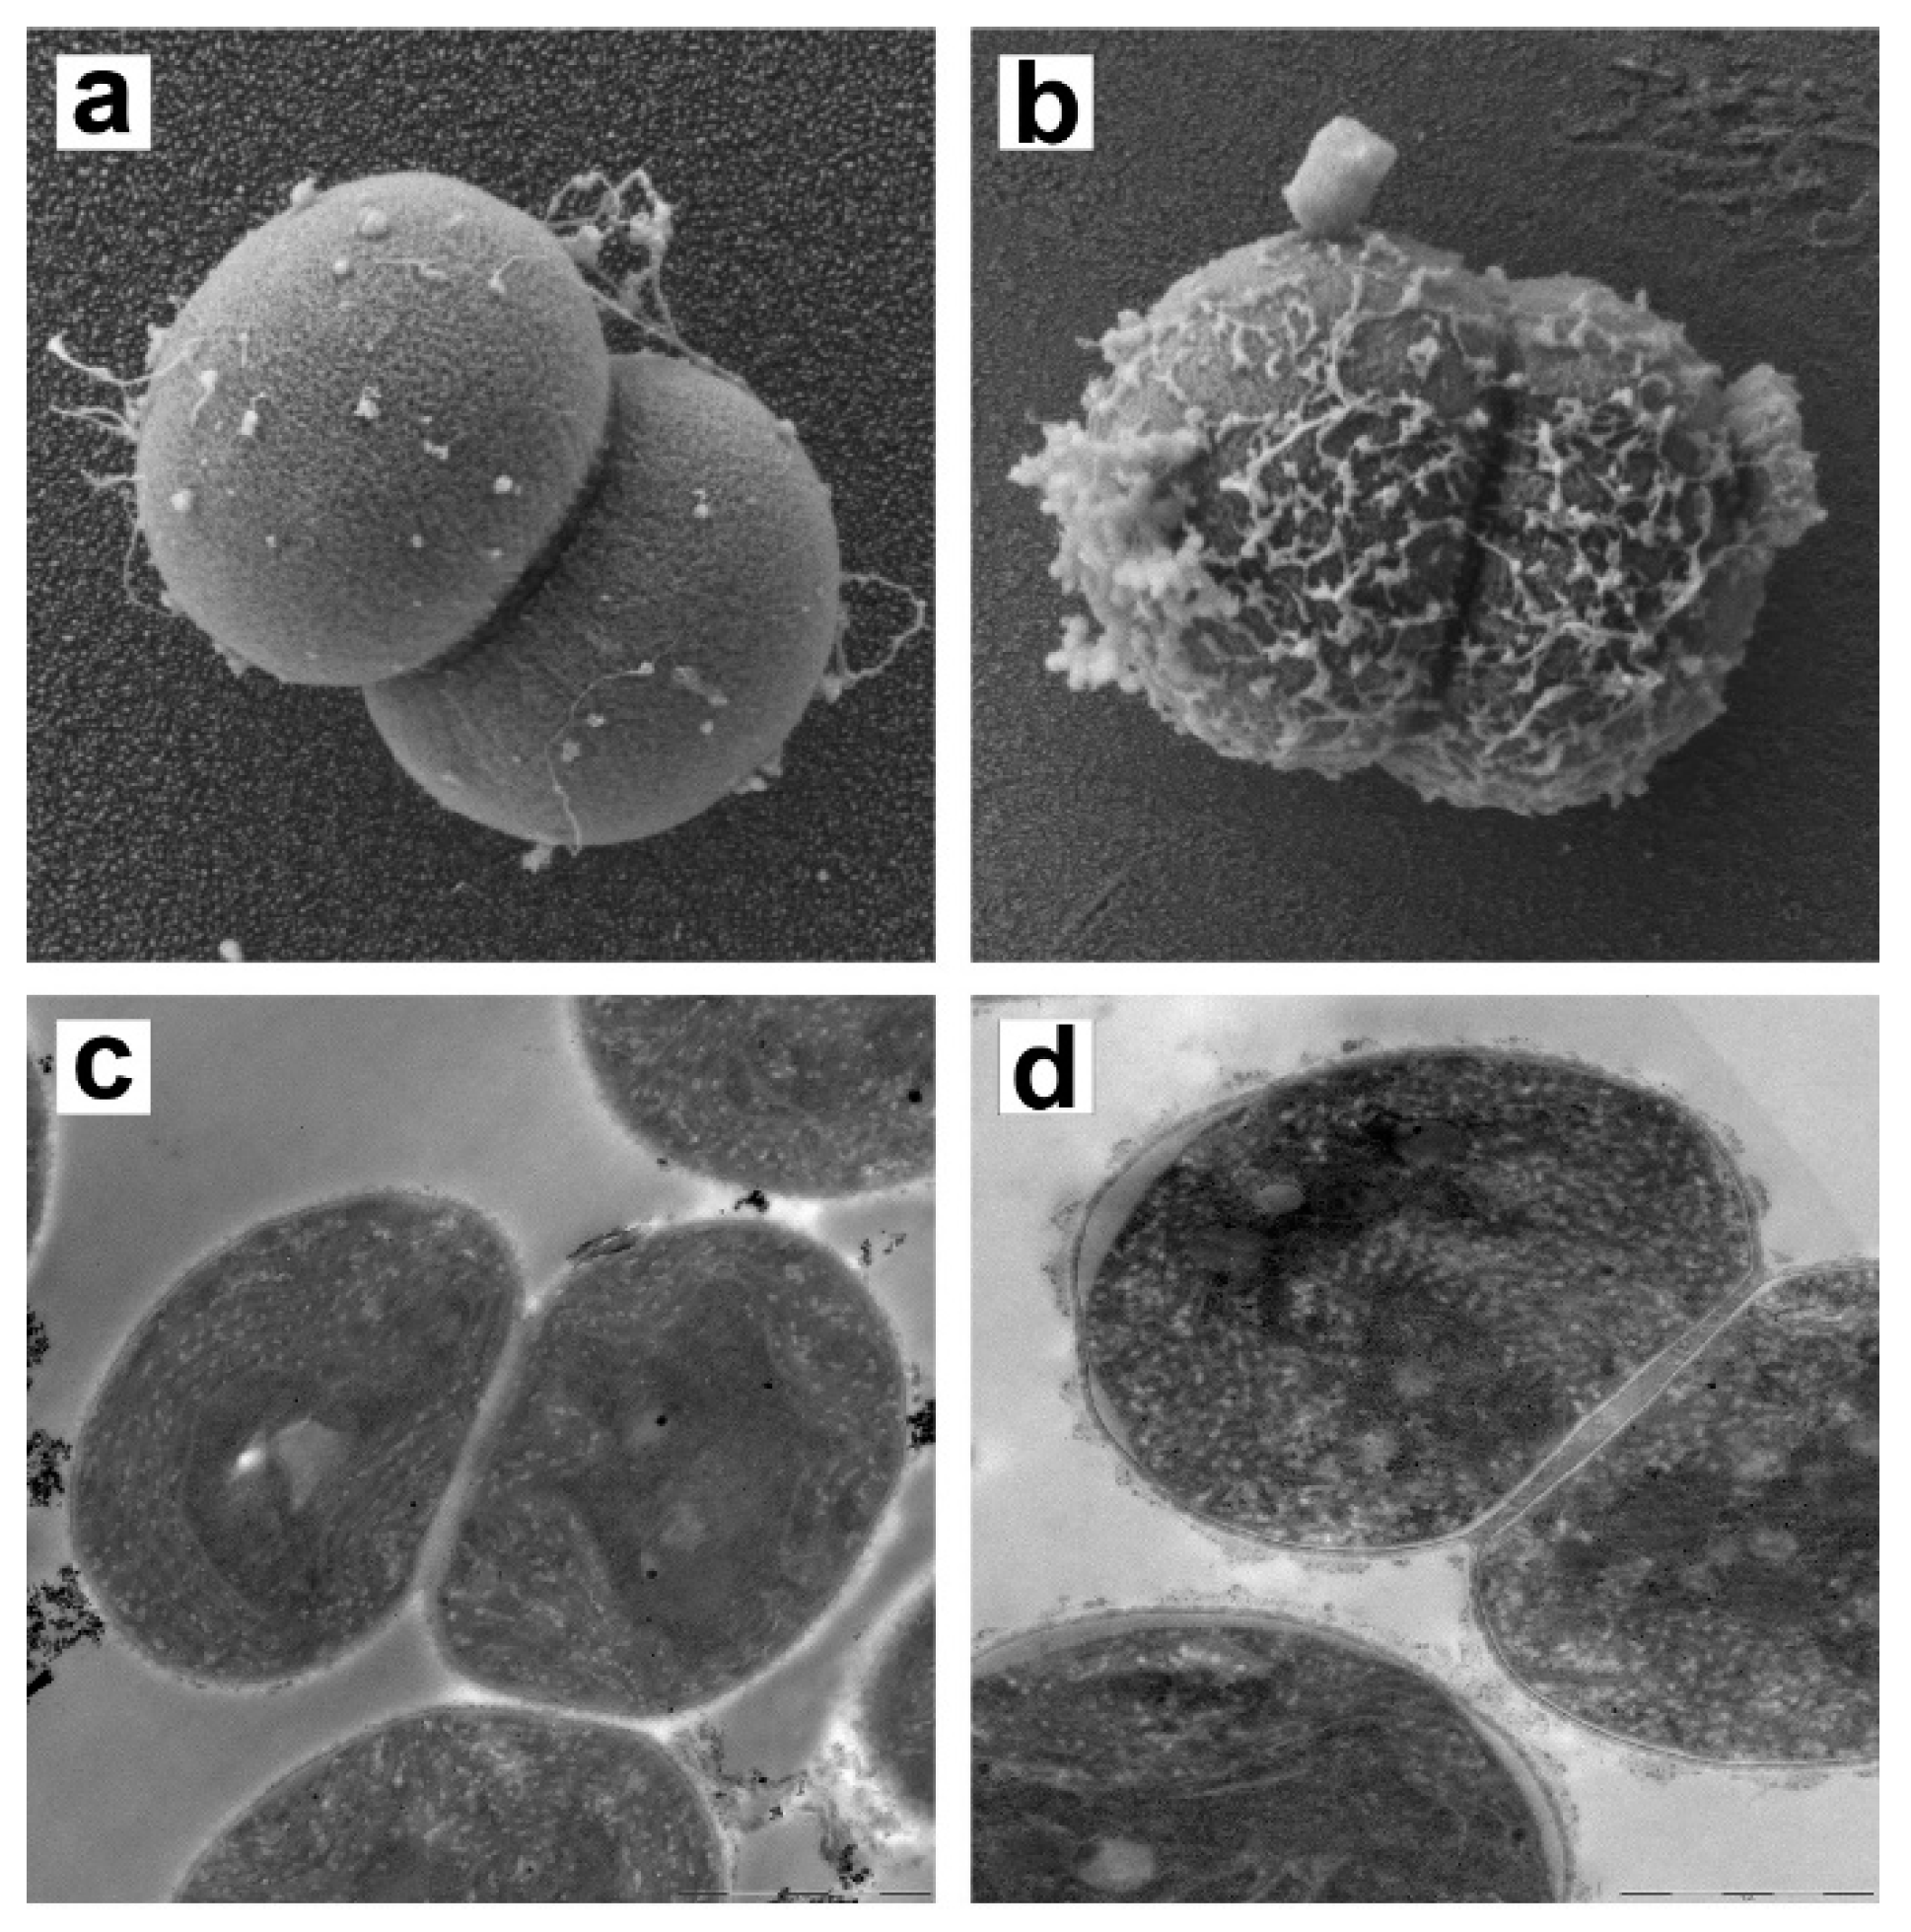
3.5. Effect of TMC on M. aeruginosa Cell Membrane Integrity

Since the C/F process may exert physiological or chemical stress on cyanobacterial cells [47], we investigated whether TMC presence could cause damage to membrane integrity and consequent release of cell content. The effect of TMC on M. aeruginosa cell membrane was evaluated first by staining with SYTOX® Green nucleic acid stain (Molecular Probes, Waltham, MA, USA) and then by electron microscopy.
The percentage of viable (SYTOX negative control) to nonviable (SYTOX positive control) cells was determined after the flocculation treatment. As shown in Figure 8, TMC treatment exhibited a similar result to non-treated cells (negative control), indicating that the flocculant could be used without cell damage.
In addition, SEM and TEM micrographs were taken to analyze M. aeruginosa cell changes after TMC treatment (Figure 9). Compared to the non-treated control, the membrane of M. aeruginosa cells remained intact, and morphology did not change after C/F; that is, the TMC treatment did not cause damage to the cyanobacterial cells.

4. Discussion

As a contribution to the elimination of cyanobacterial cells present in fresh water sources intended for human consumption, we explored the use of different chitosan products, which are biodegradable and environmentally friendly coagulants/flocculants. The chitosan assayed (LMW, MMW, and HMW) showed different cell removal capacity depending on the molecular weight, concentration, and M. aeruginosa strain used. The greatest effectiveness in removing cyanobacterial cells was achieved with HMW chitosan, both in test tubes and in the Jar-Test. In test tube experiments, the most effective chitosan concentration was around 4 to 6 mg L1, which allowed for the removal of 90% of suspended cells (Figure 1). A volume of 5 mg L1 HMW chitosan removed 95% of cells in Jar-Test assays (Figure 3 and Figure S2). However, this finding cannot be generalized and the appropriate concentration for C/F should be evaluated in each case, based on the predominant Microcystis sp. strain in the bloom. The chitosan–bentonite concentrations tested were not effective in removing cells in the range of 0–30 mg L1, which contrasts with previously reported results [40]. This discrepancy could be attributed to differences in the type of chitosan used to prepare the chitosan–bentonite composite.
Considering that the solubility of chitosan depends on the pH, it is effective at a pH lower than 7, and that blooms have usually alkaline pHs, it was decided to synthesize TMC from HMW chitosan extracted from residues of the fishing industry. We were able to confirm that the introduction of a permanent positively charged group to chitosan vastly increases its water solubility. This is in line with previous reports that found TMC to be soluble up to 10 g L1 over a pH range of 1–13 [48,49,50]. From the TMC and the HMW chitosan used in its synthesis, we generated a data set evaluating the removal of buoyant cells of two M. aeruginosa strains after varying the pH and flocculant concentration. A second order quadratic model was used to compare the effectiveness of cell removal, with the statistical parameters R2 and RMSE (Table 1) showing a good fit.
The response surface plots show that that there is an optimal pH and a minimum concentration value in the range of the studied independent variables. Optimal doses of HMW chitosan and TMC, as well as optimal pH ranges, were obtained by applying a second order quadratic model to reach minimum values of %RT, log (N/N0), and ZP. Since in the case of TMC the optimal pH range for C/F is between 6.1 and 9.8, we conclude that it could be suitable for treating water contaminated with blooms, ruling out the use of HMW chitosan, which is effective only in pH ranges between 6.1 and 7.2 (Figure 4, Figure 5, Figure 6 and Figure 7). Although this study was carried out with cells in culture medium, our results indicate that TMC in an optimal concentration range between 10 and 14 mg L1 could be used to remove M. aeruginosa cells not only from water supply treatment plants, but also from blooms that have generally alkaline pHs [43,44,45]. The different C/F behavior obtained with each strain and the two chitosans assayed could be ascribed to the different morphological characteristics of the cells of strains PCC 7806 and CAAT 2005-3.
A significant finding of the present paper upon evaluation of the viability and cell membrane integrity of Microcystis cells after treatment with TMC (Figure 8) is that the C/F process does not cause cell damage. This agrees with the electron microscopy images, the morphology characterized by TEM being in line with that obtained by SEM in M. aeruginosa treated with TMC (Figure 9). The fact that the M. aeruginosa cells remained intact in the coagulated system augurs well for the use of TMC as a C/F agent, as it indicates that undesirable harmful cellular components would not be released into the medium under these circumstances. However, this promising outlook requires further research to determine whether cell lysis might occur during floc storage, with the consequent release of toxins. It is therefore necessary to determine the microcystin concentration in the water after TMC treatment, the factors that influence cell lysis, and the mechanisms involved.

5. Conclusions

High M. aeruginosa cell removal was obtained in test tube assays by C/F with TMC in the range of 10–14 mg L−1, at a pH range found in blooms.
TMC was effective in removing the cells in suspension (˃95%) in both strains at pH 10 in a Jar-Test assay.
TMC did not cause cell damage under the conditions tested, which would indicate no leakage of internal metabolites within 3 h of starting treatment.

Supplementary Materials

The following supporting information can be downloaded at: https://www.mdpi.com/article/10.3390/microorganisms10102052/s1, Figure S1: Effect of different clays on the coagulation/flocculation of M. aeruginosa CAAT-2005-3 cells. Cya-nobacterial cultures (107 cells mL−1) were added with different amounts of clay Bent R53-1 and Bent 025CS1H). After 3 h, cells were counted from an aliquot of the supernatant. 100% corre-sponds to the number of cells before addition of the polymer. Figure S2: Removal of M. aeruginosa cells by HMW chitosan in a Jar test experiment. The capacity of 5 mg L−1 HMW chitosan at pH 6 to remove cells of two M. aeruginosa strains (PCC 7806 and CAAT 2005-3) was assayed in a Jar-test experiment. Figure S3: COSY-NMR spectra for HMW-chitosan (a) and TMC obtained after 48 h of hydrolysis (b).

Author Contributions

Conceptualization, L.G. and G.L.S.; methodology, J.B.; software, L.G.; formal analysis, L.G. and G.L.S.; investigation, L.G. and G.L.S.; writing—original draft preparation, L.G. and G.L.S.; writing—review and editing, L.G. and G.L.S.; visualization, G.L.S.; supervision, G.L.S.; project administration, G.L.S.; funding acquisition, G.L.S. All authors have read and agreed to the published version of the manuscript.

Funding

This research was funded by grants from Agencia Nacional de Promoción Científica y Tecnológica (ANPCyT, PICT 2017-0609, Préstamo BID), Universidad Nacional de Mar del Plata (EXA 1051/21), and Fundación para Investigaciones Biológicas Aplicadas (FIBA).

Institutional Review Board Statement

Not applicable.

Informed Consent Statement

Not applicable.

Data Availability Statement

Not applicable.

Acknowledgments

Our special thanks go to Alberto Chevalier, Pablo Villanueva, and Sergio M. Saldaña (GIHON, Laboratorios Químicos SRL) for HMW chitosan production and ZP measurements, and to Macarena Perez-Cenci and Gonzalo Caló (INBIOTEC-CONICET and FIBA) for technical assistance.

Conflicts of Interest

The authors declare no conflict of interest.

References

  1. Heisler, J.; Glibert, P.M.; Burkholder, J.M.; Anderson, D.M.; Cochlan, W.; Dennison, W.C.; Dortch, Q.; Gobler, C.J.; Heil, C.A.; Humphries, E.; et al. Eutrophication and harmful algal blooms: A scientific consensus. Harmful Algae 2008, 8, 3–13. [Google Scholar] [CrossRef] [PubMed] [Green Version]
  2. O’Neil, J.M.; Davis, T.W.; Burford, M.A.; Gobler, C.J. The rise of harmful cyanobacteria blooms: The potential roles of eutrophication and climate change. Harmful Algae 2012, 14, 313–334. [Google Scholar] [CrossRef]
  3. Reichwaldt, E.S.; Ghadouani, A. Effects of rainfall patterns on toxic cyanobacterial blooms in a changing climate: Between simplistic scenarios and complex dynamics. Water Res. 2012, 46, 1372–1393. [Google Scholar] [CrossRef]
  4. Huisman, J.; Codd, G.A.; Paerl, H.W.; Ibelings, B.W.; Verspagen, J.M.H.; Visser, P.M. Cyanobacterial Blooms. Nat. Rev. Microbiol. 2018, 16, 471–483. [Google Scholar] [CrossRef]
  5. World Health Organization. Toxic Cyanobacteria in Water: A Guide to Their Public Health Consequences, Monitoring and Management, 2nd ed.; Chorus, I., Welker, M., Eds.; CRC Press: Boca Raton, FL, USA, 2021; pp. 401–432. [Google Scholar]
  6. Alam, Z.B.; Otaki, M.; Furumai, H.; Ohgaki, S. Direct and indirect inactivation of Microcystis aeruginosa by UV-radiation. Water Res. 2001, 35, 1008–1014. [Google Scholar] [CrossRef]
  7. Zhang, G.; Wang, B.; Zhang, P.; Wang, L.; Wang, H. Removal of algae by sonication-coagulation. J. Environ. Sci. Health A Tox. Hazard. Subst. Environ. Eng. 2006, 41, 1379–1390. [Google Scholar] [CrossRef] [PubMed]
  8. Fan, J.; Hobson, P.; Ho, L.; Daly, R.; Brookes, J. The effects of various control and water treatment processes on the membrane integrity and toxin fate of cyanobacteria. J. Hazard. Mater. 2014, 264, 313–322. [Google Scholar] [CrossRef] [PubMed]
  9. Harke, M.J.; Steffen, M.M.; Gobler, C.J.; Otten, T.G.; Wilhelm, S.W.; Wood, S.A.; Paerl, H.W. A review of the global ecology, genomics, and biogeography of the toxic cyanobacterium, Microcystis spp. Harmful Algae 2016, 54, 4–20. [Google Scholar] [CrossRef] [Green Version]
  10. He, X.; Liu, Y.; Conklin, A.; Westrick, J.; Weavers, L.; Dionysiou, D.D.; Lenhart, J.J.; Mouser, P.J.; Szlag, D.; Walker, H.W. Toxic cyanobacteria and drinking water: Impacts, detection, and treatment. Harmful Algae 2016, 54, 174–193. [Google Scholar] [CrossRef]
  11. Yang, R.; Li, H.; Huang, M.; Yang, H.; Li, A. A review on chitosan-based flocculants and their applications in water treatment. Water Res. 2016, 95, 59–89. [Google Scholar] [CrossRef]
  12. Jančula, D.; Maršálek, B. Critical review of actually available chemical compounds for prevention and management of cyanobacterial blooms. Chemosphere 2011, 85, 1415–1422. [Google Scholar] [CrossRef] [PubMed]
  13. Fan, J.J.; Ho, L.; Hobson, P.; Brookes, J. Evaluating the effectiveness of copper sulphate chlorine, potassium permanganate, hydrogen peroxide and ozone on cyanobacterial cell integrity. Water Res. 2013, 47, 5153–5164. [Google Scholar] [CrossRef] [PubMed]
  14. Fast, S.A.; Kokabian, B.; Gude, V.G. Chitosan enhanced coagulation of algal turbid waters-Comparison between rapid mix and ultrasound coagulation methods. Chem. Eng. J. 2014, 244, 403–410. [Google Scholar] [CrossRef]
  15. Dearfield, K.L.; Douglas, G.R.; Ehling, U.H.; Moore, M.M.; Sega, G.A.; Brusick, D.J. Acrylamide: A review of its genotoxicity and an assessment of heritable genetic risk. Mutat. Res. 1995, 330, 71–99. [Google Scholar] [CrossRef]
  16. Xiong, B.; Loss, R.D.; Shields, D.; Pawlik, R.; Hochreiter, R.; Zydney, A.; Kumar, A. Polyacrylamide degradation and its implications in environmental systems. NPJ Clean Water 2018, 1, 17. [Google Scholar] [CrossRef]
  17. Renault, F.; Sancey, B.; Badot, P.M.; Crini, G. Chitosan for coagulation/flocculation processes—An eco-friendly approach. Eur. Polym. J. 2009, 45, 1337–1348. [Google Scholar] [CrossRef]
  18. Pei, H.Y.; Ma, C.X.; Hu, W.R.; Sun, F. The behaviors of Microcystis aeruginosa cells and extracellular microcystins during chitosan flocculation and flocs storage processes. Bioresour. Technol. 2014, 151, 314–322. [Google Scholar] [CrossRef]
  19. Elieh-Ali-Komi, D.; Hamblin, M.R. Chitin and Chitosan: Production and application of versatile biomedical nanomaterials. Int. J. Adv. Res. 2016, 4, 411–427. [Google Scholar]
  20. Kasaai, M.R. Determination of the degree of N-acetylation for chitin and chitosan by various NMR spectroscopy techniques: A review. Carbohydr. Polym. 2010, 79, 801–810. [Google Scholar] [CrossRef]
  21. Riske, F.; Schroeder, J.; Belliveau, J.; Kang, X.; Kutzko, J.; Menon, M.K. The use of chitosan as a flocculant in mammalian cell culture dramatically improves clarification throughput without adversely impacting monoclonal antibody recovery. J. Biotechnol. 2007, 128, 813–823. [Google Scholar] [CrossRef]
  22. Zeng, D.; Wu, J.; Kennedy, J.F. Application of a chitosan flocculant to water treatment. Carbohydr. Polym. 2008, 71, 135–139. [Google Scholar] [CrossRef]
  23. Sun, F.; Pei, H.-Y.; Hu, W.-R.; Ma, C.-X. The lysis of Microcystis aeruginosa in AlCl3 coagulation and sedimentation processes. Chem. Eng. J. 2012, 193, 196–202. [Google Scholar] [CrossRef]
  24. Li, L.; Zhang, H.; Pan, G. Influence of zeta potential on the flocculation of cyanobacteria cells using chitosan-modified soil. J. Environ. Sci. 2015, 28, 47–53. [Google Scholar] [CrossRef] [PubMed] [Green Version]
  25. Dao, V.H.; Cameron, N.R.; Saito, K. Synthesis, properties and performance of organic polymers employed in flocculation applications. Polym. Chem. 2016, 7, 11–25. [Google Scholar] [CrossRef] [Green Version]
  26. Jin, Y.; Pei, H.; Hu, W.; Zhu, Y.; Xu, H.; Ma, C.; Sun, J.; Li, H. A promising application of chitosan quaternary ammonium salt to removal of Microcystis aeruginosa cells from drinking water. Sci. Total Environ. 2017, 583, 496–504. [Google Scholar] [CrossRef]
  27. Wang, Z.; Wang, C.; Wang, P.; Qian, J.; Hou, J.; Ao, Y.; Wu, B. The performance of chitosan/montmorillonite nanocomposite during the flocculation and floc storage processes of Microcystis aeruginosa cells. Environ. Sci. Pollut. Res. 2015, 22, 11148–11161. [Google Scholar] [CrossRef]
  28. Ma, C.; Hu, W.; Pei, H.; Xu, H.; Pei, R. Enhancing integrated removal of Microcystis aeruginosa and adsorption of microcystins using chitosan-aluminum chloride combined coagulants: Effect of chemical dosing orders and coagulation mechanisms. Colloids Surf. A Physicochem. Eng. Asp. 2016, 490, 258–267. [Google Scholar] [CrossRef]
  29. Zou, X.; Xu, K.; Xue, Y.; Qu, Y.; Li, Y. Removal of harmful algal blooms in freshwater by buoyant-bead flotation using chitosan-coated fly ash cenospheres. Environ. Sci. Pollut. Res. 2020, 27, 29239–29247. [Google Scholar] [CrossRef]
  30. Li, H.; Pan, G. Simultaneous removal of harmful algal bloom sand microcystins using microorganism-and chitosan-modified local soil. Environ. Sci. Technol. 2015, 49, 6249–6256. [Google Scholar] [CrossRef] [Green Version]
  31. Aguilera, A.; Haakonsson, S.; Martin, M.V.; Salerno, G.; Echenique, R. Bloom-forming cyanobacteria and cyanotoxins in Argentina: A growing health and environmental concern. Limnologica 2018, 69, 103–114. [Google Scholar] [CrossRef]
  32. Rosso, L.; Sedan, D.; Kolman, M.; Caixach, J.; Flores, C.; Oteiza, J.M.; Salerno, G.L.; Echenique, R.; Giannuzzi, L.; Andrinolo, D. Microcystis aeruginos strain [D-Leu1] Mcyst-LR producer, from Buenos Aires province, Argentina. J. Coast. Life Med. 2014, 2, 287–296. [Google Scholar] [CrossRef]
  33. Rippka, R.; Deruelles, J.; Waterburry, J.B.; Herdman, M.; Stanier, R.Y. Generic assignments, strain histories and properties of pure cultures of cyanobacteria. J. Gen. Microbiol. 1979, 111, 1–61. [Google Scholar] [CrossRef] [Green Version]
  34. Rúnarsson, Ö.V.; Holappa, J.; Jónsdóttir, S.; Steinsson, H.; Másson, M. N-selective ‘one pot’ synthesis of highly N-substituted trimethyl chitosan (TMC). Carbohydr. Polym. 2008, 74, 740–744. [Google Scholar] [CrossRef]
  35. Szymańska, E.; Winnicka, K. Stability of chitosan-a challenge for pharmaceutical and biomedical applications. Mar. Drugs 2015, 13, 1819–1846. [Google Scholar] [CrossRef]
  36. Schulze, K.; López, D.A.; Tillich, U.M.; Frohme, M. A simple viability analysis for unicellular cyanobacteria using a new autofluorescence assay, automated microscopy, and Image. BMC Biotechnol. 2011, 11, 118. [Google Scholar] [CrossRef] [PubMed] [Green Version]
  37. Venable, J.H.; Coggeshall, R. A simplified lead citrate stain for use in electron microscopy. J Cell Biol. 1965, 25, 407–408. [Google Scholar] [CrossRef] [Green Version]
  38. Snedecor, G.W.; Cochran, W.G. Statistical Methods, 6th ed.; Iowa State Univ. Press: Ames, IA, USA, 1969. [Google Scholar]
  39. Song, W.C.; Li, X.; Sun, S.H.; Yang, Y.L.; Jia, R.B. Test study of enhanced coagulation for conventional treatment with low temperature and low turbidity. J. Residuals Sci. Technol. 2015, 12, 1544–8053. [Google Scholar] [CrossRef] [Green Version]
  40. Zheng, B.G.; Peng, W.G.; Zhang, J.B.; Zheng, Z. Flocculation removal of Microcystis aeruginosa by chitosan-bentonite compound material. Adv. Mat. Res. 2011, 335–336, 1381–1384. [Google Scholar] [CrossRef]
  41. Bangde, P.S.; Jain, R.D.; Dandekar, P. Alternative approach to synthesize methylated chitosan using deep eutectic solvents, biocatalyst and “green” methylating agents. Acs Sustain. Chem. Eng. 2016, 4, 3552–3557. [Google Scholar] [CrossRef]
  42. Hemming, E.B.; Masters, A.F.; Perosa, A.; Selva, M.; Maschmeyer, T. Single-step methylation of chitosan using dimethyl carbonate as a green methylating agent. Molecules 2019, 24, 3986. [Google Scholar] [CrossRef] [Green Version]
  43. Verspagen, J.M.; Van De Waal, D.B.; Finke, J.F.; Visser, P.M.; Van Donk, E.; Huisman, J. Rising CO2 levels will intensify phytoplankton blooms in eutrophic and hypertrophic lakes. PLoS ONE 2014, 9, e104325. [Google Scholar] [CrossRef] [PubMed]
  44. Bullerjahn, G.S.; Mckay, R.M.; Davis, T.W.; Baker, D.B.; Boyer, G.L.; D’anglada, L.V.; Doucette, G.J.; Ho, J.C.; Irwin, E.G.; Kling, C.L.; et al. Global solutions to regional problems: Collecting global expertise to address the problem of harmful cyanobacterial blooms. A Lake Erie case study. Harmful Algae 2016, 54, 223–238. [Google Scholar] [CrossRef] [PubMed] [Green Version]
  45. Krausfeldt, L.E.; Farmer, A.T.; Castro Gonzalez, H.; Zepernick, B.N.; Campagna, S.R.; Wilhelm, S.W. Urea is both a carbon and nitrogen source for Microcystis aeruginosa: Tracking 13C incorporation at bloom pH conditions. Front. Microbiol. 2019, 10, 1064. [Google Scholar] [CrossRef] [PubMed] [Green Version]
  46. Hu, C.Y.; Lo, S.L.; Chang, C.L.; Chen, F.L.; Wu, Y.D.; Ma, J.L. Treatment of highly turbid water using chitosan and aluminum salts. Sep. Purif. Technol. 2013, 104, 322–326. [Google Scholar] [CrossRef]
  47. Peterson, H.G.; Hrudey, S.E.; Cantin, I.A.; Perley, T.R.; Kenefick, S.K. Physiological toxicity, cell membrane damage and the release of dissolved organic carbon and geosmin by Aphanizomenon flos-aquae after exposure to water treatment chemicals. Water Res. 1995, 29, 1515–1523. [Google Scholar] [CrossRef]
  48. Mourya, V.K.; Inamdar, N.N. Trimethyl chitosan and its applications in drug delivery. J. Mater. Sci. Mater. Med. 2009, 20, 1057–1079. [Google Scholar] [CrossRef]
  49. Benediktsdóttir, B.E.; Gaware, V.S.; Rúnarsson, Ö.V.; Jónsdóttir, S.; Jensen, K.J.; Másson, M. Synthesis of N,N,N-trimethyl chitosan homopolymer and highly substituted N-alkyl-N, N-dimethyl chitosan derivatives with the aid of di-tert-butyldimethylsilyl chitosan. Carbohydr. Polym. 2011, 86, 1451–1460. [Google Scholar] [CrossRef]
  50. Jintapattanakit, A.; Mao, S.; Kissel, T.; Junyaprasert, V.B. Physicochemical properties and biocompatibility of N-trimethyl chitosan: Effect of quaternization and dimethylation. J. Pharm. Biopharm. 2008, 70, 563–571. [Google Scholar] [CrossRef]
Figure 1. Effect of chitosan of different MW on the coagulation/flocculation of M. aeruginosa at the pH of the culture medium. CAAT 2005-3 cultures ■ and PCC 7806 cells cultures □ (107 cells mL−1) were added with different amounts of chitosan: low (LMW) (a), medium (MMW) (b), and high (HMW) (c). After 3 h, cells were counted from an aliquot of the supernatant.
Microorganisms 10 02052 g001
Figure 2. Trimethyl chitosan characterization. (a) Scheme of the synthesis and TMC structure. (b) 1H NMR spectrum (600 MHz) of chitosan (upper panel) and TMC in D2O at 65 °C. Acetone was used as a reference (2.2 ppm). The main differential groups are indicated on the spectrum.
Microorganisms 10 02052 g002
Figure 3. Removal of M. aeruginosa cells by HMW chitosan and TMC in a Jar-Test experiment. The capacity of 5 mg L−1 HMW chitosan at pH 10 to remove cells of two M. aeruginosa strains (PCC 7806 and CAAT 2005-3) was assayed in a Jar-Test experiment.
Microorganisms 10 02052 g003
Figure 4. Response surface plot for M. aeruginosa PCC 7806 of: (a) log (N/N0), where N and N0 are the number of cells/mL−1after and before the treatment, respectively; (b) %RT removal; and (c) ZP of the clarified zone, as a function of different concentrations of HMW chitosan (mg L−1) and pHs. (•) experimental measurements.
Microorganisms 10 02052 g004
Figure 5. Response surface plot for M. aeruginosa PCC 7806 of: (a) log (N/N0); (b) %RT removal; and (c) ZP of the clarified zone, as a function of different concentrations of TMC (mg L−1) and pHs. (•) experimental measurements.
Microorganisms 10 02052 g005
Figure 6. Response surface plot for M. aeruginosa CAAT 2005-3 of: (a) log (N/N0), (b) %RT removal; and (c) ZP of the clarified zone, as a function of different concentrations of HMW chitosan (mg L−1) and pHs. (•) experimental measurements.
Microorganisms 10 02052 g006
Figure 7. Response surface plot for M. aeruginosa CAAT 2005-3 of: (a) log (N/N0); (b) %RT removal; and (c) ZP of the clarified zone, as a function of different concentrations of TMC (mg L−1) and pHs. (•) experimental measurements.
Microorganisms 10 02052 g007
Figure 8. M. aeruginosa viability after TMC treatment. Cell death in two M. aeruginosa strains (PCC 7806 and CAAT2005-3) was evaluated in cell pellets after TMC treatment. Cells were stained with SYTOX Green, examined, and counted under light and fluorescence microscopy. SYTOX-positive cells were interpreted as being dead cells. Negative control (−C, untreated cells) and positive control (+C, cells subjected to 70 °C for 10 min) were included.
Microorganisms 10 02052 g008
Figure 9. SEM and TEM of M. aeruginosa after C/F treatment. (a) SEM M. aeruginosa sp. PCC 7806 control, Mag: 50,000 K; (b) SEM M. aeruginosa treated with TMC, Mag: 50,000 K; (c) TEM M. aeruginosa sp. PCC 7806 control; (d) TEM M. aeruginosa treated with TMC.
Microorganisms 10 02052 g009
Table 1. Coefficients determined by regressions using response surface methodology (RMSE) for each analyzed response and statistical parameters (determination coefficient (R2).
StrainFlocculant Coefficients
y0abcdR2RMSE
PCC 7806HMW
chitosan
Log
(N/N0)
−3.84 ± 1.330.911 ± 0.3444−0.165 ± 0.041−0.051 ± 0.0020.0162 ± 0.0030.4870.271
% RT−133.8 ± 10.11−9.08 ± 0.25−33.73 ± 6.1056.23 ± 1.672.28 ± 0.370.7750.426
ZP37.19 ± 44.33−14.90 11.502.34 ± 1.401.02 ± 0.720.06 ± 0.130.7557.281
TMCLog
(N/N0)
1.36 ± 0.14−0.08 ± 0.03−0.01 ± 0.0010.005 ± 0.003−1.10−4 ± 2.10−50.7910.030
% RT209.78 ± 114.8−24.57 ± 29.64−6.15 ± 2.091.39 ± 1.840.002 ± 0.0010.6560.615
ZP−50.23 ± 38.794.50 ± 10.014.71 ± 0.70−0.35 ± 0.62−0.13 ± 0.040.7737.892
CAAT 2005-3HMW
chitosan
Log
(N/N0)
−3.18 ± 0.800.79 ± 0.20−0.39 ± 0.02−4.75 ± 0.010.02 ± 0.0020.9120.164
% RT79.20 ± 8.142.14 ± 0.22−28.71 ± 3.570.008 ± 0.0012.235 ± 0.3140.71114.842
ZP−42.60 ± 16.518.32 ± 4.274.27 ± 0.48−0.66 ± 0.27−0.204 ± 0.0470.9552.490
TMCLog
(N/N0)
−0.50 ± 0.210.11 ± 0.08−0.02 ± 0.001−0.006 ± 0.008.9.10−4 ± 3.10−50.5350.063
% RT−20.34 ± 6.2442.49 ± 15.12−16.67 ± 4.41−2.48 ± 0.940.70 ± 0.200.54410.660
ZP14.01 ± 18.30−8.25 ± 4.721.60 ± 0.330.45 ± 0.29−1.10−3 ± 1.10−40.8373.721
Publisher’s Note: MDPI stays neutral with regard to jurisdictional claims in published maps and institutional affiliations.

