Abstract
This paper presents the technology to control the shape of thin polymer doubly curved shell structures with a unimorph layer of strain actuators to achieve high quality, light-weight, foldable space reflectors. The selected active material is PVDF-TrFE deposited by spin coating; it is electrostrictive, isotropic and enjoys an excellent piezoelectric coefficient pC/N when properly annealed, but has a nonlinear, quadratic behavior. The strain actuation is controlled by an array of segmented electrodes. The purpose of this study is to evaluate the material properties achieved in the manufacturing process. A simple, unidirectional model of electrostrictive material is considered and the material constants (electrostrictive constant , piezoelectric constant , spontaneous polarization and poling strain ) are estimated from various static and dynamic experiments. The final part of the paper illustrates the control authority on a small demonstrator with seven independent electrodes and compares the experimental results with numerical finite element simulations.
1. Introduction
Installing very large reflectors in space is necessary to provide sufficient collecting area to feed antennas, spectrographs and other sensing equipments, as well as to improve the image resolution [,]. Achieving this brings several challenges: (i) the volume constraint requires folding during launch and unfolding once in orbit; (ii) the weight constraint requires a low areal density, especially for geostationary orbits or distant operating locations such as the Lagrange point L2; (iii) the reflector must survive the harsh vibratory environment during launch; (iv) the surface figure accuracy of the deployed reflector must be adequate for the mission (RMS wavefront accuracy of , usually, for optical systems) and must be maintained in spite of the thermal disturbances and gravity gradient. Finally, (v) the cost should remain moderate (the estimated total cost of the James Webb Space Telescope (JWST) is 10 billion USD).
Two concepts based on polymer materials with high stowability and low areal density (<3 kg/m) have attracted interest in recent years: the lenticular, pressure stiffened membranes [] and the doubly curved, form stiffened elastic shell []. Lenticular membrane reflectors are made of two circular flat membranes glued on the edge; one of them is covered with reflecting material on the inside to form the reflector while the other is transparent and will form the canopy. The membrane is inflated with an internal pressure which can be adjusted to control the focal length of the system. The lenticular structure is attached to a supporting torus (also inflatable) by tie rod (Figure 1a). The main advantages of the lenticular reflector are the high packaging efficiency and potential transportation of large apertures with a launcher of small size. The wavefront error of lenticular structures tends to be dominated by spherical aberration [] which is difficult to cancel by active means. Besides, inflatable structures are prone to gas leakage due to micro-meteorites, which make them impossible for long duration mission. Make up gas may be avoided by rigidizing the structure after deployment using ultraviolet (UV) curable resins, but the rigidity will limit the correctability of the reflector surface.
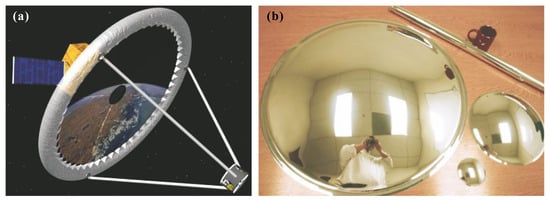
Figure 1.
(a) Lenticular membrane reflector (source: NASA). (b) Polyimide thin shell reflector in deployed and rolled configurations (source: MEVICON).
An alternative option consists of making the reflector out of a polymer elastic shell molded in its final shape and rolled for stowage; once released in orbit, the reflector unfolds on its own strain energy to achieve its final shape (Figure 1b) [,]. Of course, this approach may not be suitable for high accuracy imaging reflectors, but there are less stringent applications such as LIDAR, laser communication and light collectors for spectroscopy. Besides, the wavefront can be further corrected by Adaptive Optics (AO).
Another option is considered in [], where a deployable mesh antenna supports a membrane aperture controlled by a set of electrostatic actuators.
Active control of the reflector shape can be achieved in various ways depending on the configuration: with a set of thermal actuators for a truss antenna [], with electrostatic actuators (acting out of plane) on a mesh antenna [] or with a set of piezoelectric orthotropic PVDF actuators (acting in plane) glued on the back of the reflector []. The present work is concerned with adding a spin coated thin film of electrostrictive copolymer material (PVDF-TrFE); a set of in-plane strain actuators is controlled by an array of independent electrodes obtained by lithography. PVDF-TrFE copolymer allows to achieve an excellent piezoelectric coefficient pC/N, but being electrostrictive, it behaves quadratically.
Strain actuators are very efficient for controlling flat plates and PZT actuators are widely used in Adaptive Optics, e.g., []. However, the study of the strain actuation of an ultrathin spherical shell shows that the behavior is very different from that of a plate, because the spherical shell is much more rigid, leading to reduced amplitudes. Besides, the accurate shape control with an array of independent electrodes requires that the electrode size be such that , where is the radius of curvature and t is the shell thickness [,]. Any significant departure from this condition will lead to a steep (and wavy) transition of the reflector shape between electrodes excited with different actuating strains (i.e., different voltages in the case of electrostrictive materials). According to the foregoing constraint, a reflector of thickness m with a diameter m and a radius of curvature of m would require more than 2000 independent electrodes, and the same reflector with m would require 10 times more. This will require special control algorithms, because of the ill-conditioning of the Jacobian of the system [,].
This paper reports on a small-scale on-going technology demonstration project called Multilayer Adaptive Thin Shell Reflectors for Future Space Telescopes (MATS) developed on behalf of the ESA in the framework of the General Support Technology Programme (GSTP) program. The test article in development consists of a spherical polymer shell of diameter 200 mm with a thickness m and a radius of curvature 2.5 m controlled by a set of 25 independent electrodes; it is described in [] where numerical simulations are reported. The present paper aims at characterizing the spin coated copolymer PVDF-TrFE based on experimental results obtained on small samples and with a test article of 100 mm controlled with seven independent electrodes. The paper is organized as follows: Section 2 discusses the electrostrictive behavior of PVDF-TrFE thin films and recalls the classical unidirectional mathematical model. Section 3 discusses the experimental determination of the model parameters, namely the piezoelectric constant and the electrostrictive constant . Section 4 considers two methods for determining the spontaneous polarization ; one of them is based on a Fourier analysis of the structural response to an harmonic input. Section 5 discusses the direct measurement of the poling strain and Section 6 solves the inverse problem and indicates how the reflector deformation generated during polarization can be accounted for in the design. Section 7 illustrates the control authority on a small demonstrator with seven independent electrodes.
2. Electrostrictive Materials
2.1. Polarization Diagram
Figure 2a shows the polarization diagram of a ferroelectric material []; the origin O corresponds to the virgin material where the domains are randomly oriented. As the electric field E increases, the domains start to switch in the direction of the field and the charge density follows the curve OA. At point A, all the domains are aligned and the polarization behaves linearly; if E decreases, the polarization diagram behaves nearly linearly along the segment AB, to achieve the remnant polarization when . If the electric field is increased again, the polarization will follow the segment BA which is nearly linear; the intersection of the linear approximation and the polarization axis is called the spontaneous polarization. When the electric field becomes negative, the polarization diagram follows the segment BC; the domains start gradually to switch in the opposite direction and, when E reaches the coercive field, , the polarization is reversed and the polarization diagram follows the segment CD. If the electric field is increased again, the polarization diagram follows the trajectory DEFA which is symmetrical of ABCD. Figure 2b shows the strain versus electric field diagram of the material for positive value of E (first quadrant of the so-called butterfly curve); the virgin material follows the segment OA until the maximum value of the electric field. When E is reduced to zero, the strain follows the segment AB; when , the strain return to a nonzero value called the poling strain . Subsequently, if the electric field does not change sign, the strain will remain on the segment BA which can be approximated by a parabola, typical behavior of electrostrictive materials. Note that the diagram involves some hysteresis which will be neglected in the mathematical model below.
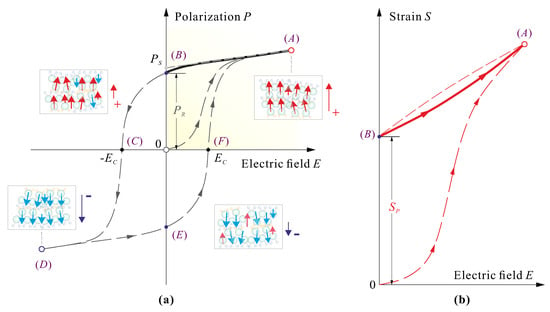
Figure 2.
(a) Typical polarization diagram of a ferroelectric material and orientation of the domains. is the remnant polarization, is the coercitive field. (b) Typical strain vs. electric field diagram () in the first quadrant. The origin corresponds to virgin material; is the poling strain.
2.2. Electrostrictive Model
The electrostrictive material is assumed to have a linear dielectric behavior:
where D is the electric displacement, is the spontaneous polarization, is the dielectric permittivity ( F/m) and E the electric field. is easily determined from a capacitance measurement (A capacitor formed by two electrodes of area A distant from t has a capacitance . Thus, . Note that the accuracy on the estimation of the dielectric constant is related to that on the thickness t of the active layer). For the material used in this project, this leads to . The spontaneous polarization is associated with the ferroelectric phase (-phase of the PVDF); it depends very much on the annealing temperature and duration. All the results presented below are based on spin-coated PVDF-TrFE (PVDF-TRFE FC25 from Piezotech, 0.12 g/mL in Acetone:Dimethylacetamide 95:5), annealed at 140 °C for 2 h.
A unidirectional electrostrictive material behaves according to (direction 3 is conventionally the direction of polarization):
where is the strain along the polarization direction and is the electrostrictive coefficient. is the poling strain which takes place during the polarization (Figure 2b). and are material properties that must be determined experimentally. For the present application, the strain actuator is based on the strain induced in the direction 1 orthogonal to the poling direction. Assuming that is related to by the Poisson’s coefficient , one gets
As a result, the piezoelectric coefficient is given by
This equation shows that a bias electric field increases the piezoelectric constant (in absolute value). Thus, any electrostrictive material can be made piezoelectric by applying a bias electric field [].
3. Dynamic Measurement of and
3.1. Piezoelectric Constant
The estimation of the piezoelectric coefficient is based on the dynamic analysis of a set of rectangular samples (Figure 3) made of 175 m of Polyethylene terephthalate (PET) covered by a spin-coated layer of 5 m of PVDF-TrFE between Aluminum electrodes. The samples are cantilevered with a length between 50 and 70 mm; they are modelled with finite elements (FE) (Mindlin multilayer piezoelectric plate in the software SAMCEF from Samtech-Siemens) [,].
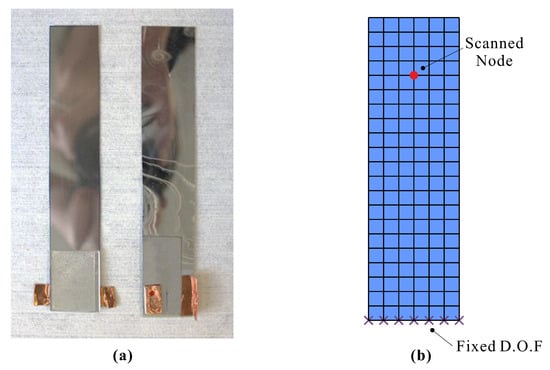
Figure 3.
(a) Rectangular sample of PET/PVDF-TrFE used in the estimation of the piezoelectric constant . (b) Finite Element model of the cantilever plate.
The estimation is based on the Frequency Response Function (FRF) between the voltage applied to the control electrodes and the velocity sensed by the non contact laser Doppler velocimeter (Polytec OFV 502). The FE model is up-dated to fit the resonance frequency of the experiment and the piezoelectric coefficient is obtained by adjusting the static gain (Figure 4). Figure 5 compares typical experimental and numerical FRFs. The value of depends very much on the annealing state (controlling the phase distribution in the ferroelectric material) and on the bias voltage; all the samples tested in this project exhibit a value of in the range 15–17 pC/N.
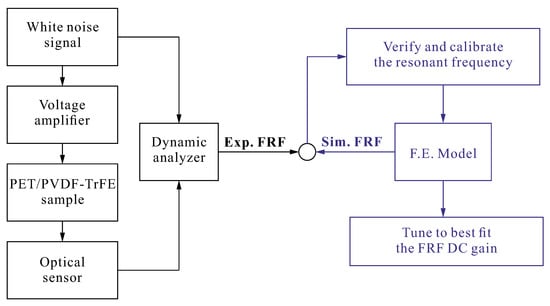
Figure 4.
Block diagram of the estimation of from FRF.
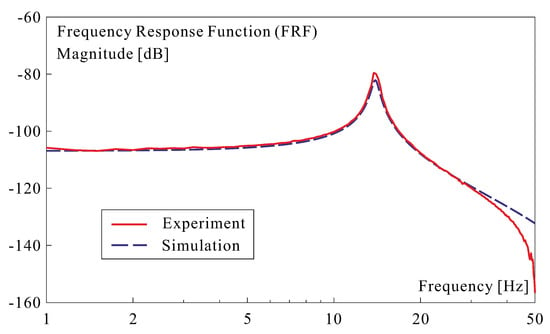
Figure 5.
Typical FRF between the voltage applied to the electrodes and the displacement sensed by the optical scanning head; for this particular example, 17 pC/N.
Note that, since the PVDF-TrFE contributes little to the stiffness of the sample, the foregoing procedure is insensitive to variations in the thickness of the active layer because, for a given voltage, the piezoelectric forces are independent of the film thickness [].
3.2. Electrostrictive Constant
From Equation (4),
Thus, the electrostrictive constant may be obtained by estimating the piezoelectric constant for various bias field (Figure 6). Assuming 0.34 and , one finds −13.5 m/C; this value is in line with the literature [].
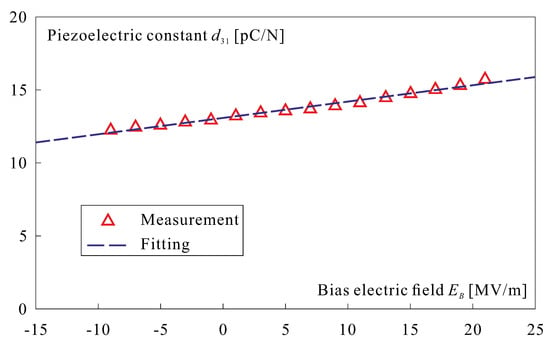
Figure 6.
Piezoelectric coefficient versus bias voltage . The slope is related to the electrostrictive constant according to Equation (5).
4. Spontaneous Polarization
According to Equation (4),
where is the bias voltage. Using pC/N, 0.34, F/m and 13 MV/m, one finds 0.0152 C/m.
In this section, we develop an alternative method based on the structural response to an harmonic excitation in the quasi-static range (well below the first structural resonance); the structure is linear and the excitation is produced by an electrostrictive actuator as considered above. The voltage V applied to the actuator produces an electric field E and a strain actuation (the poling strain which occurs only the first time is omitted). The structure being linear, all structural displacements will be proportional to :
where is a constant depending on the structure and on the position of the sensor in the structure and
Thus, the spontaneous polarization is given by:
with no need to know . In order to determine and , consider an harmonic excitation
where is a constant bias, is the amplitude of the harmonic component (Figure 7a). The frequency is well below the first structural resonance, so that the structure responds quasi-statically. A laser Doppler velocimeter is used to monitor the velocity response of one structural node; from Equation (7)
with
being the amplitude of the fundamental (at ) and the first harmonic (at ). These can be readily obtained by Fourier analysis of the nodal velocity monitored by the sensor.
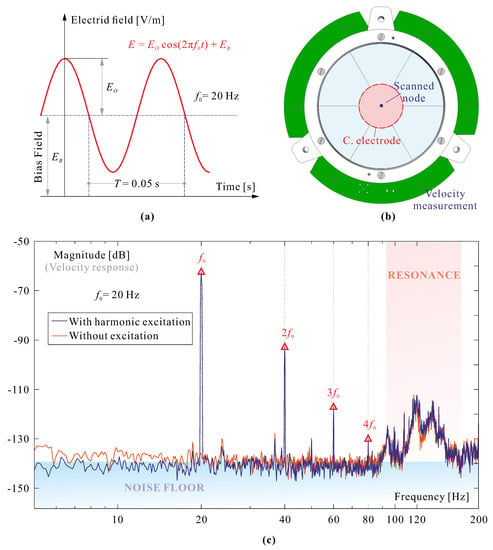
Figure 7.
(a) Harmonic excitation with bias , amplitude and frequency . (b) test structure: spherical shell of 100 mm diameter with 7 electrodes. The excitation is applied to the central electrode and the laser vibrometer measures the velocity at the center of the mirror. (c) Fourier analysis of the velocity measurement.
The experiment may be repeated for a set of bias voltages and harmonic amplitudes (), generating two sets of redundant equations
which can be solved for and in the mean-squares sense.
The foregoing procedure has been applied to the test structure of Figure 7b. It consists of a spherical reflector of 100 mm diameter with a radius of curvature of 2.5 m; the PET substrate has a thickness of 175 m and it is covered by a spin-coated layer of 5 m of PVDF-TrFE with seven independent Aluminum electrodes. The harmonic voltage excitation is applied to the central electrode and the velocity at the center of the reflector is measured; 34 independent experiments have been considered in this study, with electric field components spanning : 1–25 MV/m and : 2–16 MV/m; they are reported in Table 1.

Table 1.
Response amplitude measurements at harmonic frequencies ( at 20 Hz and at 40 Hz).
The least squares solution of Equation (12) leads to and leading to C/m (to be compared with the value C/m obtained above). The least squares solution of Equation (13) leads to .
It is interesting to observe that, although the dielectric constant and the electric fields and are sensitive to errors on the active layer thickness t, the spontaneous polarization estimate, Equation (9), is not, because , and , so that and , so that .
5. Direct Measurement of the Poling Strain
According to our electrostrictive model, Equation (2), the in-plane poling strain (along axis 1) is
Using the previous results, one gets
Alternatively, a direct measurement of the poling strain has been performed on a thin film of 4 m deposited on a square glass substrate of 70 mm side and 100 m thickness. The electrodes cover a square of 45 mm side in the center and the surface figure is monitored in a central circular pupil of 35 mm (Figure 8) with Phase-Shifting Schlieren (PSS) wavefront sensor NIMO RE 2507 [].
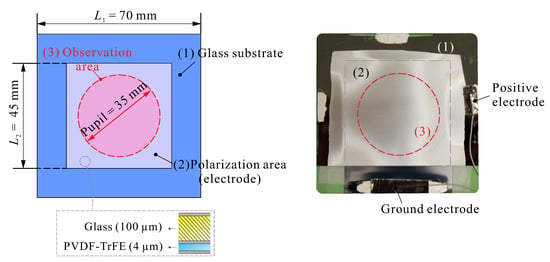
Figure 8.
Glass sample used to estimate the poling strain of the PVDF-TrFE. The electrodes cover a square geometry in the center and the surface figure is monitored in a central circular pupil of 35 mm.
Since only the central part of the sample is covered by active material, Stoney’s formula cannot be used to relate the strain induced by the polarization to the curvature of the glass sample. Instead, the system is modelled by finite elements. Figure 9 shows the relationship between the average curvature in the central pupil and the misfit strain induced in the electrostrictive layer (the two curves correspond to linear and nonlinear FE calculations, both obtained with SAMCEF).
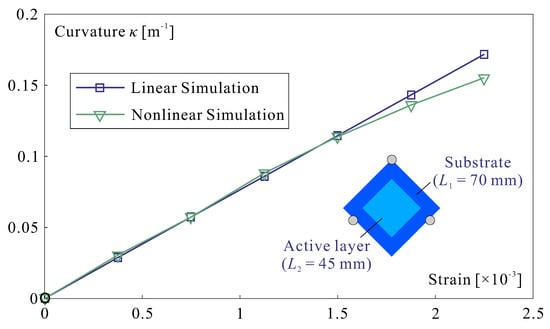
Figure 9.
Relationship between the average curvature in the central pupil of 35 mm diameter and the misfit strain induced in the electrostrictive layer.
Figure 10 shows the experimental time history of the poling process. The upper curve shows the voltage history; the poling voltage of 250 V (electric field: 62.5 MV/m) is reached after 50 min, maintained during 200 min and then reduced to 0 in 5 min. The lower figure shows the relative surface figure deformation within the pupil when the full voltage is applied and then released. W is the deflection at the center of the glass plate and is the curvature. The residual curvature is estimated by averaging various cross sections of the deformed shape, leading to m. Returning to Figure 9, this corresponds to a misfit (poling) strain of which can be compared to the theoretical value of above.
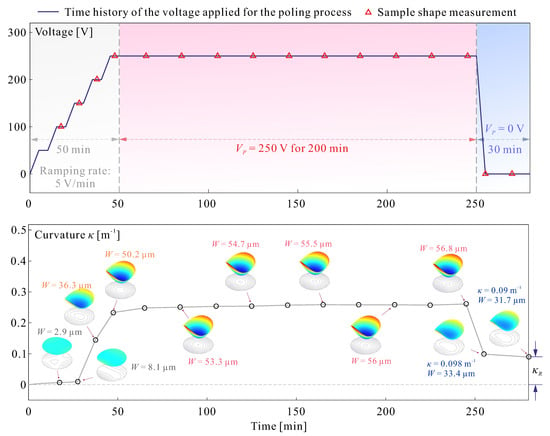
Figure 10.
Time-history of the poling process of the sample of Figure 8. (Top): voltage history. (Bottom): relative surface figure deformation within the pupil (deflection W and curvature ). The final curvature residual estimate is m.
6. Initial Shape—Inverse Problem
Since a poling strain is quite significant (it corresponds to an electric field of MV/m with a piezoelectric coefficient pC/N), it must be accounted for in the reflector design. Thus we must solve the inverse problem: what is the reflector shape before poling in order to achieve the final target shape after poling? This problem can be solved iteratively as indicated in Figure 11; the poling strain is easily simulated in FE codes with artificial thermal strains. Figure 12 illustrates the solution for a reflector currently under study with a diameter 200 mm, radius of curvature m, thickness of PET substrate m and active PVDF-TrFE layer of m. The upper figure shows the original shape (before poling) and the final spherical one after poling; the bottom figure shows the shape deformation due to the poling strain. The convergence is very quick, after three iterations if the error tolerance is set to 1 nm.
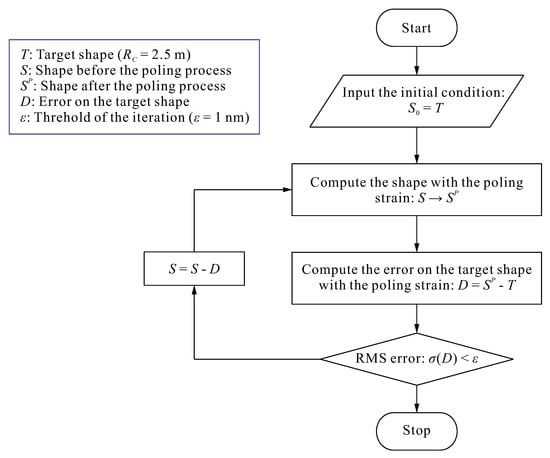
Figure 11.
Flowchart of the iteration algorithm for solving the inverse problem to reconstruct the initial shape before poling.
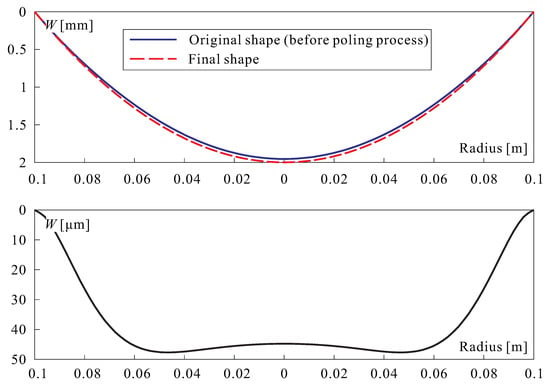
Figure 12.
(Top): Original shape before poling and final shape. (Bottom): Shape deformation due to the poling strain.
7. Shape Control Experiment
The metrology of curved mirror of large size is a challenging problem and no dedicated instrument was available to us during the course of this project (the Phase-Shifting Schlieren wavefront sensor NIMO RE 2507 system used above for estimating the poling strain is limited in aperture and curvature). In order to measure the control amplitude, we have used an indirect method based on laser Doppler vibrometry which is classically used for dynamic measurements and modal analysis. The idea is as follows: if the structure is excited harmonically at a frequency much below the first mechanical resonance (), it will respond in a quasi-static manner and the deformed shape will follow harmonically the static deformation. Here, we have the additional difficulty that, because of the electrostrictive nature of the PVDF-TrFE actuators, the response of the structure is not exactly harmonic; a Fourier analysis of the velocity measurement response is conducted and the amplitude of the velocity is taken as that of the fundamental component at (Figure 7c).
This method has been applied to the test structure with a diameter mm and seven independent electrodes discussed earlier. Figure 13a shows the demonstrator in its support. The electrode layout is that of Figure 13b (all electrical connections are outside the pupil of the mirror). The segmented control electrodes are located between the substrate and the PVDF-TrFE layer in order to minimize the risk of arcing when neighboring electrodes have strongly different voltages (Figure 13c). The manufacturing sequence is as follows: the patterned electrode is deposited on a PET sheet by Pulse DC Magnetron Sputtering (PDCMS) and the substrate is shaped in a spherical mold (under pressure and temperature); then, the PVDF-TrFE layer is spin-coated, and the shell is placed again in the mould for annealing the PVDF-TrFE. Finally, the optical coating and the ground electrode are deposited by PDCMS.
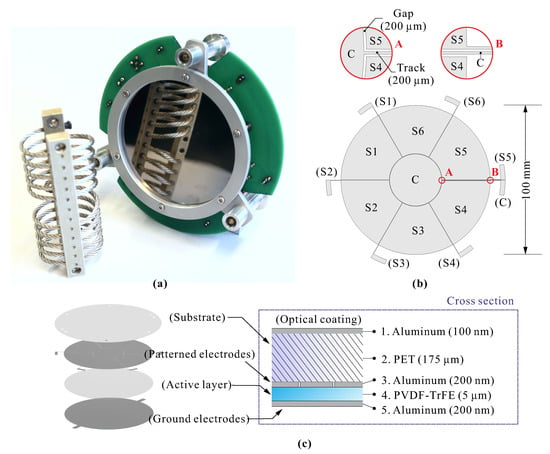
Figure 13.
(a) View of the 7-electrodes demonstrator mounted in its support. (b) Layout of the electrodes and connecting tracks. (c) Layout of the various layers.
The first resonance of the structure is Hz; the harmonic voltage excitation applied to the electrodes has been selected Hz where the dynamic amplification is negligible; the amplitude of the input voltage is 40 V with a bias of 65 V. The scanner vibrometer Polytec PSV-400 is used in the experiment; the experimental set-up is shown in Figure 14, together with the layout of the scanned nodes. Because of the curvature, the reflecting side is covered by a thin layer of scattering powder (Ardrox developer spray) in order to reflect enough light to the scanning head. It has been verified that the results are independent of the excitation frequency provided the condition is satisfied, and that the results are consistent with the NIMO sensor for smaller apertures.
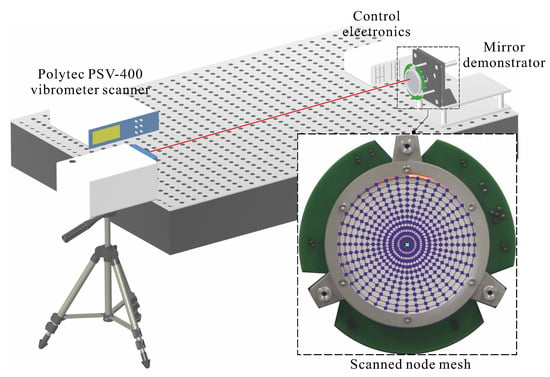
Figure 14.
Experimental set up for the laser Doppler velocimeter measurement. The mesh of the scanned nodes is indicated by the blue dots.
Figure 15 shows a comparison between experiment and simulation of the deformation induced by a voltage of 100 V applied to the control electrode S (obtained by scaling by 2.5 the experiment with input voltage amplitude of 40 V). The numerical results assume a Mindlin piezoelectric shell [,] with pC/N. The results agree qualitatively, but significant differences are observed, as illustrated in the bottom figure showing the displacements along six cross sections similar to that indicated on the figure in the middle of electrode S and after successive rotations by 60°. It results from the symmetry that these displacements should be identical. The numerical simulations are also shown for comparison. This difference is attributed to imperfect initial shape of the demonstrator, not fully symmetrical and not fully spherical (curvature larger in the center than in the periphery). This indicates that the various steps of the manufacturing process are not yet fully stabilized.
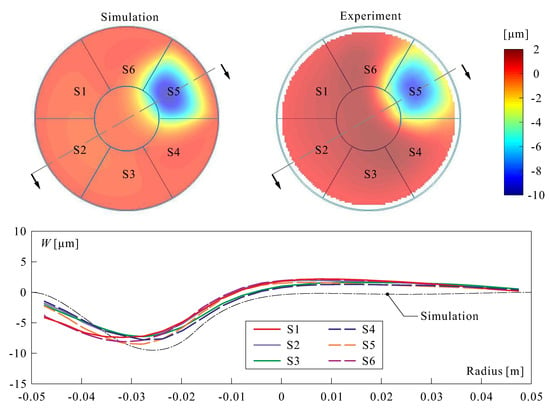
Figure 15.
(Top): Comparison between experiment and simulation of the deformation induced by a voltage of 100 V being applied to electrode S. (Bottom): Displacements along the 6 cross sections rotated by 60° The dashed line corresponds to the numerical simulation.
8. Conclusions
The paper discusses the actuation of thin polymer doubly curved shell structures with a thin (spin coated) layer of PVDF-TrFE. A simple unidirectional model of electrostrictive material has been considered and the material constants (dielectric constant , electrostrictive constant , piezoelectric constant , spontaneous polarization and poling strain ) have been estimated from various static and dynamic experiments. The results obtained by different methods have been found consistent. The method for determining the spontaneous polarization based on the Fourier analysis of the structural response to a harmonic excitation is believed to be original. The final part of the paper illustrates the control authority on a small demonstrator with seven independent electrodes in keystone configuration; in absence of an appropriate instrument for monitoring the shape of a large curved mirror, a dynamic method based on laser Doppler vibrometry has been used successfully. However, the experimental results indicate that the manufacturing process of the multi-layer spherical shell used in this study needs to be improved to achieve an initial shape of better quality.
Author Contributions
Conceptualization, K.W., T.G., D.R. and A.P.; software, K.W.; validation, K.W., T.G., D.R. and A.P.; writing—original draft preparation, A.P.; writing—review and editing, K.W. and A.P.; supervision, A.P. All authors have read and agreed to the published version of the manuscript.
Funding
This research has been supported by ESA-ESTEC in the framework of the GSTP program, project Multilayer Adaptive Thin Shell Reflectors for Future Space Telescopes (MATS). RFQ 3-14210/14/PA/NL.
Acknowledgments
The authors wish to thank the Technical Officer, Gonçalo Rodrigues for his continuous support, and David Alaluf and Matthieu Michiels for their contribution in the early stage of this project.
Conflicts of Interest
The authors declare no conflict of interest.
Abbreviations
The following abbreviations are used in this manuscript:
| AO | Adaptive Optics |
| ESA | European Space Agency |
| FE | Finite Element |
| FRF | Frequency Response Function |
| JWST | James Webb Space Telescope |
| LIDAR | Light Detection and Ranging |
| PET | Polyethylene terephthalate |
| PVDF-TrFE | Poly(vinylidene fluoride-co-trifluoroethylene) |
| PSS | Phase-Shift Schlieren |
| PZT | Lead Zirconate Titanate |
| RMS | Root mean square |
| ULB | Université Libre de Bruxelles |
| UV | Ultraviolet |
References
- Hedgepeth, J.M. Accuracy potentials for large space antenna reflectors with passive structure. J. Spacecr. Rocket. 1982, 19, 211–217. [Google Scholar] [CrossRef]
- Bekey, I. Advanced Space System Concepts and Technologies: 2010–2030+; American Institute of Aeronautics and Astronautics: Reston, VA, USA, 2003. [Google Scholar]
- Jenkins, C.H. Gossamer Spacecraft: Membrane and Inflatable Structures Technology for Space Applications; American Institute of Aeronautics and Astronautics: Reston, VA, USA, 2001. [Google Scholar]
- Flint, E.; Lindler, J.; Hall, J.; Rankine, C.; Regelbrugge, M. Overview of form stiffened thin film shell characteristic behavior. In Proceedings of the 47th AIAA/ASME/ASCE/AHS/ASC Structures, Structural Dynamics, and Materials Conference, Newport, RI, USA, 1–4 May 2006; p. 1900. [Google Scholar]
- Marker, D.K.; Jenkins, C.H. Surface precision of optical membranes with curvature. Opt. Express 1997, 1, 324–331. [Google Scholar] [CrossRef] [PubMed]
- Flint, E.; Bales, G.; Glaese, R.; Bradford, R. Experimentally characterizing the dynamics of 0.5 m diameter doubly curved shells made from thin films. In Proceedings of the 44th AIAA/ASME/ASCE/AHS/ASC Structures, Structural Dynamics, and Materials Conference, Norfolk, VA, USA, 7–10 April 2003; p. 1831. [Google Scholar]
- Chodimella, S.; Moore, J.; Otto, J.; Fang, H. Design evaluation of a large aperture deployable antenna. In Proceedings of the 47th AIAA/ASME/ASCE/AHS/ASC Structures, Structural Dynamics, and Materials Conference, Newport, RI, USA, 1–4 May 2006; p. 1603. [Google Scholar]
- Haftka, R.T.; Adelman, H.M. An analytical investigation of shape control of large space structures by applied temperatures. AIAA J. 1985, 1, 450–457. [Google Scholar] [CrossRef]
- Fang, H.; Quijano, U.; Bach, V.; Hill, J.; Wang, K.W. Experimental study of a membrane antenna surface adaptive control system. In Proceedings of the 52nd AIAA/ASME/ASCE/AHS/ASC Structures, Structural Dynamics and Materials Conference, Denver, CO, USA, 4–7 April 2011; p. 1828. [Google Scholar]
- Wang, K.; Alaluf, D.; Preumont, A. Thermal balance and active damping of a piezoelectric deformable mirror for adaptive optics. Actuators 2019, 8, 75. [Google Scholar] [CrossRef]
- Preumont, A.; Alaluf, D.; Wang, K.; Rodrigues, G. Adaptive thin shell reflectors for future space telescopes. In Proceedings of the 14th European Conference on Spacecraft Structures, Materials and Environmental Testing (ECSSMET), Toulouse, France, 27–30 September 2016. [Google Scholar]
- Wang, K. Piezoelectric Adaptive Mirrors for Ground-Based and Space Telescopes. Ph.D. Thesis, Active Structures Laboratory, Université Libre de Bruxelles, Brussels, Belgium, 2001. [Google Scholar]
- Preumont, A. Vibration Control of Active Structures, an Introduction, 4th ed.; Springer International Publishing: Cham, Switzerland, 2018. [Google Scholar]
- Wang, K.; Alaluf, D.; Rodrigues, G.; Preumont, A. Precision shape control of ultra thin shells with strain actuators. J. Appl. Comput. Mech. 2020, in press. [Google Scholar]
- Damjanovic, D. Ferroelectric, dielectric and piezoelectric properties of ferroelectric thin films and ceramics. Rep. Prog. Phys. 1998, 61, 1267. [Google Scholar] [CrossRef]
- Li, F.; Jin, L.; Xu, Z.; Zhang, S. Electrostrictive effect in ferroelectrics: An alternative approach to improve piezoelectricity. Appl. Phys. Rev. 2014, 1, 011103. [Google Scholar] [CrossRef]
- Piefort, V.; Loix, N.; Preumont, A. Modeling of piezolaminated composite shells for vibration control. In Proceedings of the ESA Conference on Spacecraft Structures, Materials and Mechanical Testing, Braunschweig, Germany, 4–6 November 1998. [Google Scholar]
- Piefort, V. Finite Element Modeling of Piezoelectric Active Structures. Ph.D. Thesis, Actives Structures Laboratory, Université Libre de Bruxelles, Brussels, Belgium, 2001. [Google Scholar]
- Joannes, L.; Dubois, F.; Legros, J.-C. Phase-Shifting Schlieren: High resolution quantitative Schlieren that uses the phase-shifting technique principle. Appl. Opt. 2003, 42, 5046–5053. [Google Scholar] [CrossRef] [PubMed]
© 2020 by the authors. Licensee MDPI, Basel, Switzerland. This article is an open access article distributed under the terms and conditions of the Creative Commons Attribution (CC BY) license (http://creativecommons.org/licenses/by/4.0/).