Article

Robust H Control of STMDs Used in Structural Systems by Hardware in the Loop Simulation Method

Department of Mechanical Engineering, Yildiz Technical University, Besiktas 34349, Istanbul, Turkey
*
Author to whom correspondence should be addressed.
Actuators 2020, 9(3), 55; https://doi.org/10.3390/act9030055
Submission received: 22 June 2020 / Revised: 14 July 2020 / Accepted: 17 July 2020 / Published: 20 July 2020

Abstract

:
This paper investigated the performance of a semi-active tuned mass damper (STMD) on a multi-degree of freedom (MDOF) building model. A magnetorheological (MR) damper was used as a control element that provided semi-activity in the STMD. The Hardware in the Loop Simulation (HILS) method was applied to mitigate the difficulty and expense of experimental studies, as well as to obtain more realistic results from numerical simulations. In the implementation of this method for the STMD, the MR damper was set up experimentally, other parts of the system were modeled as computer simulations, and studies were carried out by operating these two parts simultaneously. System performance was investigated by excitation with two different acceleration inputs produced from the natural frequencies of the MDOF building. Additionally, a robust H controller was designed to determine the voltage transmitted to the MR damper. The results showed that the HILS method could be applied successfully to STMDs used in structural systems, and robust H controls improve system responses with semi-active control applications. Moreover, the control performance of the MR damper develops with an increase in the mass of the STMD.

1. Introduction

Given that structures are vulnerable to external factors such as earthquakes and hurricanes, structural vibration control is essential and necessary. For systems where many control applications are made, the tuned mass damper (TMD) is among the most frequently used control applications. TMDs, initially applied to ships by Frahm [1], were later studied by Ormondroyd and Den Hartog in the SDOF structure [2]. Since the proposal of the optimal design formula by Den Hartog in 1956 [3], many studies have been carried out. TMDs consist of a mass with damping and stiffness elements designed according to the critical frequency of the structure [4]. In structural systems, in order to obtain the best performance from TMDs, many active and semi-active control methods have been applied besides optimum design methods.
Several linear [5,6,7] and non-linear [8,9] controls have been implemented for active control of TMDs in the literature. Active control applications show high performance in suppressing structural vibrations. However, the equipment costs and continuous energy requirements of this control application create difficulties in its implementation. The performance of TMDs in passive operation is limited. Within TMDs, semi-active control methods not only perform better than passive control methods but are also safer than the application of active control methods. In this study, the vibration suppression capability of the STMD was investigated in an MDOF building model. MR dampers were used as the damping element, providing semi-activity of the STMD. MR dampers are semi-active control elements with many advantages such as large force capacity, low power consumption, low cost, and mechanical simplicity.
In the literature, various simulation studies have been performed in STMDs, including with MR dampers; causal sub-optimal control schemes [10]; clipped optimal control [11]; LQR control [12]; sky-groundhook control with optimal fuzzy control [13]; multiple-input multiple-output (MIMO) fuzzy logic control (FLC) [14]; Type 1 and 2 fuzzy logic control [15]; and Bang-Bang control [16]. In addition to numerical simulation studies, performances of STMDs have been investigated experimentally using different control methods, such as forward feed control [17], groundhook control [18], and LQR control [19]. Both simulation studies and experimental studies have advantages and disadvantages. In numerical simulation studies, it is easy to execute a performance analysis of structural systems. However, mathematical simulation studies conducted under ideal conditions do not include problems that may occur in real systems such as external disturbances and measurement noise. For these reasons, they may not wholly reflect the truth [20]. Although matching experimental studies with real systems is essential, the installation and operation of experimental systems are often challenging and problematic. However, in recent years Hardware In the Loop Simulation (HILS) or Real-Time Hybrid Simulation (RTHS) methods, which combine both simulation and experimental studies, have been used. These methods consist of two parts—the numerical and the experimental—and they allow for data to be obtained experimentally, as well as to be used in real-time numerical simulation. The experimental part consists of system elements that are difficult to model. The data obtained from the experimental part is used in the simulation study. The HILS method has been studied in many systems, such as structural systems [21] and vehicles [20].
In this study, the performance analysis of STMDs used for structural systems was carried out using the advantages of the HILS method, without the need to establish a purely experimental system. Active control or semi-active control application is performed by adding an actuator to TMDs. For active control applications, these actuators can be servo motors that convert the control force into the motion of the TMD. It can be an MR damper for semi-active control applications. Given the disadvantages of active control applications such as high costs, security problems, and installation costs, MR damper is used in this study. The control element MR damper, which is critical for the system and provides semi-activity of STMD, was set up experimentally, and the other parts of the system were modeled as computer simulations, and the system responses were analyzed by running these two parts simultaneously. The H control theory can be expertly designed to suppress structural system responses [22,23,24,25]. It can also efficiently improve system responses in active mass dampers [24]. As seen in the literature, robust H control application for STMDs has not been studied. MR dampers are semi-active control elements that generate force according to the transmitted voltage. Therefore, the robust H control is designed to determine the voltage transmitted to the MR damper.
Contributions of this study: First, the study demonstrates the applicability of the HILS method for the STMDs used in structural vibration control. Here, the MR damper is used as the semi-active control element of the STMD. Second, the study determined the voltage transmitted to the MR damper, which constitutes the experimental part of the HILS method, with the robust H control method.

2. Materials and Methods

2.1. Motion Equations of Building Models

Figure 1 shows the application of TMD schematically to the structural system. The physical application of TMD to the structural system was as follows: On the floor where TMD is placed, the mass is attached to the bearings that allow lateral movement. Springs and dampers are placed between the vertical support elements that transmit the lateral force to the structural frame and the mass of the TMD [4]. In this study, two control cases in a ten-story building structure were investigated, as shown in Figure 1. For all control cases, only lateral vibrations of the structure were considered. The passive control and semi-active control cases examined are listed below.
Case A: Passive control of the tuned mass damper (TMD).
Case B: Semi-Active control of the tuned mass damper (STMD).
The motion equations of the building models shown in Figure 1 can be given as
M s x ¨ ( t ) + C s x ˙ ( t ) + K s x ( t ) = H s f ( t ) M s L x ¨ g
where f(t) is the damping force of the MR damper and M s , C s   and K s 11 x 11 are the mass, damping, and stiffness matrices, respectively. x ¨ ( t ) , x ˙ ( t ) ,   x ( t )   11 x 1 are the acceleration, velocity, and displacement vectors, respectively. x ¨ g represents the excitation ground acceleration. Unidirectional horizontal movement is considered in this model.
The displacement vector for each of the two models is
x = [ x 1 x 2 x 3 x 4 x 5 x 6 x 7 x 8 x 9 x 10 x 11 ] T
Here, x i represents the i th floor displacements and x 11 represents the displacements of TMD and STMD. The seismic input vector is
L = [ 1 1 1 1 1 1 1 1 1 1 1 ] T
The H s vector, which indicates the placement of the control units in the system, is
H s = [ 0 0 0 0 0 0 0 0 0 1 1 ] T

2.2. Robust Control Design

If a system is unstable, the controller is designed to ensure stability. At the same time, this is done to minimize effects such as controller distortion signals, noise effect, unmodeled system dynamics, and system parameter variations. With feedback control, these design mechanisms can be realized [26]. In this study, a robust control design based on the reduced-order model (ROM) was applied to the full-order model (FOM).

2.2.1. Defining the System and Model Reduction

In structural systems such as multi-story buildings and bridges, low-frequency modes contribute to vibrations to a higher degree than high-frequency modes. For this reason, control of low-frequency modes is significant in reducing vibration amplitudes [27]. Therefore, the control design was made, considering the first two modes of the structural system. The FOM physical coordinates of the modeled structural system can be written as follows:
x ˙ f = A f x f + B f u
y f = C f x f
where A f , B f , C f and D f are the linear system matrices in the state-space form given, respectively, by
A f = [ 0 I M f 1 K f M f 1 C f ] ,   B f = [ 0 M f 1 F f ] ,   C f = [ C y 0 ]
Here, the C y vector represents the locations of the measurements and is defined as
C y = [ 0 0 0 0 0 0 0 0 0 1 0 ]
The system matrix can be designed as
P f ( s ) = [ A f B f C f 0 ]
For model reduction, the system must be converted from physical space to modal space. The transition from physical space to modal space can be accomplished using the following operator:
η = [ η 1 η 2 η 3 η 4 η 5 η 6 η 7 η 8 η 9 η 10 η 11 ] T
The expression of the system in modal space using the transformation vector in Equation (10) is as follows :
η ¨ + C f η ˙ + K f η = H f f
where Φ is defined as the modal transformation vector and x = Φ η , Φ T M f Φ = I , x ¨ g = 0 . The matrices C f , K f ve H f are defined, respectively, as
C f = Φ T C s Φ = diag [ c 11 , c 22 , , c ii , , c 1010 , c 1111 ]
K f = Φ T K s Φ = diag [ ω 1 , ω 2 , , ω i , , ω 11 ] ,   ( ω 1 < ω 2 < < ω 11 )
H f = Φ T H s = [ H 1 , H 2 , , H i , , H 11 ] T
The ROM system is created using the first two modes of the FOM system and is defined as follows:
η ¨ r + C r η ˙ r + K r η r = H r f
where,   η r = [ η 1 η 2 ] T , C r = [ c 11 , c 22 ] , K r = [ ω 1 2 , ω 2 2 ] and H r = [ H 1 , H 2 ] T .
The state-space equation in the reduced form, including x = Φ 12 η r , is as follows:
x ˙ r = A r x r + B r u
y r = C r x r
In the final step, when the ROM is recycled into physical space for the control design, it is expressed as follows:
P r = [ A r B r C r 0 ] ,   A r = [ 0 I K r C r ] ,   B r = [ 0 H r ] ,   C r = [ Φ y 0 ] ,   Φ y = C r Φ 12

2.2.2. Control Design

Real control systems contain uncertainties that fall into one of two categories: noise signals or dynamic disturbance effects. Dynamic disturbance effects are the differences between the mathematical model and the real system dynamics [22]. In addition to modeling errors that affect the performance and stability of the control system, high-frequency dynamics that cannot be modeled in the systems are also critical problems. The source of the uncertainty in this study is the non-structural uncertainty due to the reduced model. The study aims to eliminate the adverse effects on the system response of uncertainties caused by high frequencies that are not taken into account. The uncertainties expressed in this way are non-structural and can be collected in a single block, such as Δ in the control system. ∆ can be expressed as the additive uncertainty of the system, as an unknown transfer function. Additive uncertainty expressed as the absolute error between the nominal model (reduced model) P r ( s ) and real system dynamics P f ( s ) , is expressed as follows:
Δ t ( s ) = P f ( s ) P r ( s )
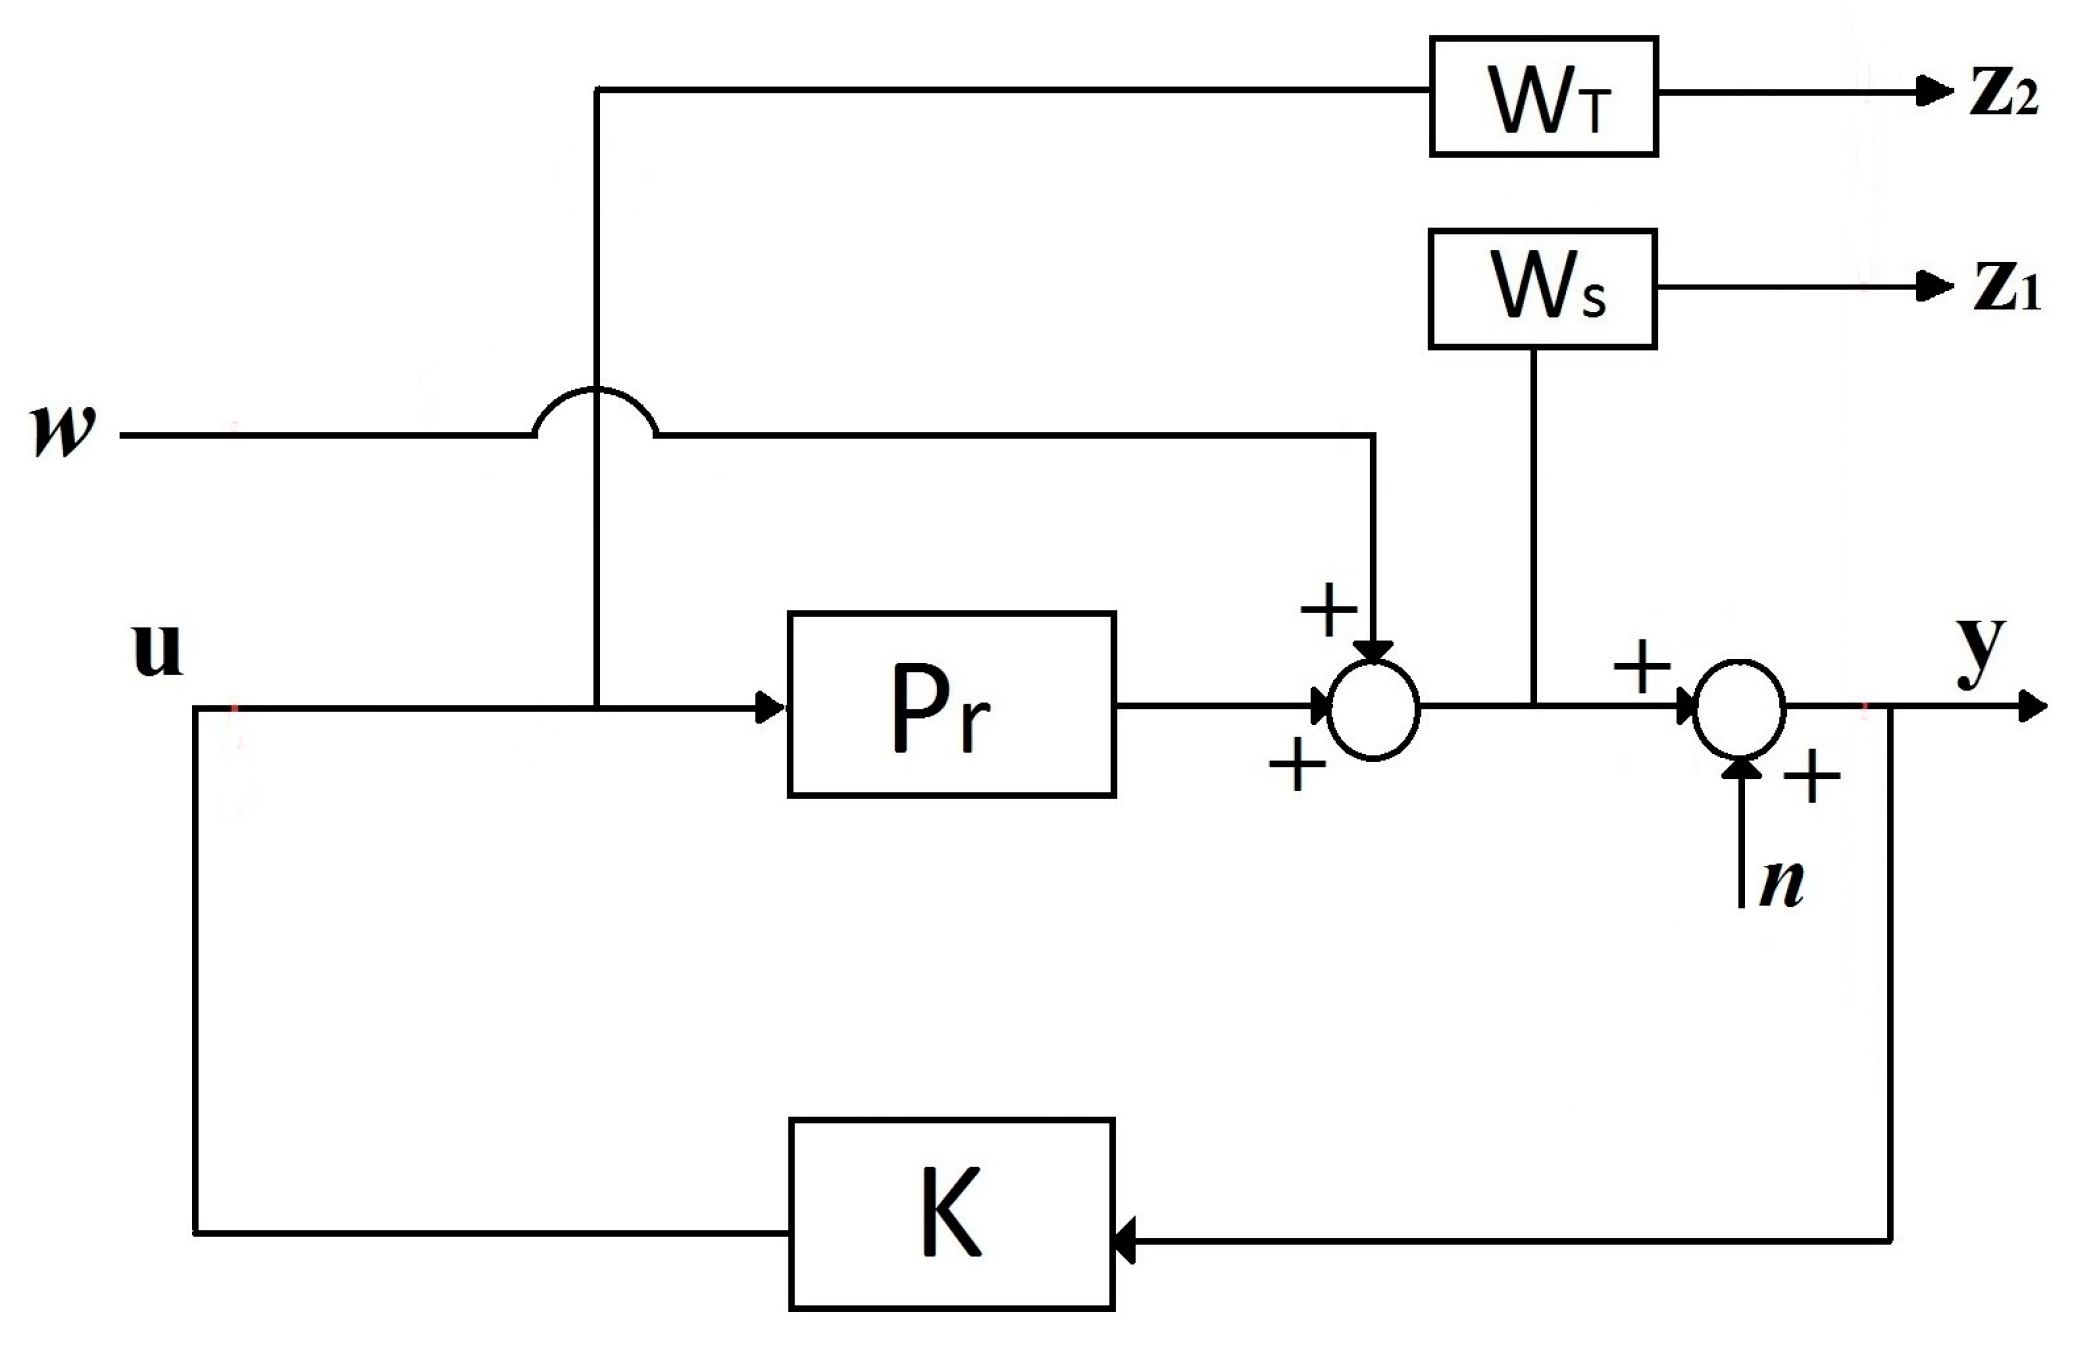
Figure 2 shows the augmented system structure. Here, P r is the reduced-order system, and w is the input excitation. K is the controller that produces a control signal u according to the measured y response. W t and W s filters are the additive uncertainty and system output filters, and the output z 1 and z 2 , is the frequency weighted regulated response and control signal. n is the noise of the measurement.
The primary purpose of the H control design is to safeguard the robustness and stability of the feedback system against uncertainties. By considering the block diagram of the control system in Figure 2, the two essential transfer functions in this control structure are expressed as follows:
S ( s ) = 1 I P r ( s ) K ( s ) ,   T ( s ) = K ( s ) I P r ( s ) K ( s )
T(s) is defined as the complementary sensitivity transfer function. S(s) is defined as the sensitivity transfer function. Assuming that T(s) and Δ t (s) are stable, the feedback system can be robust and stable against all uncertainties in the control system for additive uncertainty.
| Δ t ( j ω ) W t ( j ω ) | ,   ω
Using the W t filter, which satisfies the condition in Equation (21), the norm requirement from w to z 2 can be created as follows:
|| W t T ( s ) || < 1
Another objective in the H control design is to improve the performance of the feedback system. Reducing the effect of the disturbing effect (w) on the output (y) can be achieved by improving the response performance. This problem is to minimize the following statement depending on the stability condition of the closed-loop system.
|| S ( s ) || = sup σ ¯ [ S ( s ) ]
where σ ¯ , is the maximum singular value of S(s).
Using the W s filter, the norm requirement from (w) to z 1   can be created as follows:
|| W s S ( s ) || < 1
In practice, the sensitivity of the control system is higher in the high-frequency range. Therefore, in terms of robust stability, the control gain in the high-frequency region is intended to be low. The problem of fulfilling both conditions at the same time is expressed as a mixed sensitivity problem. This type of H controller is in a mixed sensitivity structure [22].
By considering the block diagrams in Figure 2, the closed-loop transfer function from w to z 1 and z 2 is obtained as follows:
z 1 = W s y ,   z 2 = W t u ,   u = Ky z 1 w = W s ( I + P r K ) 1 = W s S ,   z 2 w = W T K ( I + P r K ) 1 = W T T
Mixed sensitivity for the G zw = [ W s S W T T ] the system is achieved in the form of H = | | [ W s S W T T ] | | .
| | [ W s S W t T ] | | < γ
Here, γ is the design parameter.

2.2.3. Selection of Frequency Shaping Filters and H Control in Solution Mixed Sensitivity Structure

Another critical step in the H   controller design is the selection of frequency shaping filters. As a general rule, the additive uncertainty in the system is used when selecting W T . Filters should cover these uncertainties. Accordingly, the filters are as follows:
W T = k w s 2 + 2 ξ nm ω nm 2 s + ω nm 2 s 2 + 2 ξ dm ω dm 2 s + ω dm 2 ,   W s = constant
In vibration control systems, ω nm is the last mode frequency to be controlled and ω dm   is the first mode frequency at which no control is performed. Damping ratios of mods are similar to frequencies, ξ nm and ξ dm . Essentially, the W s filter is used to reduce control system sensitivity under uncertainty.
After the frequency shaping filter is selected, the augmented system structure is obtained as follows using the control system structure in Figure 2:
x ˙ G ( t ) = Ax G ( t ) + B 1 w ( t ) + B 2 u ( t ) z ( t ) = C 1 x G ( t ) + D 11 w ( t ) + B 12 u ( t ) y ( t ) = C 2 x G ( t ) + D 21 w ( t )
where x G ( t ) n   is the state vector of the augmented system model, w ( t ) m 1 is the exogenous input vector, u ( t ) m 2 is the control input vector, z ( t ) p 1 is the output vector, and y ( t ) p 2 is the measurement vector, with p 1 m 2 and p 2 m 1 . Additionally, the augmented system structure (G) is as follows in matrix form:
G ( s ) = [ A B 1   B 2 C 1 D 11   D 12 C 2 D 21   0 ] = [ A B C D ]
Using the general system structure, the H controller is obtained with the Matlab Robust Control Toolbox, hinfsyn command, and the controller structure is as follows.
x ˙ k ( t ) = A k x k ( t ) + B k y ( t ) u ( t ) = C k x k ( t ) + D k y ( t )
where x k is the state vector of the controller, u is the control signal, y is the output of the generalized plant shown in Equation (27), and A k , B k , C k and D k are real matrices of appropriate dimensions. K(S) may be further denoted as
K ( s ) = [ A k B k C k D k ]

2.3. Application of the Controller to the Semi-Active System

On-off control is the purest form of feedback control. In this control, the performance is low because only the maximum or minimum voltage is transmitted to the MR damper. The continuous-state algorithm allows linear controllers to be applied easily to MR dampers. The linear H control algorithm applied in this study is used to determine the voltage transmitted to the MR damper. The force generated by the H control application is converted into voltage values with the continuous-state algorithm. These voltage values vary between maximum and minimum values.
In the semi-active control system, the voltage transmitted must be changed in order for the MR damper to produce the required force. For this purpose, continuous state function is used as follows [28,29]:
If   G ( f c f d ) sgn ( f d ) > V max ,   v = V max
or   G ( f c f d ) sgn ( f d ) < V min ,   v = V min
otherwise   v = G ( f c f d ) sgn ( f d )
Here, V max and V min represent the maximum and minimum voltage generated in the MR damper, respectively. f c   is the control force required for the system, and it is calculated by the controller. f d is the force generated by the MR damper, and it is measured from the system. G is the MR damper control gain.

3. Results and Discussions

3.1. Performance Analysis and Results with the HILS Method

3.1.1. Introduction of the Experimental Setup

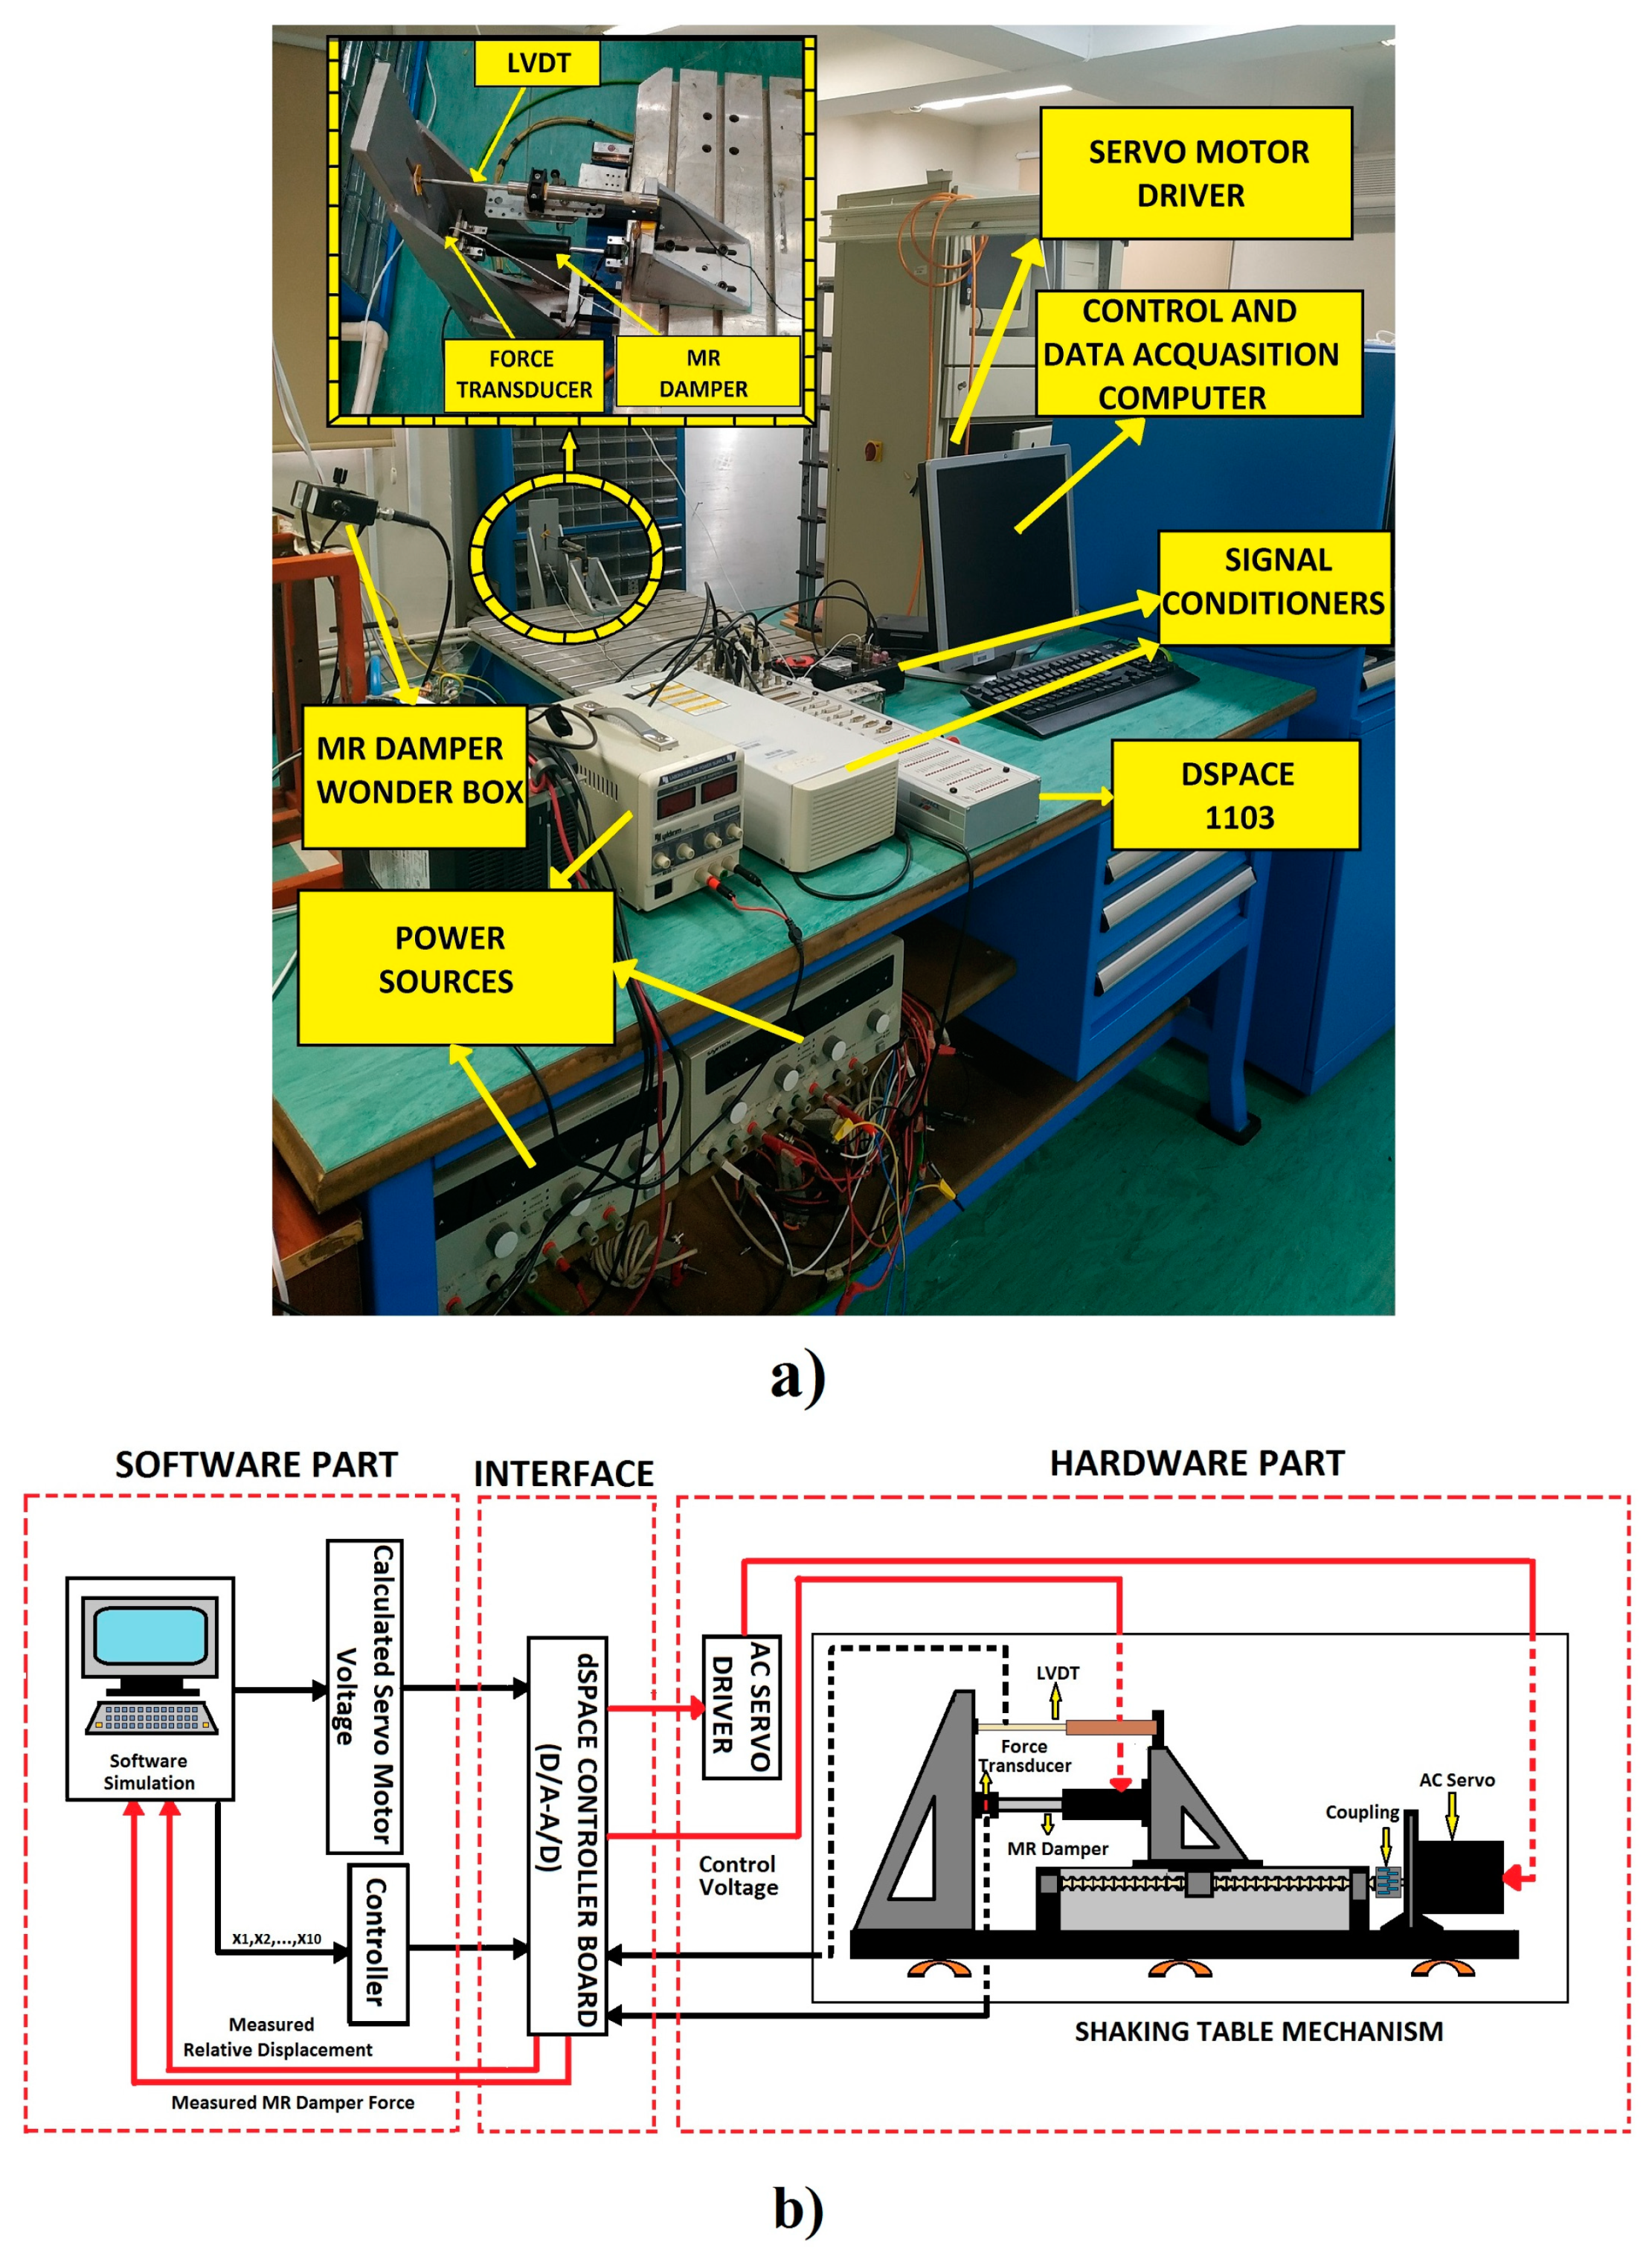
The HILS method consists of two parts—the computer simulation and experimental setup—and the connection between these two parts was made via the dSPACE interface. In the simulation part of the HILS method, the mathematical model of the building and the control algorithms were obtained using MATLAB-Simulink software. The experimental part consisting of the MR damper, sensors, and a computer is shown in Figure 3a. The scheme of the HILS method is shown in Figure 3b. The relative displacement data read from the computer simulation was transmitted to the shaking table movement; the voltage data from the controller was sent to the MR damper, and the resulting force data was transferred to the computer simulation. In this way, the experiment and simulation sections were run simultaneously. In order to test the control performance of the STMD by the HILS method, the shaking table at the Yıldız Vibration Research and Control Laboratory was used. This uniaxial mechanism is electromechanical driven.
Movement of the shaking table mechanism, force values, and relative displacement measurements were carried out via the dSpace ACE Kit 1103 interface. The test setup used a linear variable position sensor (LVDT) for relative displacement measurements, a force sensor for force measurement, and an RD-8041-1 type MR damper to generate the required force for the system. Adjustable power supplies were used for the voltage supply of the force sensor and LVDT. A computer communicated with the dSpace interface for data processing, control, and drive of the shaking table.

3.1.2. Determination of Parameters

The control cases investigated in the ten-story building using the HILS method are shown in Figure 1. For all control cases, only lateral vibrations of the structure were considered.
By knowing the operating conditions of the primary system, the parameters of the TMDs can be determined [7]. Optimum TMD parameters can be found with a harmonic excitation involving the frequencies of the primary system. However, the constant parameters make it difficult for TMD to adapt to changing conditions. In order to improve the system responses of TMDs performance in variable frequency excitations, TMD parameters should be able to change online. Semi-active control applications change parameters online. The damping amount of the MR damper used as a control element in this study varies according to the applied voltages. The adaptation of the TMD system to variable frequency conditions is more accessible with the MR damper. In this study, the optimum parameters of TMD were calculated according to the Warburton approach [30].
Optimum frequency ratio
f opt = 1 μ / 2 ( 1 + μ )
Optimum damping rate
ξ opt = μ ( 1 μ / 4 ) 4 ( 1 + μ ) ( 1 μ / 2 )
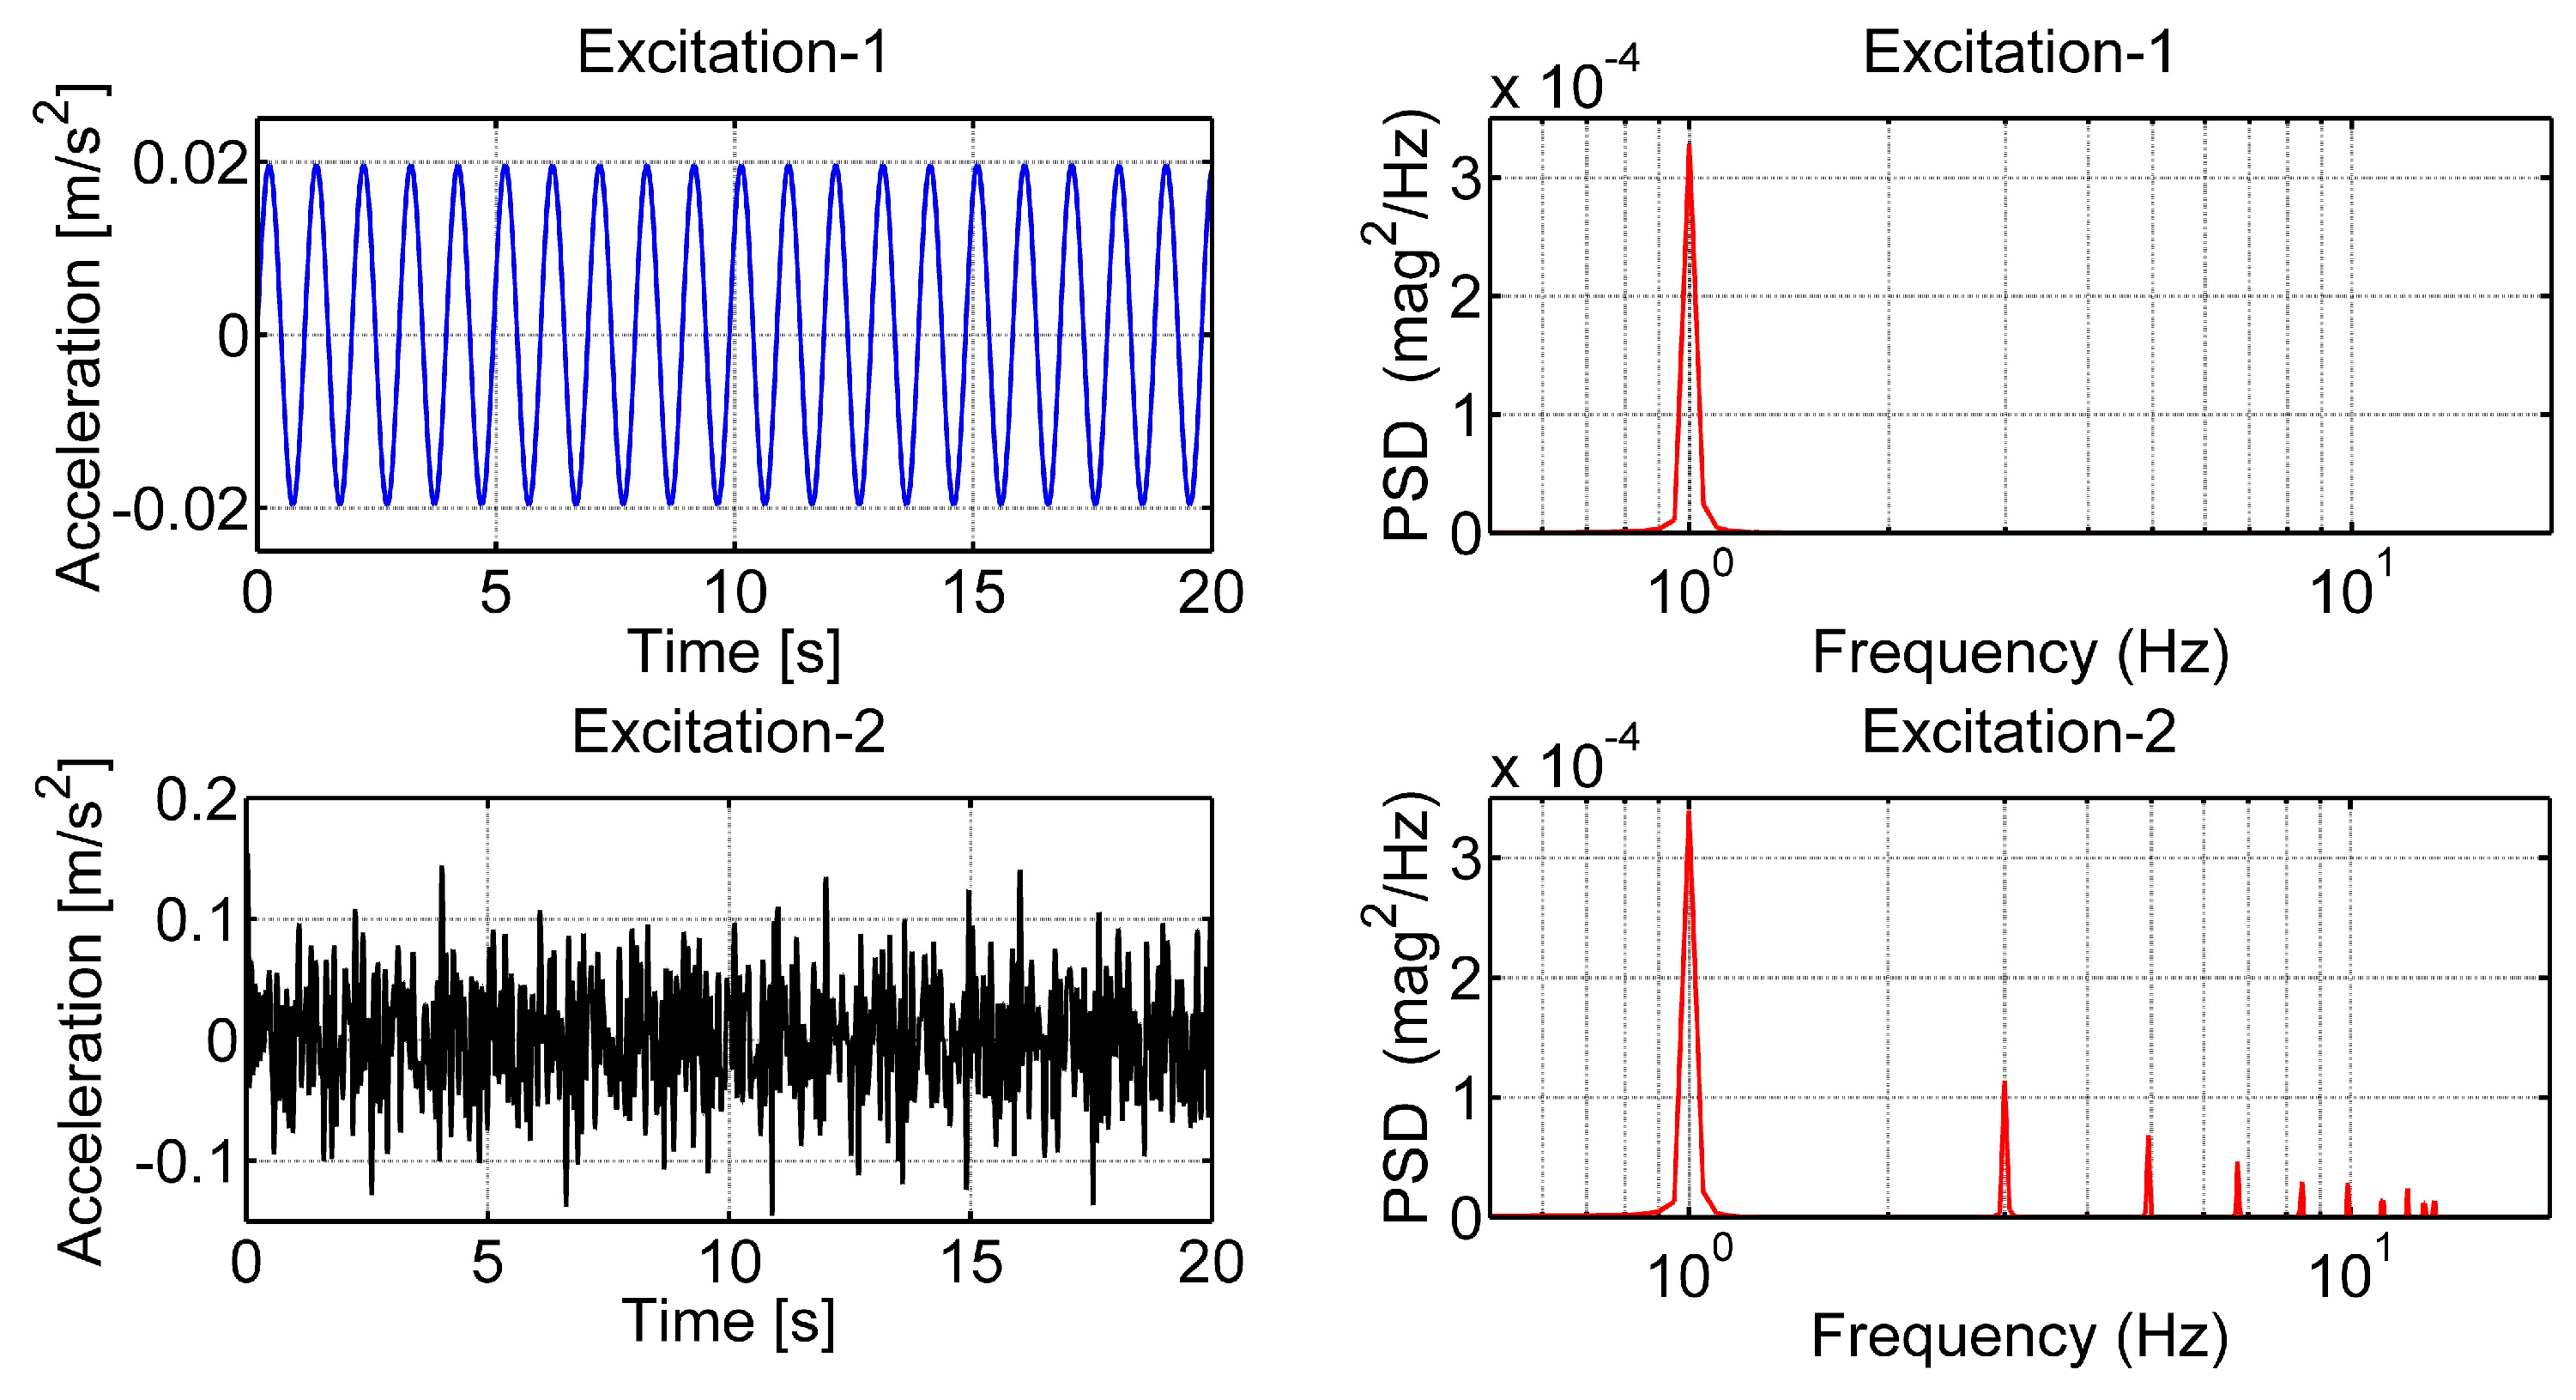
Here μ represents the ratio of the TMD mass to the total mass of the structure. The parameters were obtained by scaling 1/5 of the parameters of a building model with 10 degrees of freedom [31,32]. The model parameters were, m 1 , , 10 = 72   t , k 1 , , 10 = 13 × 10 7   N / m , c 1 , , 10 = 1.24 × 10 6   Ns / m . Natural frequencies (Wn1,…,Wn10), 1.0108, 3.0097, 4.9414, 6.7628, 8.4331, 9.9149, 11.1753, 12.1861, 12.9247, and 13.3745 Hz. respectively. As the excitation forces, two different acceleration excitations were applied for 20 s at an amplitude of 0.02*g m/ s 2 . Here g is the acceleration of gravity.
As shown in Figure 4, system responses were analyzed with excitation (Excitation-1) produced by the frequency of the first mode of the building, and excitation (Excitation-2) produced by the sum of the frequencies containing all the modes of the building. The gain value G for the continuous-state function is displayed in Table 1, where the voltage generated depending on the force produced by the controller was determined. The maximum and minimum voltages to be transmitted to the MR damper for all mass ratios were V max = 10   V and V max = 0 .
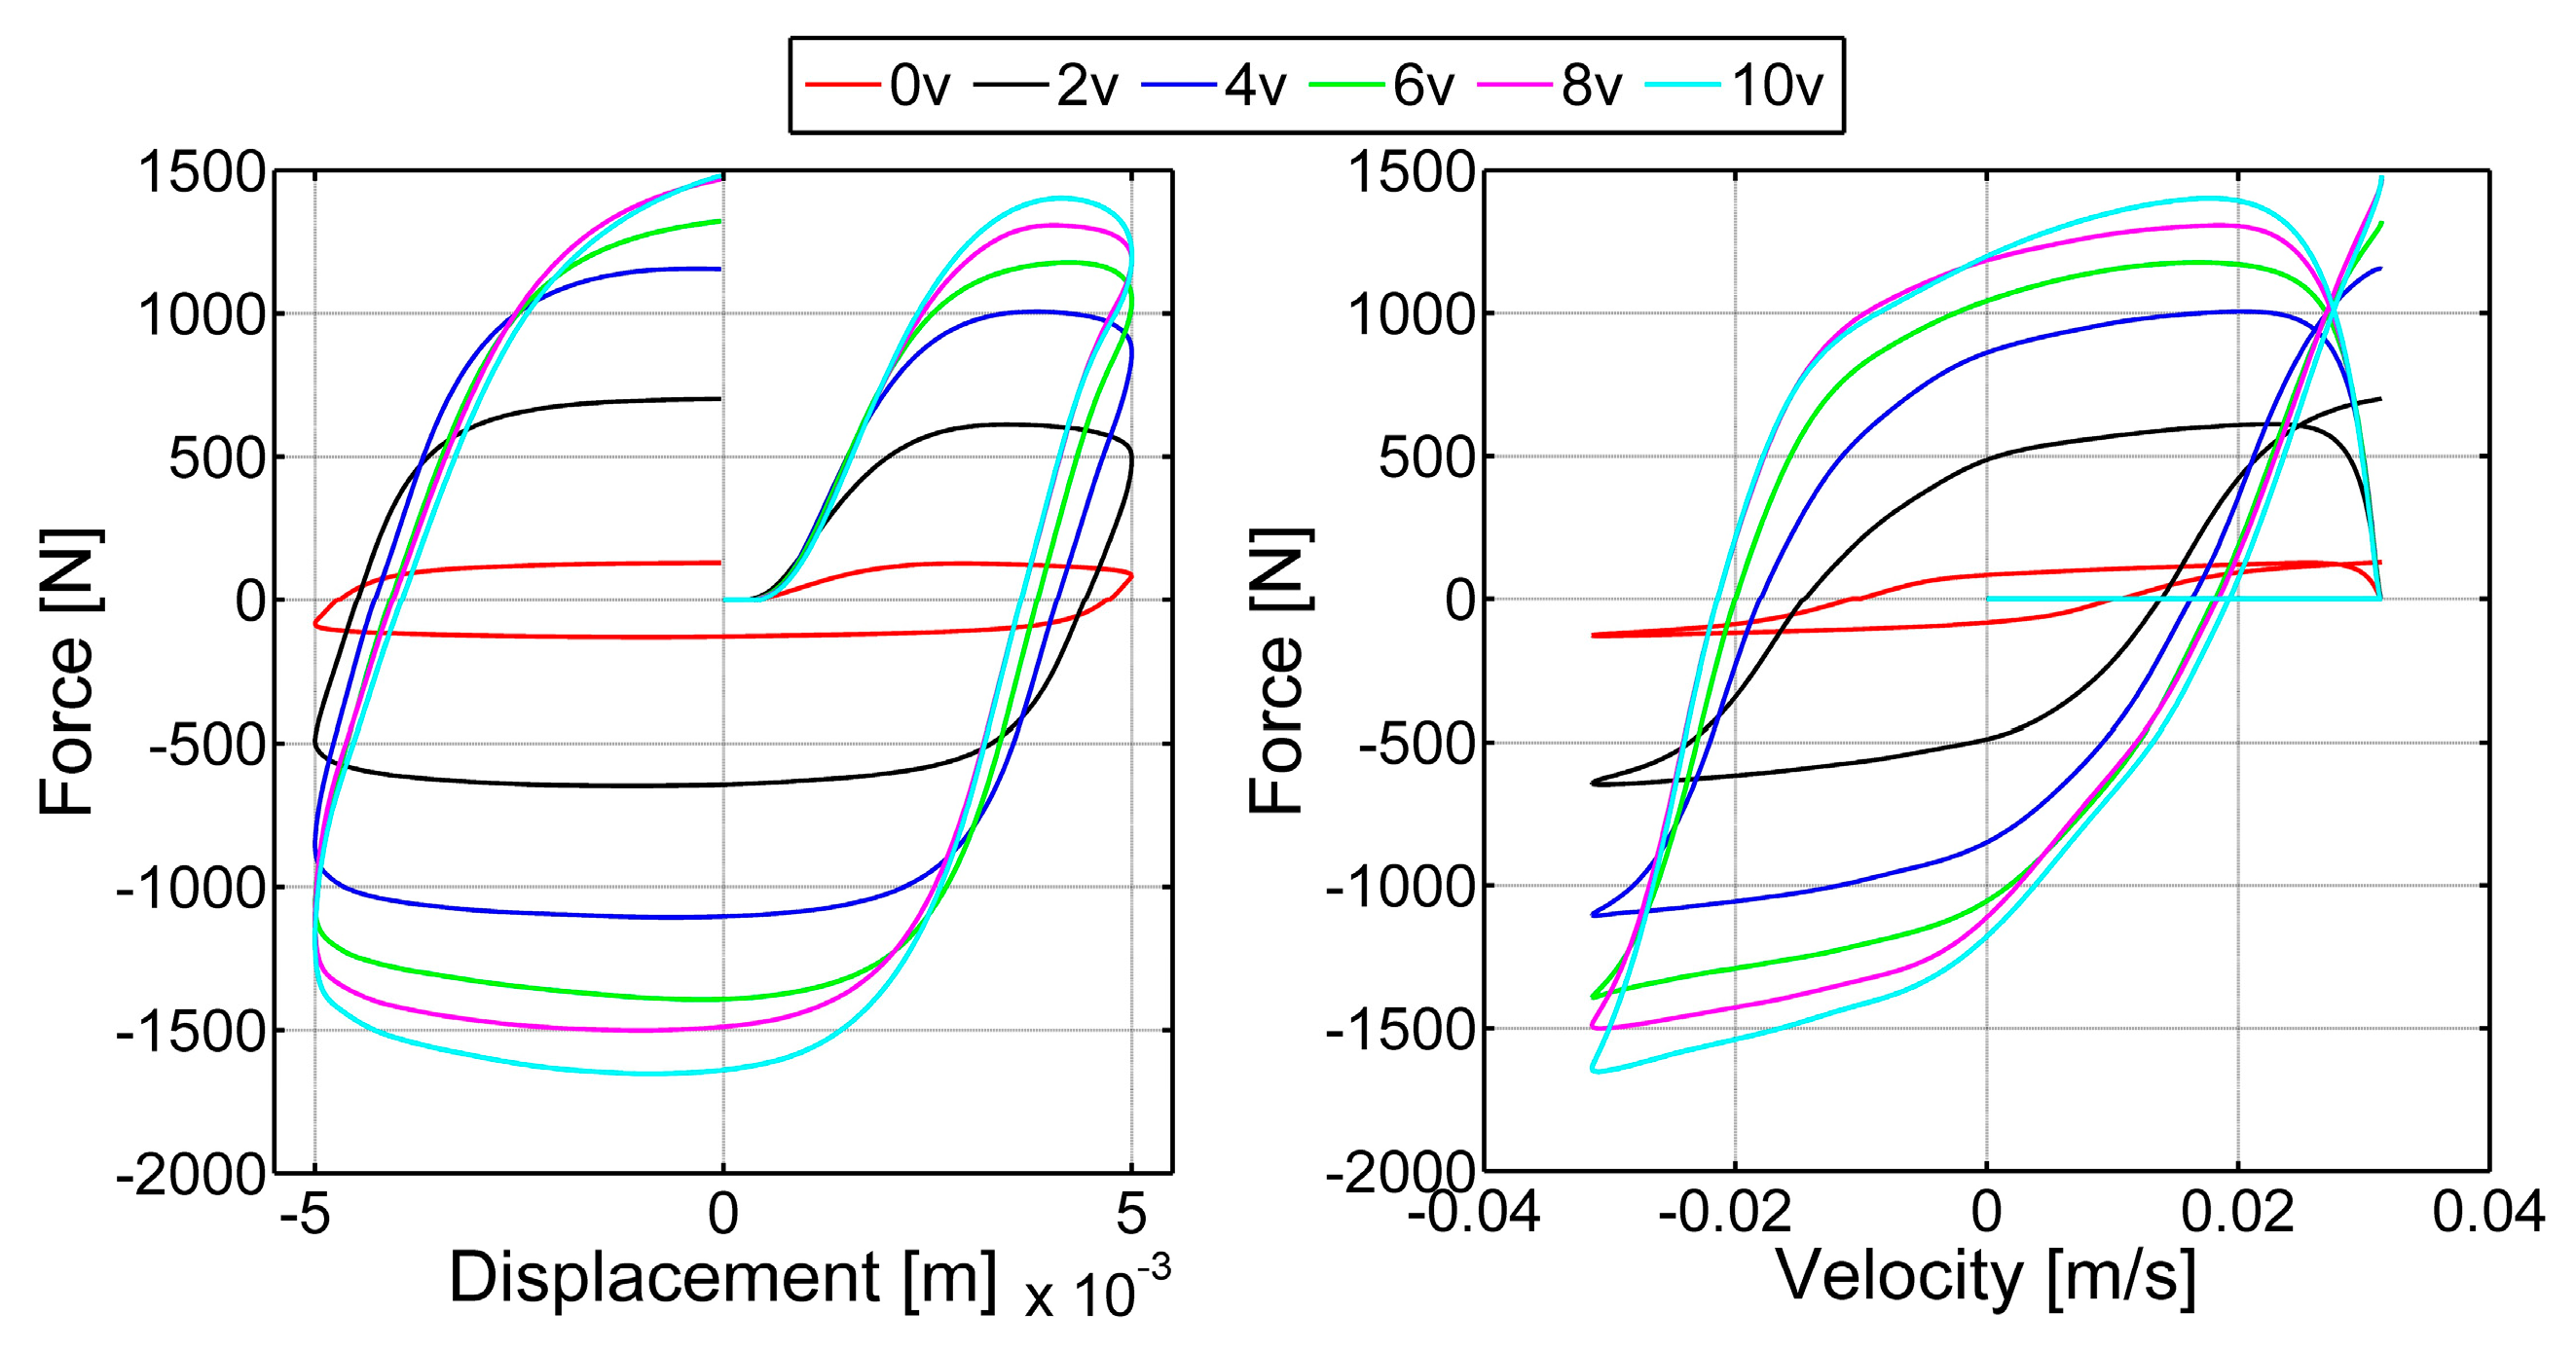
A series of experiments were conducted at the Vibration Research and Control Laboratory of Yıldız Technical University to determine the characteristics of the MR damper under load. For the characteristic of the MR damper, force-displacement and force-velocity curves were investigated. These curves in Figure 5 are obtained by moving the shaking table to which the MR damper is connected, with 1 Hz and 5 mm sinusoidal excitation.
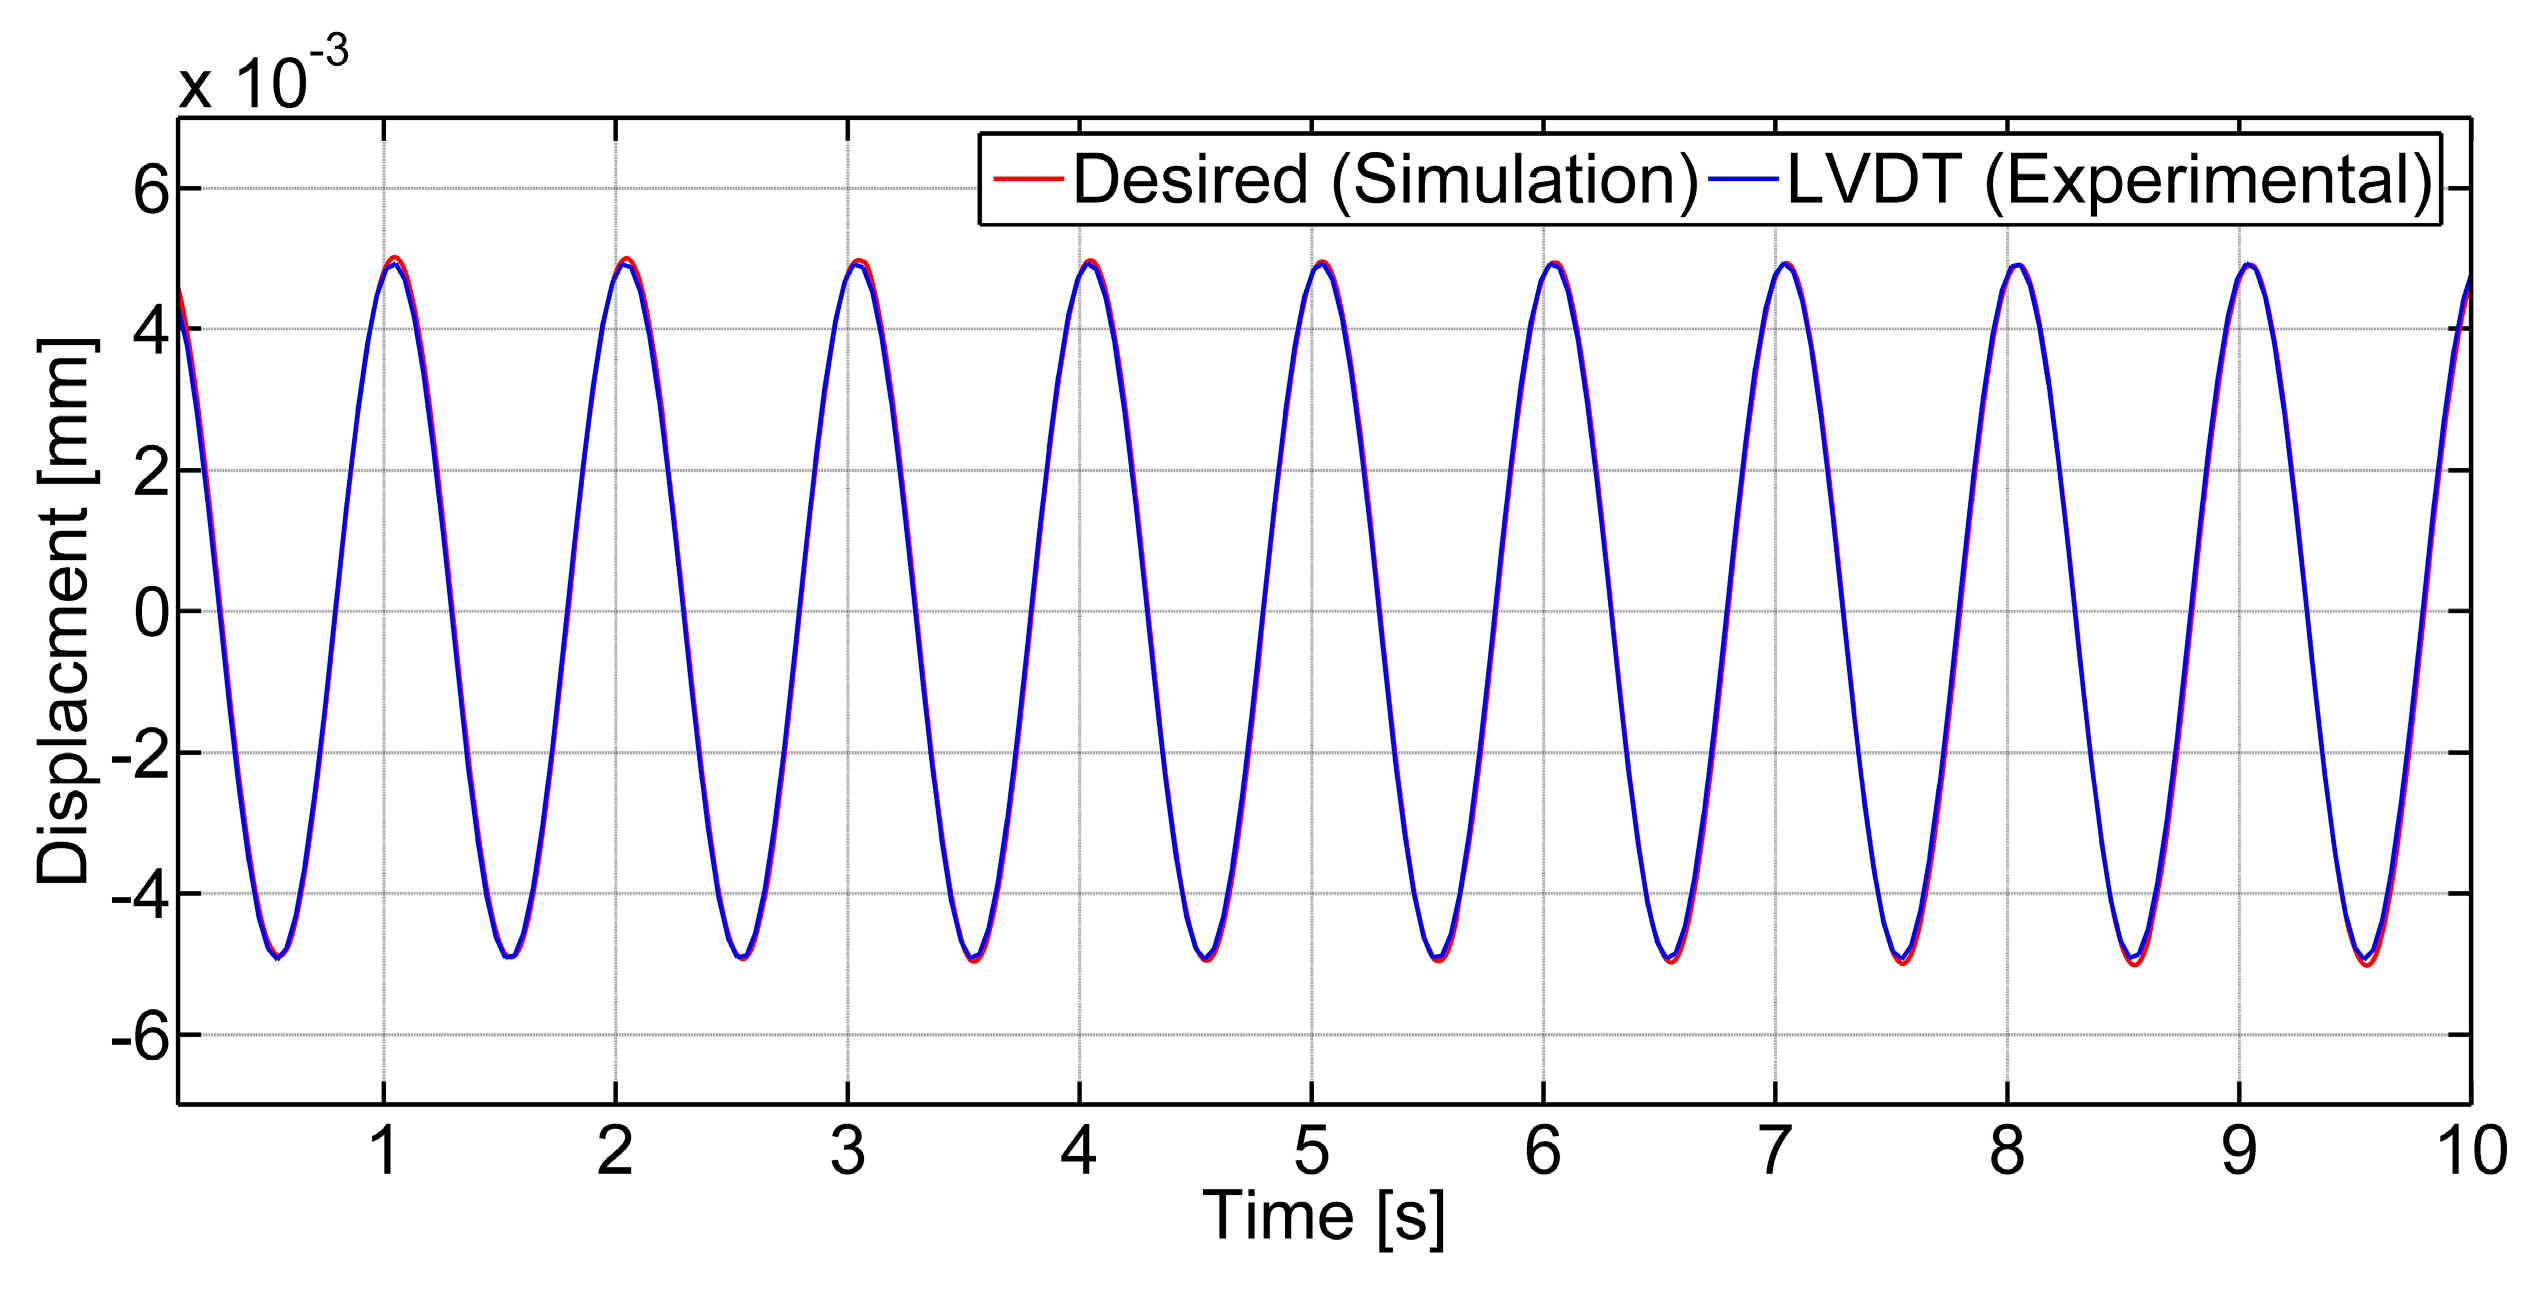
In this study, the relative displacement applied to the experimental system was the displacement between the STMD and the 10th floor. Under the harmonic excitation, it was necessary to check whether the test system was performing the desired relative displacement correctly. For this purpose, 1 Hz and 5 mm sinusoidal input was sent to the experimental system, and the results were compared with the simulation data. Figure 6 shows that the shaking table mechanism can perform the desired movement.

3.2. Application of the Robust H Controller

The robust H control algorithm is designed to command the voltage transmitted to the MR damper used in the model in Figure 1b. The voltage generated with the controller was transmitted to the MR damper connected to the experimental setup, and the force value read from it was fed to the simulation. Different mass ratios were selected for the STMD and the TMD. These ratios are shown in Table 1. The frequencies for the filter design were determined by evaluating the last mode frequency observed in the numerator portion of Equation (26) and the first mode frequency not controlled in the denominator portion. The same process was used to determine damping rates. The main objective was to establish control gain in the frequency domain and to provide robust stability in order to control the first two modes. MATLAB Robust Control Toolbox [2013] was used in H control design.
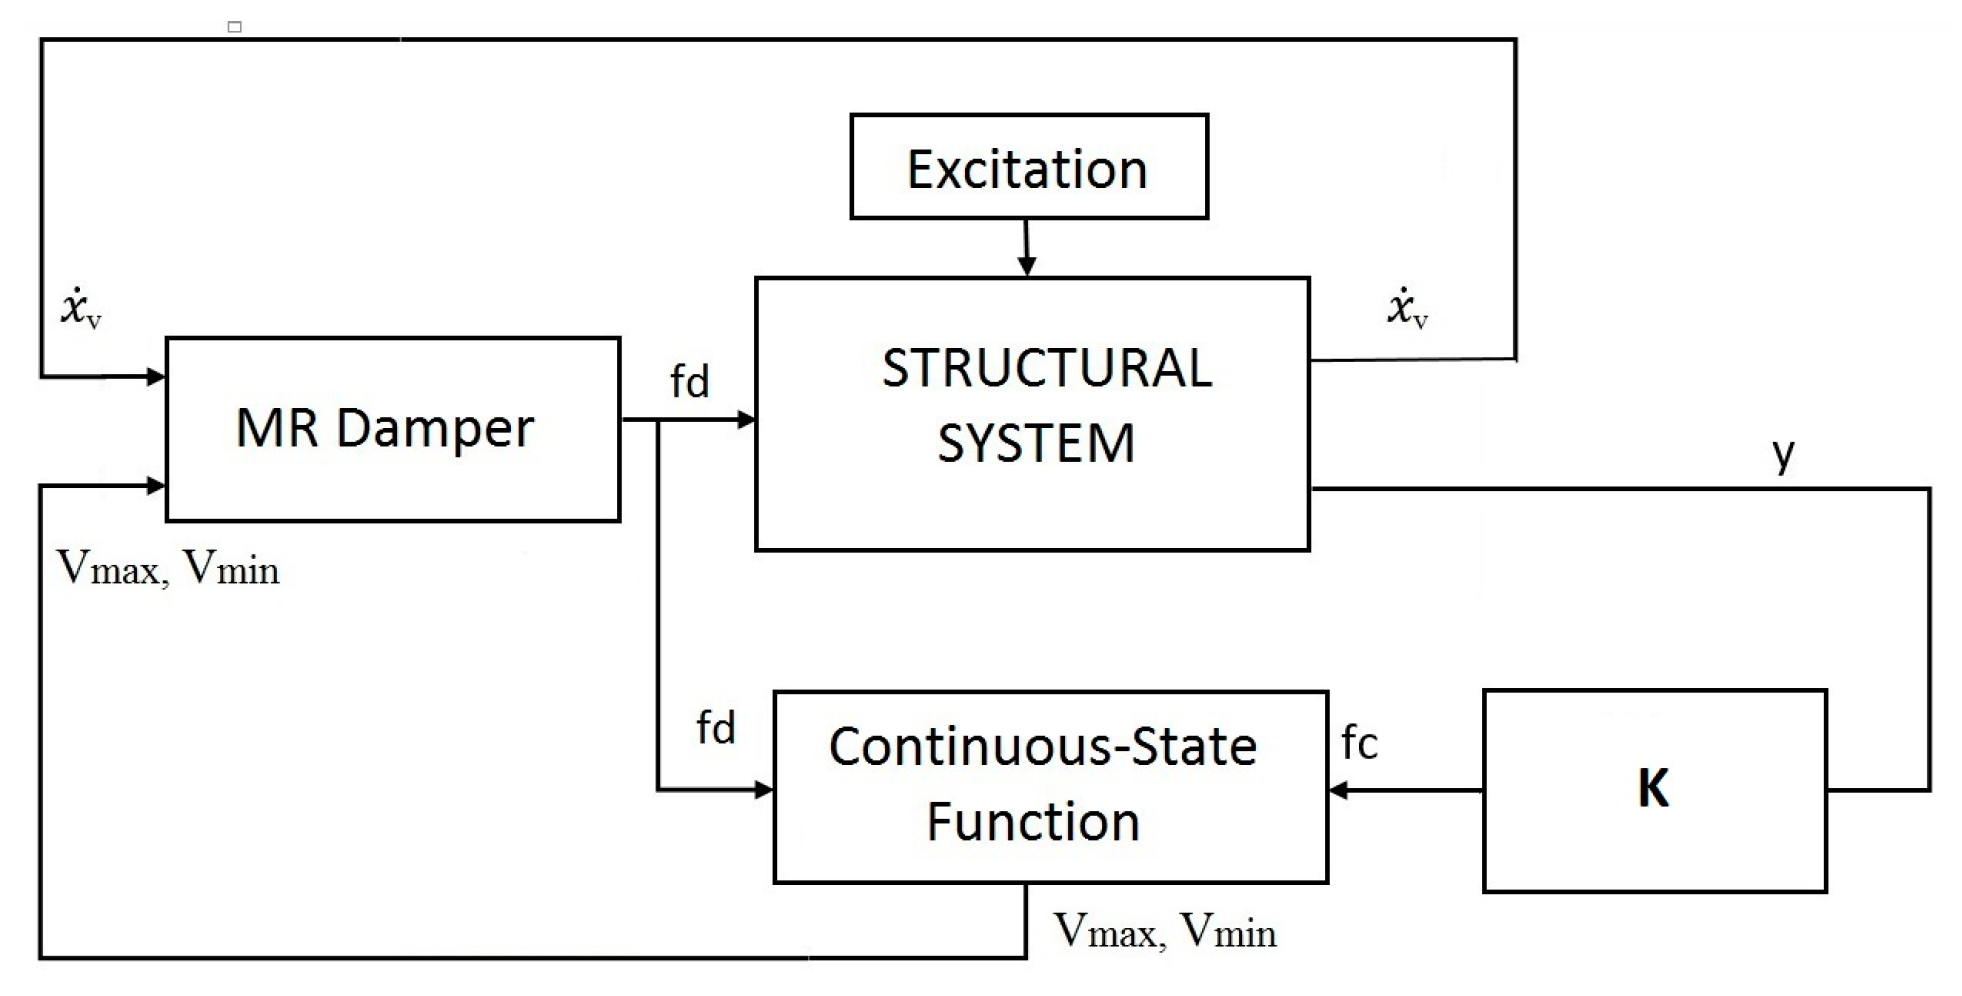
Application of the H   controller to the semi-active system with the continuous-state algorithm is shown in Figure 7. K is the control force ( f c ) produced according to the measured y response. The MR damper force ( f d ) produced according to the measured x ˙ v velocity ( x ˙ v , the velocity of the floor to which the MR damper was connected in the system) from the system was compared to the continuous-state function, and the voltage obtained was transmitted to the MR damper. Then, with this voltage, the force produced by the MR damper was fed into the system, and semi-active control was achieved.

3.2.1. Time Responses

The control cases at all mass ratios in Table 1 were examined in order to evaluate time responses. Data corresponding to Excitation-1 and Excitation-2 cases; time responses of the 10th floor; maximum displacement and maximum acceleration responses of all floors; and RMS displacement and RMS acceleration responses were examined.
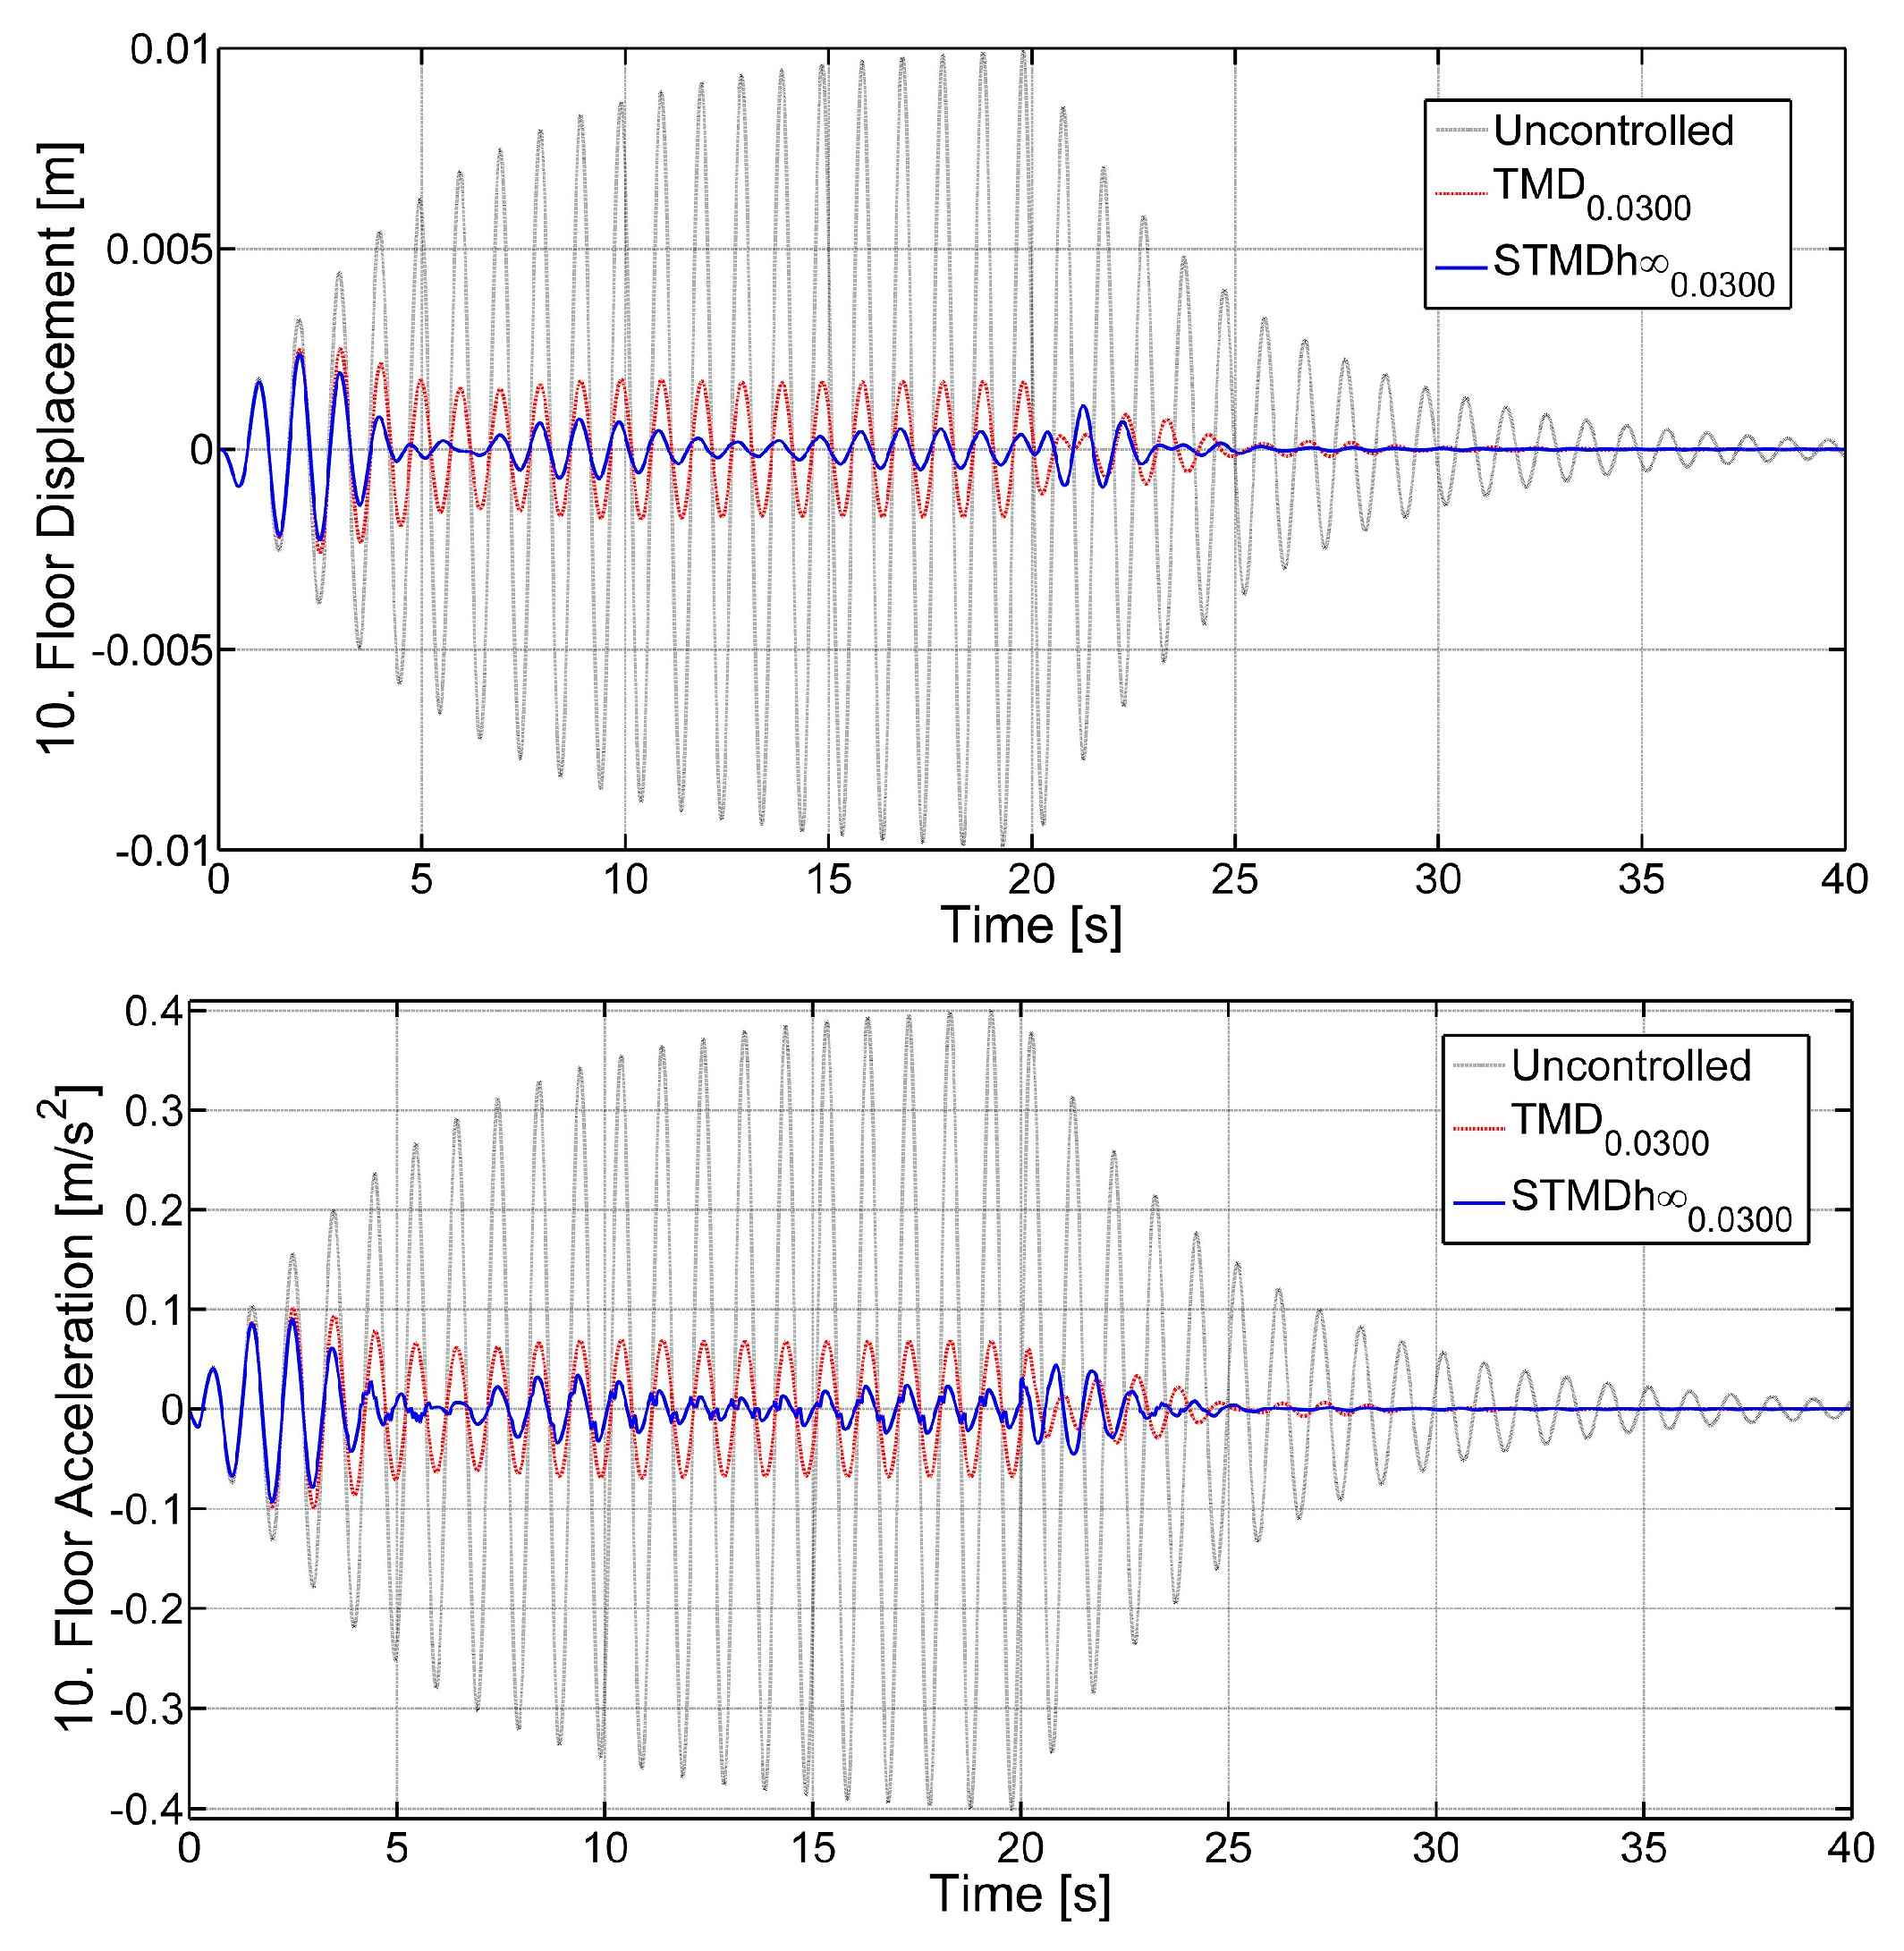
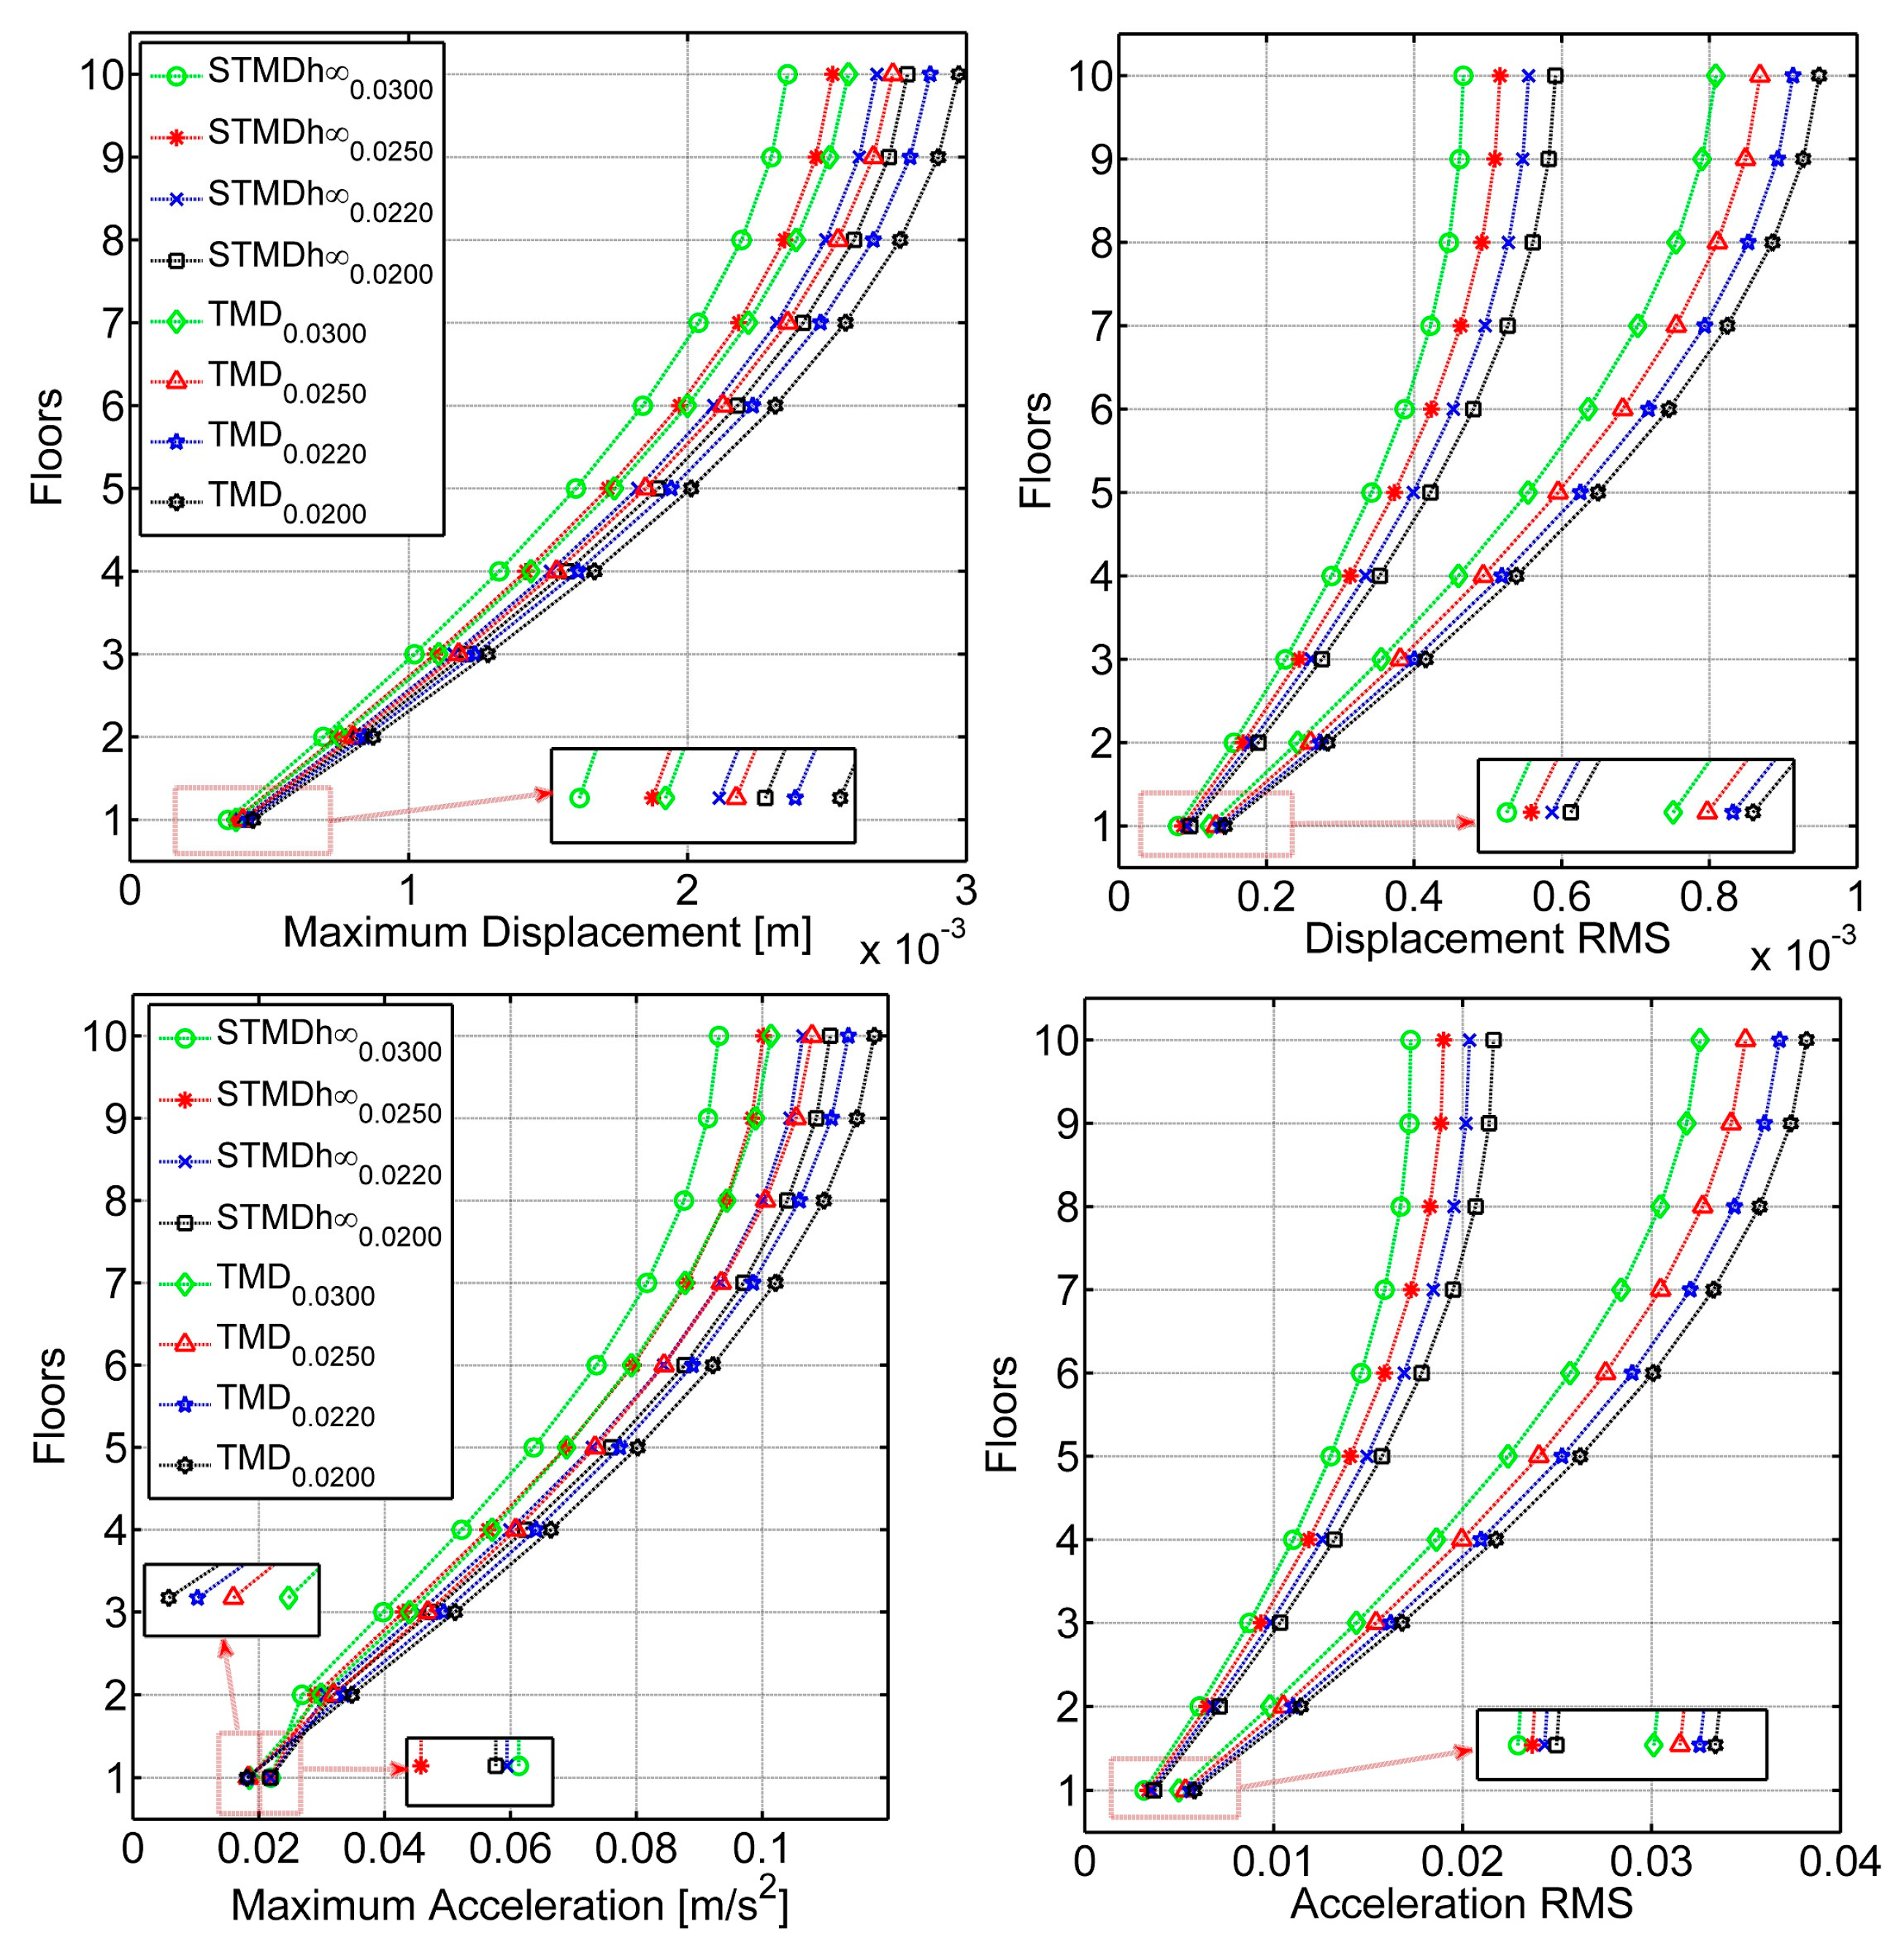
Figure 8 shows the displacement and acceleration of the 10th floor where the performances of the TMD 0.0300 and the STMDh 0.0300 were evaluated. Both control states effectively suppressed structural vibrations. Moreover, the STMDh 0.0300 performed better than the TMD 0.0300 . All cases of the TMD and the STMDh , the maximum displacement and displacement RMS, and maximum acceleration and acceleration RMS values are shown in Figure 9. For the maximum displacement and maximum acceleration responses, the STMDh performed better than the TMD at the same mass ratios. However, it was found that the TMD was more effective than the STMDh at all mass ratios in suppressing the first acceleration maximum acceleration responses. In the displacement RMS and acceleration RMS evaluations, the STMDh performed better than the TMD in all mass ratios.
For the Excitation-2 force, the displacements and accelerations of the 10th floor in the cases the TMD 0.0300 and the STMDh 0.0300 are indicated in Figure 10. The STMDh 0.0300 seems to be more successful in suppressing acceleration and displacement responses than the TMD 0.0300 .
Figure 11 shows the maximum displacement, displacement RMS, maximum acceleration, and acceleration RMS values of all floors of the TMD, and the STMDh control states for all mass ratios. The STMDh performed better than the TMD at the same mass ratio in maximum displacement and maximum acceleration responses as in the Excitation-1 force. However, the first and second floors exhibited nearly the maximum acceleration and acceleration RMS values for all mass ratios of the STMDh and the TMD.
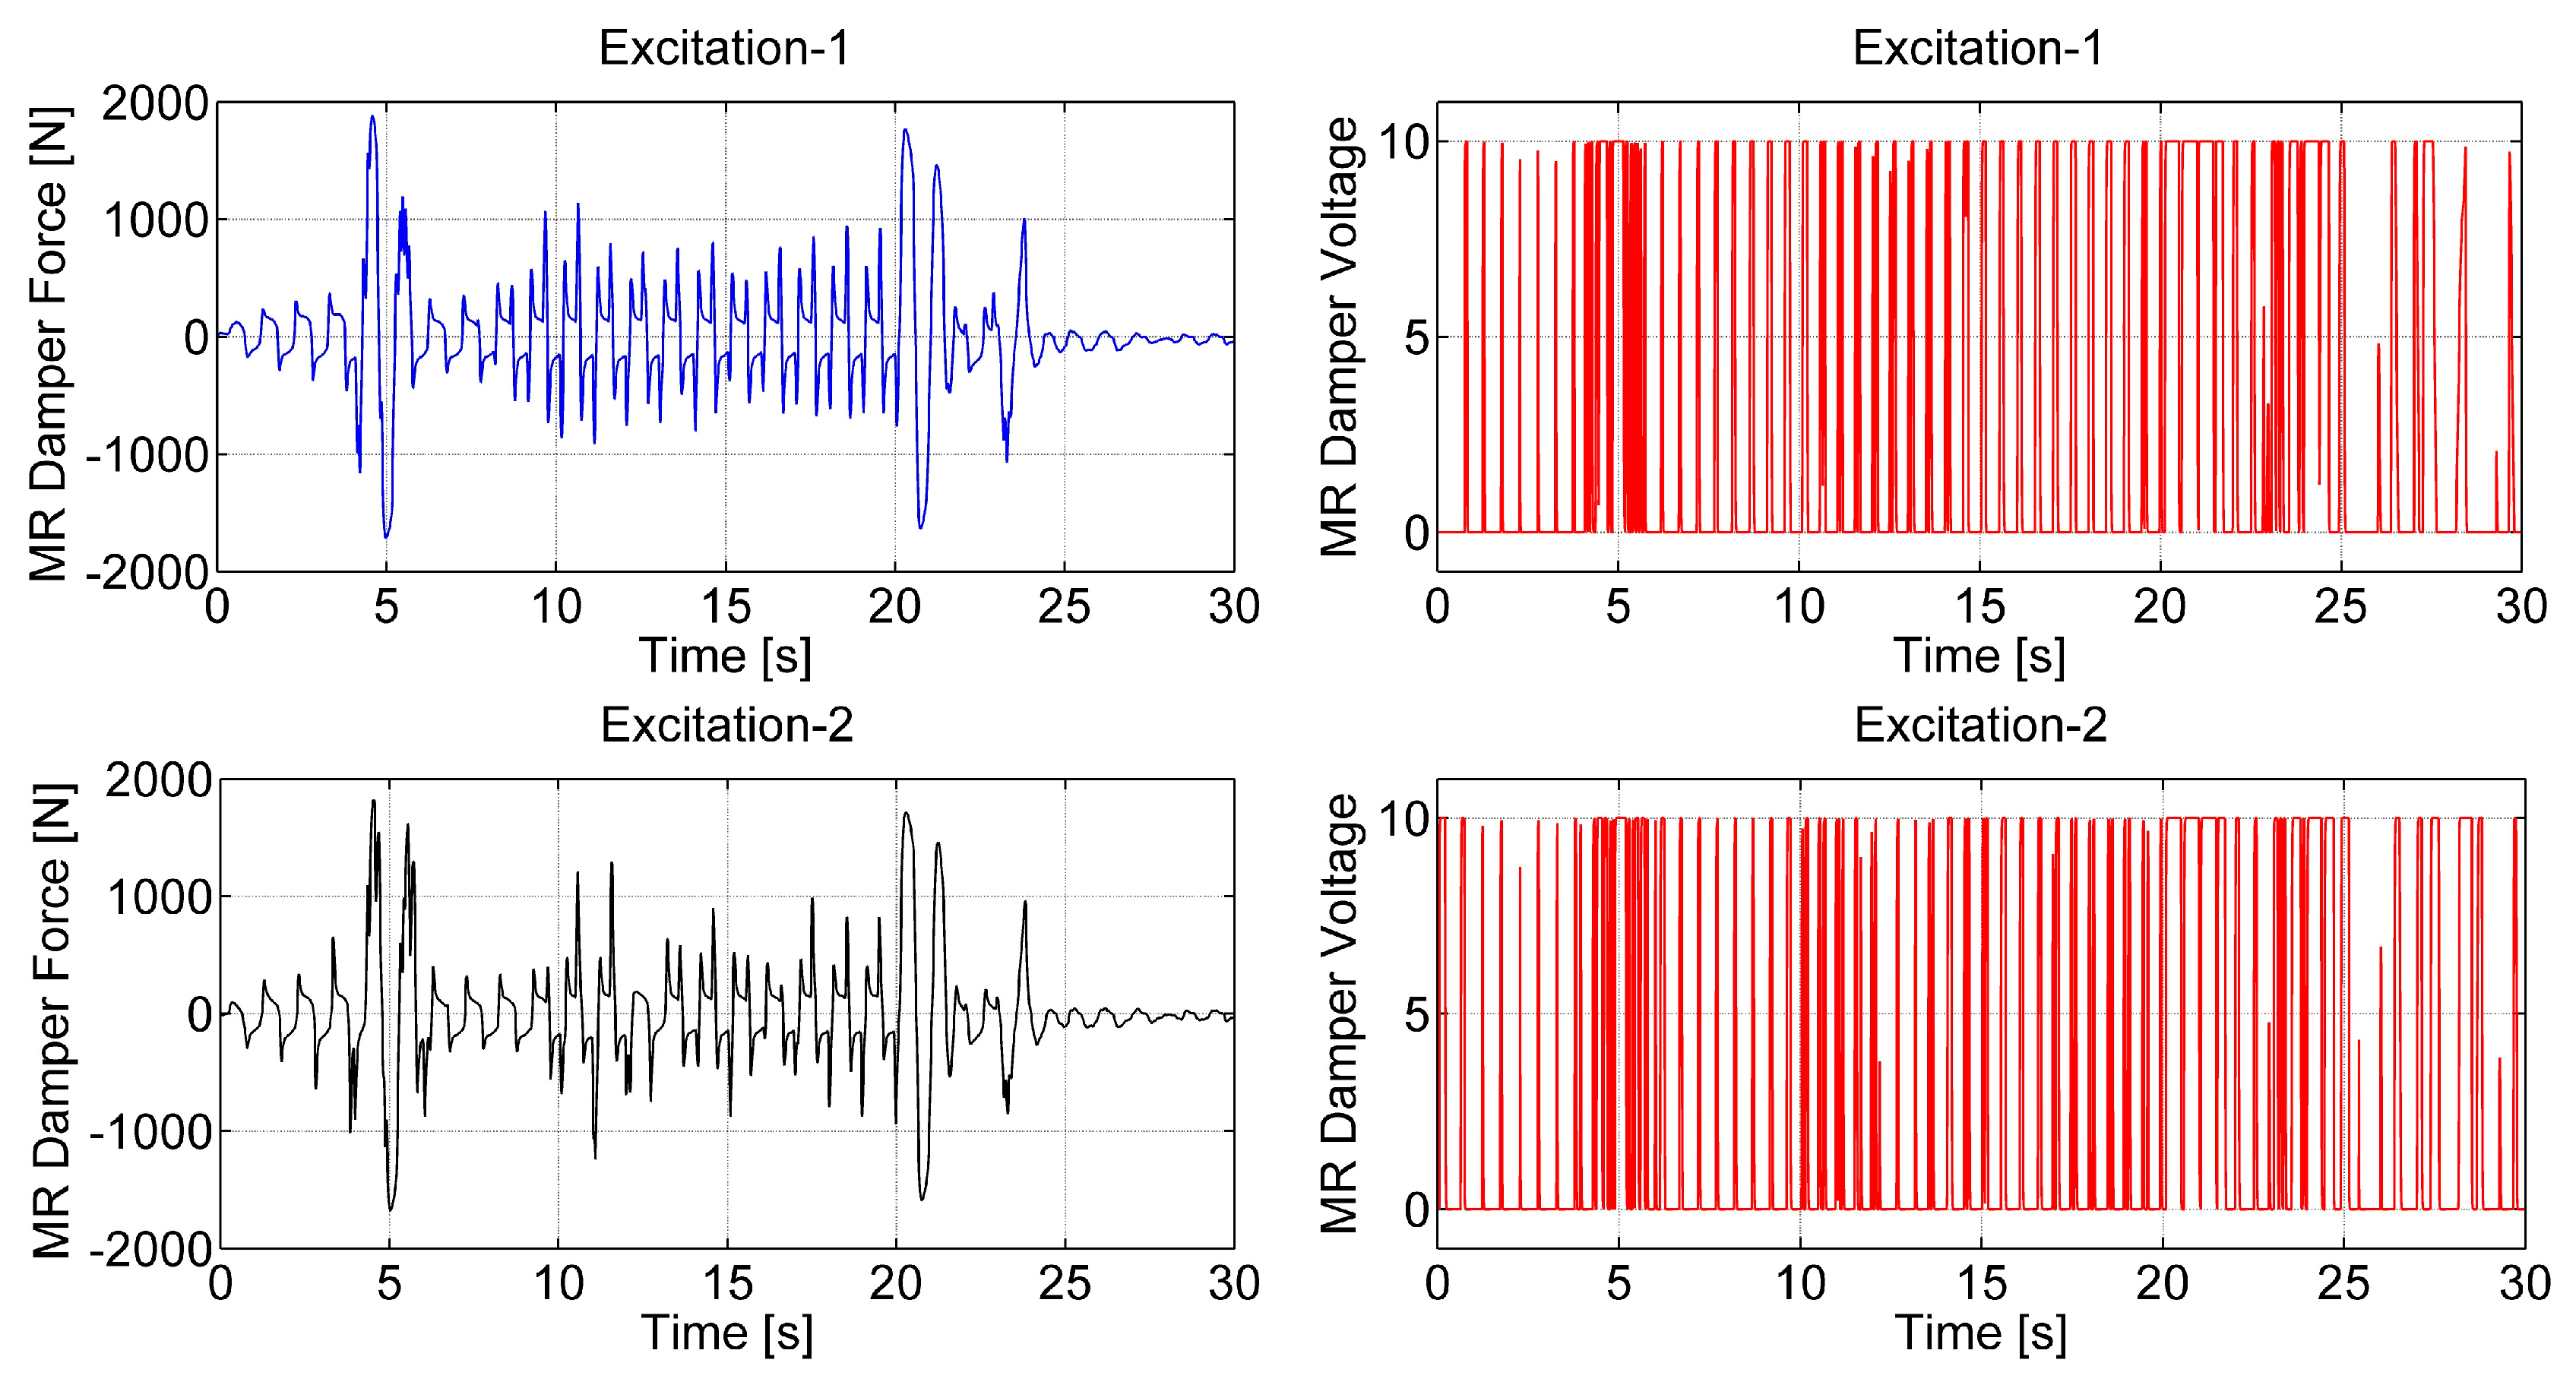
Force and voltage curves of the MR damper are shown in Figure 12 for the STMDh 0.0300 and values for all cases are shown in Table 2. It is seen that the maximum values are close to each other, and RMS values increase with increasing mass ratio.
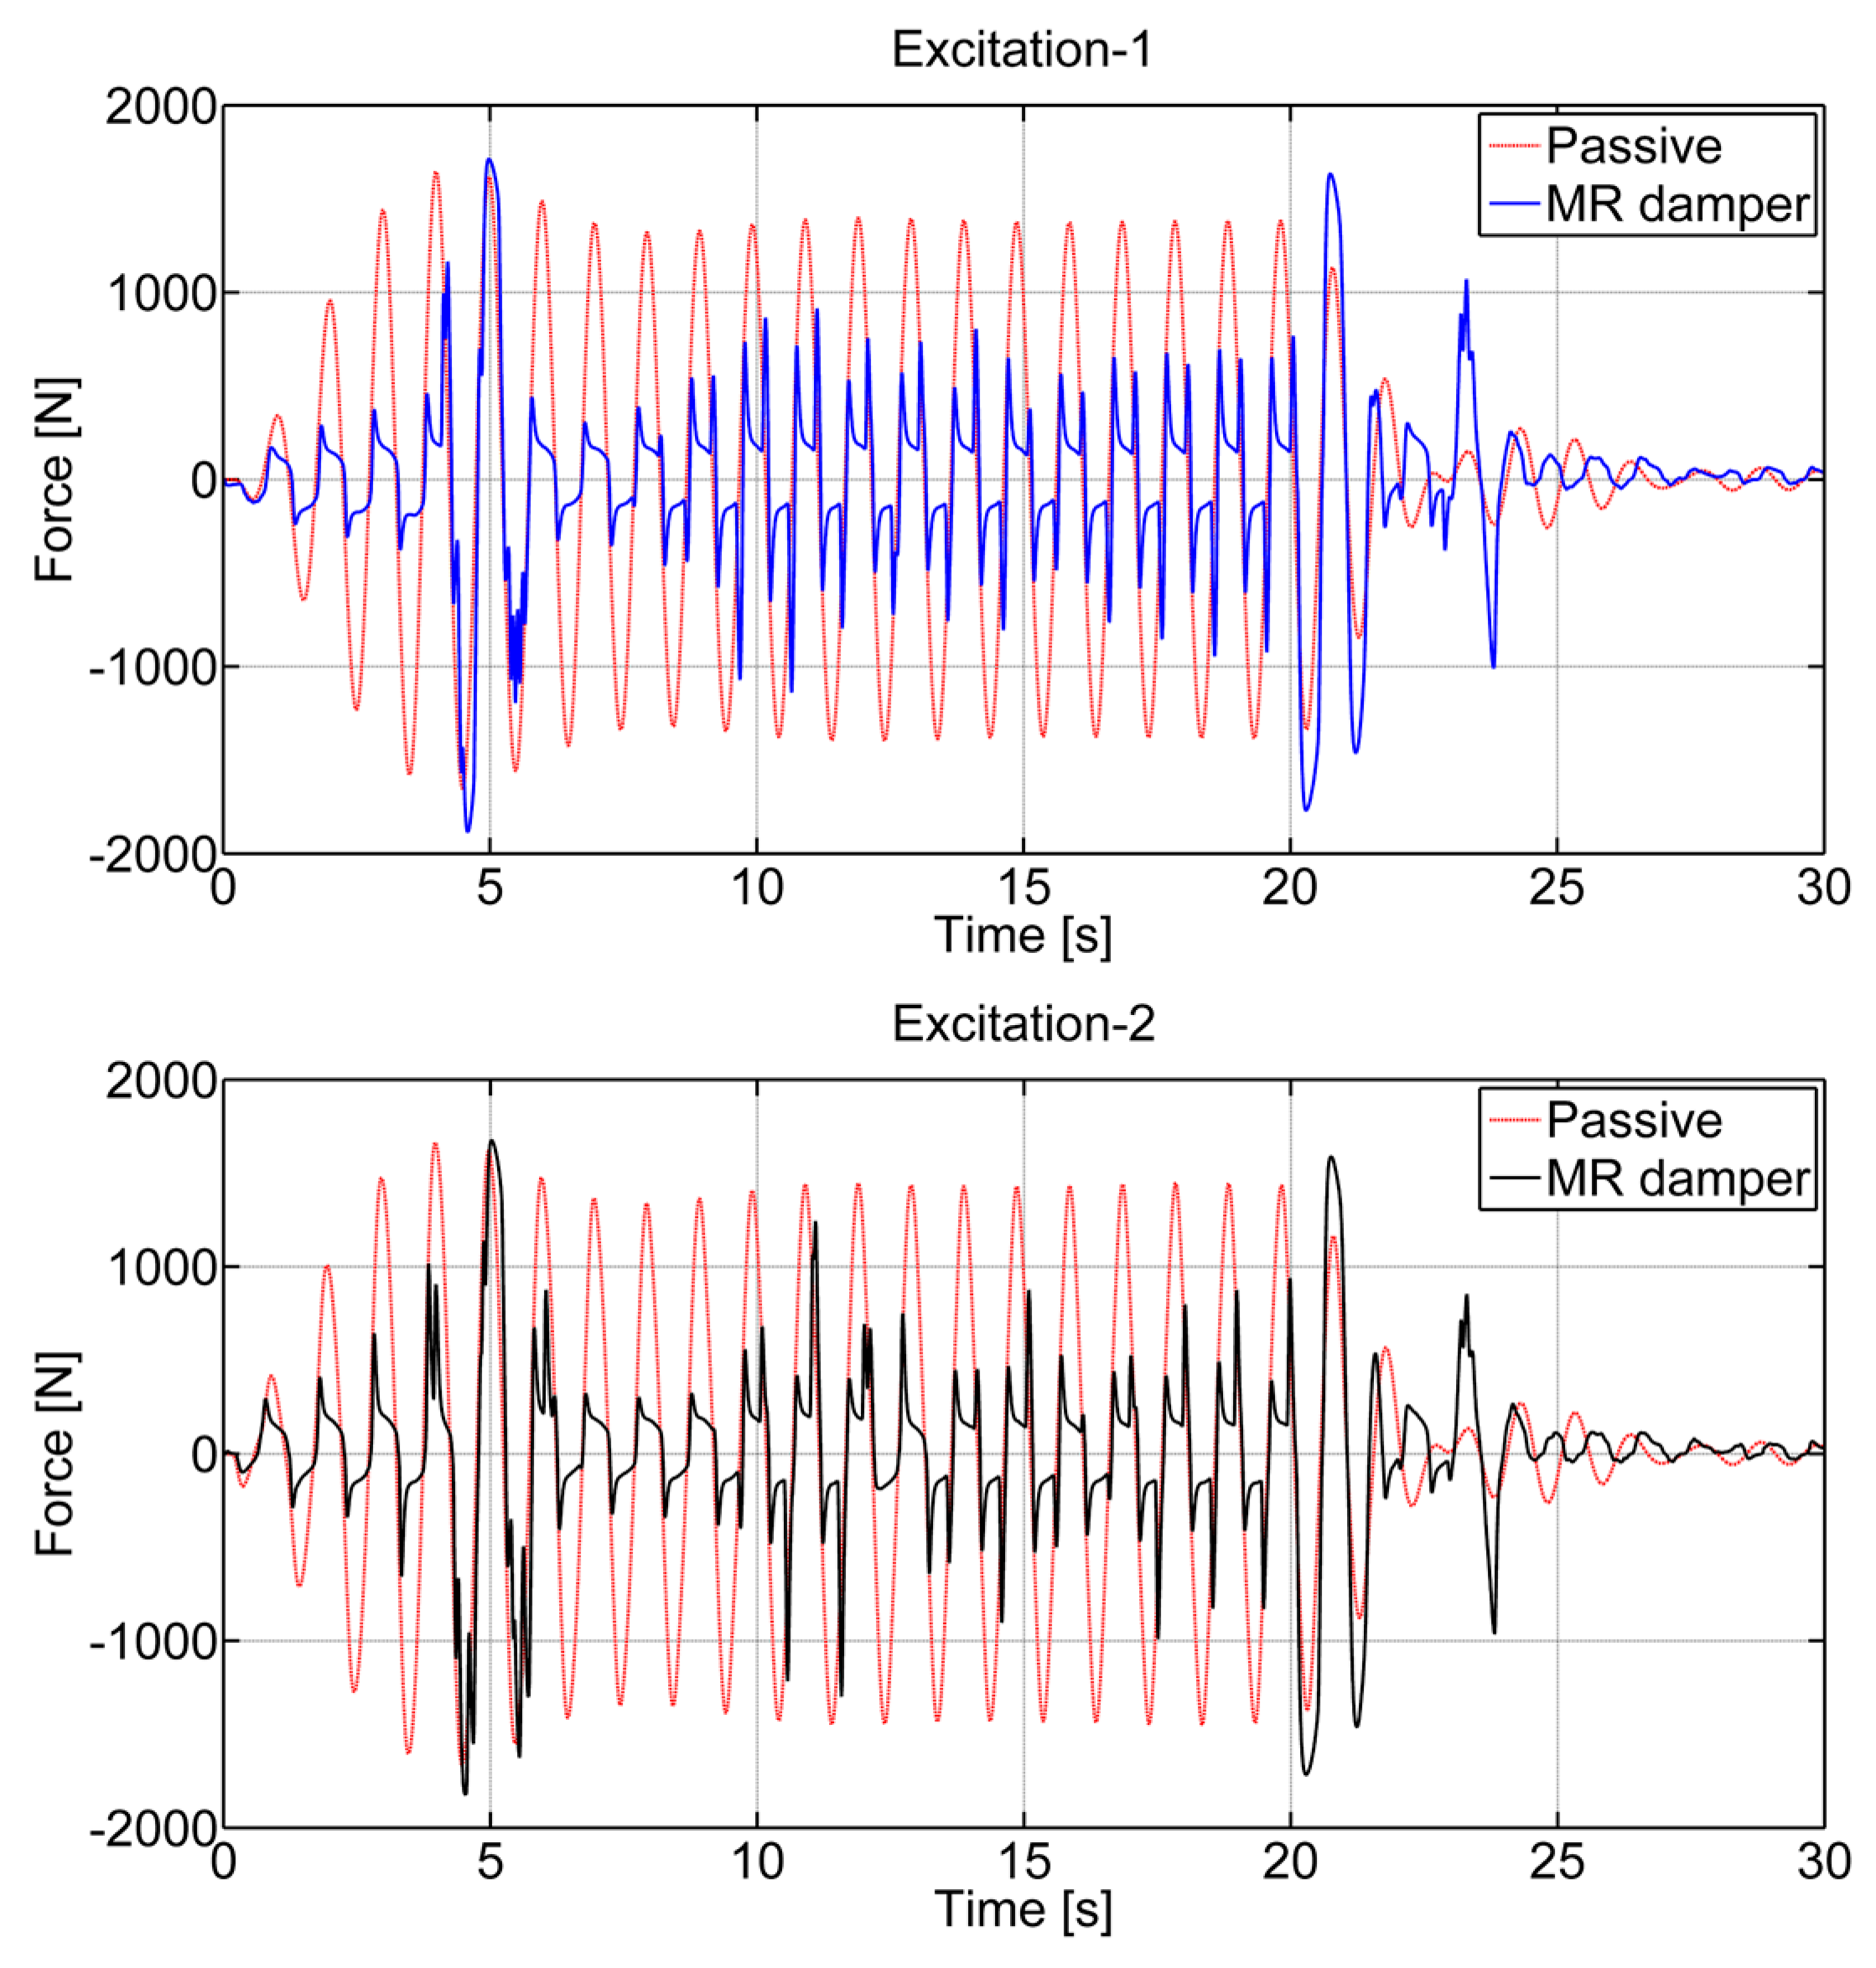
The damping forces generated by TMD, which have fixed parameters, according to the relative velocity data obtained from the system, are shown in Table 3. Additionally, in Figure 13, the damping force of the TMD 0.0300 and the MR damper forces of the STMDh 0.0300 were compared. In all mass ratios, the maximum damping force produced by the MR damper, whose damping value can change with the control algorithm applied, was higher than the passive state, and the RMS value of the damping force of the MR damper was lower than the passive state. The force data obtained proved that the damping value of the MR damper varied according to the performance of the system, suppressing the system responses better than the passive state.
For all control cases in Table 4, it is seen that displacements and relative displacements decrease with increasing mass ratio. For both excitation states, the maximum relative displacement of the TMD was observed to be lower than the STMDh . The damping parameter of the TMD was fixed and unchanged. The damping parameter of STMD varied according to the force produced by the MR damper to improve system responses. For this reason, while system responses improve with STMD, the relative displacement may increase. The relative displacement was read from the set of experiments and evaluated as it related to the stroke limit of the MR damper. Situations related to relative displacement were also valid for the STMD displacement.

3.2.2. Frequency Analysis

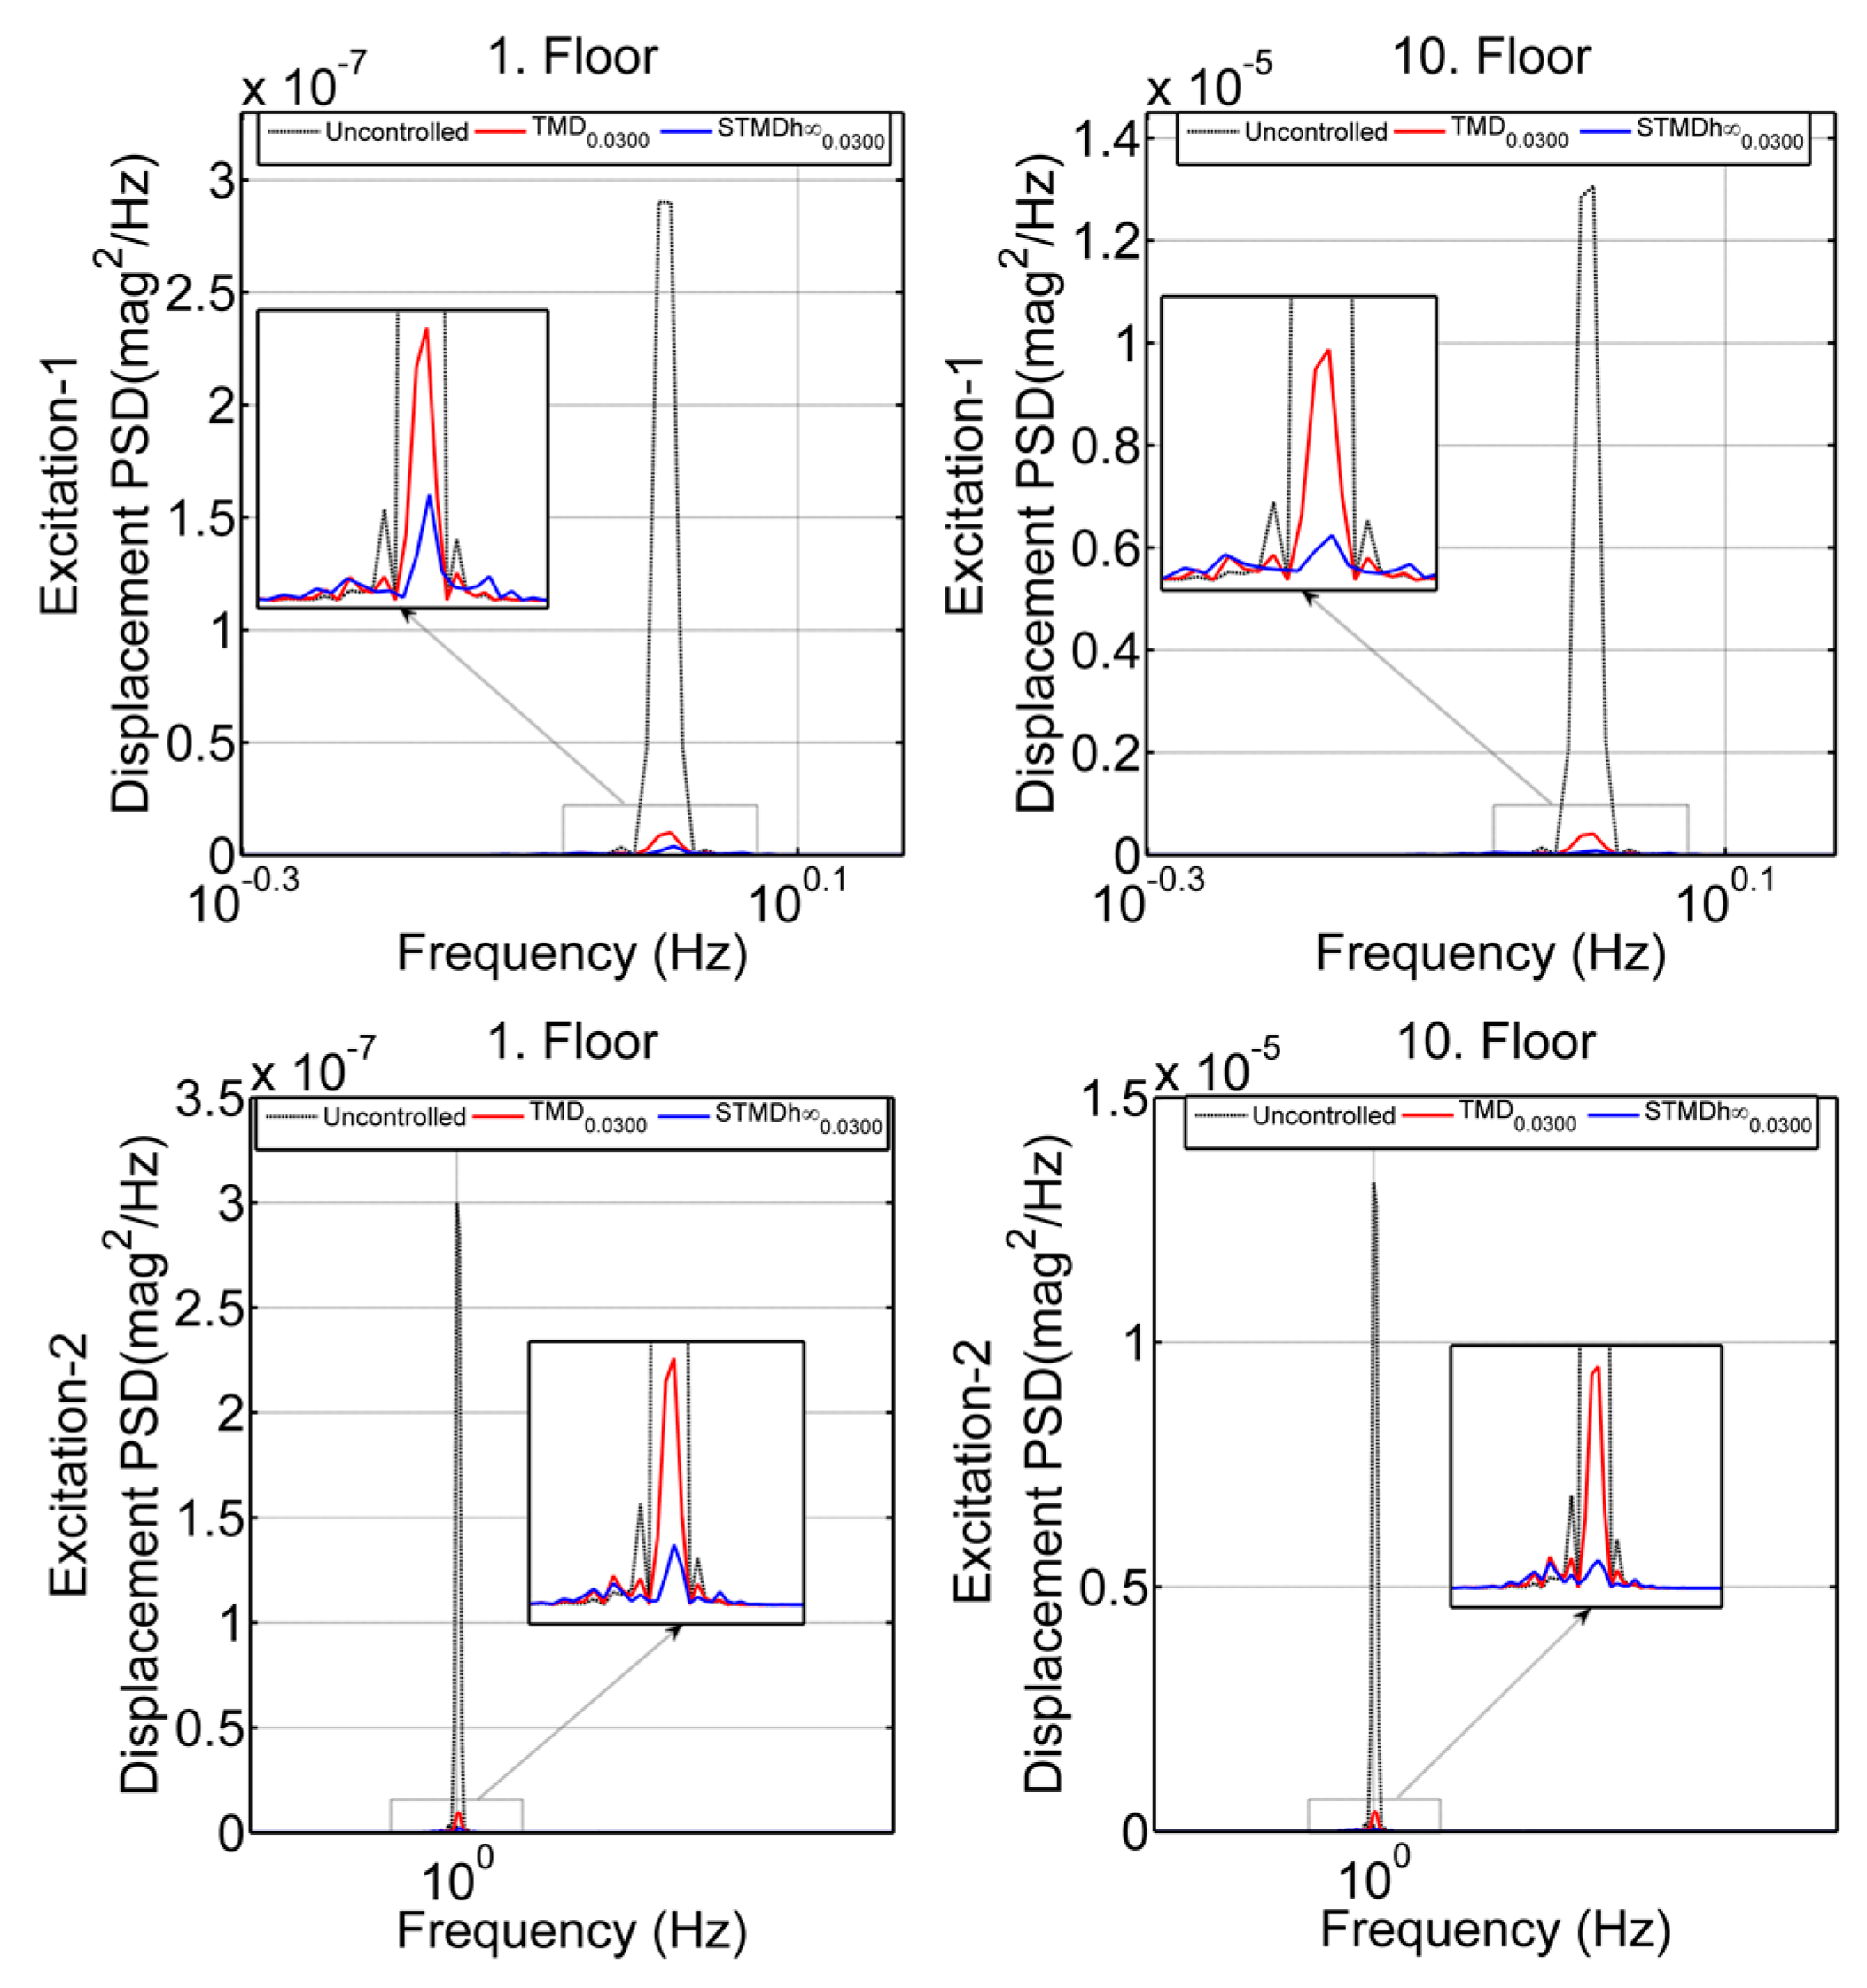
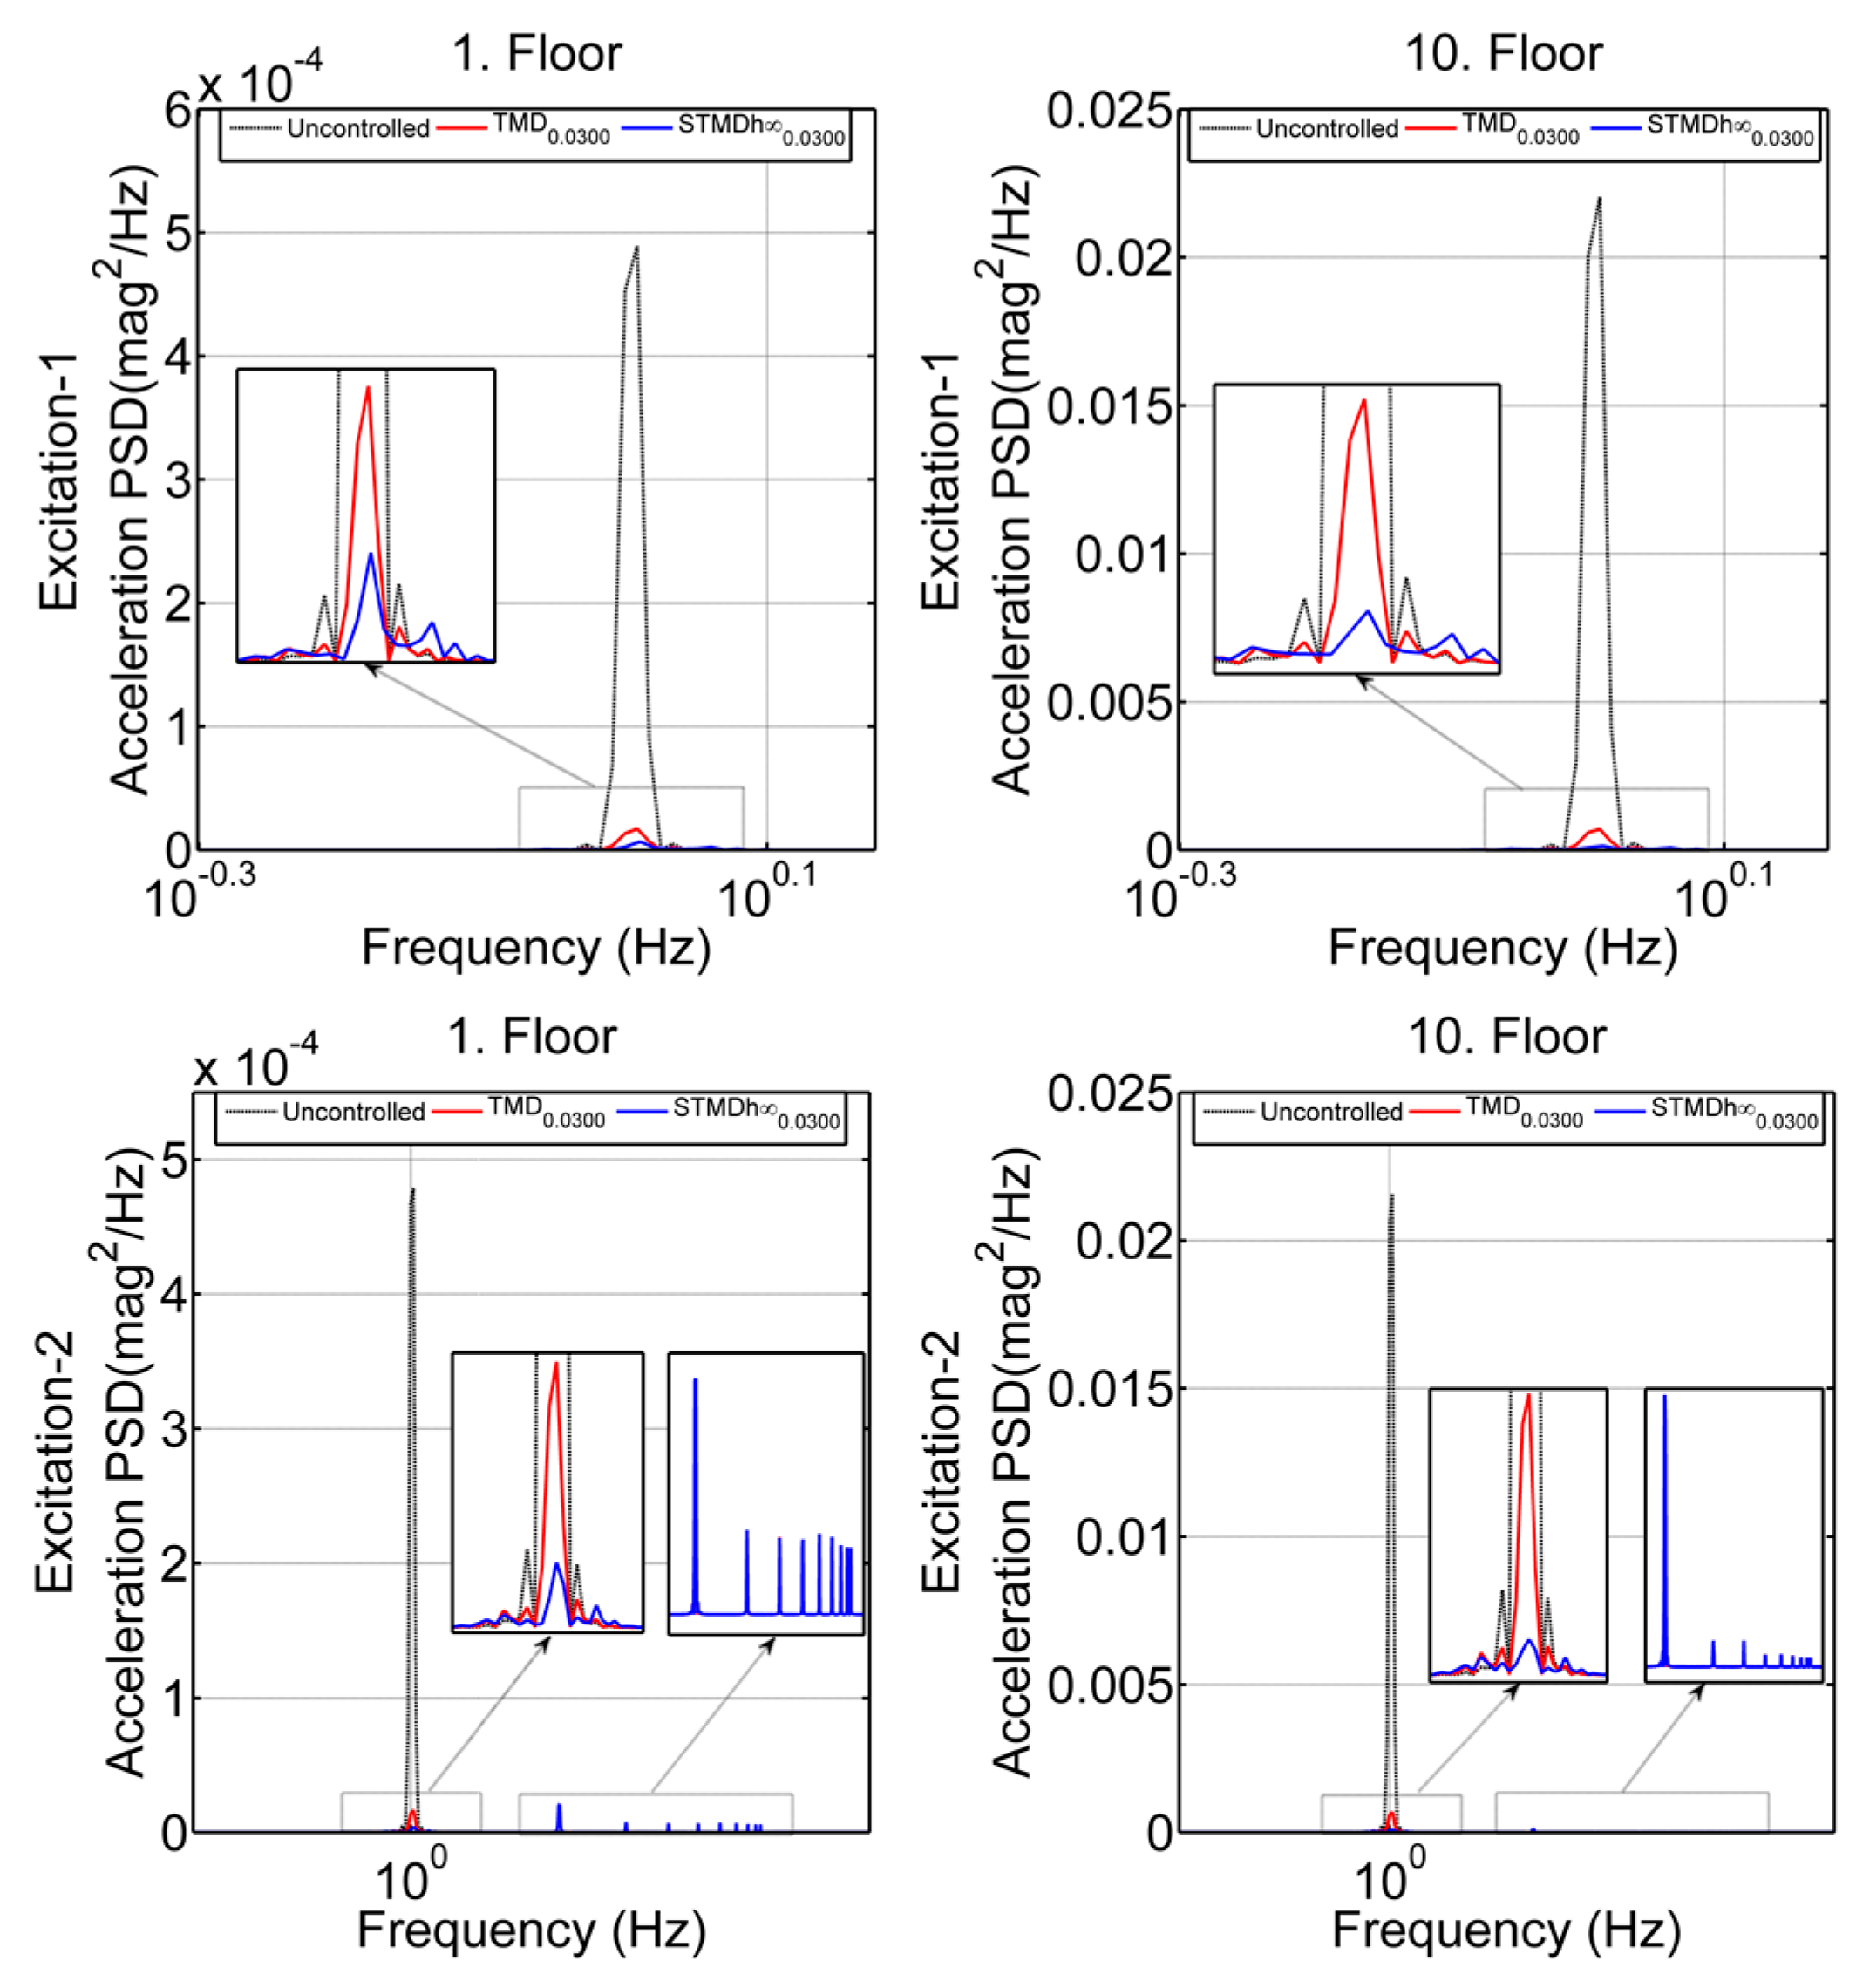
The power spectrum density (PSD) curves were researched to the responses of the structural system in the frequency domain. Displacement and acceleration PSD responses of first and 10th floors are seen in Figure 14 and Figure 15. In both excitation cases, STMDh 0.0300 performed better than TMD 0.0300 in suppressing resonance peaks. Moreover, although the system responses in the displacement frequency responses were similar in both excitations, there were differences in acceleration responses. The dominant frequency of the Excitation-2 was the first mode frequency and in the section where this frequency was active, the performances of TMD 0.0300   and STMDh 0.0300 states were high. However, in the part where other frequencies were effective, only acceleration performance decreased.
In variable frequency excitations, although the performances of the STMD and TMD improved in displacement responses, their performance might decrease in acceleration responses. The constant TMD parameters made it difficult for it to adapt to variable conditions. The reason for a decrease in the performance of STMD in acceleration responses was that the voltages transmitted by the applied control algorithm instantly locked the MR damper. Based on PSD responses, when all system responses are taken into account, the STMD not only effectively suppresses structural system responses but also shows higher performance than the TMD.

3.3. Structural Vibration Performance Evaluations

In order to arrive at a detailed analysis of the system responses, performance indices created by Ohtori et al. [33] were applied as follows [22]:
J 1 = max { max t , i | d i ( t ) | h i δ max } ,   J 2 = max { max t , i | x ¨ ai ( t ) | x ¨ a max } ,   J 3 = max { max i || d i || h i || δ max || } ,   J 4 = max { max i || x ¨ ai ( t ) || || x ¨ a max || }
δ max = | d i ( t ) | h i
Here,   δ max is the maximum inter-story drift ratio of the uncontrolled structure, h i is the distance between floors, d i is the displacement between floors, and x ¨ a max is the absolute acceleration without the controller. When the distances between floors are equal, h i may not be considered [34]. In the performance indices, the uncontrolled case was compared to the TMD and the STMDh cases. Table 5 shows the performance indices of the structural system using the HILS method. In all control cases, a performance criterion of less than 1 indicated an improvement in system performance. The first performance index ( J 1 ) was based on the maximum values in the amplitudes between the multiples, and the second performance index ( J 2 ) was based on the maximum value of the acceleration. The third ( J 3 ) performance index represented the maximum value of the displacement norm, and the fourth ( J 4 ) performance index represented the maximum value of the norm of acceleration. For both excitation cases, the performance indices met the normal situation for the TMD and the STMDh . In all mass ratios, it was clear that STMDh performed better than the TMD. However, in the case of Excitation-1, it was observed that the TMD was more effective with a slight difference in the performance measure J 2 . For both excitation states, the   STMDh 0.0300 showed the best control performance.

4. Conclusions

In this study, the performance of STMD—which uses the MR-damper as a semi-active damping element—to improve responses of a building was investigated using the HILS method. The experimental part of the system consisted of MR dampers and sensors, and the simulation part consisted of building model and control algorithms. The connection between these two parts was via an interface. A Robust H control was applied to command the MR damper voltage. The system was excited with two different acceleration inputs (the Excitation-1 and the Excitation-2) generated by the natural frequencies of the building model, and the control performances of the TMD and the STMDh at different mass ratios were researched. Both excitations appeared to be similar in system displacement responses. However, the system produced completely different results in acceleration responses because frequencies other than the first natural frequency of the system in Excitation-2 affected the acceleration responses more. Moreover, in variable frequency excitations, the voltages transmitted to the MR damper may have caused momentary locking due to its internal structure. For this reason, the control performance decreased in acceleration responses. The results show that the STMDh improves system responses more effectively than the TMD in all cases. As seen in all time responses, as the mass ratio of the STMDh increases, so do improvements in system responses. The best performance in all control situations was achieved in the STMDh 0.0300 . With the STMDh 0.0250   control case performing better than the TMD 0.0300 it appears that the performance of the TMD at high mass ratios can be achieved at lower mass ratios than the STMDh . The results show that the HILS method is applicable to the STMDs used in structural vibration control. Furthermore, it has been observed that the HILS method improves system responses with the voltage transmitted with H control to MR damper, which is critical for the system and experimentally installed.
In future studies, the control performances of STMDs under different earthquake warnings will be investigated with the HILS method. Besides, robust-static output feedback H control will be applied to determine the voltage transmitted to the MR damper.

Author Contributions

This paper is produced from H.A.’s PhD thesis study called “Performance analysis of semi-active mass damper with Hardware in the loop simulation method”. R.G. is the PhD thesis advisor of HY. All authors have read and agreed to the published version of the manuscript.

Funding

This research received no external funding.

Conflicts of Interest

The authors declare no conflict of interest.

Nomenclature

MDOFMulti degree of freedom
SDOFSingle degree of freedom
TMDTuned mass damper
STMDSemi-active tuned mass damper
MRMagnetorheological
HILSHardware in the loop simulation
RTHSReal-time hybrid simulation
FOMFull order model
ROMReduced-order model
RMSRoot mean square
PSDPower spectral density
MsMass matrix of the structural system
CsStiffness matrix of the structural system
KsDamping matrix of the structural system
LThe seismic input vector
H s The placement of control units
x ¨ ( t ) Acceleration vector
x ˙ ( t ) Velocity vector
x ( t ) Displacement vector
f(t)The damping force of MR damper
x ¨ g ( t ) The earthquake ground acceleration
x i i th floor displacement
HH infinity control
A f ,   B f ,   C f State-space matrices for the full order model
A r ,   B r ,   C r State-space matrices for the reduced-order model
Φ Modal transformation vector
x f / x r The state vectors of the full-order/reduced-order system model
y f / y r The output vectors of the full-order/reduced-order system model
Pf (s)Full order model of the system
Pr (s)Reduced-order model of the system
CyLocations of the measurements of the system
ƞModal space of the system
w The input excitation
KController of the system
uThe control signal of the system
yThe measured response of the system
z1, z2They are regulating outputs of frequency shaping filters.
nThe noise of the measurement
G zw The transfer function of the mixed sensitivity structure
ξ nm The damping ratio of last controlled mode
ξ dm The damping ratio of first uncontrolled mode
ω nm Frequency of the last controlled mode
ω dm Frequency of the first uncontrolled mode
V min Minimum voltage in the MR damper
V max The maximum voltage in the MR damper
f d The force necessary for system
f c The system measures force
WT, WMFilters
S(s)Sensitivity transfer function
T(s)The complementary sensitivity transfer function
Δ Additive uncertainty of the system
σ ¯ Maximum singular value of the S(s)
γ Positive design parameter
G(s)The augmented system structure
x G The state vector of the augmented system model
x K The state vector of the controller
G MR The MR damper controller gain
f opt Optimum frequency ratio of TMD
ξ opt The optimum damping ratio of TMD
μMass ratio
WniThe natural frequency of the system model
x ˙ v The velocity of the floor to which the MR damper was connected in the system
gThe acceleration of gravity
JnPerformance indices of the system
hiDistance between floors
diDisplacement between floors
x ¨ i max (t)Absolute acceleration without the controller

References

  1. Frahm, H. Device for Damping Vibrations of Bodies. U.S. Patent 989958A, 18 April 1911. [Google Scholar]
  2. Den Hartog, J.P.; Ormondroyd, J. Theory of the dynamic vibration absorber. ASME J. Appl. Mech. 1928, 50, 11–22. [Google Scholar]
  3. Den Hartog, J.P. Mechanical Vibrations; McGraw-Hill: New York, NY, USA, 1956. [Google Scholar]
  4. Connor, J.J. Structural Motion Control; Pearson Education Inc.: London, UK, 2003. [Google Scholar]
  5. Guclu, R.; Sertbas, A. Evaluation of Sliding Mode and Proportional-Integral-Derivative Controlled Structures with an Active Mass Damper. J. Vib. Control 2005, 11, 397–406. [Google Scholar] [CrossRef]
  6. Guclu, R.; Yazici, H. Vibration control of a structure with ATMD against earthquake using fuzzy logic controllers. J. Sound Vib. 2008, 318, 36–49. [Google Scholar] [CrossRef]
  7. Beltran-Carbajal, F.; Silva-Navarro, G. Output feedback dynamic control for trajectory tracking and vibration suppression. Appl. Math. Model. 2020, 79, 793–808. [Google Scholar] [CrossRef]
  8. Guclu, R.; Yazici, H. Seismic-vibration mitigation of a nonlinear structural system with an ATMD through a fuzzy PID controller. Nonlinear Dyn. 2009, 58, 553–564. [Google Scholar] [CrossRef]
  9. Guclu, R.; Yazici, H. Self-tuning fuzzy logic control of a non-linear structural system with ATMD against earthquake. Nonlinear Dyn. 2009, 56, 199–211. [Google Scholar] [CrossRef]
  10. Aldemir, U. Optimal control of structures with semiactive-tuned mass dampers. J. Sound Vib. 2003, 266, 847–874. [Google Scholar] [CrossRef]
  11. Lin, P.Y.; Chung, L.L.; Loh, C.H. Semiactive Control of Building Structures with Semiactive Tuned Mass Damper. Comput. Aided Civ. Infrastruct. Eng. 2005, 20, 35–51. [Google Scholar] [CrossRef]
  12. Tse, K.T.; Kwok, K.C.S.; Hitchcock, P.A.; Samali, B.; Huang, M.F. Vibration control of a wind-excited benchmark tall building with complex lateral-torsional modes of vibration. Adv. Struct. Eng. 2007, 10, 283–304. [Google Scholar] [CrossRef]
  13. Kim, H.-S.; Kang, J.-W. Semi-active fuzzy control of a wind-excited tall building using multi-objective genetic algorithm. Eng. Struct. 2012, 41, 242–257. [Google Scholar] [CrossRef]
  14. Kim, H.-S. Seismic response control of adjacent buildings coupled by semi-active shared TMD. Int. J. Steel Struct. 2016, 16, 647–656. [Google Scholar] [CrossRef]
  15. Bathaei, A.; Zahrai, S.M.; Ramezani, M. Semi-active seismic control of an 11-DOF building model with TMD+MR damper using type-1 and -2 fuzzy algorithms. J. Vib. Control 2018, 24, 2938–2953. [Google Scholar] [CrossRef]
  16. Aly, A.M. Control of wind-induced motion in high-rise buildings with hybrid TM/MR dampers. Wind Struct. 2015, 21, 565–595. [Google Scholar] [CrossRef]
  17. Weber, F.; Distl, H.; Fischer, S.; Braun, C. MR Damper Controlled Vibration Absorber for Enhanced Mitigation of Harmonic Vibrations. Actuators 2016, 5, 27. [Google Scholar] [CrossRef]
  18. Setareh, M.; Ritchey, J.K.; Murray, T.M.; Koo, J.-H.; Ahmadian, M. Semiactive Tuned Mass Damper for Floor Vibration Control. J. Struct. Eng. 2007, 133, 242–250. [Google Scholar] [CrossRef]
  19. Lin, P.-Y.; Lin, T.-K.; Hwang, J.-S. A semi-active mass damping system for low- and mid-rise buildings. Earthq. Struct. 2013, 4, 63–84. [Google Scholar] [CrossRef]
  20. Paksoy, M.; Metin, M. Nonlinear semi-active adaptive vibration control of a half vehicle model under unmeasured road input. J. Vib. Control 2019, 25, 2453–2472. [Google Scholar] [CrossRef]
  21. Phillips, B.M.; Spencer, B.F. Model-Based Feedforward-Feedback Actuator Control for Real-Time Hybrid Simulation. J. Struct. Eng. 2013, 139, 1205–1214. [Google Scholar] [CrossRef]
  22. Aggumus, H.; Cetin, S. Experimental investigation of semiactive robust control for structures with magnetorheological dampers. J. Low Freq. Noise Vib. Act. Control 2018, 37, 216–234. [Google Scholar] [CrossRef] [Green Version]
  23. Du, H.; Zhang, N. Active vibration control of structures subject to parameter uncertainties and actuator delay. J. Vib. Control 2008, 14, 689–709. [Google Scholar]
  24. Huo, L.; Song, G.; Li, H.; Grigoriadis, K. Robust control design of active structural vibration suppression using an active mass damper. Smart Mater. Struct. 2007, 17, 015021. [Google Scholar] [CrossRef] [Green Version]
  25. Zhang, H.; Wang, R.; Wang, J.; Shi, Y. Robust finite frequency H∞ static-output-feedback control with application to vibration active control of structural systems. Mechatronics 2014, 24, 354–366. [Google Scholar] [CrossRef]
  26. Gu, D.-W.; Petkov, P.H.; Konstantinov, M.M. Robust Control Design with MATLAB®, 2nd ed.; Springer: London, UK, 2013. [Google Scholar]
  27. Sivrioglu, S.; Tanaka, N.; Yuksek, I. Acoustic power suppression of a panel structure using H∞ output feedback control. J. Sound Vib. 2002, 249, 885–897. [Google Scholar] [CrossRef]
  28. El-Kafafy, M.; El-Demerdash, S.M.; Rabeih, A.-A.M. Automotive ride comfort control using MR fluid damper. Engineering 2012, 4, 179–187. [Google Scholar] [CrossRef] [Green Version]
  29. Lam, A.H.-F.; Liao, W.-H. Semi-active control of automotive suspension systems with magneto-rheological dampers. Int. J. Veh. Des. 2003, 33, 50–75. [Google Scholar] [CrossRef]
  30. Warburton, G.B. Optimum absorber parameters for various combinations of response and excitation parameters. Earthq. Eng. Struct. Dyn. 1982, 10, 381–401. [Google Scholar] [CrossRef]
  31. Singh, M.P.; Matheu, E.E.; Suarez, L.E. Active and Semi-Active Control of Structures Under Seismic Excitation. Earthq. Eng. Struct. Dyn. 1997, 26, 193–213. [Google Scholar] [CrossRef]
  32. Hadi, M.N.; Arfiadi, Y. Optimum design of absorber for MDOF structures. J. Struct. Eng. 1998, 124, 1272–1280. [Google Scholar] [CrossRef] [Green Version]
  33. Ohtori, Y.; Christenson, R.E.; Spencer, B.F., Jr.; Dyke, S.J. Benchmark control problems for seismically excited nonlinear buildings. J. Eng. Mech. 2004, 130, 366–385. [Google Scholar] [CrossRef] [Green Version]
  34. Cetin, S.; Zergeroglu, E.; Sivrioglu, S.; Yuksek, I. A new semiactive nonlinear adaptive controller for structures using MR damper: Design and experimental validation. Nonlinear Dyn. 2011, 66, 731–743. [Google Scholar] [CrossRef]
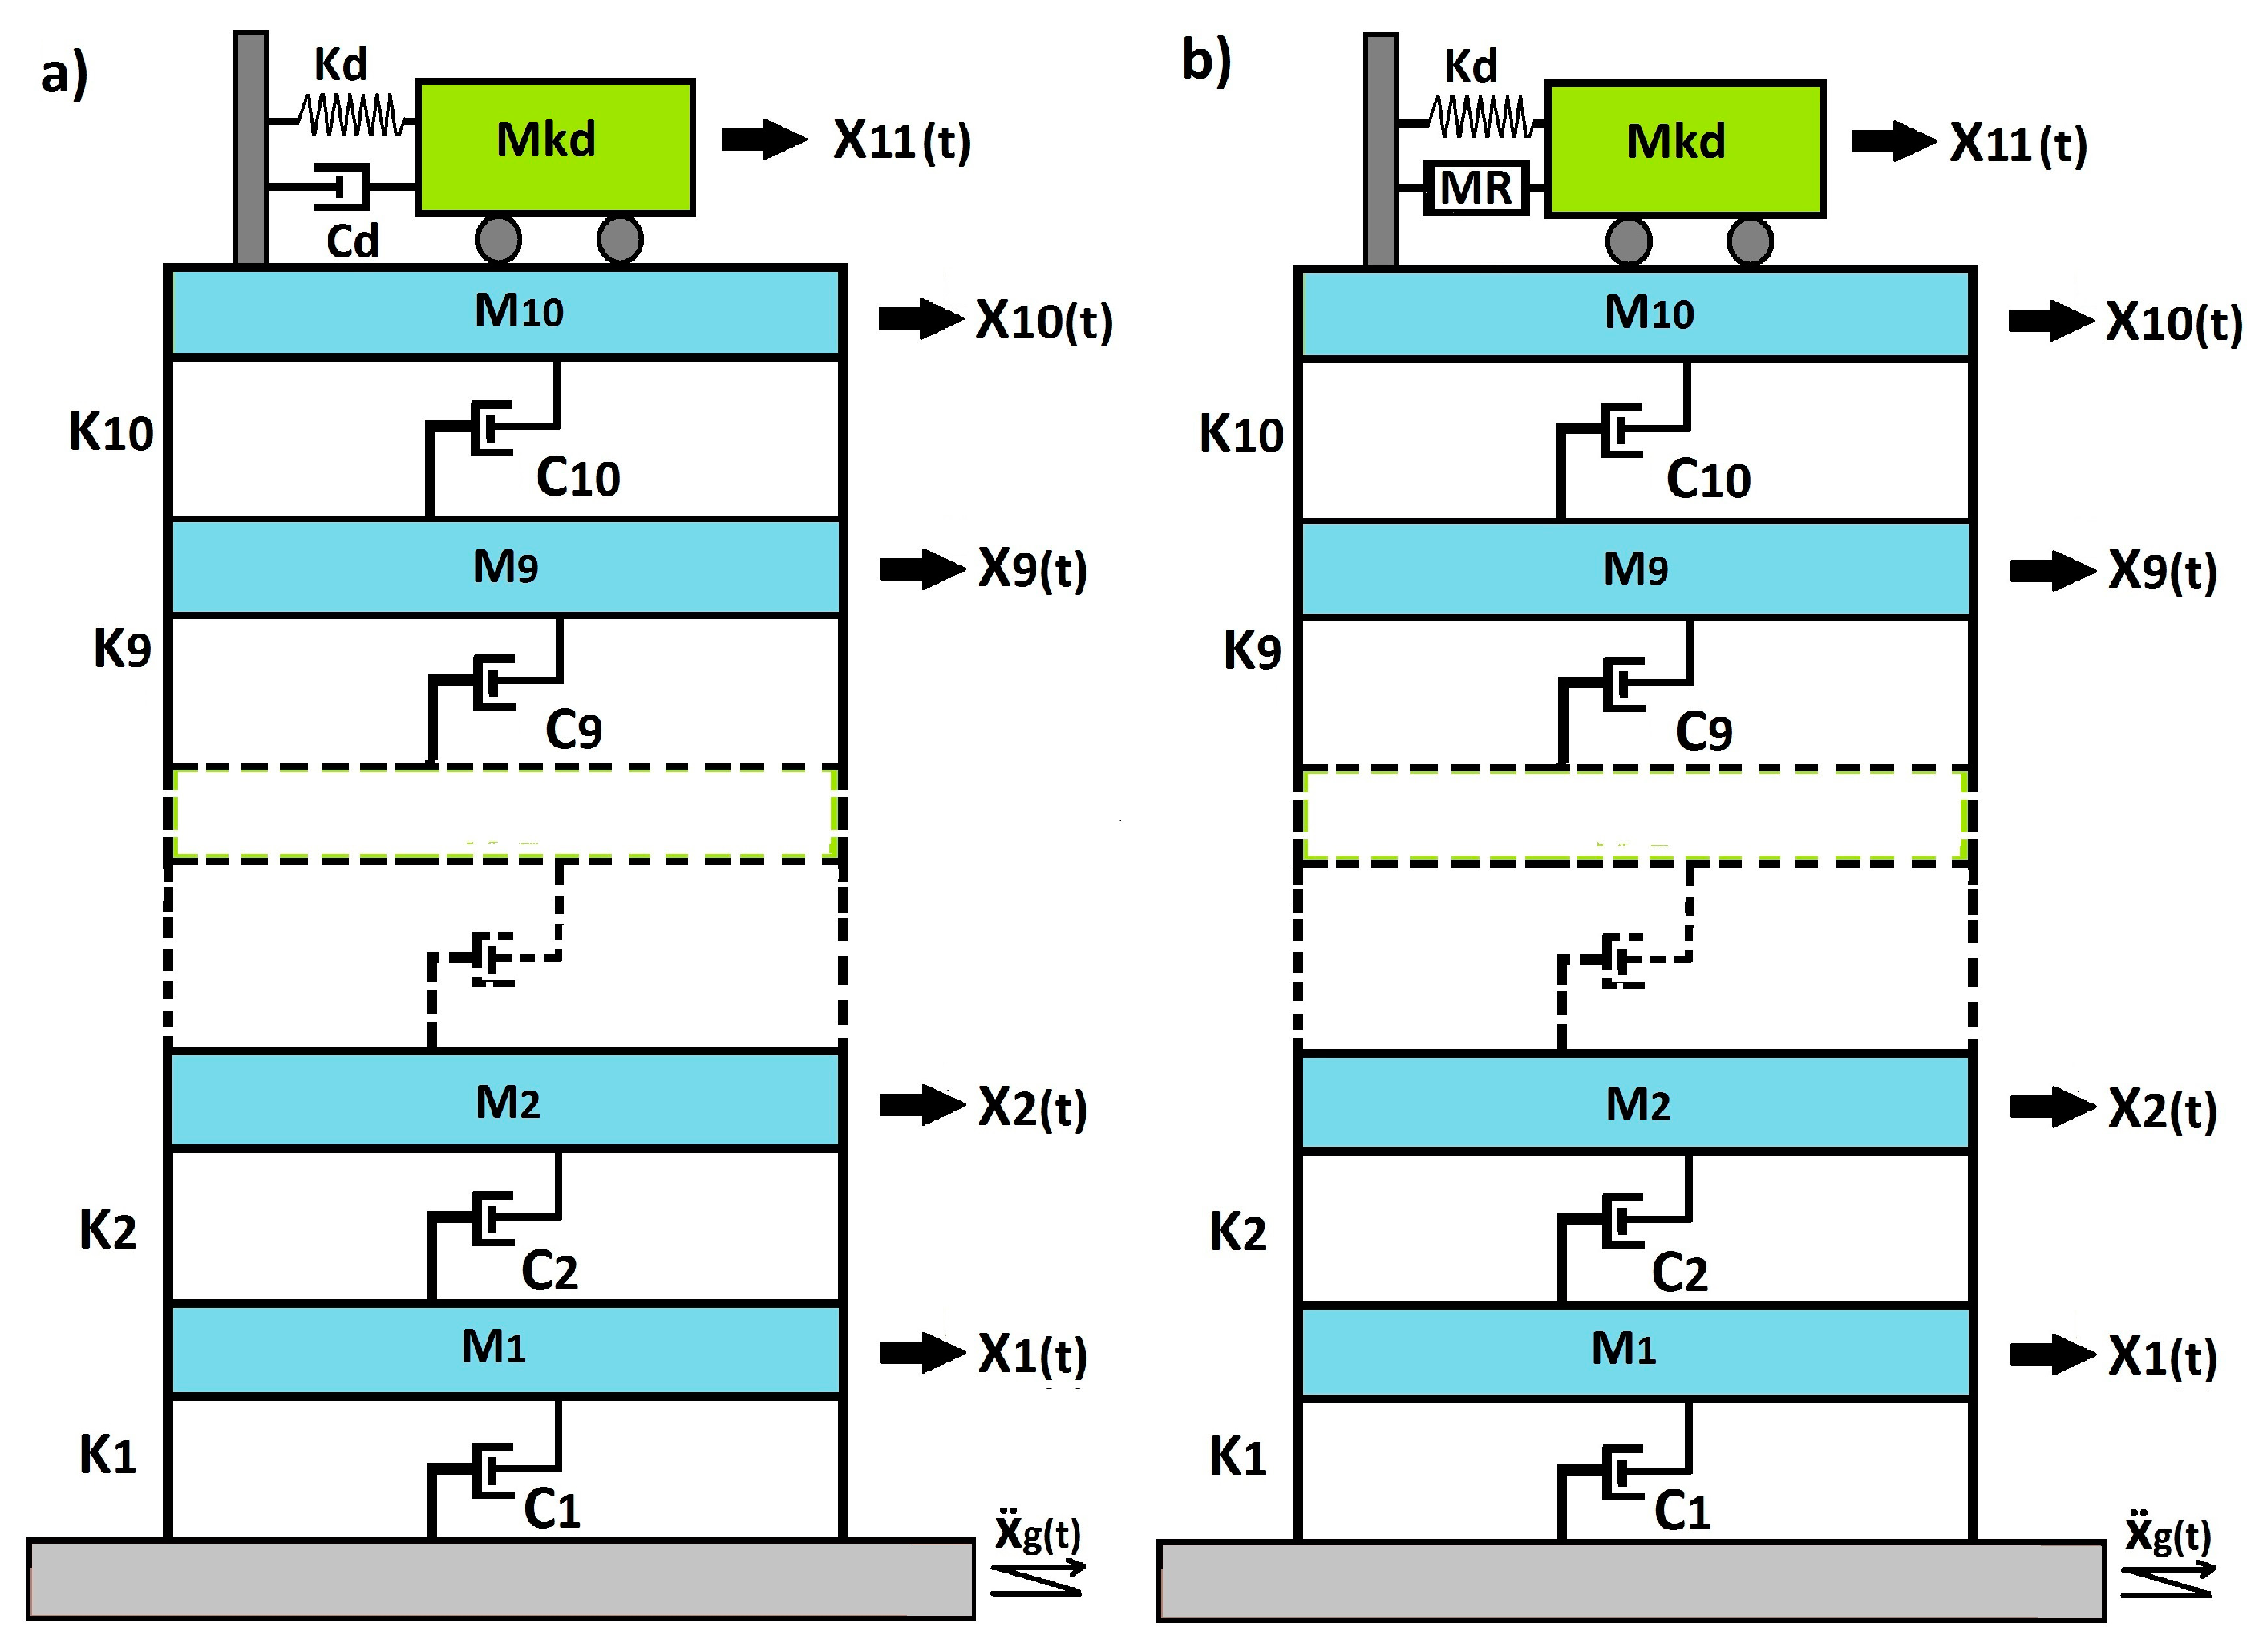
Figure 1. The two control cases. (a) Passive Control case, (b) Semi-active control case.
Actuators 09 00055 g001
Figure 2. Augmented system structure.
Actuators 09 00055 g002
Figure 3. (a) Overview of the test system. (b) Schematic view of the HILS method.
Actuators 09 00055 g003
Figure 4. The Excitation-1 and the Excitation-2 forces, acceleration (left), and frequency changes (right).
Actuators 09 00055 g004
Figure 5. Characteristics of the magnetorheological (MR) damper.
Actuators 09 00055 g005
Figure 6. Desired and measured relative displacement comparisons.
Actuators 09 00055 g006
Figure 7. The general semi-active control scheme.
Actuators 09 00055 g007
Figure 8. The TMD 0.0300   and the STMDh 0.0300 the displacements (top) and accelerations (bottom) under the Excitation-1 force.
Actuators 09 00055 g008
Figure 9. The maximum displacement (left-top), maximum acceleration (left-bottom), displacement RMS (right-top), and acceleration RMS (right-bottom) values of all floors under the Excitation-1 force.
Actuators 09 00055 g009
Figure 10. The TMD 0.0300   and the STMDh 0.0300 , the displacements (top) and accelerations (bottom) under the Excitation-2 force.
Actuators 09 00055 g010
Figure 11. The maximum displacement (left-top), maximum acceleration (left-bottom), displacement RMS (right-top), and acceleration RMS (right-bottom) values of all floors under the Excitation-2 force.
Actuators 09 00055 g011
Figure 12. The MR damper force (left) and voltage curves (right).
Actuators 09 00055 g012
Figure 13. The TMD 0.0300 damping forces and the MR damper forces in STMDh 0.0300 : Excitation-1 (top); Excitation-2 (bottom).
Actuators 09 00055 g013
Figure 14. Displacement power spectrum density (PSD) curves of the system first (left) and 10th (right) floors under the Excitation-1 (top) and Excitation-2 forces (bottom).
Actuators 09 00055 g014
Figure 15. Acceleration PSD curves of the system first (left) and 10th (right) floors under the Excitation-1 (top) and Excitation-2 forces (bottom).
Actuators 09 00055 g015
Table 1. Different mass ratios for the tuned mass damper (TMD) and the STMDh .
Mass RatioAbbreviations of the TMDAbbreviations of the STMDG Values
μ = 0.0300 TMD 0.0300 STMDh 0.0300 0.09
μ = 0.0250 TMD 0.0250 STMDh 0.0250 0.05
μ = 0.0220 TMD 0.0220 STMDh 0.0220 0.01
μ = 0.0200 TMD 0.0200 STMDh 0.0200 0.01
Table 2. The MR damper force and voltage values.
AbbreviationsExcitation-1Excitation-2
MR Damper ForcesMR Damper VoltageMR Damper ForcesMR Damper Voltage
MaximumRMSMaximumRMSMaximumRMSMaximumRMS
STMDh 0.0200 1910.60328.51102.521906.78344.02103.82
STMDh 0.0220 1840.27330.10102.581948.94340.36103.67
STMDh 0.0250 1847.94348.74103.571886.71348.59104.92
STMDh 0.0300 1883.10359.30104.061821.12355.17104.84
Table 3. The TMD damping forces.
AbbreviationsExcitation-1Excitation-2
MaximumRMSMaximumRMS
TMD 0.0200 1307.03490.191288.10487.57
TMD 0.0220 1387.54518.961369.70516.06
TMD 0.0250 1497.22559.941478.27556.62
TMD 0.0300 1662.28623.441652.36619.38
Table 4. Displacements and relative displacements of the STMDh and the TMD.
Abbreviations (TMD and STMD)Maximum Relative Displacement [m]Maximum Displacement [m]
Excitation-1 Excitation-2 Excitation-1Excitation-2
TMD 0.0200 0.016360.016630.016990.01655
TMD 0.0220 0.015070.015380.015770.01531
TMD 0.0250 0.013560.013850.014230.01374
TMD 0.0300 0.011640.011970.012270.01184
STMDh 0.0200 0.024990.025430.025480.02492
STMDh 0.0220 0.023240.023690.023550.02309
STMDh 0.0250 0.021140.020850.021110.02062
STMDh 0.0300 0.017430.018080.018260.01778
Table 5. Evaluations of the STMDh and the TMD according to the performance indices.
Abbreviations (TMD and STMD)Excitation-1 Excitation-2
J 1 J 2 J 3 J 4 J 1 J 2 J 3 J 4
TMD 0.0200 0.296360.302280.244160.244970.349190.795900.249690.76976
TMD 0.0220 0.296360.302280.235360.236200.349190.795900.241080.76841
TMD 0.0250 0.272200.305710.224140.225010.322870.792960.230100.76671
TMD 0.0300 0.255770.308620.209200.210130.302970.789500.215480.76446
STMDh 0.0200 0.278960.364090.147060.154920.327100.766800.158590.76293
STMDh 0.0220 0.268250.364260.139660.148170.314050.761880.150370.76195
STMDh 0.0250 0.252570.362400.131230.140940.296880.761440.143780.76151
STMDh 0.0300 0.235780.364440.121970.133100.273720.764290.132490.76131