Article

Experimental Analysis of MCCB Interruption Behavior Under Repetitive Overcurrent Conditions for Electrical Safety in Low-Voltage Distribution Systems


1
Department of Electric and Battery Engineering, Inje University, Injero 197, Gimhae-si 50834, Gyeongsangnam-do, Republic of Korea
2
Department of Electrical and Control Engineering, Cheongju University, 298 Daeseong-ro, Cheongwon-gu, Cheongju-si 28503, Chungcheongbuk-do, Republic of Korea
3
School of Social Safety System Engineering and Research Center for Safety and Health, Hankyoung National University, 327 Chungang-ro, Anseong-si 17579, Gyeonggi-do, Republic of Korea
*
Authors to whom correspondence should be addressed.
Actuators 2026, 15(7), 361; https://doi.org/10.3390/act15070361
Submission received: 22 May 2026 / Revised: 22 June 2026 / Accepted: 24 June 2026 / Published: 1 July 2026
(This article belongs to the Section Control Systems)

Abstract

A molded case circuit breaker (MCCB) is a key protective device for electrical safety in low-voltage distribution systems, and its interruption performance is closely related to arc behavior during fault-current interruption. This study experimentally analyzed variations in the interruption behavior of MCCBs under repetitive overcurrent conditions with different current magnitudes. In this study, new repetitive interruption experiments were performed under the 7 kA condition, while the 2.8 kA results reported in our previous study were used for comparison. Four MCCB products with the same model and rated specifications are prepared and denoted as Products A–D. Repetitive interruption tests are performed under the same procedure, and the voltage waveform generated during interruption is divided into the total arcing time, arc extension period, and energy consumption period. The time and energy distributions of each period are then quantitatively compared. The results showed that, from the first to the third test, the average total arcing time increased by approximately 4.68%, while e the arc extension time and arc extension voltage-area-based index increased by approximately 15.98% and 19.47%, respectively. In contrast, the energy consumption time and energy consumption voltage-area-based index decreased by approximately 5.90% and 12.87%, respectively. Although the difference between the first and second tests is relatively large, the changes between the second and third tests are small, with the total arcing time and total arcing voltage-area-based index changing by only approximately −0.57% and −0.30%, respectively. These results indicate that variations in MCCB interruption behavior under repetitive overcurrent conditions are more sensitively reflected in the time and energy distribution between the arc extension and energy consumption periods than in the total arcing time alone. Therefore, voltage-waveform-based analysis of interrupting time and energy consumption ratio can be used to evaluate interruption behavior variations and potential performance degradation of MCCBs, supporting reliability assessment for electrical safety under repetitive fault conditions.

1. Introduction

Electrical safety in low-voltage distribution systems largely depends on the ability of protective devices to rapidly and reliably interrupt overcurrent and short-circuit faults. In facilities where numerous loads operate continuously, such as industrial facilities, public infrastructure, and transportation systems, delayed interruption or degradation of interruption performance may lead to equipment damage, power outages, electrical fire hazards, and maintenance delays. Therefore, low-voltage circuit breakers should be evaluated not only in terms of their ability to interrupt a single fault current under rated conditions, but also in terms of whether they can maintain stable interruption performance under abnormal current conditions that may occur repeatedly in actual operating environments.
In actual low-voltage electrical facilities, the same molded case circuit breaker may be required to interrupt repetitive fault currents within a short time interval during reclosing before the fault cause has been completely removed, intermittent short circuits, load abnormalities, or test operation after maintenance. Even when such repetitive interruptions are apparently successful, thermal and electrical stresses may accumulate on the contacts, splitter plates, and inside the arc chamber. These accumulated stresses can affect subsequent interruption behavior, including arc movement, arc voltage formation, the energy consumption period, and the total arcing time. Therefore, to evaluate the electrical safety of MCCBs, it is necessary to analyze not only whether interruption is successfully completed, but also how internal interruption behavior changes under repetitive fault-current conditions based on quantitative voltage-waveform analysis.
Dielectric recovery after current interruption is an important factor in evaluating circuit breaker performance. Degui and Xingwen measured dielectric recovery strength and reignition phenomena in AC contactors [1]. Their study showed that reignition can occur when sufficient dielectric recovery is not achieved between the contacts after interruption, indicating that the recovery process after the current-zero point should be considered when evaluating the stable interruption performance of protective devices. Shea analyzed the influence of arc chamber wall materials on arc-gap dielectric recovery voltage and later examined the effect of gassing arc chamber wall materials on post-current-zero recovery voltage breakdown [2,3]. These studies show that interruption performance is affected not only by contact opening speed or fault-current magnitude, but also by the material characteristics of the arc-extinguishing space, gas generation, and dielectric recovery conditions after current zero. However, these studies mainly focused on dielectric recovery voltage, reignition, and arc chamber material properties, and did not sufficiently address how arcing time and the energy consumption period change when the same MCCB repeatedly interrupts short-circuit currents.
Research has also been conducted on arc behavior inside low-voltage circuit breakers and the role of splitter plates. Iturregi et al. analyzed electric arcs in low-voltage circuit breakers through experiments and simulations, showing that the internal structure of the breaker and electrical conditions have a significant influence on arc movement and extinction [4]. Lindmayer et al. investigated the arc-splitting process between metal plates in low-voltage arc chutes and explained the mechanism by which splitter plates divide the arc into several smaller arcs and increase the arc voltage [5]. Shin et al. experimentally analyzed arc motion near splitter plates and showed that arc movement around the splitter plates is closely related to interruption performance [6]. These studies demonstrate that splitter plates and arc chutes are key structures that determine the interruption performance of MCCBs. However, most previous studies have focused on arc movement, splitting, and extinction mechanisms under specific structural conditions. Experimental comparisons of time-period variations and differences among identical products under repetitive interruption conditions remain limited.
Recently, studies using electrical signals such as voltage, current, and arcing power have increased for condition monitoring and lifetime evaluation of circuit breakers. Zhang et al. proposed an arcing-power-based algorithm for monitoring electrical wear of circuit breaker contacts and showed that electrical signals measured during interruption can be used for contact wear and condition assessment [7]. Li et al. proposed a method for early detection of circuit breaker health degradation based on electrical quantity monitoring [8]. These studies indicate that electrical signal analysis can be an effective approach for evaluating the condition of circuit breakers. However, existing studies have mainly focused on condition monitoring algorithms, contact wear, and fault detection. Experimental studies that divide the voltage waveform into contact separation, arc extension, current zero, energy consumption, and total arcing time under repetitive short-circuit interruption conditions, and then relate the changes in each period to interruption performance degradation, are still insufficient.
Previous studies on MCCB interruption phenomena and splitter plates have addressed circuit models of the interruption process, arc voltage formation, and improvement of dielectric recovery strength [9,10]. These studies provide useful background for understanding the interruption phenomena inside MCCBs and the influence of splitter plates on dielectric recovery and arc-extinguishing performance. In addition, studies have been conducted on condition monitoring and fault detection of circuit breakers using arc models [11], the analysis of arc interruption characteristics in low-voltage circuit breakers under rated-current conditions [12], and multiple-arc phenomena using black-box arc models [13]. Studies have also been reported on arc voltage and current characteristics in low-voltage direct-current systems [14] and on the improvement of repulsive force in MCCBs [15]. These studies show that arc phenomena, current interruption characteristics, and structural design factors inside circuit breakers have significant effects on interruption performance. Nevertheless, further research is needed to compare the influence of repetitive fault-current inflow on identical MCCB products and to analyze how arc extension time, energy consumption time, and total arcing time vary with repeated interruption.
In actual railway low-voltage power facilities, circuit breakers may experience not only a single fault event but also repeated exposure to high currents during reclosing before fault identification, intermittent short circuits, load abnormalities, and test operation after maintenance. For example, when an MCCB trips in a tunnel drainage pump circuit due to motor winding failure or cable insulation damage, and the breaker is reclosed before the fault has been completely removed, the same breaker must interrupt a high overcurrent or short-circuit current again. If this process is repeated, the contacts and splitter plates inside the breaker are exposed to repeated arc energy, which may alter the arc movement time and energy consumption characteristics in subsequent interruption operations. Such situations can occur in railway stations or tunnel facilities where rapid restoration is required, highlighting the need to experimentally verify changes in MCCB performance after repetitive interruption.
Therefore, to evaluate the interruption performance degradation of MCCBs under repetitive short-circuit interruption conditions, it is necessary to conduct repeated experiments under the same conditions using multiple products of the same model and to compare the voltage waveforms during each interruption process. Even when MCCBs have the same model and rated specifications, their interruption characteristics may vary depending on manufacturing tolerances, contact conditions, small differences in internal structure, and the degree of thermal damage accumulated during repeated interruptions. Thus, rather than generalizing performance changes from a single product, it is necessary to compare interruption time and energy consumption characteristics using several identical MCCB products.
In this study, four MCCB products with the same model and rated specifications are prepared and denoted as Products A–D. Each product is subjected to three repetitive interruption tests under the same short-circuit conditions. The voltage waveform generated during the interruption process is measured and divided into contact separation, arc extension, current zero, energy consumption, and total arcing time. In particular, this study focused on the energy consumption period after the arc reached the splitter plates and analyzed how the arc-extinguishing process and energy consumption characteristics changed as repetitive interruption progressed. Through this analysis, this study evaluates interruption performance degradation of MCCBs under repetitive short-circuit conditions and verifies the effectiveness of voltage-waveform-based time-period analysis as a method for assessing circuit breaker performance degradation.
This study contributes to the evaluation of MCCB interruption performance in several ways. First, repetitive short-circuit interruption tests are conducted on four MCCB products with the same model and rated specifications, allowing changes in interruption characteristics and variations among individual products to be compared. Second, the interruption process is divided into detailed time periods based on the voltage waveform, and the changes in arc extension time, energy consumption time, and total arcing time are analyzed under repetitive interruption conditions. Third, the influence of repetitive short-circuit interruption on the energy consumption characteristics around the splitter plates is examined, providing experimental data for evaluating interruption performance degradation in MCCBs. These results are expected to be useful for reliability assessment and maintenance criteria for MCCBs installed in facilities where repeated fault-current inflow may occur, such as railway stations, tunnel electrical rooms, and low-voltage distribution panels in railway depots.

2. Methods of Low-Voltage Circuit Breaker

Power system circuit breakers play an important role in protecting loads from the overcurrents generated within the system or introduced from external sources. A circuit breaker must supply the normal current permitted by the system to the load with minimal loss, while accurately detecting and rapidly interrupting overcurrent when it occurs. Various types of circuit breakers are installed depending on the required interrupting current and capacity of the system. In particular, circuit breakers used in high-voltage transmission systems and those used in low-voltage distribution systems differ in their operating mechanisms and insulating media. High-voltage circuit breakers generally separate their contacts through linear motion and use arc-extinguishing media such as SF6 gas or insulating oil rather than air. In contrast, low-voltage circuit breakers typically use a driving mechanism in which a moving electrode with a rotational motion separates from a fixed electrode, and they operate in a vacuum or air. In addition, they include components such as splitter plates to consume the energy of the overcurrent and extinguish the arc.
Low-voltage circuit breakers are among the protective devices that have the greatest impact on users because they are installed in large numbers and are located closest to the end-use facilities. For rapid and accurate interruption, a low-voltage circuit breaker consists of three main components. The first is the sensing unit, which determines whether the incoming current is a normal current or an overcurrent. The sensing unit determines whether the operating mechanism should be activated according to the magnitude of the incoming current. For currents exceeding the normal operating range, it generally performs thermal trip, instantaneous trip, and short-circuit trip operations.
These trip operations are determined by the magnitude of the overcurrent, and each operation is performed by a separate mechanism. The second component is the operating mechanism, which separates the contacts based on the judgment of the sensing unit. The operating mechanism of a low-voltage circuit breaker generally uses a spring to maintain contact under normal current conditions. When an overcurrent flows into the breaker, the latch is released by the sensing unit, and the contacts are rapidly separated. The final component is the arc-extinguishing unit, which removes the arc generated between the contacts. The arc-extinguishing unit consists of components such as splitter plates, which extend, cool, and divide the arc while consuming the energy of the incoming overcurrent, and arc runners, which assist the movement of the arc generated between the contacts. In addition, the arc-extinguishing unit produces a current-limiting effect by consuming energy at the splitter plates, thereby limiting the magnitude of the incoming overcurrent and advancing the current-zero point.

2.1. Interruption Process of Low-Voltage Circuit Breakers

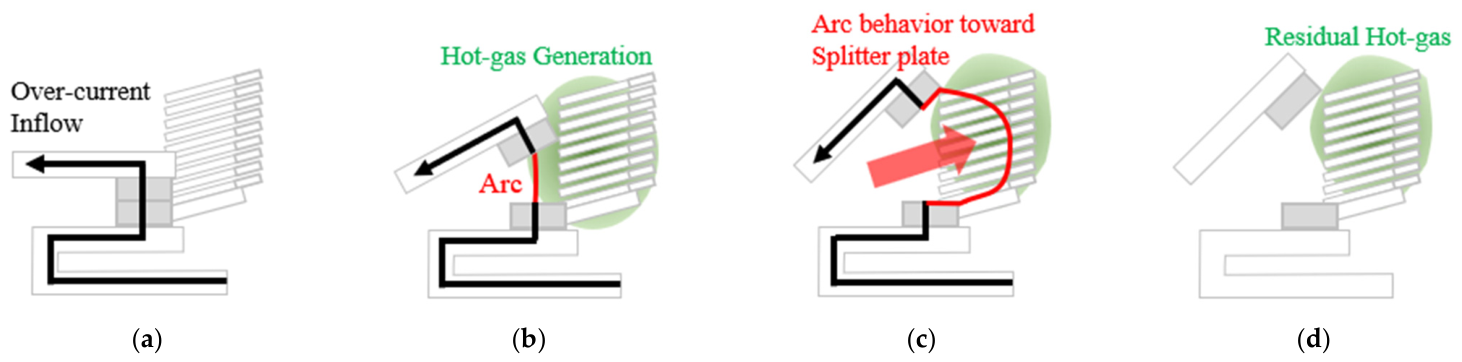
Figure 1 schematically illustrates the operating process of a low-voltage circuit breaker. The overall interruption process of a low-voltage circuit breaker refers to the period from the moment an overcurrent inflow is detected to the current-zero point at which arc extinction is completed. When the circuit breaker is in the on state, the contacts are closed while the closing spring of the operating mechanism stores elastic potential energy. Under this condition, the breaker conducts normal current without interruption.
When an overcurrent flows into the breaker, the sensing mechanism releases the restraint of the operating spring according to the corresponding trip mode. The energy stored in the spring is then released as kinetic energy, causing the moving electrode to separate from the fixed electrode. At this moment, an arc is formed between the two contacts, as shown in Figure 1b, accompanied by the generation of high-temperature and high-pressure thermal gas inside the arc chamber [10].
After contact separation, the pressure produced by the thermal gas and the Lorentz force acts inside the arc chamber, and depending on the product design, the arc formed between the contacts moves toward the splitter plates with the assistance of structural components such as arc runners. Once the arc reaches the splitter plates, it is extinguished through cooling, elongation, and splitting processes depending on the shape and material properties of the splitter plates [16]. At the same time, the splitter plates consume the energy of the overcurrent, thereby limiting its magnitude and advancing the current-zero point.
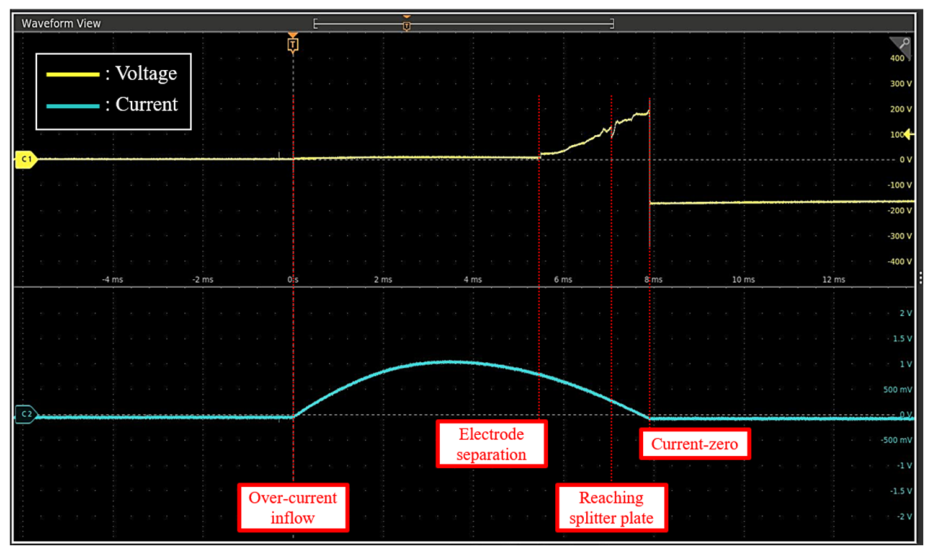
These operating processes can also be identified from the voltage waveform across the circuit breaker and the waveform of the incoming current during interruption. Figure 2 shows the voltage and current waveforms during the interruption process. When an overcurrent flows into the circuit breaker, a waveform associated with the contact resistance between the contacts appears while the sensing unit determines which trip operation should be performed based on the multiple of the rated current. Once the contacts begin to separate, the voltage waveform rises sharply. Thereafter, as the gap between the contacts increases and the arc moves toward the splitter plates, the arc is elongated. Accordingly, a waveform corresponding to an increase in arc resistance appears. At the moment when the arc reaches the splitter plates, a change in slope occurs, accompanied by oscillation and an increase in the waveform. During this process, the current waveform decreases due to the consumption of overcurrent energy. Finally, arc extinction can be observed at the current-zero point. The current waveform shows a difference between the crest and the tail and exhibits a non-sinusoidal shape rather than a sinusoidal waveform. This indicates a current-limiting effect in which the magnitude of the overcurrent is reduced and the current-zero point is advanced owing to the consumption of overcurrent energy by the splitter plates.

2.2. Specific Point of Transition During an Interruption Process

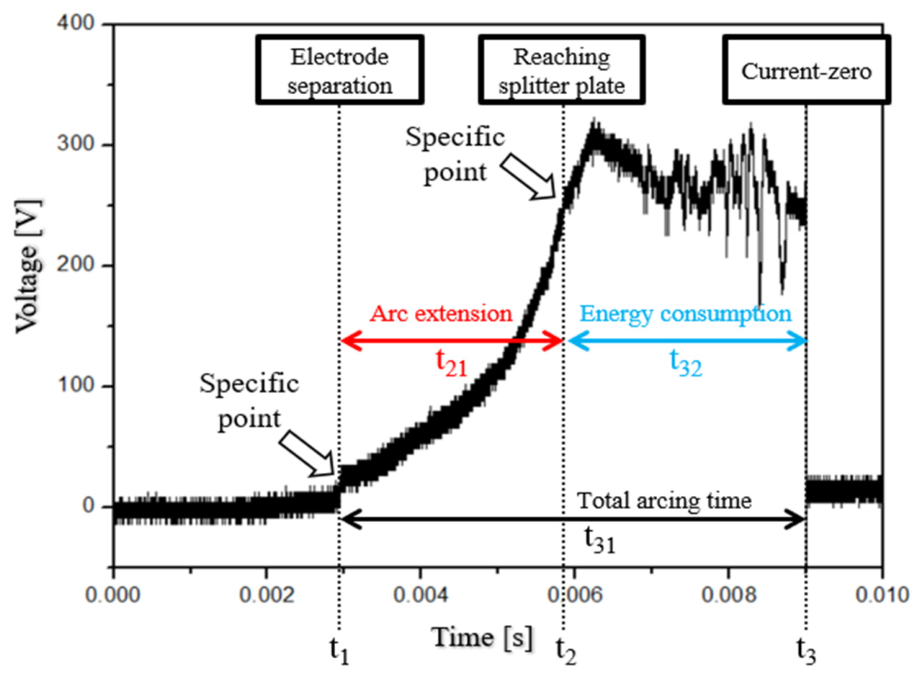
As described above, the interruption process of the circuit breaker shows that specific points at which the slope changes appear in the voltage waveform. In particular, these points can be used to explain arc behavior during circuit breaker operation and to compare the performance of circuit breakers. Figure 3 shows the classification and definition of these specific points in the voltage waveform.
At t1, the point where the contacts of the circuit breaker separate, a sharp increase appears between the waveform caused by contact resistance and the waveform caused by arc elongation. Thereafter, as the arc length increases, a waveform corresponding to the increasing arc resistance appears. Next, in the waveform at t2, which represents the moment when the arc reaches the splitter plates, an inflection point can be identified in the waveform with an increasing slope. In this study, t1 and t3 were determined from the sharp voltage rise and the current-zero point, respectively, while t2 was selected based on the change in voltage slope and the beginning of oscillatory behavior, rather than a single noisy point.
In addition, the interval from contact separation to the point where the arc reaches the splitter plates can be expressed as t21, which represents the arc extension period. The arc that reaches the splitter plates shows an oscillating voltage waveform while consuming the energy of the overcurrent. If the current-zero point, at which the arc is extinguished, is denoted as t3, the period during which energy is consumed at the splitter plates can be expressed as t32. The entire period during which the arc exists between the two electrodes refers to the combined interval of the two periods described above, and it can be defined as t31.

2.3. Electromagnetic Repulsion Force at Electrode

As mentioned above, when an overcurrent flows into a circuit breaker, the sensing unit operates different mechanisms depending on how many times greater the incoming overcurrent is than the rated current.
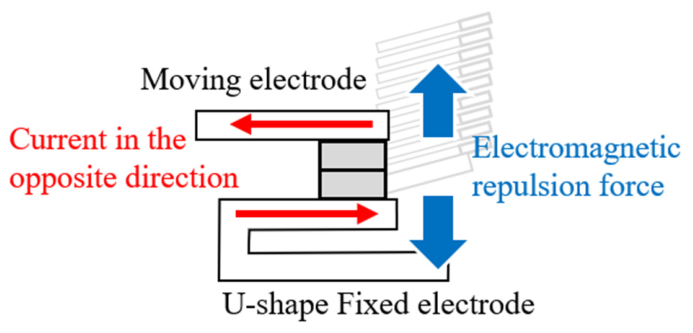
A short-circuit trip operates when an overcurrent greater than the operating range of the instantaneous trip flows into the breaker. Although thermal trip and instantaneous trip use different sensing mechanisms, both operate by releasing the latch of the operating mechanism and separating the contacts. In contrast, a short-circuit trip is characterized by the forced separation of the contacts due to the electromagnetic repulsive force generated at the contacts by the incoming overcurrent [17]. Figure 4 shows a schematic diagram of the electromagnetic repulsive force.
The electromagnetic repulsive force is generated by designing the fixed electrode as a U-shaped bent conductor, so that the current path in the fixed electrode is opposite to that in the moving electrode. The magnetic force produced by the current flowing through each conductor is used for contact separation, and the magnitude of the repulsive force is proportional to the current flowing through the conductors. Therefore, as the incoming short-circuit current increases, a greater repulsive force is generated, which helps the circuit breaker operate rapidly. The electromagnetic repulsive force can be expressed as follows [15]:
F E d = F H o l m + F L o r e n t z
As shown in Equation (1), the electromagnetic repulsive force consists of the Holm force and the Lorentz force, and it plays an important role in contact separation during short-circuit tripping. The Holm force is a repulsive force caused by the magnetic flux density generated by the current concentrated in a very small contact area when the electrodes are in contact, and it can be expressed as follows:
F H o l m = μ 0 I 2 8 π × l n ( 8 π H A μ 0 I 2 )
where μ0 is the permeability of free space [H/m], I is the current [A], H is the hardness of the material [N/m2], and A is the area of the electrode [m2]. Due to the U-shaped fixed electrode, the direction of the current flowing through the moving electrode becomes opposite to that flowing through the fixed electrode. Therefore, when currents flowing through two adjacent straight conductors are in opposite directions, the magnetic fields generated by the currents are applied in opposite directions, resulting in a repulsive force between the two conductors. This Lorentz force can be expressed as follows:
F L o r e n t z = 2 × 10 − 7 I 2 × l e d e
where le is the length of the electrode arm [m], and de is the distance between the electrodes [m]. From the equations, it can be confirmed that both the Holm force and the Lorentz force are proportional to the square of the current. Therefore, as the magnitude of the incoming overcurrent increases, the electromagnetic repulsive force also increases, resulting in a reduction in the contact opening time. Most MCCBs have a short-circuit trip function, and in the tested MCCB structure, a U-shaped fixed electrode forms an opposite current path with the moving electrode, generating an electromagnetic repulsive force that helps rapidly separate the contacts and interrupt the overcurrent as the incoming current increases.

3. Experimental Conditions

To analyze changes in the interruption behavior of low-voltage circuit breakers according to the magnitude of repetitively applied overcurrent, a commercially available low-voltage circuit breaker with the basic components of such devices is selected as the test object. In addition, an experimental system consisting of a power source for simulating overcurrents and measurement equipment is constructed, and an experimental sequence is designed to analyze the degradation of the low-voltage circuit breaker caused by repetitive operation.

3.1. Equipment Under Test

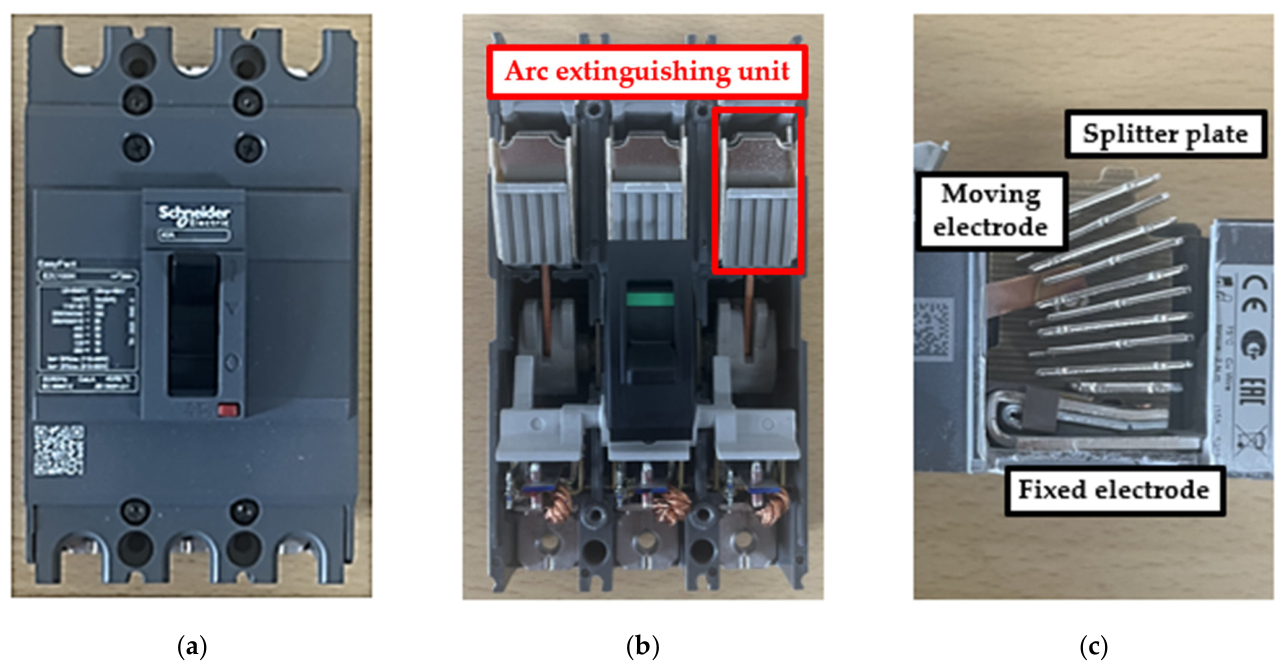
Figure 5 shows the commercially available low-voltage circuit breaker used in this study. The tested circuit breaker is the EZC100H3040 model manufactured by Schneider Co., Ltd., Rueil-Malmaison, France. Since this model has the most basic structure of MCCB, such as electrode, splitter plate, and vent, it is selected to analyze the operation characteristics representatively. Its ampere frame, which determines the rated current capacity and physical size that the circuit breaker can withstand without damage, is 100 AF. The rated current of the circuit breaker is 40 A, and its rated ultimate short-circuit breaking capacity (Icu) is 100 kA at AC 220 V and 10 kA at AC 550 V.
Figure 5a shows the external structure of the circuit breaker, whereas Figure 5b shows its internal structure and arc-extinguishing unit. Figure 5c presents the internal structure of the arc-extinguishing unit. This product represents the most typical structure of a low-voltage circuit breaker, consisting of a fixed electrode, a moving electrode, and splitter plates without any additional internal mold.

3.2. Overcurrent Inflow System

To analyze the interruption operation of a low-voltage circuit breaker, an overcurrent exceeding the rated current must be applied. In addition, an overcurrent of sufficient magnitude is required not only to ensure the proper operation of the sensing unit but also to analyze degradation caused by repetitive current inflow. In addition, the product used in the experiment has a specification of 100 kA for the rated short-circuit breaking capacity of 220 V and 10 kA for 550 V. Considering the circuit breaker specifications, the experimental power source to generate the maximum current that can be measured and configured in the laboratory environment is considered.
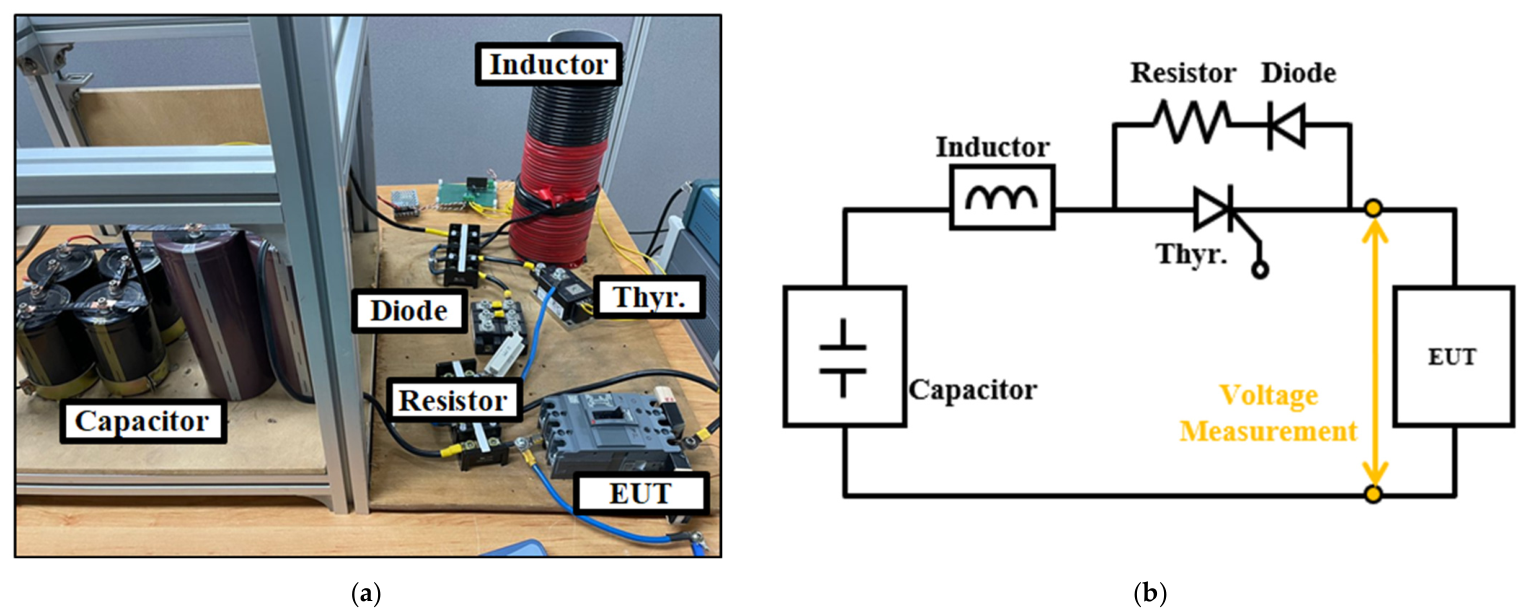
Figure 6 shows the configuration and circuit of the overcurrent inflow system used in the experiment. The capacitors are configured in series and parallel by considering their withstand voltage and capacitance, and the inductor is wound so that the resonant frequency with the capacitors becomes 60 Hz. The 220 V, 60 Hz commercial power supply is stepped up through a transformer, and the capacitors are charged using a diode-bridge full-wave rectifier. The inductor is used to adjust the frequency of the output overcurrent.
In the forward direction, the overcurrent is applied to the low-voltage circuit breaker by applying a gate signal to the thyristor. In the reverse direction, the flow and magnitude of the incoming overcurrent are controlled using diodes and a resistor. The thyristors and diodes used in the circuit are MCC312-16io1 (IXYS Corporation Co., Ltd., Milpitas, CA, USA) and MPKC2SA200U60 (MagnaChip Co., Ltd., Seoul, Republic of Korea), respectively, and they are connected in parallel considering their withstand voltage. Finally, the resistance is 2.5 Ω. A difference occurred between the designed and measured magnitudes of the output overcurrent, which is considered to be caused by parasitic components in the connection terminals and fastening parts.
The charging voltage of the capacitors is 640 V, and the magnitude of the output overcurrent is 7 kA, which is approximately 170 times the rated current of the commercially available circuit breaker used in the experiment. Therefore, the sensing unit of the low-voltage circuit breaker performed a short-circuit tripping operation, and this experimental condition clearly revealed degradation and performance changes in the circuit breaker as the number of repetitions increased. Table 1 presents the specifications and comparison between the system used in the previous study [18] and the system used in this study.

3.3. Test Conditions

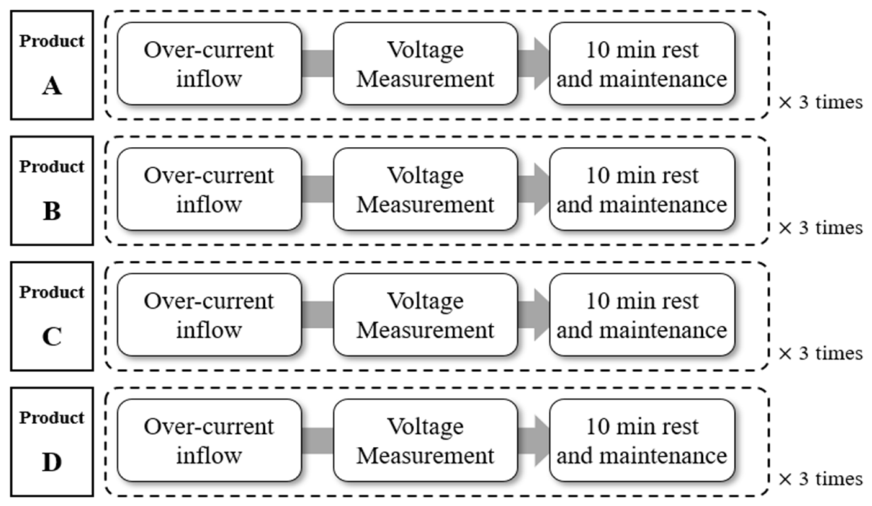
Figure 7 shows a schematic diagram of the experimental sequence. To evaluate the interruption performance of the circuit breaker according to overcurrent inflow, an overcurrent approximately 170 times greater than the rated current is applied to the low-voltage circuit breaker. In addition, to analyze performance changes caused by repetitive operation, three repeated tests are performed for each circuit breaker. Between each test, a rest period of more than 10 min is provided to maintain the electrodes and discharge the thermal gas from the arc-extinguishing unit.

4. Results

When the voltage waveform across a low-voltage circuit breaker is measured during the interruption operation, inflection points appear in the waveform according to the behavior of the arc generated between the contacts. By analyzing these specific times in the waveform and the area corresponding to the waveform energy, degradation of the circuit breaker and changes in its interruption behavior can be evaluated when overcurrent is repetitively applied. In this study, overcurrent application tests are performed three times for each of the four circuit breakers, and the specific times and consumed energy are analyzed from the resulting waveforms.

4.1. Repetitive Interruption Characteristics at 7 kA

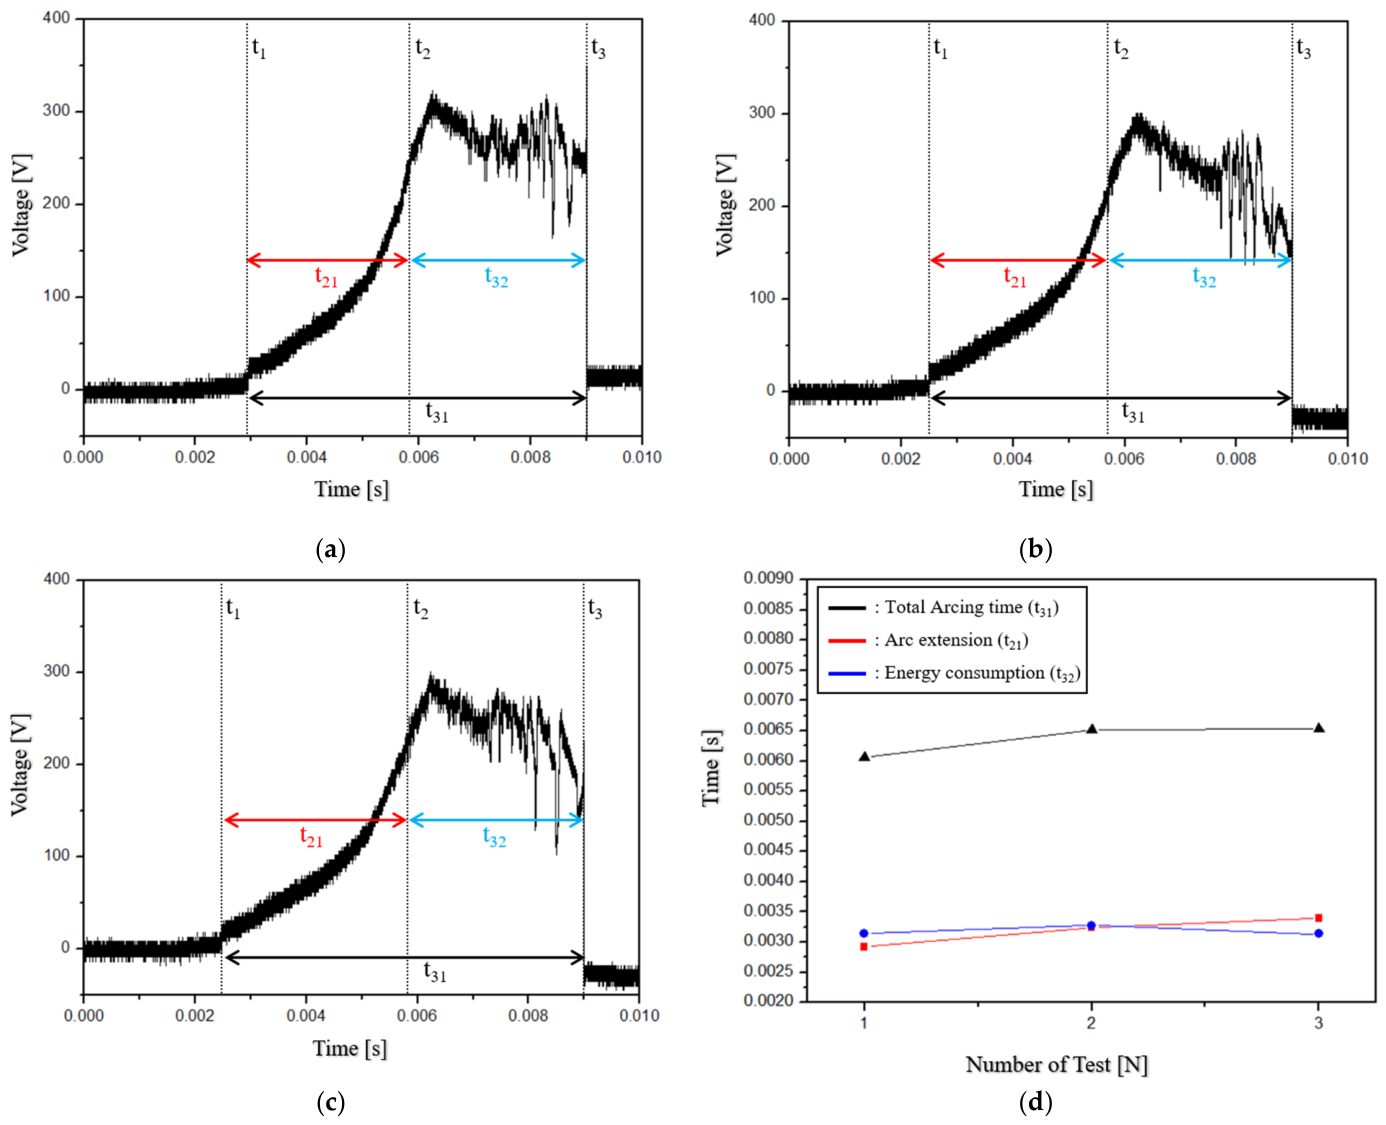
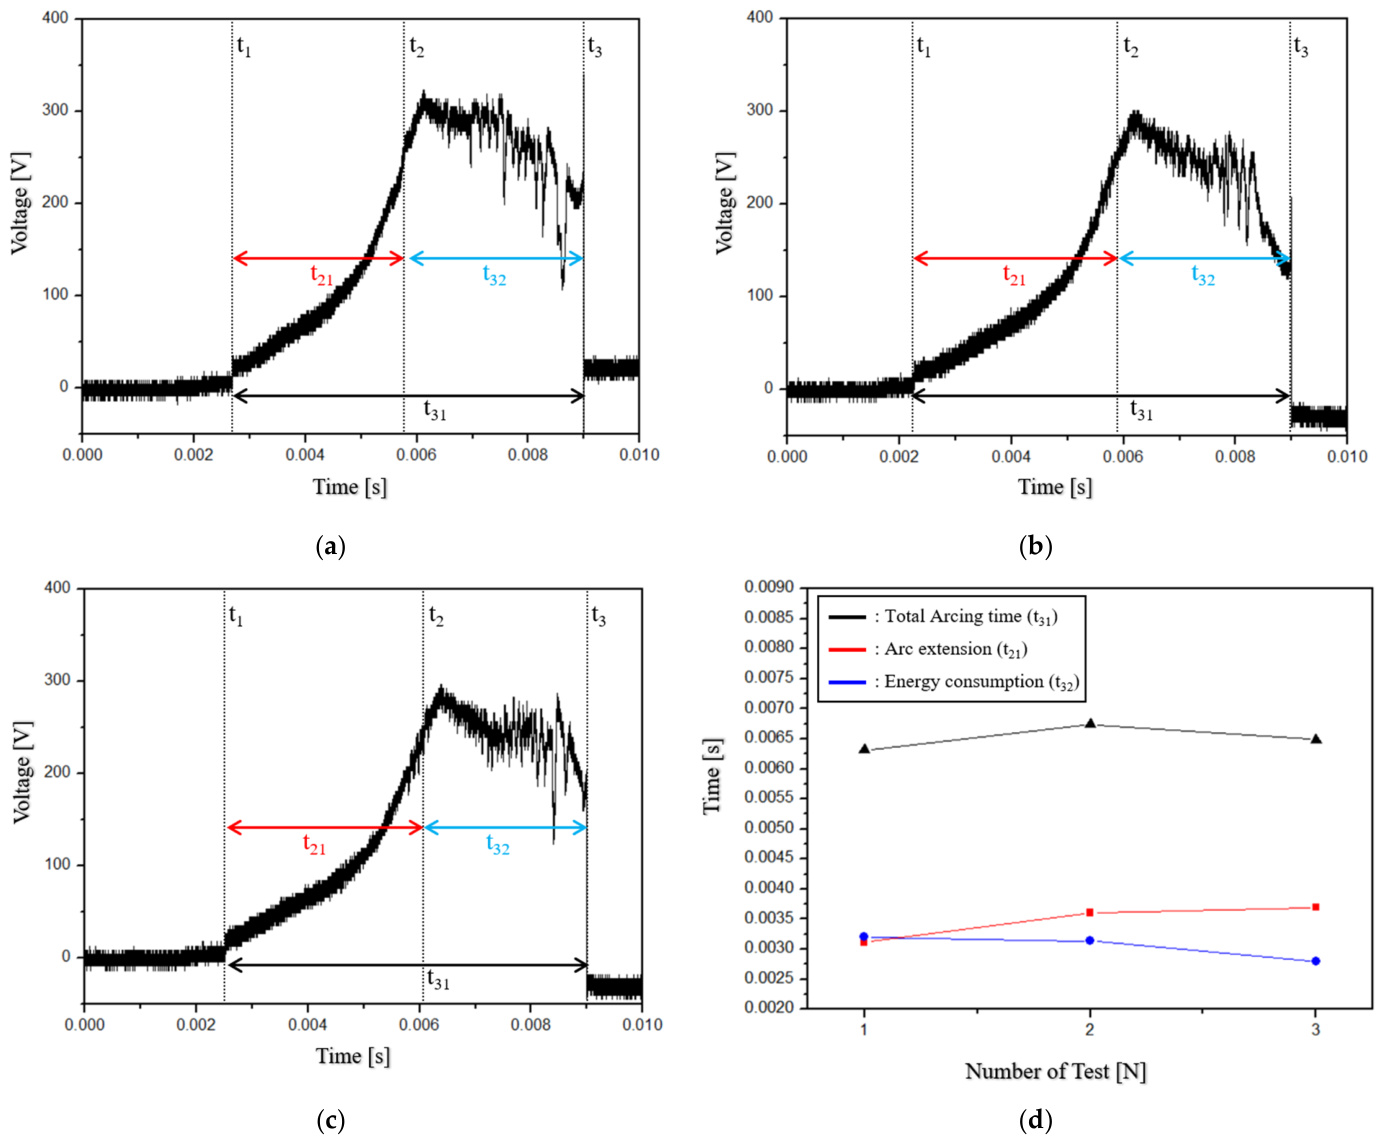
Figure 8 shows the experimental waveform results of Product A and the tendency of the specific time intervals. The time required from contact separation to the point at which the arc reaches the splitter plates, denoted as t21, is 0.002920 s in the first overcurrent application test. In the second and third tests, t21 is 0.003242 s and 0.003398 s, respectively. The interval t32 represents the period from the point at which the arc reaches the splitter plates to the current-zero point. In the first overcurrent application test, t32 is 0.003135 s. In the second and third tests, t32 is 0.003274 s and 0.003135 s, respectively.
The interval t31, which is the sum of t21 and t32, represents the entire process from arc formation between the contacts to arc extinction at the current-zero point. The measured t31 values are 0.006055 s in the first overcurrent application test, 0.006516 s in the second test, and 0.006532 s in the third test. Figure 8d shows the tendency of each time interval for Product A. These results indicate that when the circuit breaker operates repetitively under overcurrent inflow, the time required for the arc to elongate after its formation between the contacts gradually increases. In addition, the total arcing time slightly increases compared with the initial operation. The energy consumption period at the splitter plates corresponds to the remaining time in t31, excluding t21.
Figure 9 shows the experimental waveform results and the tendency of Product B. As the tests are repeated, t21 is measured as 0.003111 s, 0.003607 s, and 0.003696 s, respectively. The corresponding t32 values are 0.003204 s, 0.003135 s, and 0.002789 s, respectively. Finally, t31, which represents the total arc formation period, is measured as 0.006315 s, 0.006741 s, and 0.006485 s, respectively. Figure 9d shows the tendency of each time interval for Product B. The t31 value increased in the second test and then slightly decreased in the third test. However, as observed in Product A, t21 increased as the tests were repeated. The t32 interval corresponds to the remaining portion of t31 excluding t21, and its variation is therefore associated with the increase in t21.
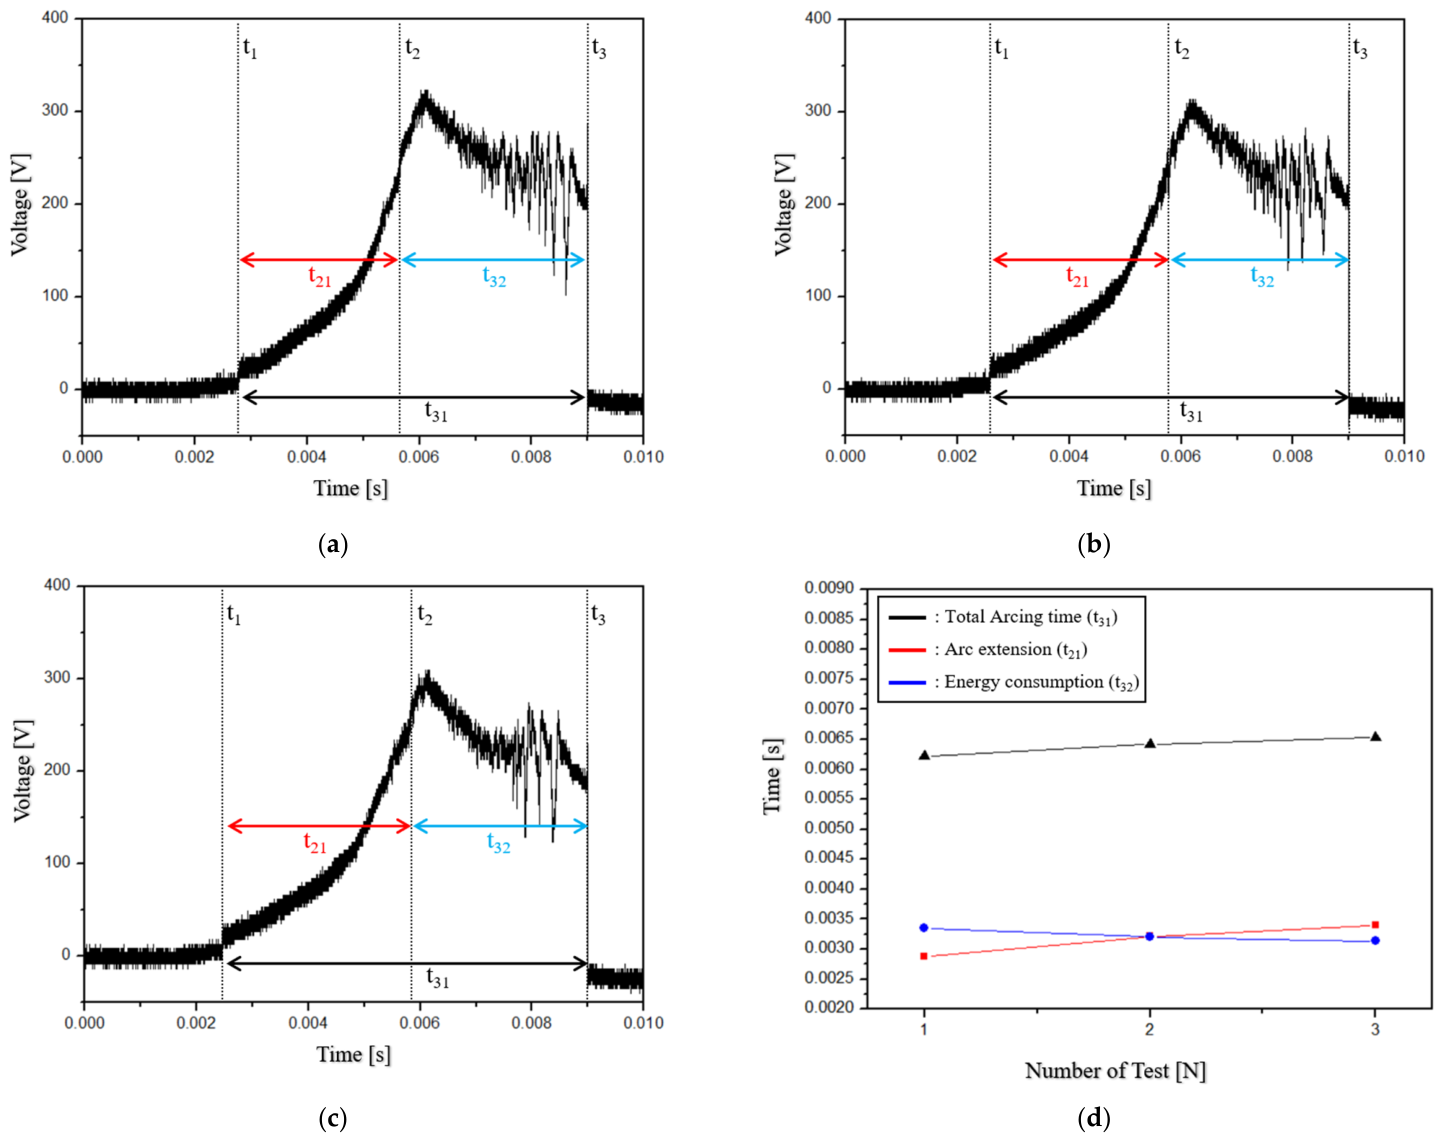
Figure 10 shows the experimental waveform results and the tendency of Product C. As the tests are repeated, t21 is measured as 0.002876 s, 0.003213 s, and 0.003403 s, respectively. The corresponding t32 values are 0.003345 s, 0.003204 s, and 0.003135 s, respectively. The t31 values are 0.006220 s, 0.006417 s, and 0.006538 s, respectively. Figure 10d shows the tendency of each time interval for Product C. These results show that the total arcing time gradually increased as the tests were repeated. In addition, the time required for arc generation and elongation increased, whereas the time during which energy is consumed at the splitter plates decreased.
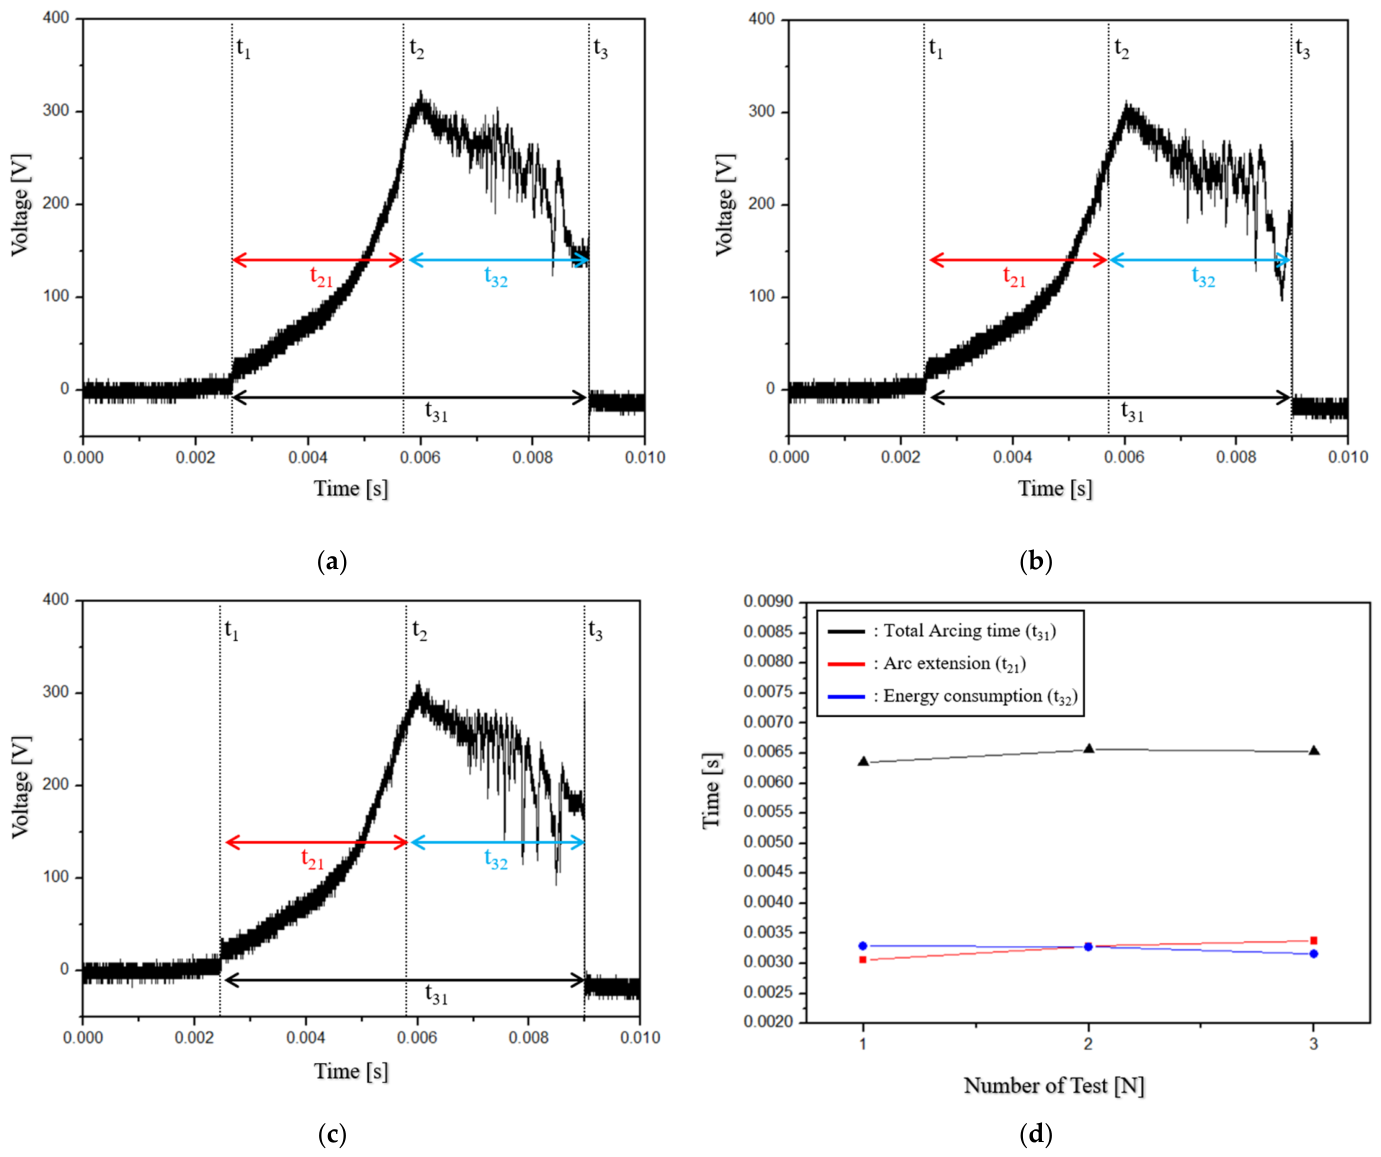
Figure 11 shows the experimental waveform results and tendency of Product D. As the tests are repeated, t21 is measured as 0.003057 s, 0.003286 s, and 0.003379 s, respectively. The corresponding t32 values are 0.003292 s, 0.003275 s, and 0.003152 s, respectively. The t31 values are 0.006349 s, 0.006561 s, and 0.006531 s, respectively. Figure 11d shows the tendency of each time interval. These results show that t31 slightly increased as the tests were repeated. In addition, t21 gradually increased, as observed in the previous products. In contrast, t32 gradually decreased as t21 increased.
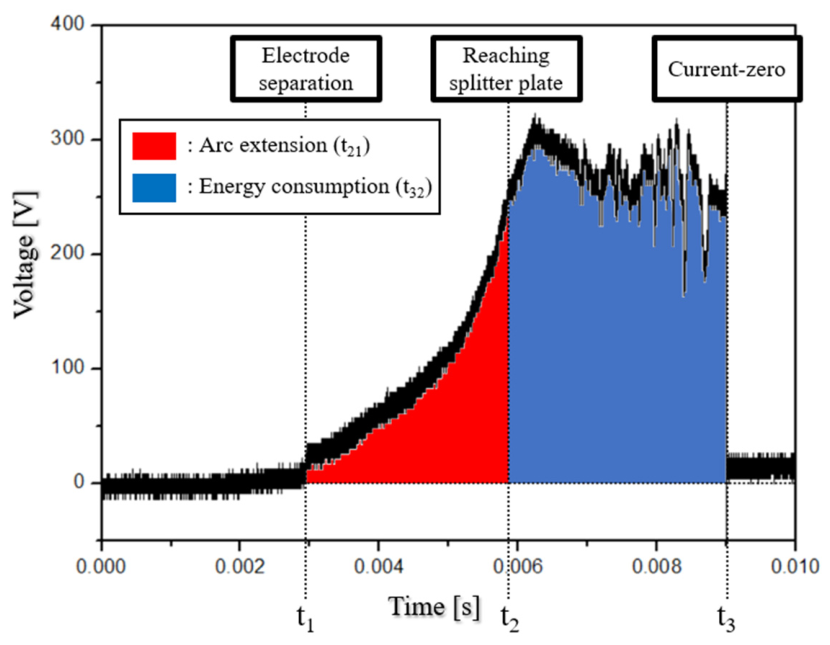
The energy in the measured waveform is represented by the product of the measured voltage and current. During the interruption operation of the circuit breaker, the applied current waveform exhibits a double-exponential shape due to current limitation and the advancement of the current-zero point caused by the current-limiting effect. In particular, because the current waveform always becomes zero when it reaches the current-zero point, the current waveforms generally show nearly identical shapes in each test when applied under the same conditions. Therefore, by analyzing the area of each section of the voltage waveform, the energy consumed during the interruption operation of the circuit breaker can be analyzed, and changes in performance can be evaluated. Figure 12 shows the distribution of voltage-area-based energy consumed in each section during the interruption operation.
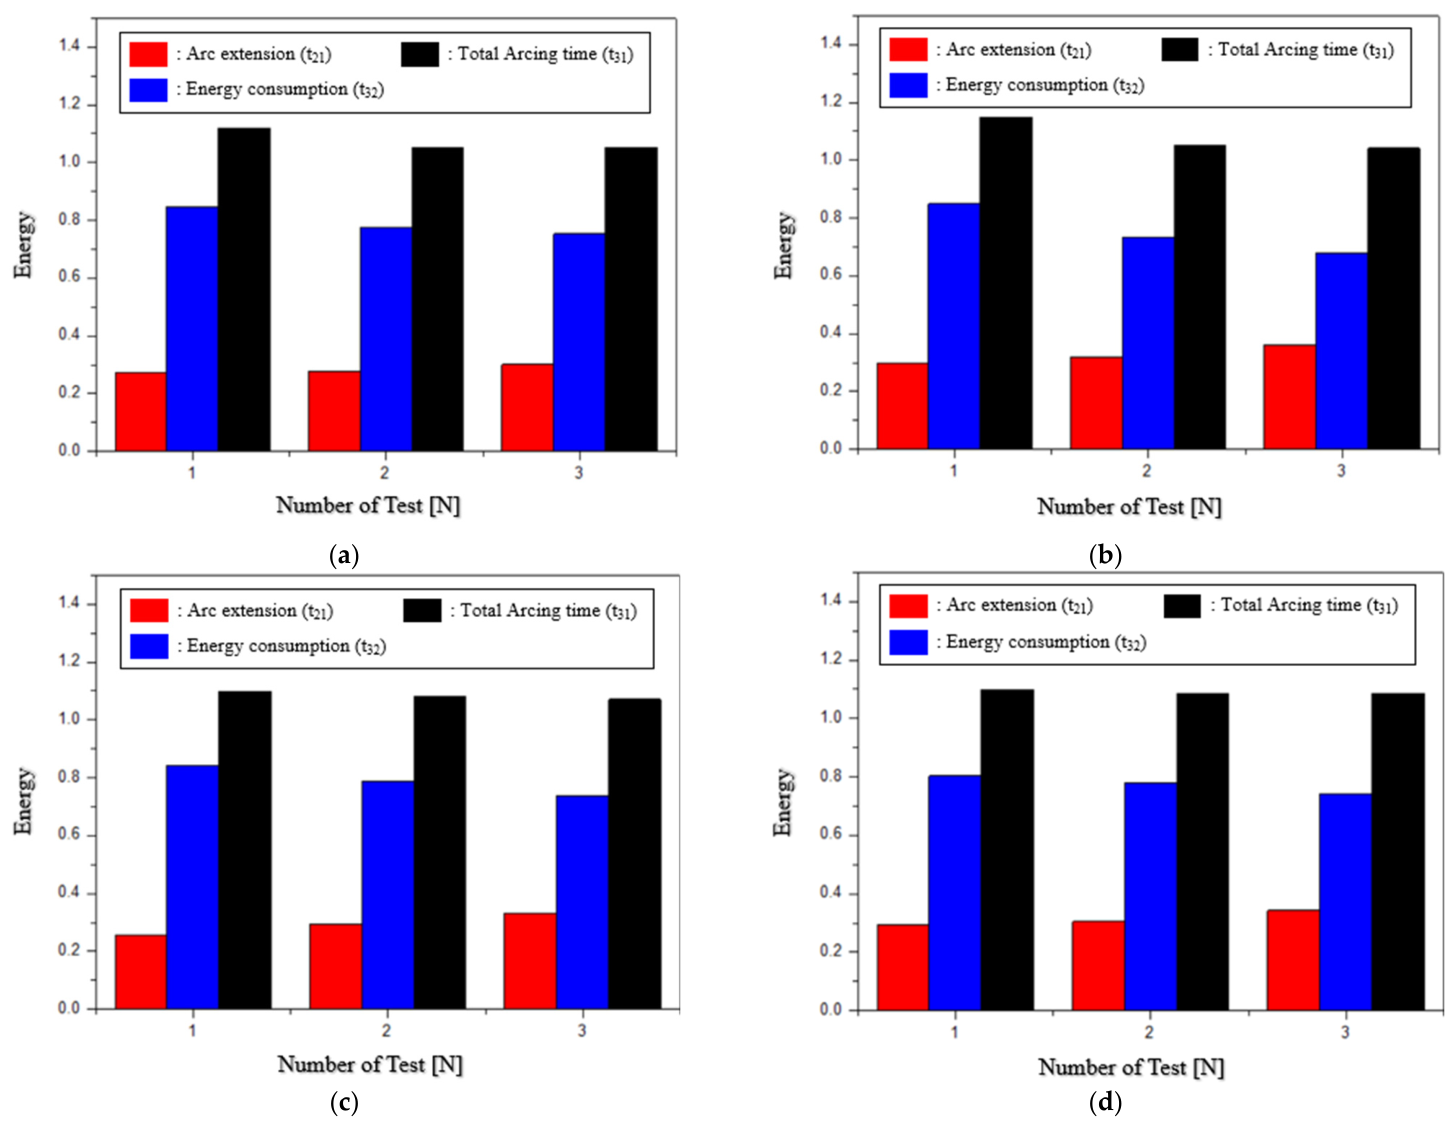
Figure 13 shows the voltage-area-based index distribution in each section according to the number of tests for each product. Figure 13a shows the results for Product A. In the t31 interval, which represents the total period during which the arc is formed between the contacts, the consumed energy values are 1.118787, 1.052123, and 1.053023 as the tests are repeated. In the t21 interval, the consumed energy values are 0.271620, 0.276234, and 0.300202, respectively, showing a gradual increase. In the t32 interval, the consumed energy values are 0.847163, 0.775889, and 0.752821, respectively, indicating a gradual decrease.
Figure 13b shows the results for Product B. In the t31 interval, the consumed energy values are 1.147955, 1.050370, and 1.041299 as the tests are repeated. In the t21 interval, the consumed energy values are 0.298646, 0.318463, and 0.362532, respectively, showing a gradual increase. In the t32 interval, the consumed energy values are 0.849309, 0.731907, and 0.678766, respectively, indicating a gradual decrease.
Figure 13c shows the results for Product C. In the t31 interval, the consumed energy values are 1.098332, 1.079188, and 1.070673 as the tests are repeated. In the t21 interval, the consumed energy values are 0.255608, 0.292241, and 0.333526, respectively, showing a gradual increase. In the t32 interval, the consumed energy values are 0.842724, 0.786947, and 0.737146, respectively, indicating a gradual decrease.
Figure 13d shows the results for Product D. In the t31 interval, the consumed energy values are 1.098280, 1.082632, and 1.086371 as the tests are repeated. In the t21 interval, the consumed energy values are 0.295333, 0.304465, and 0.343248, respectively, showing a gradual increase. In the t32 interval, the consumed energy values are 0.802947, 0.778167, and 0.743123, respectively, indicating a gradual decrease.
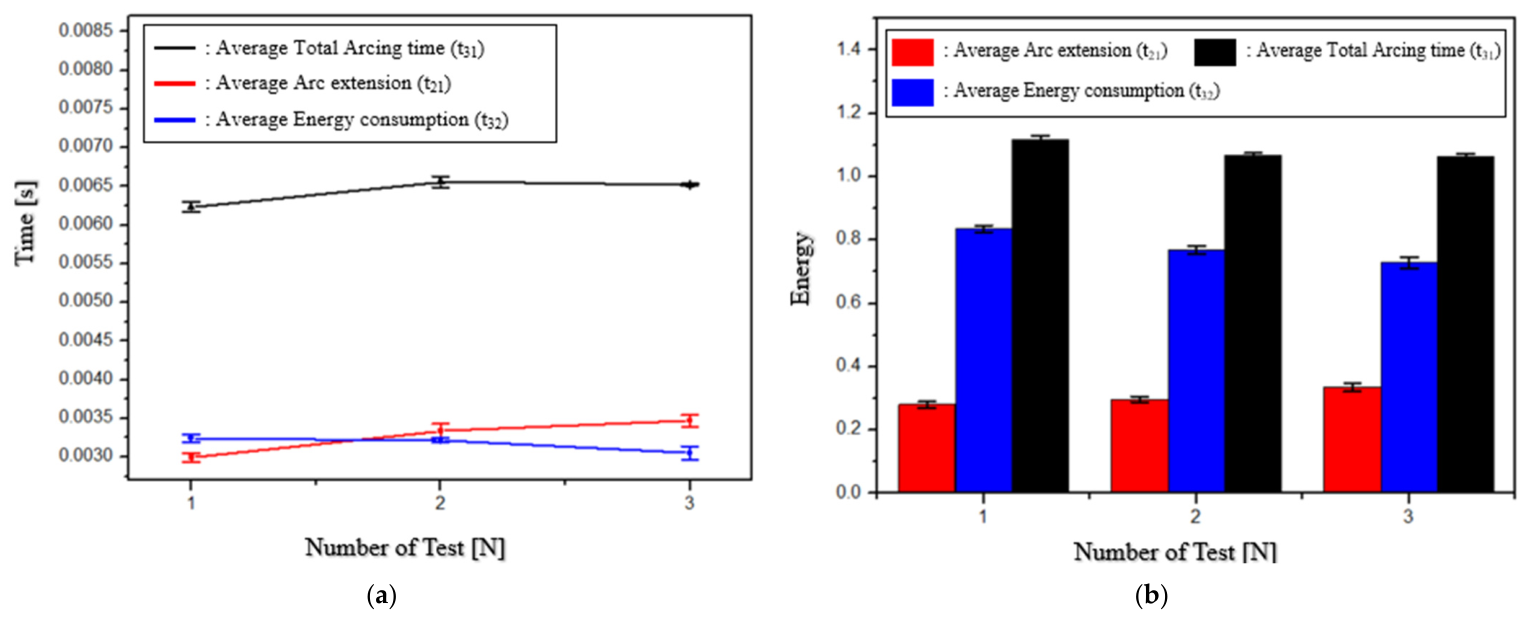
To evaluate the overall tendencies of the time durations and voltage-area-based energy consumption for the four independent circuit breakers, the results are analyzed using the average values of the measurements obtained in each test. Figure 14a shows the average values of the time intervals according to the number of tests, and Figure 14b shows the distribution of the consumed energy. The error bar is shown using the standard error, and the deviation between each sample is found to be small. The total period during which the arc is formed between the contacts, t31, gradually increased as the interruption operation is repeated under overcurrent inflow. This indicates that the time required from contact separation to the current-zero point became longer, implying a reduction in the speed of the interruption operation. In addition, the energy consumed during overcurrent interruption decreased as the operation was repeated, indicating a degradation in circuit breaker performance.
The time required for the arc formed between the electrodes at contact separation to reach the splitter plates, denoted as t21, is found to increase as the tests are repeated. This indicates that the arc duration between the electrodes increased, implying an increase in electrode damage. As the duration of this interval increased, the energy consumed in this period also increased.
Finally, in the t32 interval, which represents the period during which the splitter plates consume the energy of the overcurrent, both the duration and the consumed energy decreased as the tests were repeated. Since the current-limiting effect of the circuit breaker is achieved by consuming overcurrent energy at the splitter plates, thereby limiting its magnitude and advancing the current-zero point, the decrease in the duration and consumed energy of the t32 interval indicates a reduction in the current-limiting effect of the circuit breaker. Table 2 presents the results of the experiments conducted in this study.

4.2. Comparison of Repetitive Interruption Characteristics Between 2.8 kA and 7 kA

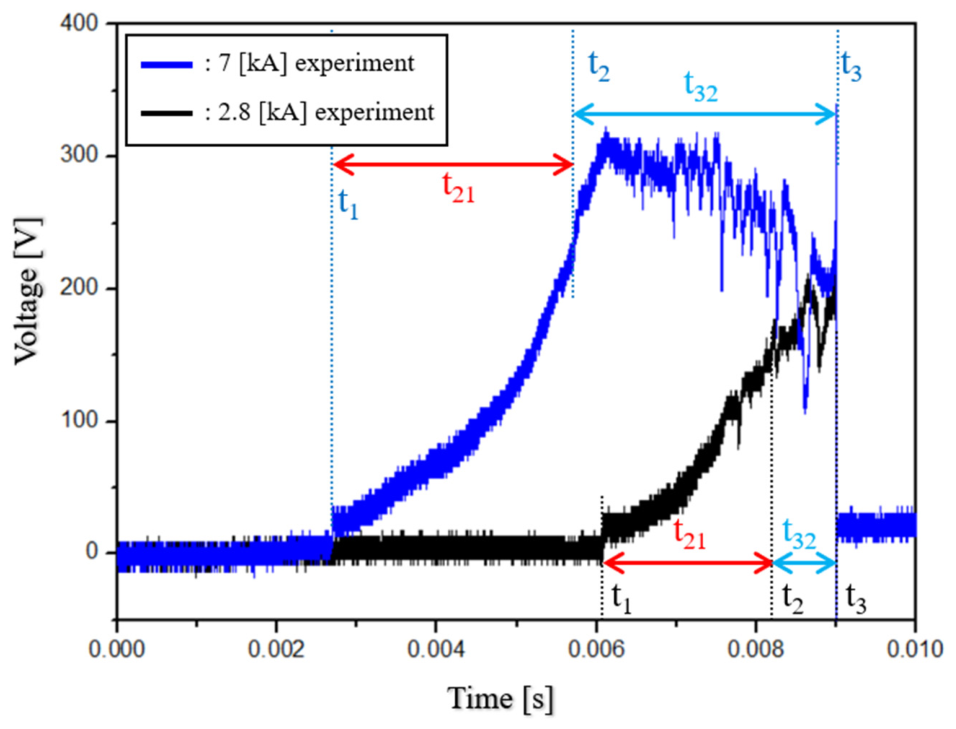
To clarify the difference from the previous study and to emphasize the effect of the current magnitude, the results obtained under 2.8 kA and 7 kA conditions were compared. Figure 15 is a comparison of the voltage waveform of this study with the previous study [18].
It can be seen in the 7 [kA] experiment that the time t1 at which the electrode is separated by the difference in the magnitude of the incoming overcurrent is rapid. In addition, depending on the energy level of the overcurrent, there is a difference in voltage-area and time during the interruption operation.
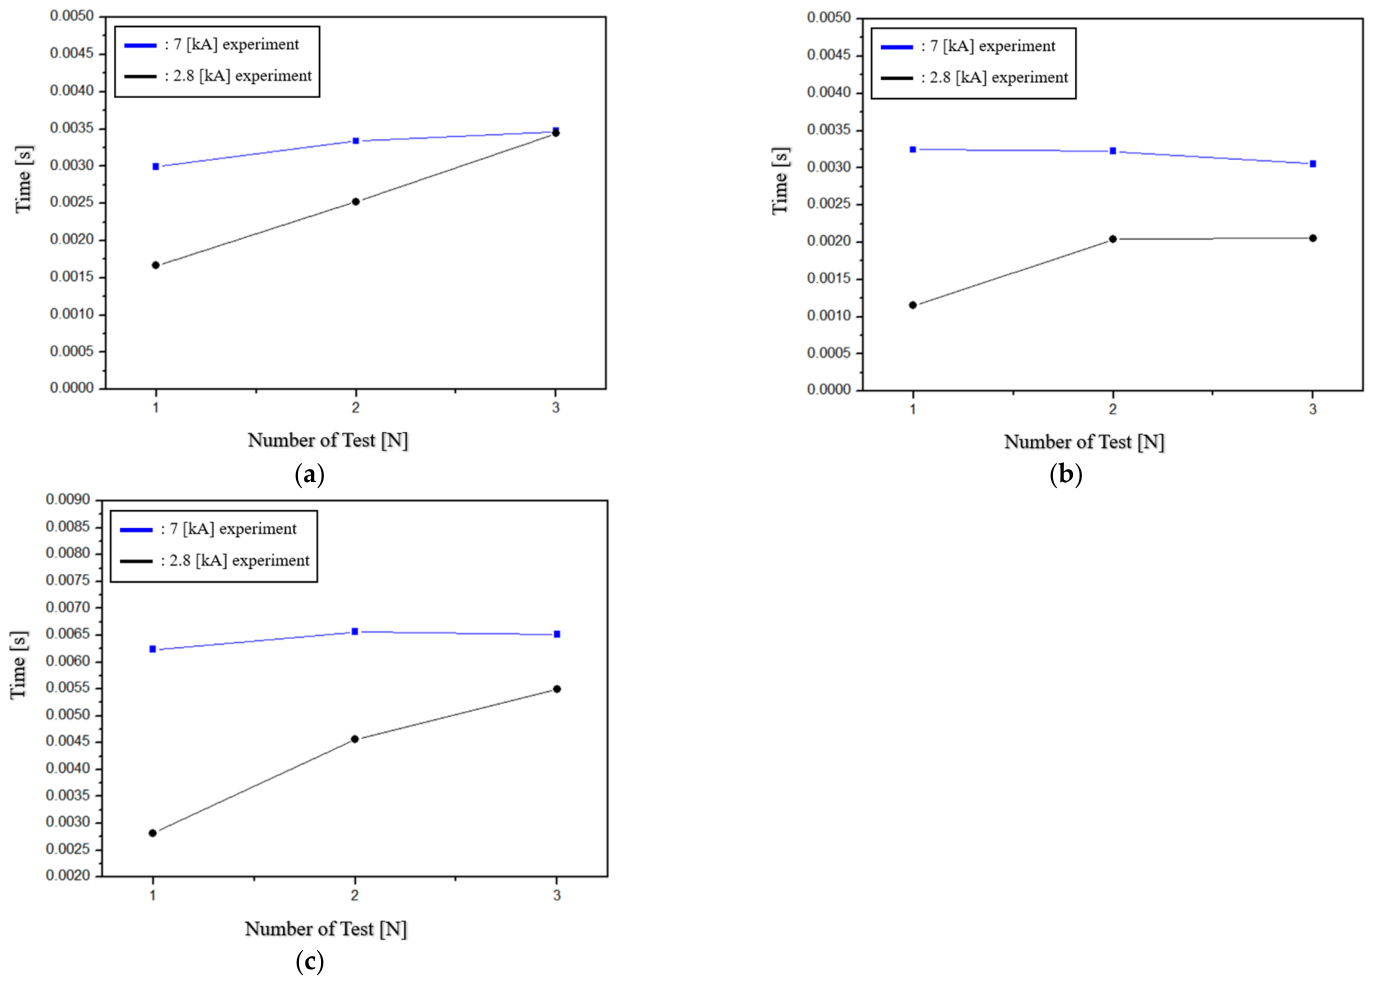
Figure 16 shows comparisons of specific time intervals in the two experiments. In Figure 16a, it can be seen that the extension section (t21) of the arc increases as the overcurrent inflow is repeated in both experiments. This indicates that the time for the arc to be formed between the two electrodes after the electrode is separated and before reaching the splitter plate increases, and it means that the time for the electrode to be damaged increases. Figure 16b shows the comparison of the section (t32) that consumes the energy of the overcurrent in the splitter plate. In the case of the 7 [kA] experiment, it can be seen that the energy consumption time decreases as the experiment is repeated, indicating that deterioration is accumulated by the adsorption of the hot gas generated after the current-zero point. In the 2.8 [kA] experiment, the time increased between the first and second experiments and then decreased. It is judged that the variability of the experimental results is high because the amount of energy is insufficient compared to the 7 [kA] experiment. Figure 16c shows the total time the arc is formed in the arc-extinguishing part and is represented by the sum of t21 and t32.
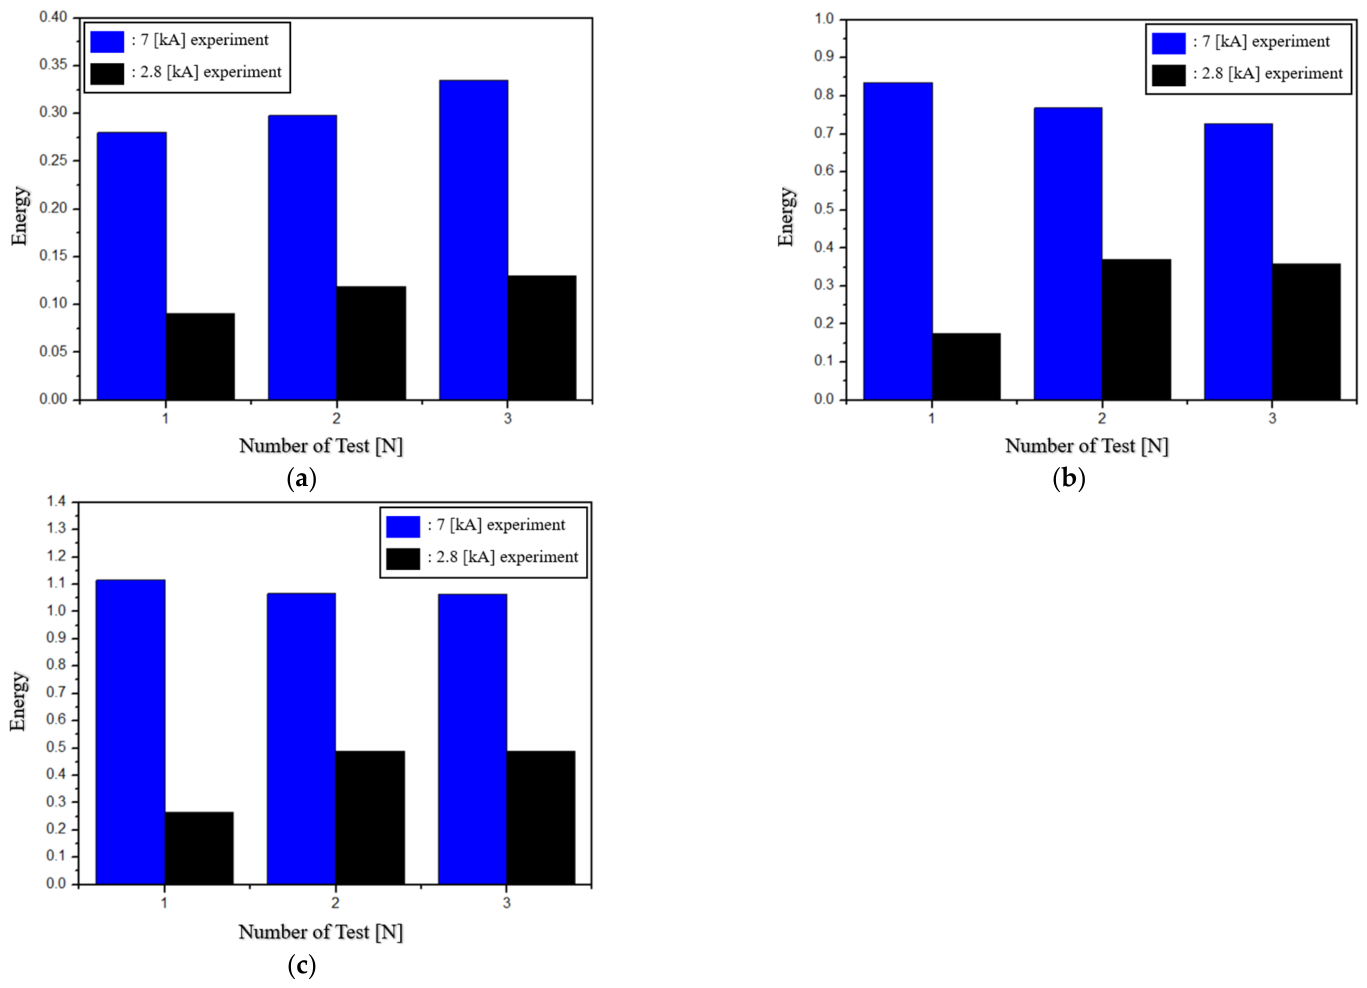
Figure 17 shows the comparison of the voltage-area-based index. Similar to the comparison for specific time intervals, it can be seen that the arc extension section t21 increases as the experiment is repeated. In addition, t32 also shows a trend of continuously decreasing energy consumption when a high overcurrent is introduced, and decreasing after initially increasing when a low overcurrent is inflowed.

5. Conclusions

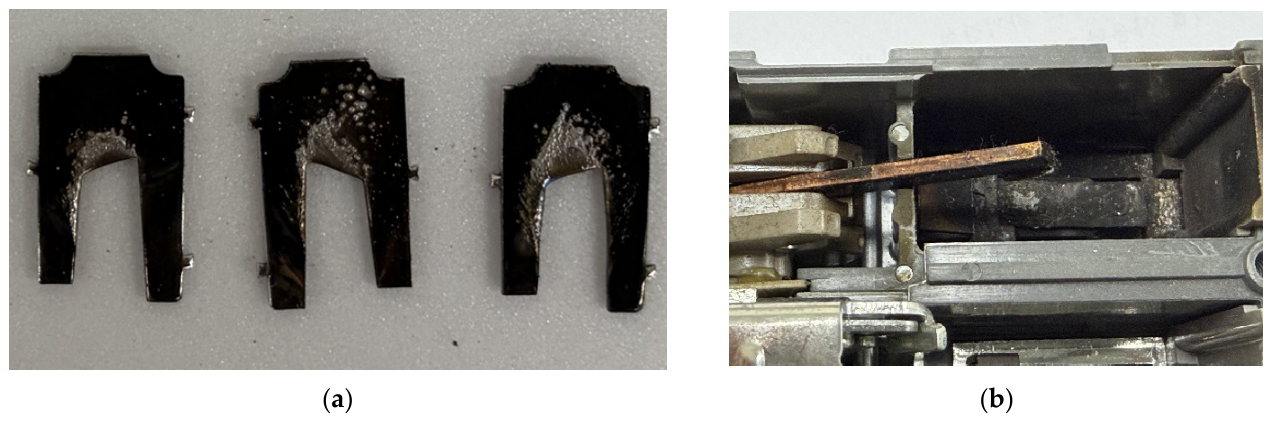
In this study, variations in the interruption behavior of MCCBs under repetitive overcurrent conditions with different current magnitudes are experimentally analyzed. The new experiments in this study were conducted under the 7 kA condition, and the previously reported 2.8 kA results were used as comparative data. In particular, the arc-extinguishing part and the splitter plate of the MCCB are damaged by the inflow of overcurrent, and this performance degradation is accumulated during repeated operation. Figure 18 shows the inside of the extinguishing part and the splitter plate in the overcurrent inflow experiment that is close to the rated short-circuit breaking capacity. As a result of measuring the resistance and mass for each of the normal and damaged plates, it is confirmed that the resistance increased by about twice, to 0.70 [mΩ] for the normal plate and 1.44 [mΩ] for the damaged plate. In addition, in the case of mass, the normal plate is 2649.73 [mg], and the damaged plate is 2628.69 [mg], resulting in a mass loss of about 0.79 [%].
For this purpose, four MCCB products with the same model and rated specifications are prepared, and the overcurrent inflow condition is repeatedly applied to each product. The voltage waveforms generated during the interruption process are then measured. Based on the measured voltage waveforms, the total arcing time, arc extension period, and energy consumption period are distinguished, and the time and voltage-area-based index variations in each period are compared. The quantitative analysis showed that, when the average values of the first and third tests are compared, the total arcing time increased by approximately 4.68%, while the arc extension time and arc extension voltage-area-based index increased by approximately 15.98% and 19.47%, respectively. In contrast, the energy consumption time and the voltage-area-based index for the energy consumption period decreased by approximately 5.90% and 12.87%, respectively. In particular, as the current magnitude increased, relatively large changes in the interruption behavior appeared between the first and second tests. However, between the second and third tests, the changes in total arcing time and total arcing voltage-area-based index are very small, at approximately −0.57% and −0.30%, respectively. This indicates that the interruption characteristics of MCCBs under repetitive overcurrent conditions respond sensitively to the initial change in current magnitude, whereas under subsequent repetitive conditions, the total arcing time and total voltage-area-based index tend to converge or stabilize at a certain level.
These results show that there are limitations in evaluating changes in MCCB interruption performance based only on interruption success or total arcing time. Although the changes in total arcing time and total arcing voltage-area-based index between the second and third tests are not significant, the arc extension energy continued to increase, while the energy ratio of the energy consumption period decreased. In other words, even when the overall interruption characteristics appear to be maintained at a similar level, the internal energy distribution changes between the period before the arc reaches the splitter plates and the energy consumption period after reaching the splitter plates. Therefore, a method that divides the interruption process into detailed periods based on voltage waveforms can be an effective approach for evaluating interruption behavior variation and the possibility of performance degradation in MCCBs under repetitive overcurrent conditions. In future work, repeated three-phase fault tests should be conducted using more diverse current magnitudes and repetition numbers. In addition, quantitative damage analysis of the contacts, splitter plates, and arc chamber should be performed to clarify the causes of the time and voltage-area-based index variations observed in the voltage waveforms.

Author Contributions

Experiment, Y.-M.C. and K.-A.L.; Software, H.-K.J.; Writing—original draft preparation, Y.-M.C.; Writing—result analysis, K.-A.L.; Writing—review and editing, K.-A.L.; Project administration, H.-K.J. and K.-A.L.; Funding acquisition, H.-K.J. All authors have read and agreed to the published version of the manuscript.

Funding

This work was supported by the National Research Foundation of Korea (NRF) grant funded by the Korea government (MSIT) (No. NRF-RS-2022-00143178); This research was supported by the Regional Innovation System & Education (RISE) program through the (Chungbuk Regional Innovation System & Education Center), funded by the Ministry of Education (MOE) and the Chungcheongbuk-do, Republic of Korea (2025-RISE-11-013-03); This research is supported by Korea Institute for Advancement of Technology (KIAT) grant funded by the Korea Government (MOTIE) (P0020536, HRD Program for Industrial Innovation).

Institutional Review Board Statement

Not Applicable.

Informed Consent Statement

Not Applicable.

Data Availability Statement

The data presented in this study are available from the corresponding author upon reasonable request.

Conflicts of Interest

The authors declare no conflict of interest.

References

  1. Cheng, D.; Li, X.; Dai, R. Measurement of the Dielectric Recovery Strength and Reignition of AC Contactors. IEICE Trans. Electron. 2005, E88-C, 1641–1646. [Google Scholar] [CrossRef] [Scilit]
  2. Shea, J.J. The Influence of Arc Chamber Wall Material on Arc Gap Dielectric Recovery Voltage. IEEE Trans. Compon. Packag. Technol. 2001, 24, 342–348. [Google Scholar]
  3. Shea, J.J. Gassing Arc Chamber Wall Material Effect on Post Current-Zero Recovery Voltage Breakdown. IEEE Trans. Compon. Packag. Technol. 2004, 27, 40–50. [Google Scholar]
  4. Iturregi, A.; Barbu, B.; Torres, E.; Berger, F.; Zamora, I. Electric Arc in Low-Voltage Circuit Breakers: Experiments and Simulation. IEEE Trans. Plasma Sci. 2017, 45, 113–120. [Google Scholar]
  5. Lindmayer, M.; Marzahn, E.; Mutzke, A.; Rüther, T.; Springstubbe, M. The Process of Arc Splitting between Metal Plates in Low Voltage Arc Chutes. IEEE Trans. Compon. Packag. Technol. 2006, 29, 310–317. [Google Scholar] [CrossRef] [Scilit]
  6. Shin, D.; Bull, T.G.; McBride, J.W. Experimental Study of Arc Motion near Splitter Plates in Low-Voltage Switching Devices. IEEE Trans. Compon. Packag. Manuf. Technol. 2021, 11, 1452–1460. [Google Scholar] [CrossRef] [Scilit]
  7. Zhang, L.; Wang, J.; Xu, Y. A Novel Arcing Power-Based Algorithm for Condition Monitoring of Electrical Wear of Circuit Breaker Contacts. IEEE Trans. Compon. Packag. Manuf. Technol. 2021, 11, 658–667. [Google Scholar]
  8. Li, L.; Wang, B.; Liu, Y.; Yu, H.; Zhang, S.; Huang, M. Early Detection of Health Condition Degradation of Circuit Breaker Based on Electrical Quantity Monitoring. Energies 2023, 16, 5581. [Google Scholar] [CrossRef] [Scilit]
  9. Lee, K.-A.; Cho, Y.-M.; Lee, H.-J. Circuit Model and Analysis of Molded Case Circuit Breaker Interruption Phenomenon. Electronics 2020, 9, 2047. [Google Scholar] [CrossRef] [Scilit]
  10. Cho, Y.-M.; Lee, K.-A. Experimental Study on Splitter Plate for Improving the Dielectric Recovery Strength of Low-Voltage Circuit Breaker. Electronics 2020, 9, 2148. [Google Scholar] [CrossRef] [Scilit]
  11. Feizifar, B.; Usta, O. Condition Monitoring of Circuit Breakers Using Arc Models and Failure Detection Algorithm. In Proceedings of the 5th International Istanbul Smart Grid and Cities Congress and Fair, Istanbul, Turkey, 19–21 April 2017; IEEE: New York, NY, USA, 2017. [Google Scholar]
  12. Wang, Q.; Ge, S.; Cao, W.; Yu, S.; Liao, Z. Study of Arc Interruption Characteristics under Rated Current in Low Voltage Circuit Breakers. Energies 2023, 16, 4114. [Google Scholar] [CrossRef] [Scilit]
  13. He, J.; Wang, K.; Li, J. Numerical Study on Multiple Arcs in a Pyro-Breaker Based on the Black-Box Arc Model. Electronics 2022, 11, 1702. [Google Scholar]
  14. Kim, W.; Kim, Y.-J.; Kim, H. Arc Voltage and Current Characteristics in Low-Voltage Direct Current. Energies 2018, 11, 2511. [Google Scholar] [CrossRef] [Scilit]
  15. Parmar, D.; Gojiya, M. Analysis and Improvement in Repulsive Force of 630 A Frame Moulded Case Circuit Breaker. Int. Perspect. Sci. 2016, 8, 424–427. [Google Scholar] [CrossRef] [Scilit]
  16. Katare, P.; Tumane, M.; Ingle, A.; Thakre, P.; Chan, C.K. Computational Study of the Effect of the Number of Splitter Plates Considering Blow-Out Coil Voltage in Arc Chamber of Moulded Case Circuit Breaker. Results Eng. 2024, 22, 102238. [Google Scholar] [CrossRef] [Scilit]
  17. Yağır, M.-O. Structural Analysis of Electromagnetic Forces Acting on the MCCB Body during a Short Circuit Using ANSYS. Int. Adv. Res. Eng. J. 2025, 9, 169–176. [Google Scholar] [CrossRef] [Scilit]
  18. Cho, Y.-M.; Joung, H.-K.; Lee, K.-A. Analysis of Interrupting Energy Variations in MCCBs under Repetitive Fault Conditions in Accelerator Environments. Actuators 2026, 15, 65. [Google Scholar] [CrossRef] [Scilit]
Figure 1. Schematic diagram of low-voltage circuit breaker operation during interruption process: (a) overcurrent inflow; (b) electrode separation; (c) reaching splitter plate; (d) current-zero point.
Actuators 15 00361 g001
Figure 2. Voltage and current waveform during the interruption process under the 2.8 kA condition, cited from the previous study.
Actuators 15 00361 g002
Figure 3. Classification and definition of a specific point during the interruption process.
Actuators 15 00361 g003
Figure 4. Electromagnetic repulsion force at electrodes.
Actuators 15 00361 g004
Figure 5. Equipment under test (EZC100H3040): (a) external structure; (b) internal structure; (c) internal structure of arc-extinguishing unit.
Actuators 15 00361 g005
Figure 6. Experiment set-up: (a) configuration; (b) circuit diagram.
Actuators 15 00361 g006
Figure 7. Experiment sequence.
Actuators 15 00361 g007
Figure 8. Test results of product A at 7 [kA] inflow experiment: (a) result waveform on one-time inflow; (b) result waveform two-times inflow; (c) result waveform three-times inflow; (d) trend over time.
Actuators 15 00361 g008
Figure 9. Test results of product B at 7 [kA] inflow experiment: (a) result waveform on one-time inflow; (b) result waveform two-times inflow; (c) result waveform three-times inflow; (d) trend over time.
Actuators 15 00361 g009
Figure 10. Test results of product C at 7 [kA] inflow experiment: (a) result waveform on one-time inflow; (b) result waveform two-times inflow; (c) result waveform three-times inflow; (d) trend over time.
Actuators 15 00361 g010
Figure 11. Test results of product D at 7 [kA] inflow experiment: (a) result waveform on one-time inflow; (b) result waveform two-times inflow; (c) result waveform three-times inflow; (d) trend over time.
Actuators 15 00361 g011
Figure 12. Voltage-area-based energy distribution by sections during the interruption process.
Actuators 15 00361 g012
Figure 13. Voltage-area-based index distribution results for each experiment: (a) in the case of Product A; (b) in the case of Product B; (c) in the case of Product C; (d) in the case of Product D.
Actuators 15 00361 g013
Figure 14. Tendency of test results: (a) comparison of average value for each time; (b) comparison of average value for each voltage-area-based index.
Actuators 15 00361 g014
Figure 15. Voltage waveform comparisons of the previous study [18] and the current study.
Actuators 15 00361 g015
Figure 16. Comparison of time: (a) arc extension; (b) energy consumption; (c) total arcing time.
Actuators 15 00361 g016
Figure 17. Comparison of voltage-area-based index (a) arc extension; (b) energy consumption; (c) total arcing time.
Actuators 15 00361 g017
Figure 18. Inside the damaged MCCB after experiment: (a) splitter plate; (b) internal structure of MCCB.
Actuators 15 00361 g018
Table 1. Specifications of the overcurrent inflow system and comparison based on current magnitude.
CategoryValue/ModelNote
2.8 [kA] System [18]7 [kA] System
Capacitor17,268.64 [μF]45,443.79 [μF]Selected to have a resonance frequency of 60 [Hz].
Inductor0.4074 [mH]0.1548 [mH]
Resistor2.5 [Ω]Parallel connection
DiodeMPKC2SA200U60
ThyristorMCC312-16io1
Table 2. Detailed time and voltage-area-based index results from experiments on 4 products.
Category1 Time2 Times3 Times
Product 1Total
Arcing time (t31)
Time0.0060550.0065160.006532
Voltage-area-based index1.1187841.0521231.053023
Arc
Extension (t21)
Time0.0029200.0032420.003398
Voltage-area-based index0.2716200.2762340.300202
Energy
Consumption (t32)
Time0.0031350.0032740.003135
Voltage-area-based index0.8471630.7758890.752821
Product 2Total
Arcing time (t31)
Time0.0063150.00674130.006485
Voltage-area-based index1.1479551.0503701.041299
Arc
Extension (t21)
Time0.0031110.00360670.003696
Voltage-area-based index0.2986460.3184630.362532
Energy
Consumption (t32)
Time0.0032040.00313460.002789
Voltage-area-based index0.8493090.7319070.678766
Product 3Total
Arcing time (t31)
Time0.0062200.0064170.006538
Voltage-area-based index1.0983321.0791881.070673
Arc
Extension (t21)
Time0.0028760.0032130.003403
Voltage-area-based index0.2556080.2922410.333526
Energy
Consumption (t32)
Time0.0033450.0032040.003135
Voltage-area-based index0.8427240.7869470.737146
Product 4Total
Arcing time (t31)
Time0.0063490.0065610.006531
Voltage-area-based index1.0982801.0826321.086371
Arc
Extension (t21)
Time0.0030570.0032860.003379
Voltage-area-based index0.2953330.3044650.343248
Energy
Consumption (t32)
Time0.0032920.0032750.003152
Voltage-area-based index0.8029470.7781670.743123
Disclaimer/Publisher’s Note: The statements, opinions and data contained in all publications are solely those of the individual author(s) and contributor(s) and not of MDPI and/or the editor(s). MDPI and/or the editor(s) disclaim responsibility for any injury to people or property resulting from any ideas, methods, instructions or products referred to in the content.