
A Control-Oriented Model for Polymer-Dispersed Liquid Crystal Films as an Actuator for Natural Light Control


Abstract
1. Introduction
2. Materials and Methods
2.1. Control Scheme
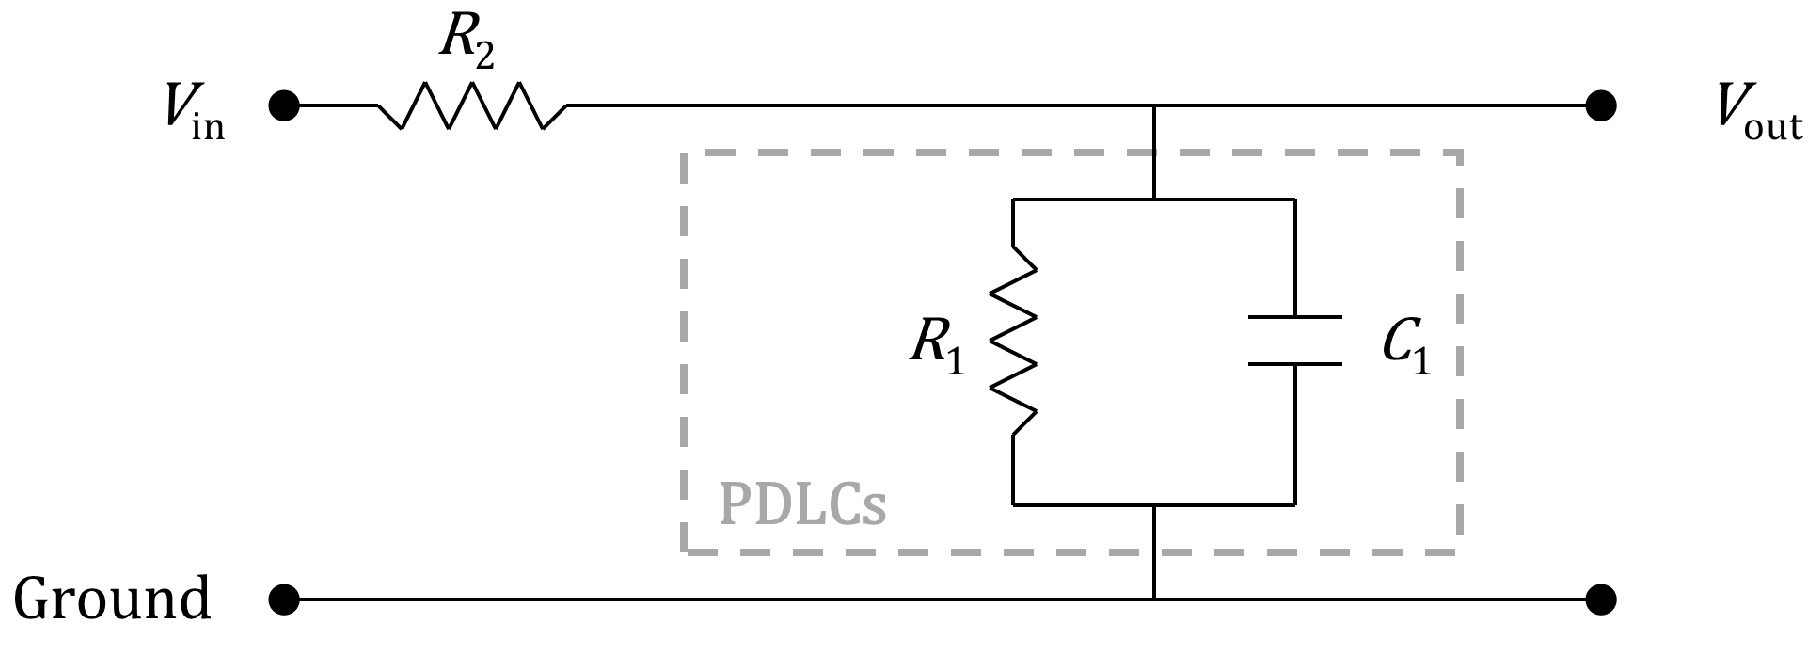
2.2. Novel Control-Oriented Model
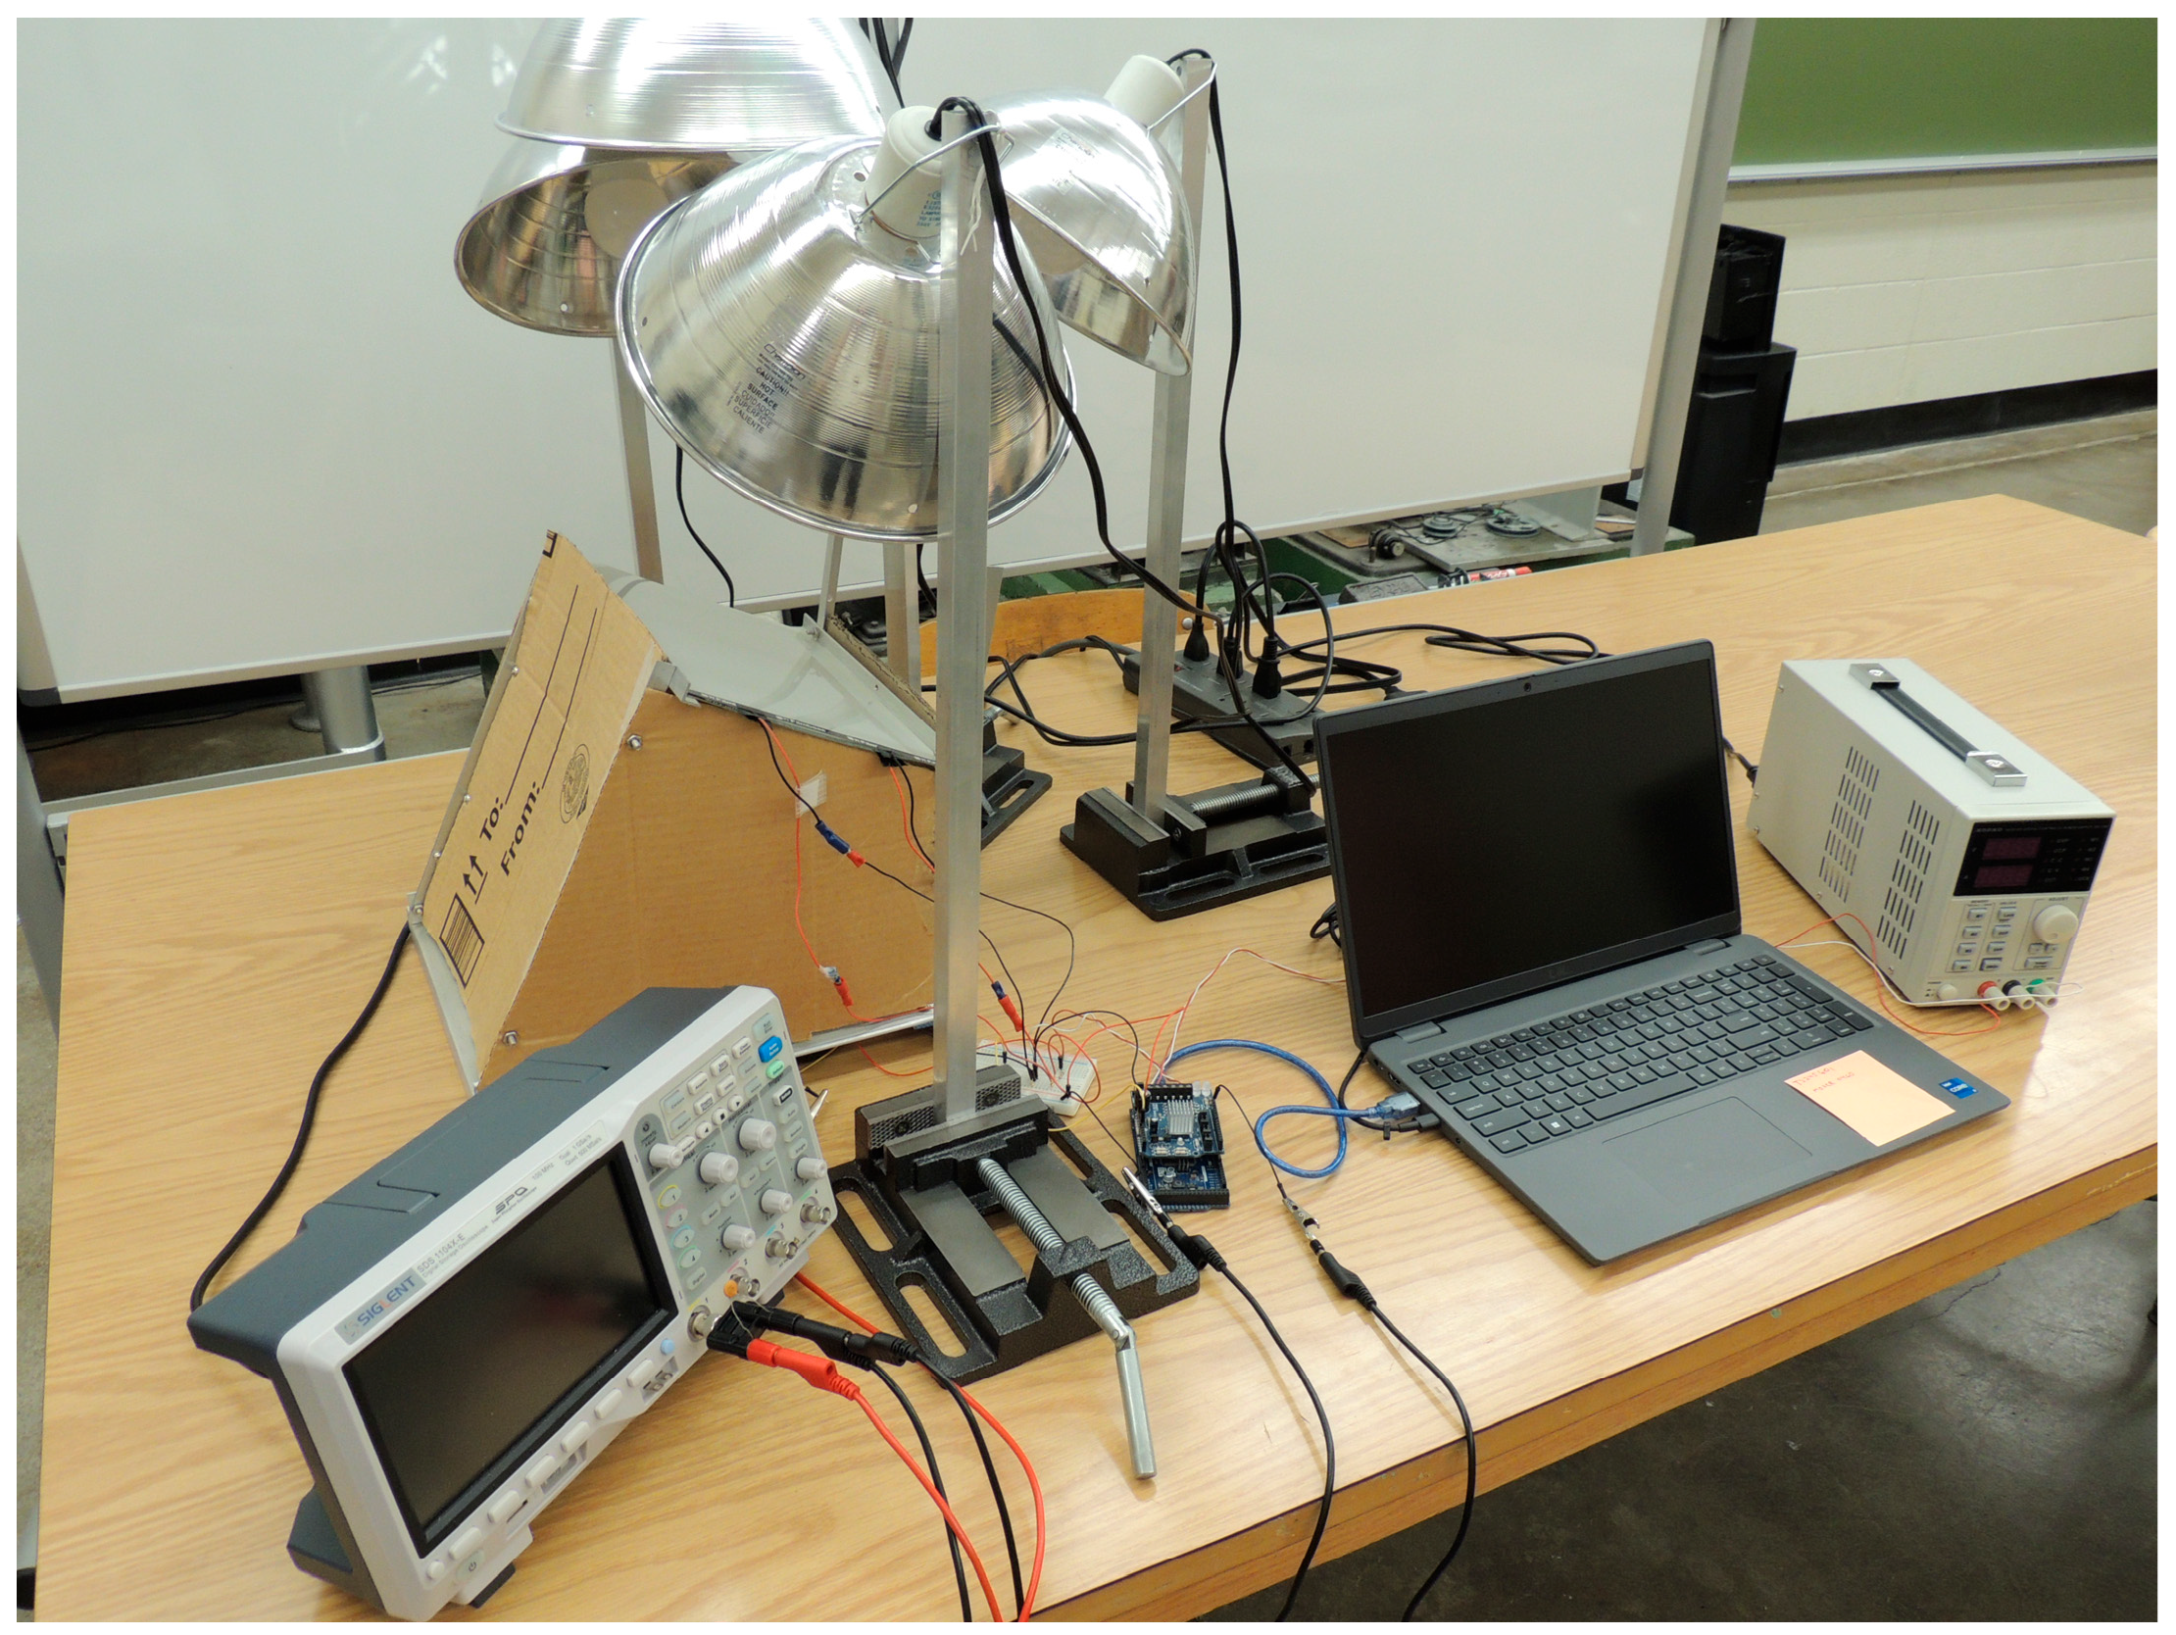
2.3. Test Rig
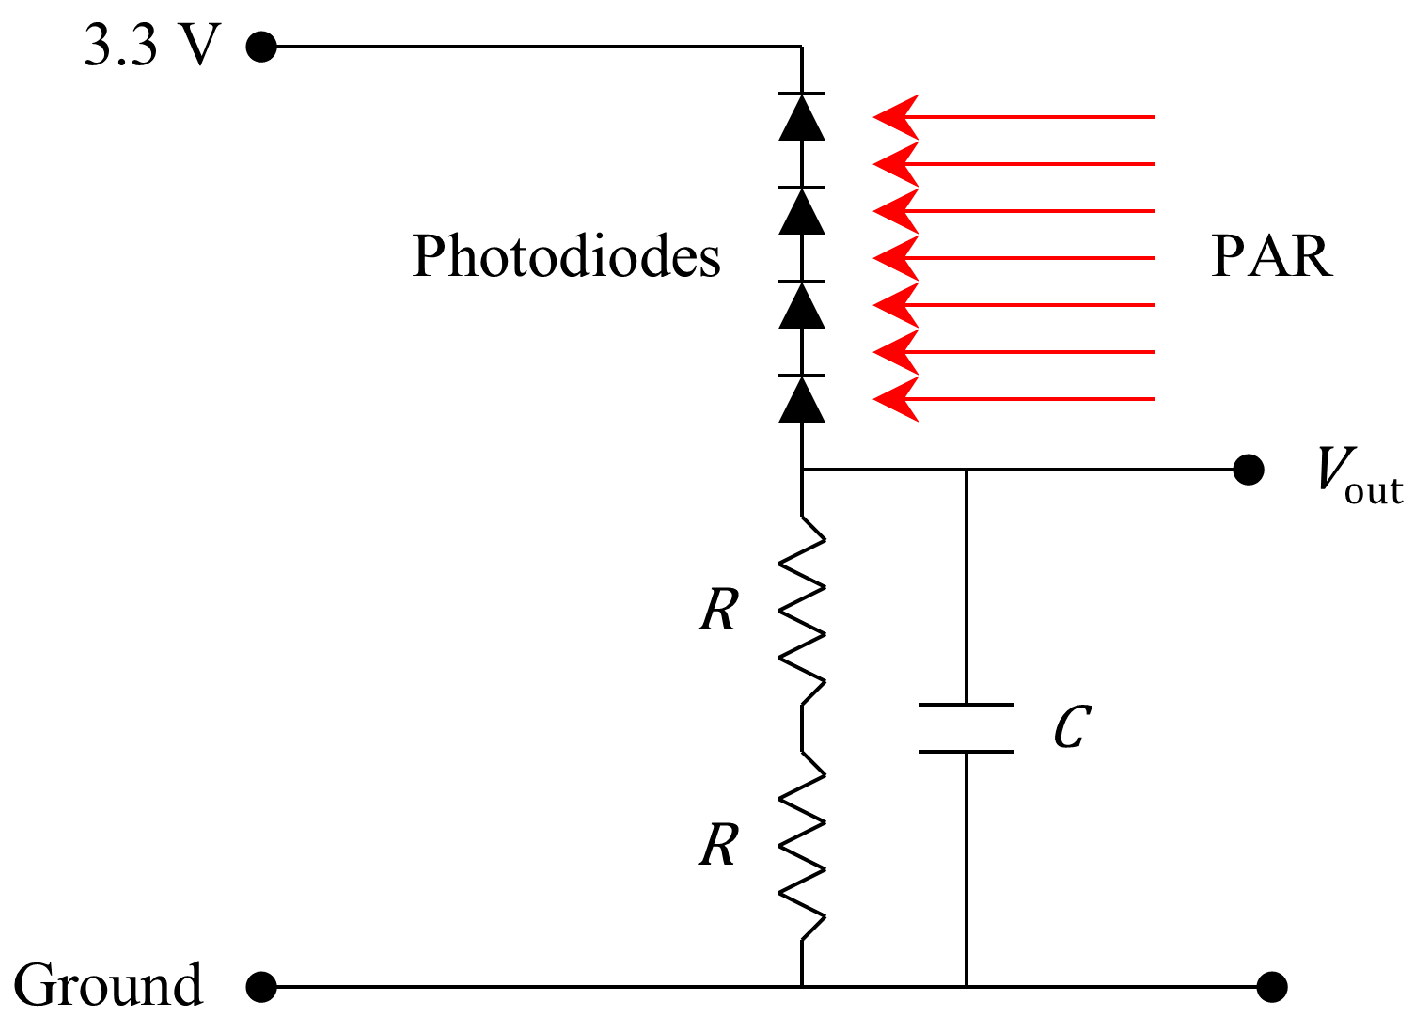
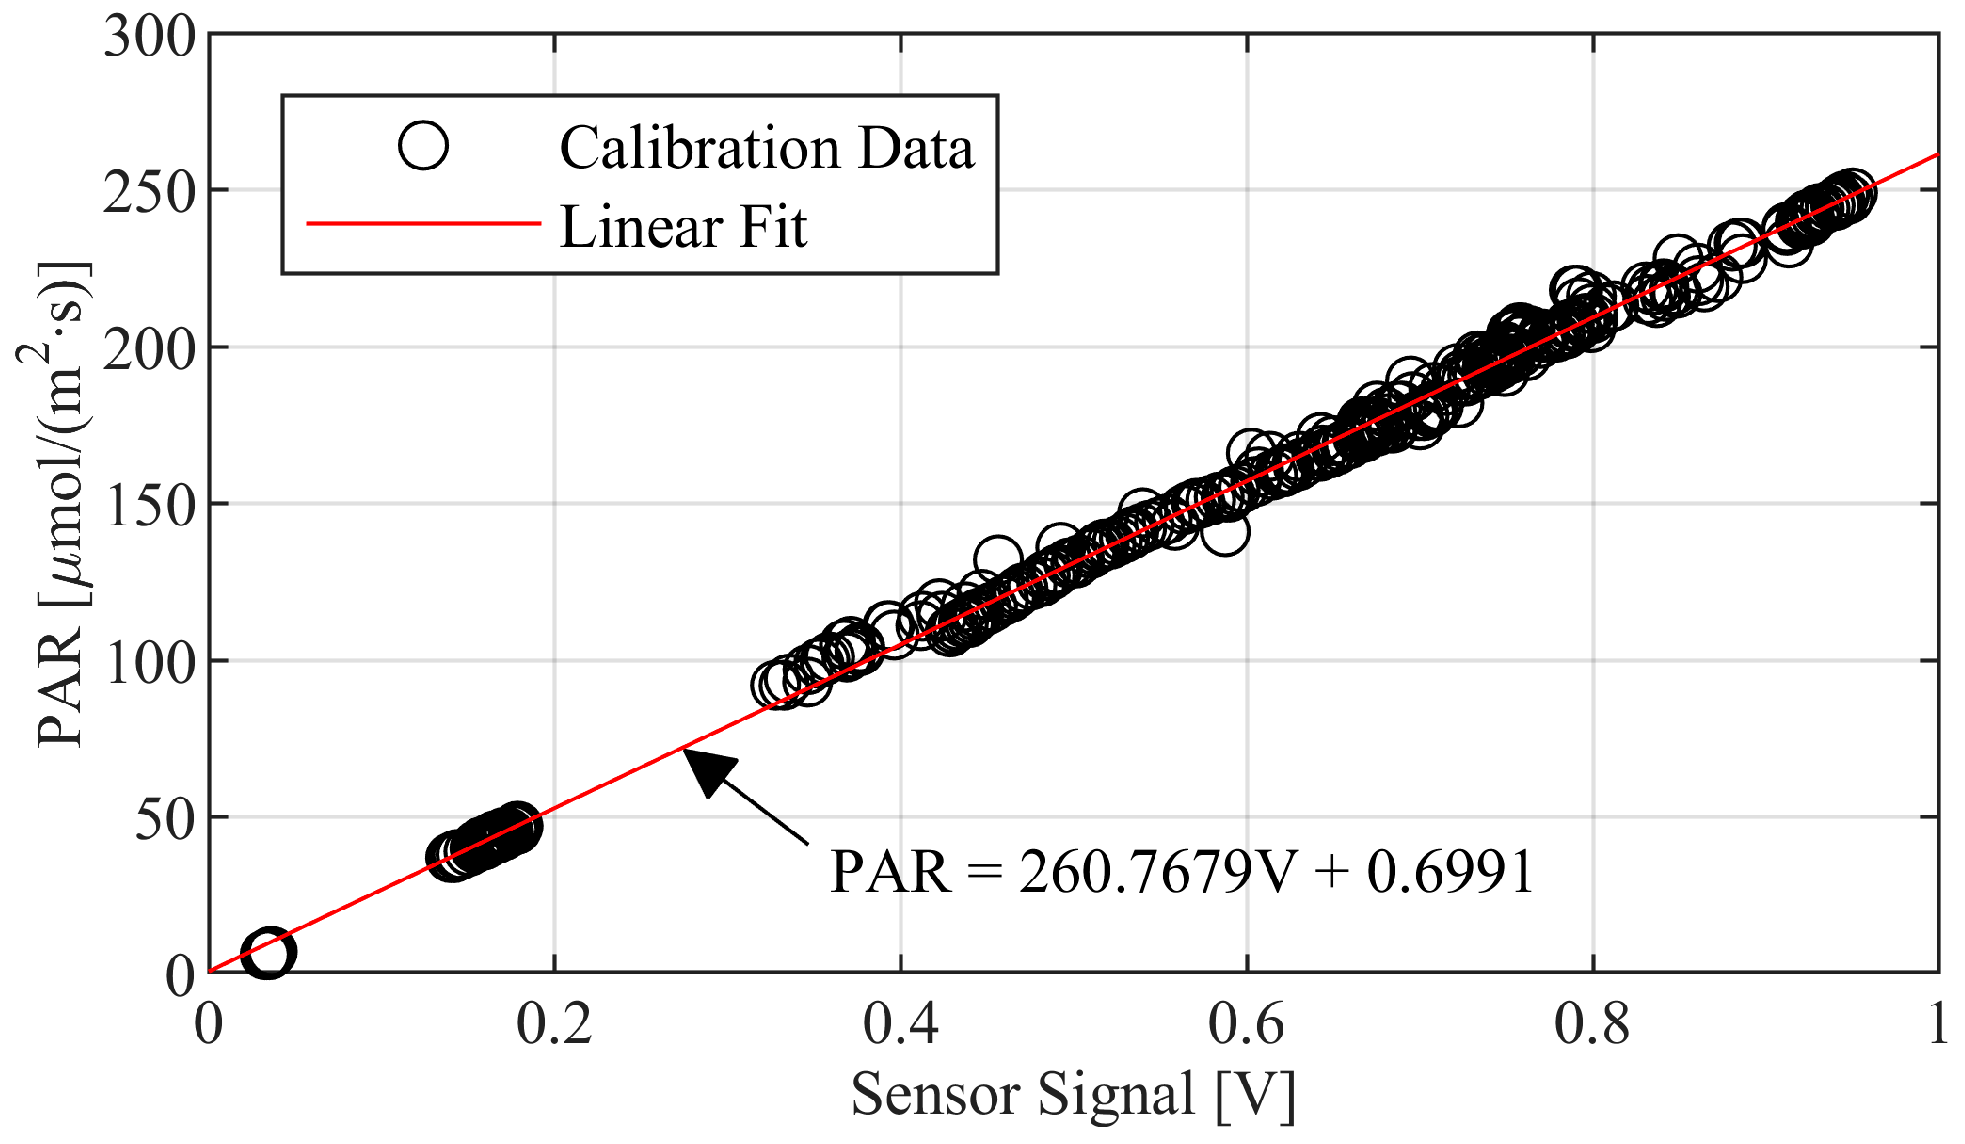
2.3.1. Light Sensor
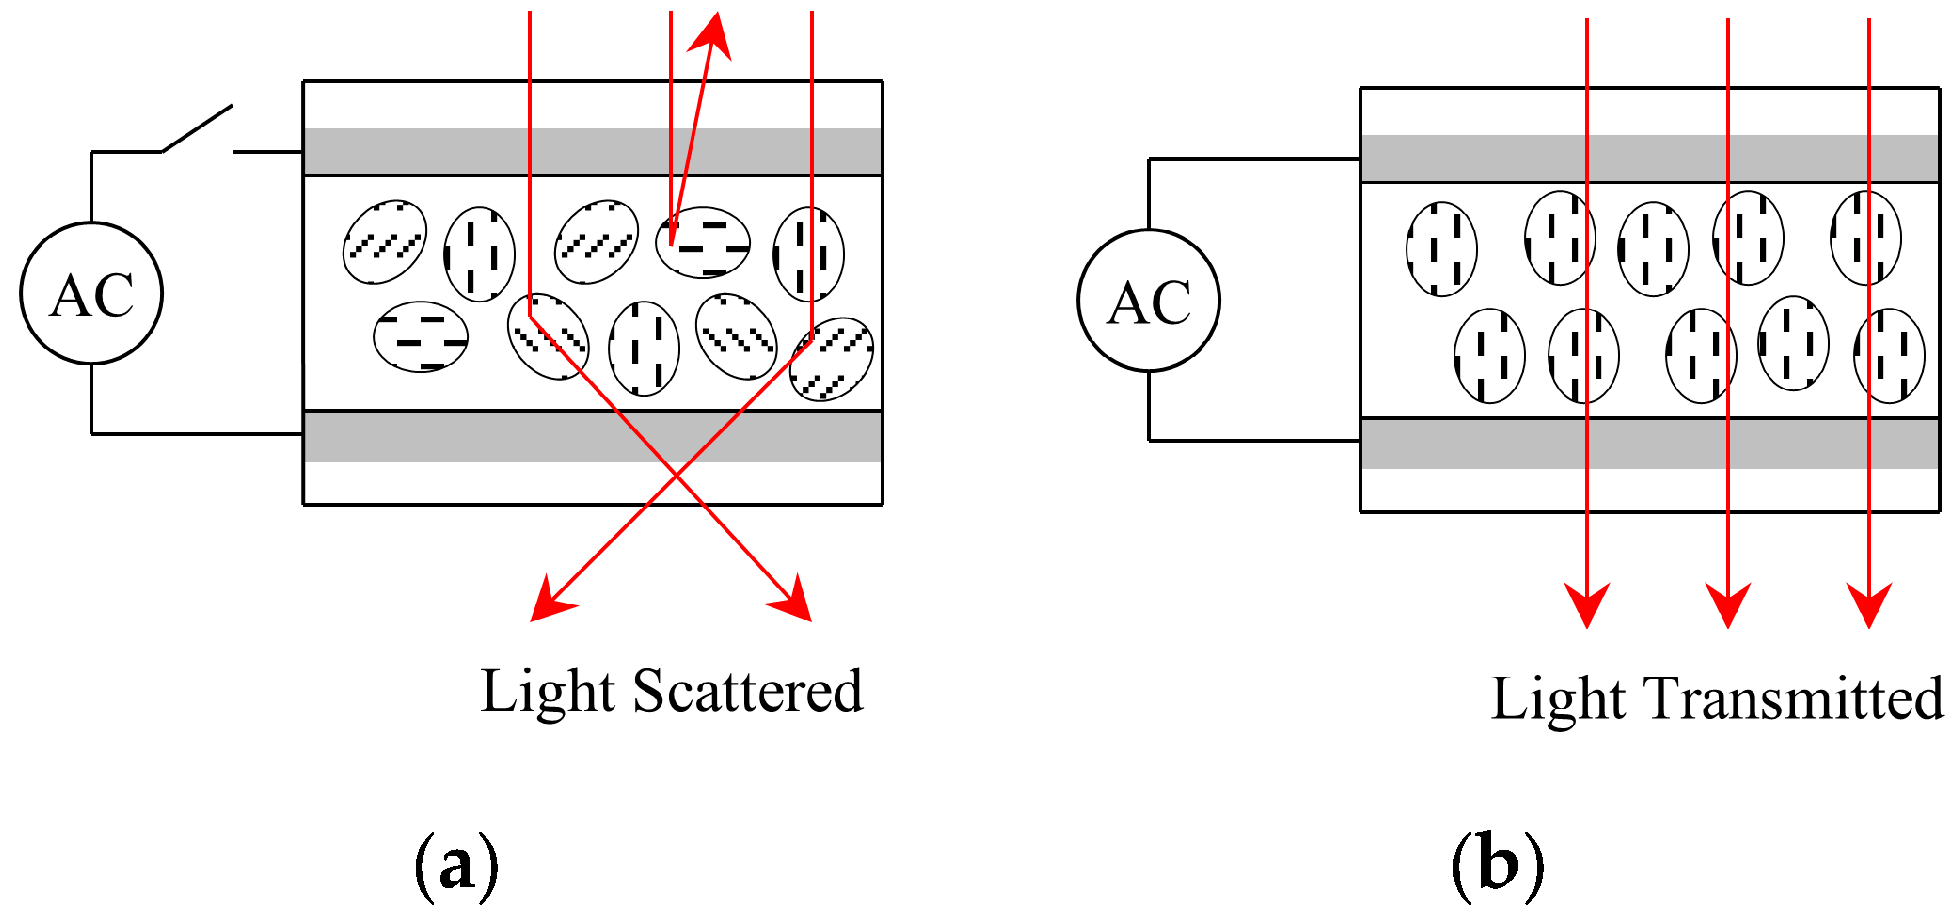
2.3.2. PDLC
2.3.3. Control Hardware
3. Results
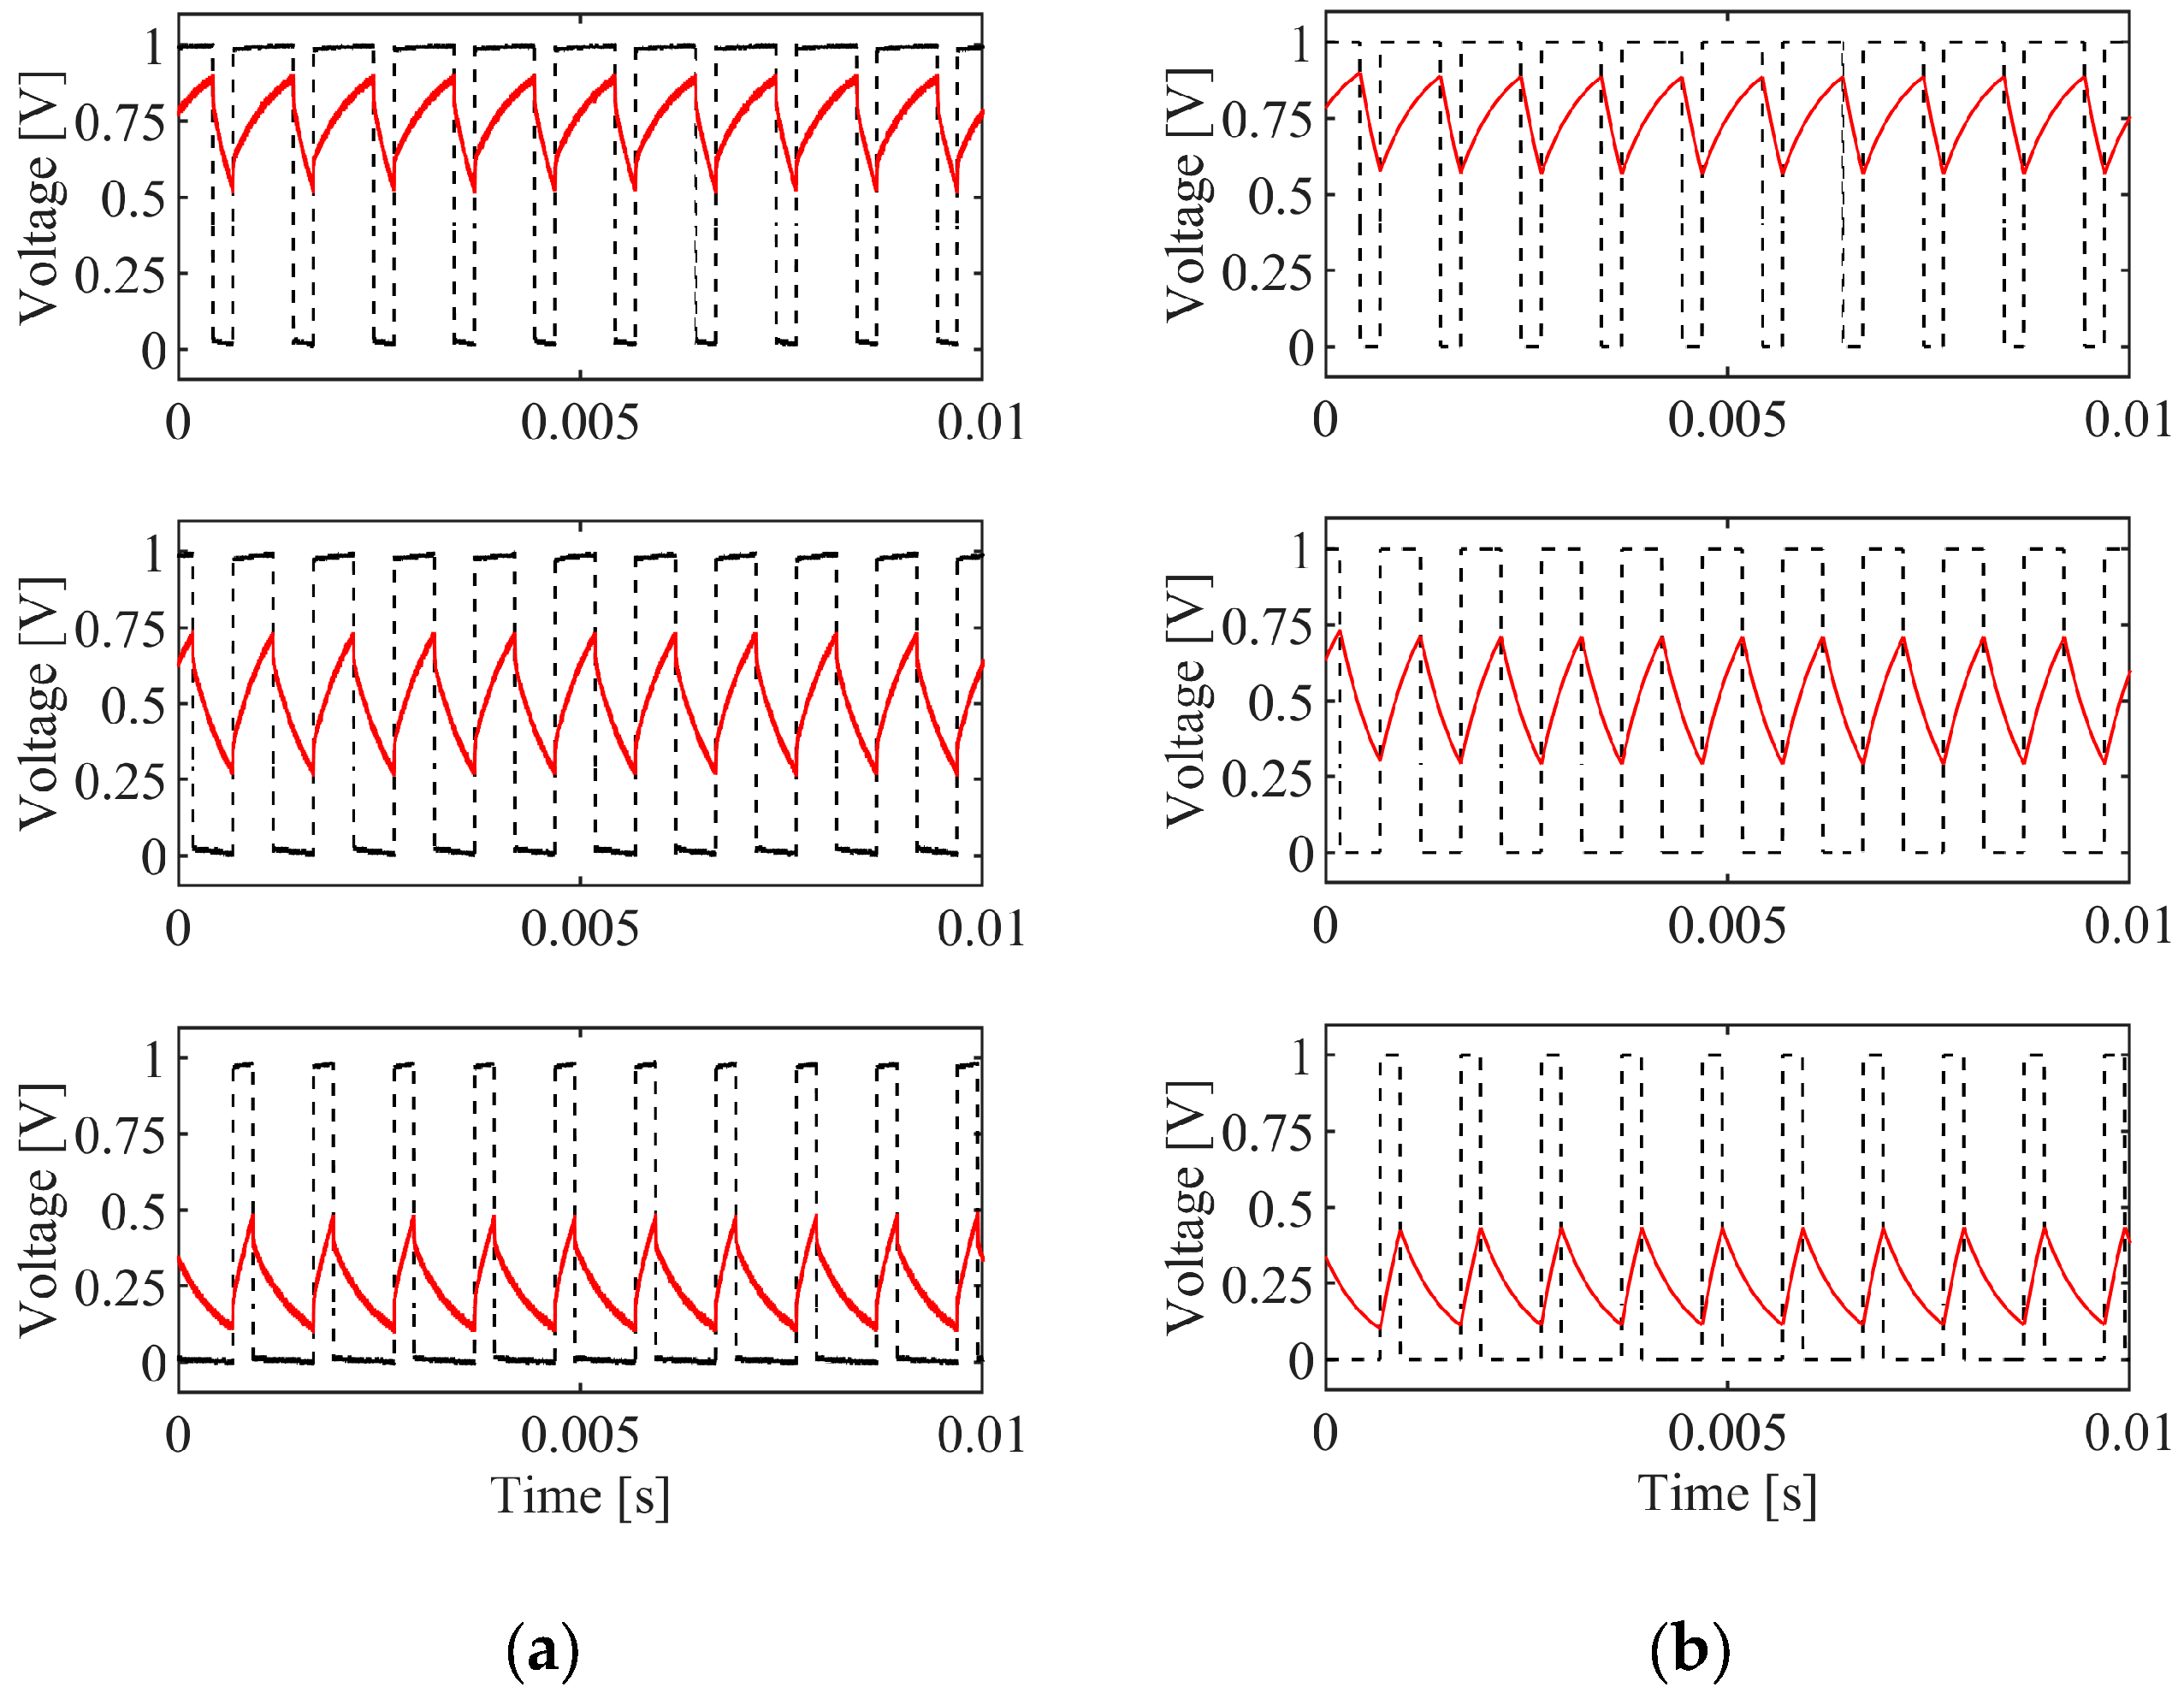
3.1. Open-Loop Identification
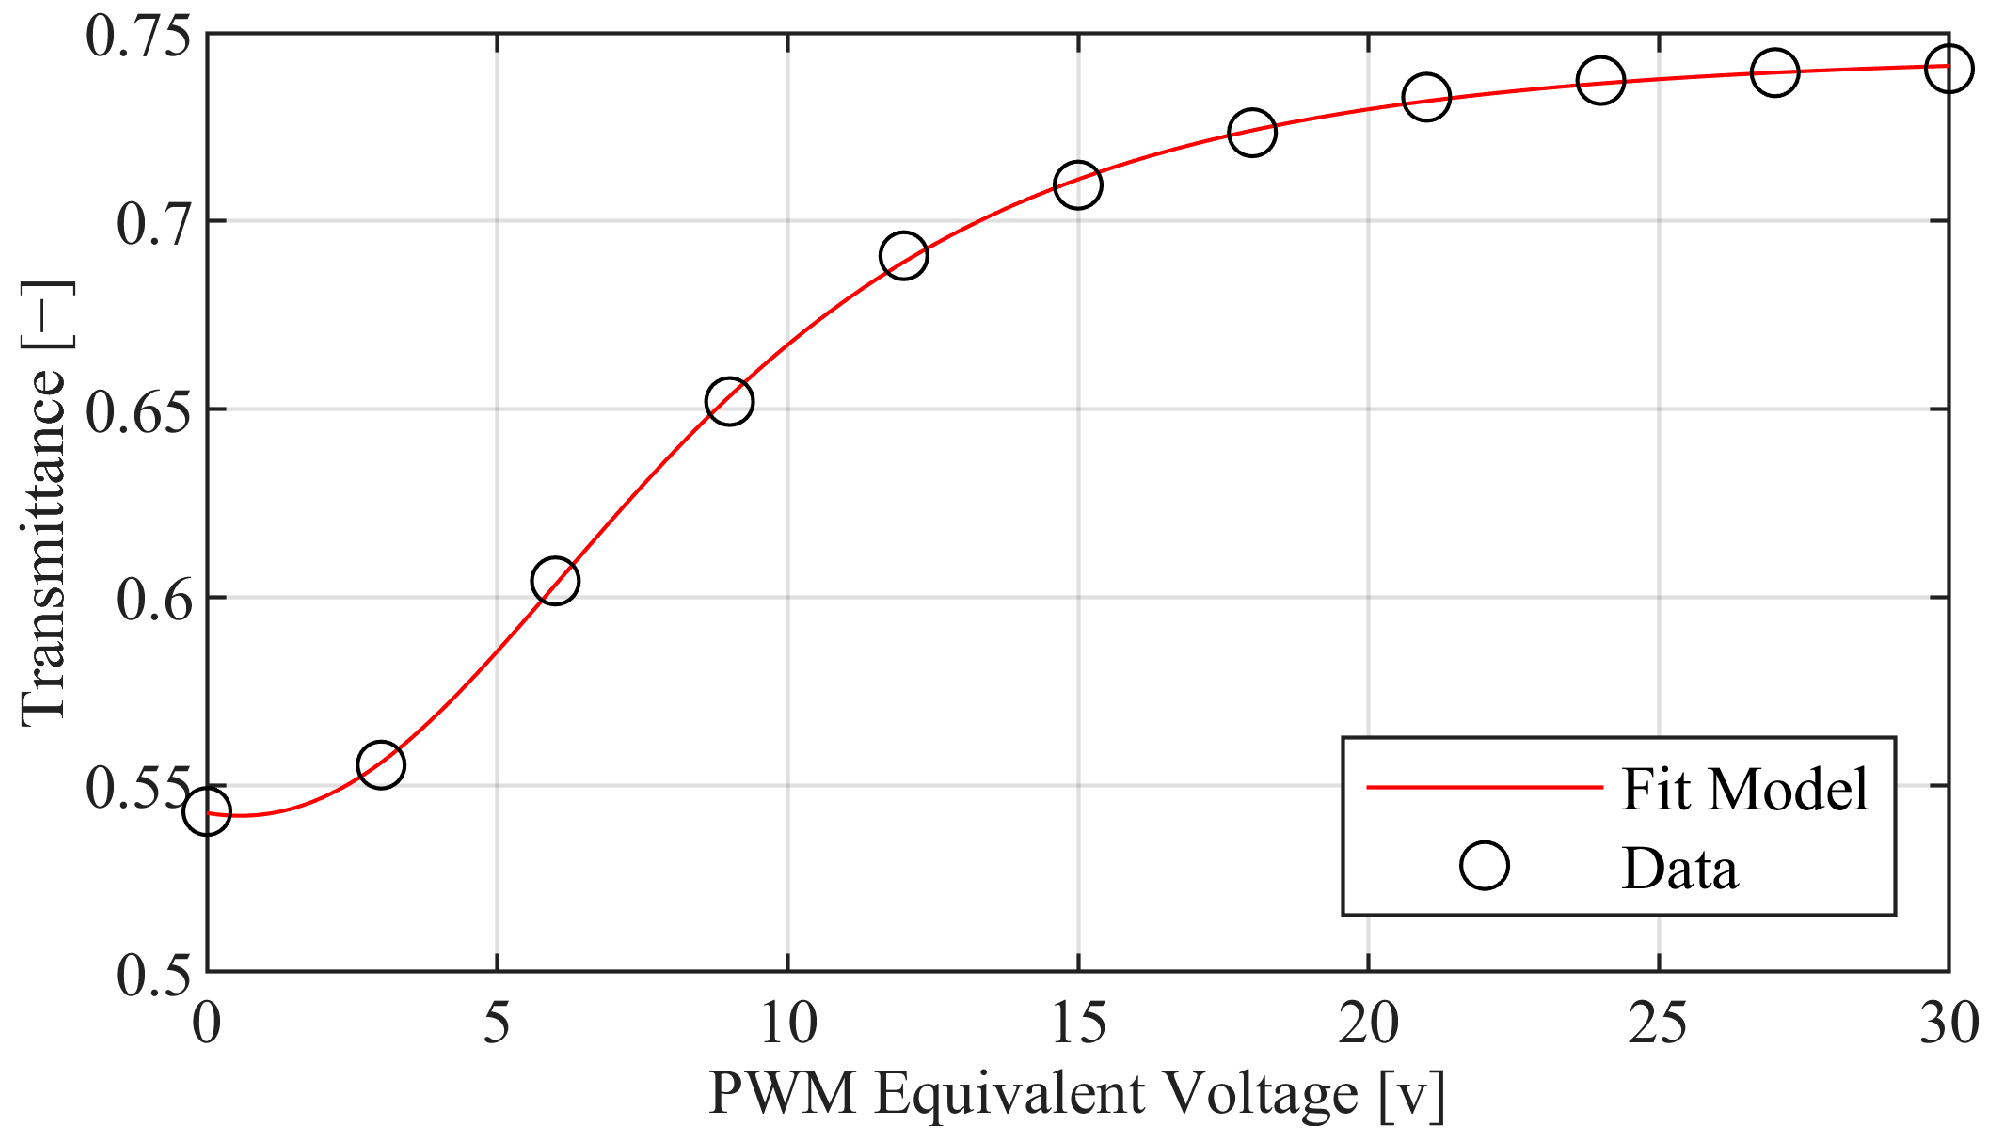
3.1.1. Quasistatic Transmittance
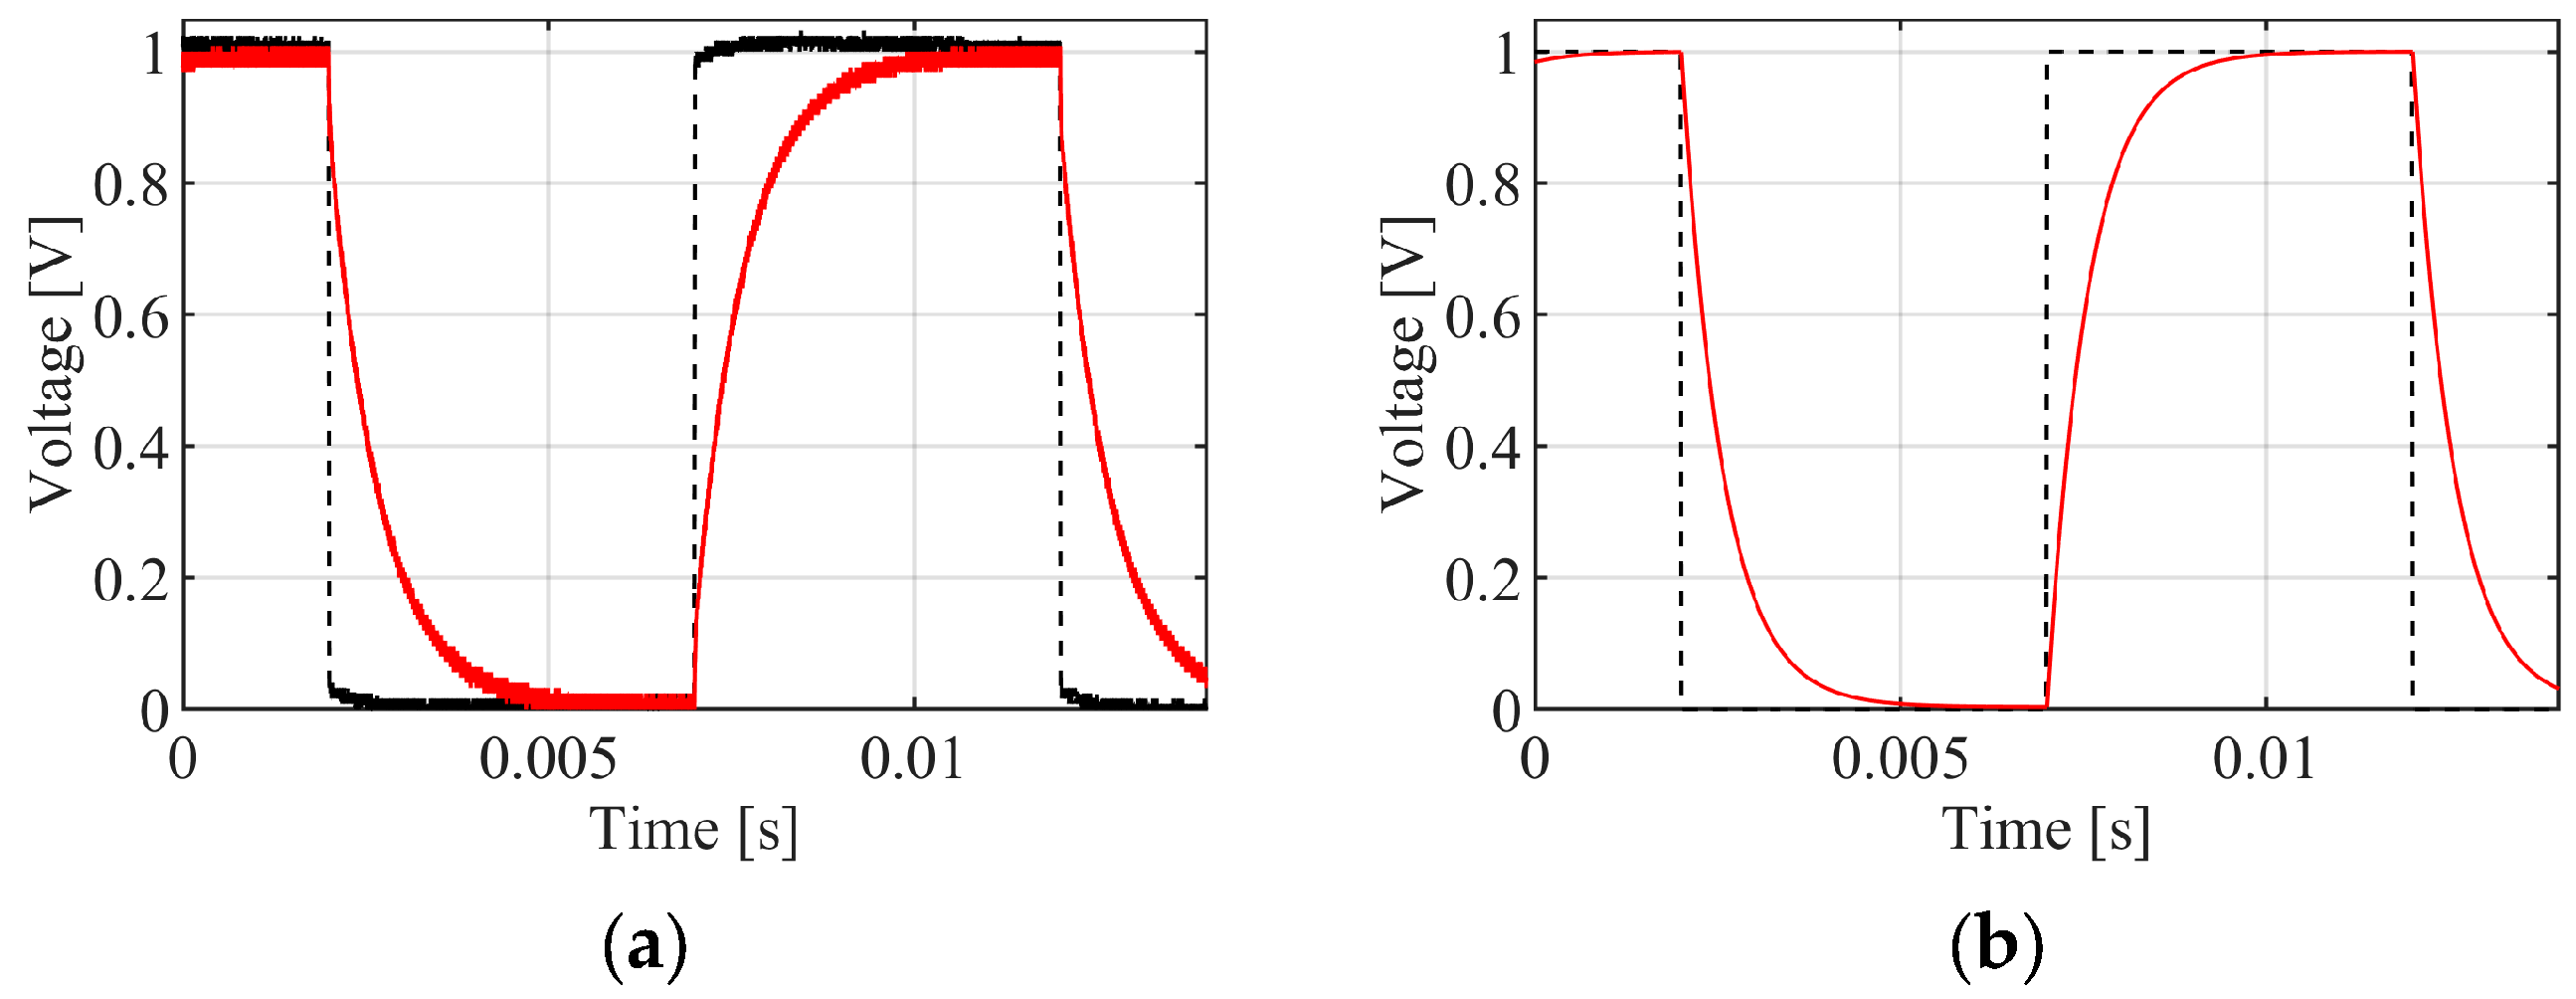
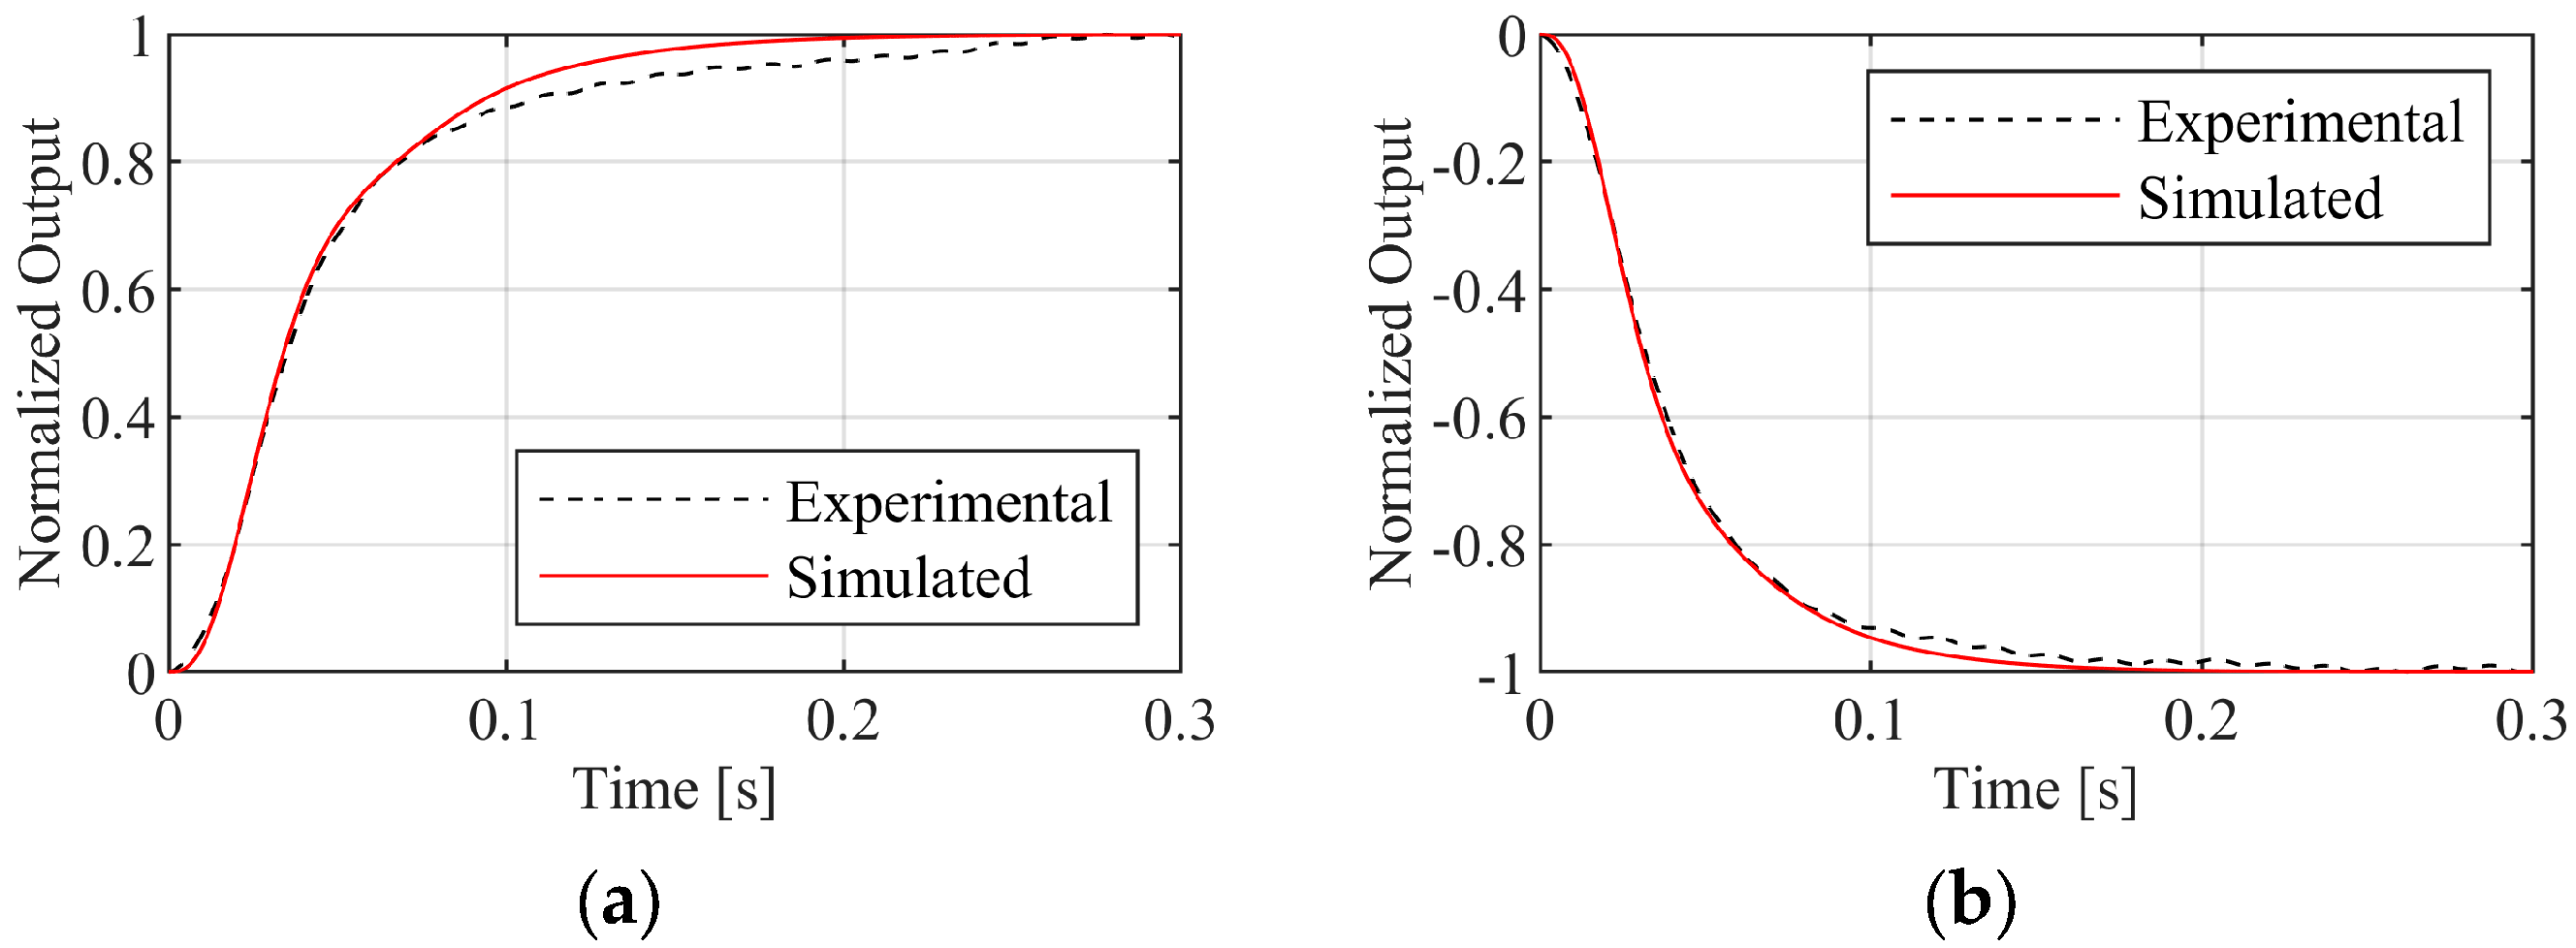
3.1.2. Dynamic Step Response
3.2. Closed-Loop Tests
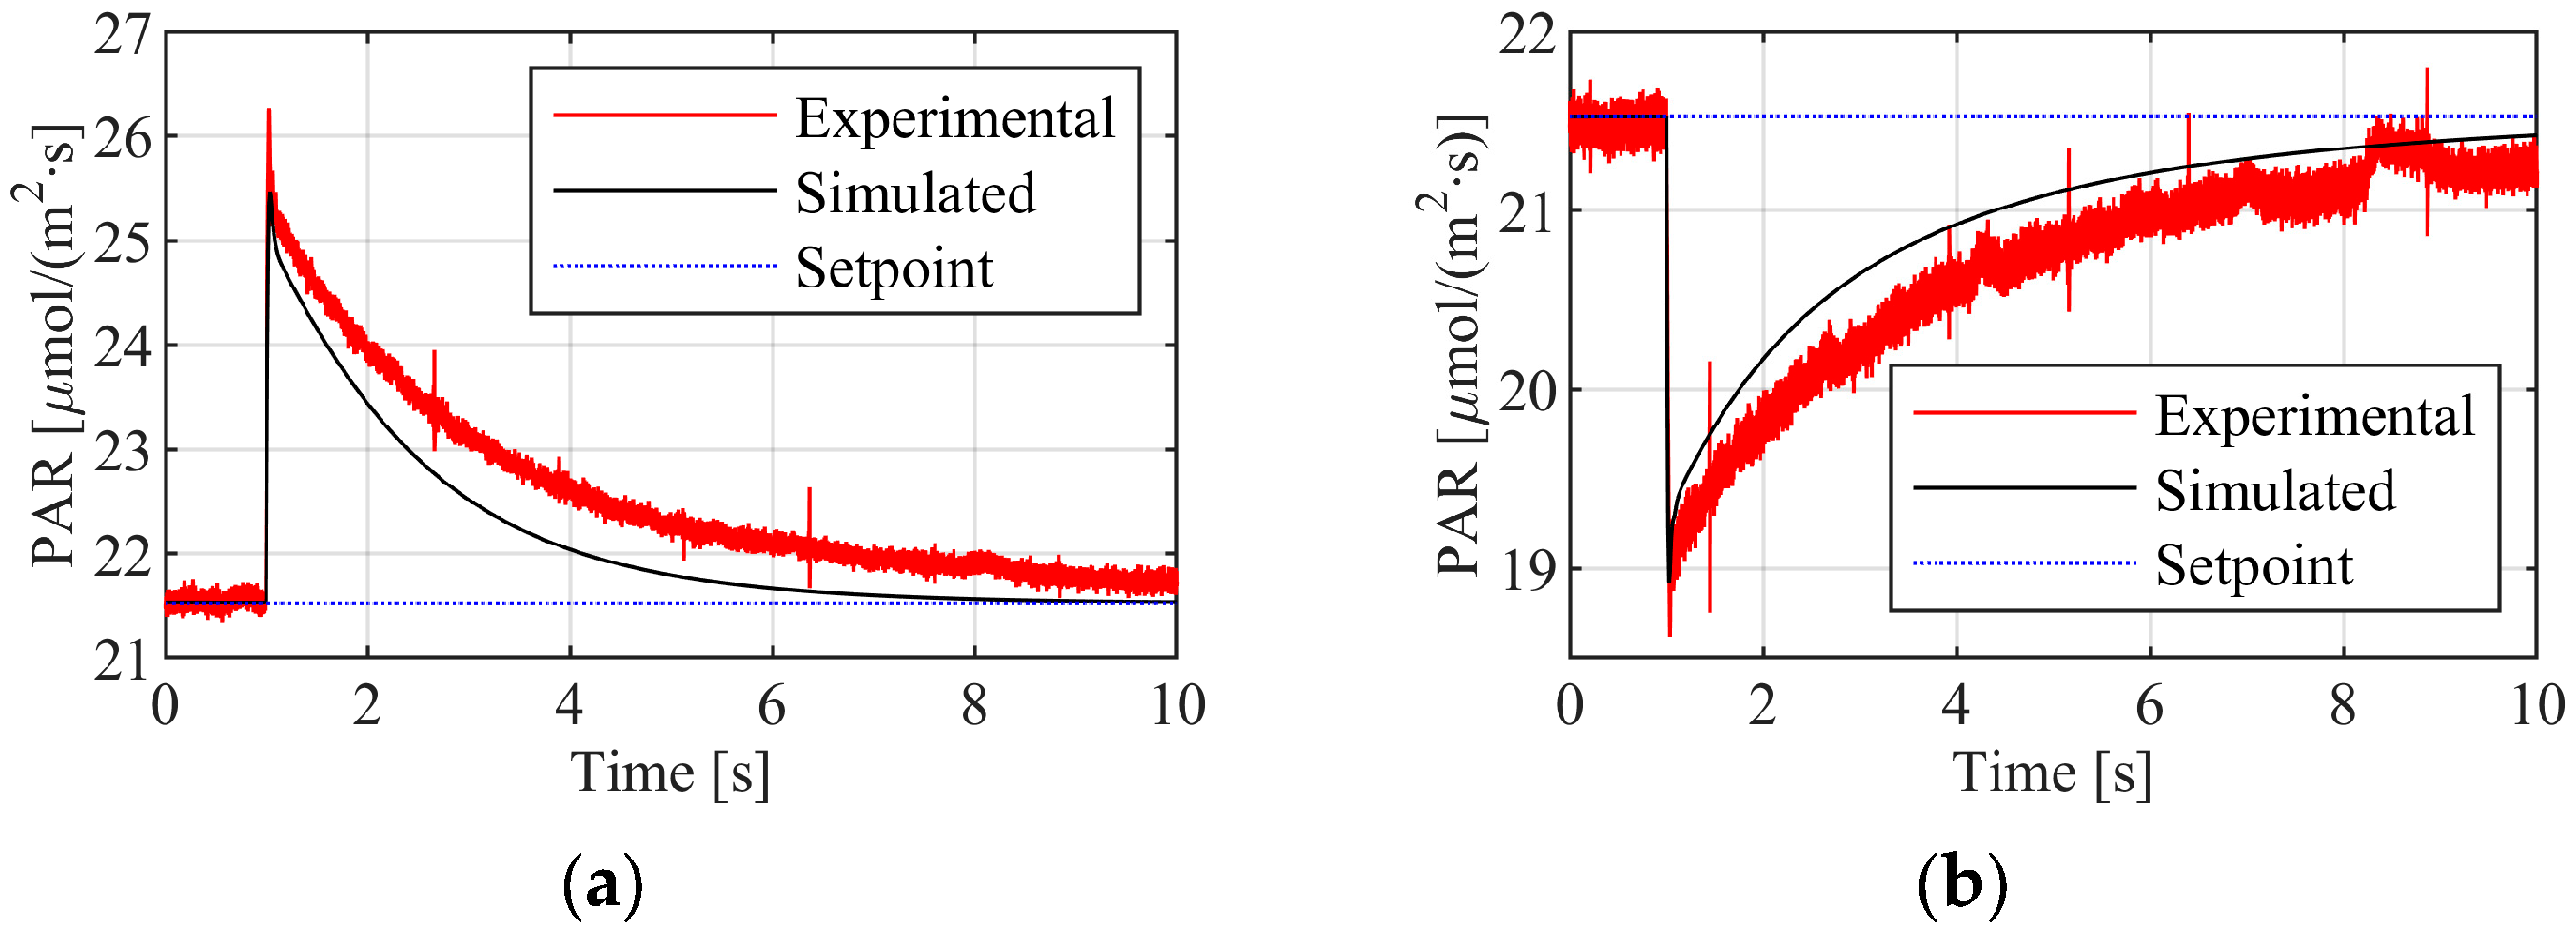
3.2.1. Disturbance Rejection
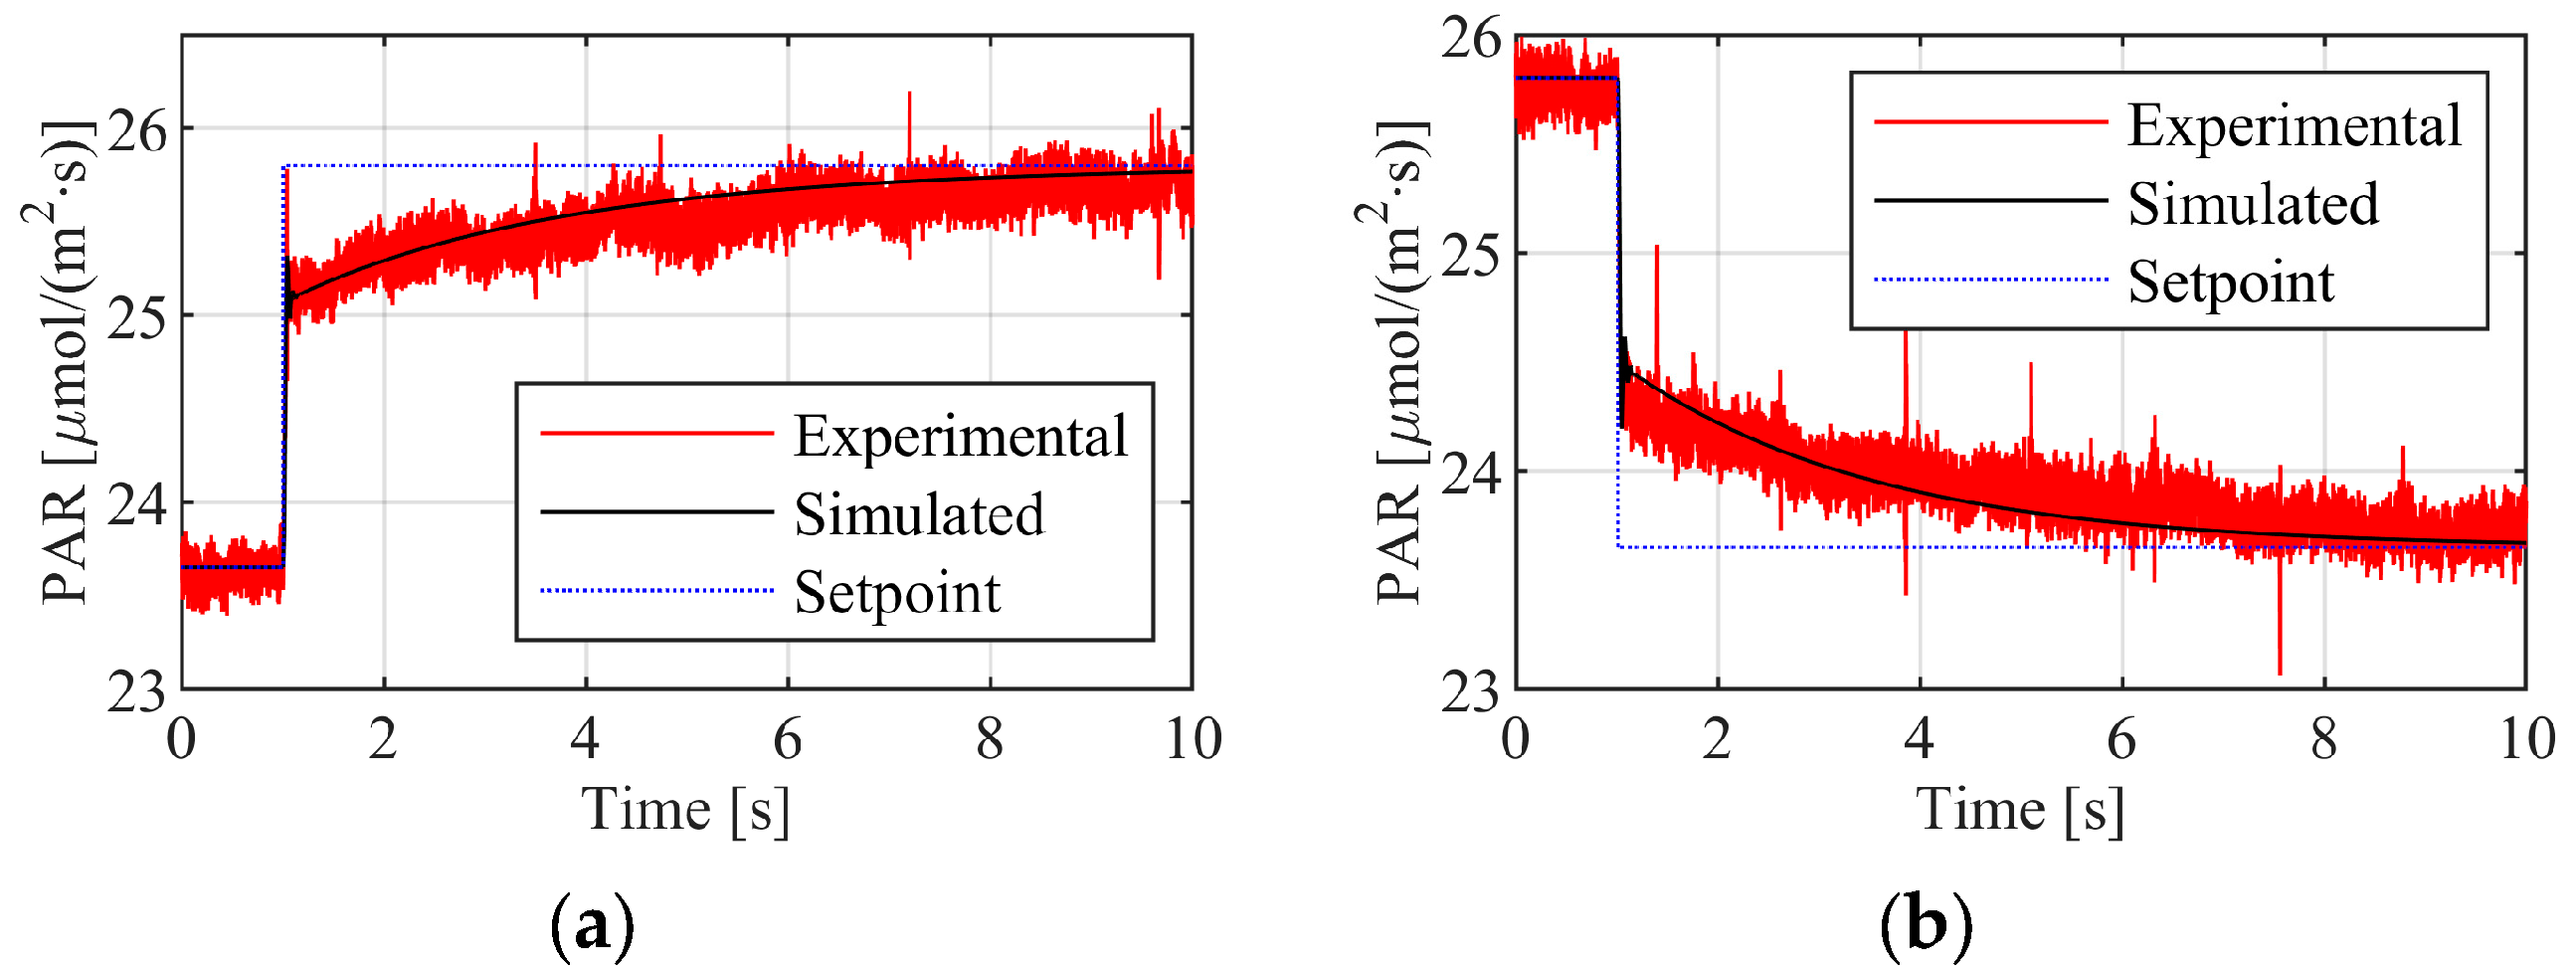
3.2.2. Setpoint Tracking
4. Discussion, Conclusions, and Future Work
Author Contributions
Funding
Data Availability Statement
Acknowledgments
Conflicts of Interest
Abbreviations
| PAM | Pulse Amplitude Modulation |
| PAR | Photosynthetically Active Radiation |
| PDLC | Polymer-dispersed liquid crystal |
| PI | Proportional–integral |
| PWM | Pulse Width Modulation |
References
- Narvaez, F.Y.; Reina, G.; Torres-Torriti, M.; Kantor, G.; Cheein, F.A. A Survey of Ranging and Imaging Technologies for Precisio Agriculture Phenotyping. IEEE ASME Trans. Mech. 2017, 22, 2428–2439. [Google Scholar] [CrossRef]
- Li, T.; Yang, Q. Advantages of Diffuse Light for Horticultural Production and Perspectives for Further Research. Front. Plant Sci. 2015, 6, 704. [Google Scholar]
- Afzali, S.; Mosharafian, S.; van Iersel, M.W.; Velni, J.M. Development and Implementation of an IoT-Enabled Optimal and Predictive Lighting Control Strategy in Greenhouses. Plants 2021, 10, 2652. [Google Scholar] [CrossRef] [PubMed]
- Timmermans, G.H. Advanced Optical Materials for Light Control: On the Road towards Smart Greenhouses. Ph.D. Thesis, Technical University of Eindhoven, Eindhoven, The Netherlands, 6 April 2021. [Google Scholar]
- Hu, C.; Ma, D.; Hassan, M.; Hu, W. NLC: Natural Light Communication using Switchable Glass. In Proceedings of the IEEE INFOCOM 2020—IEEE Conference on Computer Communications Workshop, Toronto, ON, Canada, 6–9 July 2020. [Google Scholar]
- Uranus, H.P. Characterization and Driving of Polymer-dispersed Liquid-crystal Sheet for Smarthome Applications. In Proceedings of the 13th International Symposium on Modern Optics and Its Applications, Tangerang, Indonesia, 2–4 August 2021. [Google Scholar]
- Zhang, R.; Zhang, Z.; Han, J.; Yang, L.; Ii, J.; Song, Z.; Wang, T.; Zhu, J. Advanced Liquid Crystal-based Switchable Optical Devices for Light Protection Applications: Principles and Strategies. Light Sci. Appl. 2023, 12, 11. [Google Scholar] [PubMed]
- Abdulmohsin, H.; Aritra, G.; Senthilarasu, S.; Tapas, K.M. Evaluation of Thermal Performance for a Smart Switchable Adaptive Polymer Dispersed Liquid Crystal (PDLC) Glazing. Sol. Energy 2020, 195, 185–193. [Google Scholar]
- Marinov, Y.G.; Hadjichristov, G.B.; Petrov, A.G. Single-layered Microscale Linear-gradient PDLC Material for Electro-optics. Cryst. Res. Technol. 2009, 44, 870–878. [Google Scholar]
- Körner, W.; Scheller, H.; Beck, A.; Fricke, J. PDLC Films for Control of Light Transmission. J. Phys. D App. Phys. 1994, 27, 2145–2151. [Google Scholar]
- Ghosh, A.; Hafnaoui, R.; Mesloub, A.; Elkhayat, K.; Albaqawy, G.; Alnaim, M.M.; Mayhoub, M.S. Active Smart Switchable Glazing for Smart City: A Review. J. Build. Eng. 2024, 84, 108644. [Google Scholar]
- Jain, A.K.; Deshmukh, R.R. An Overview of Polymer-dispersed Liquid Crystal Composite Films and Their Applications. In Liquid Crystals and Display Technology; Ghamsar, M.S., Carlescu, I., Eds.; IntechOpen: London, UK, 2020; pp. 11–78. [Google Scholar]
- Prabakaran, B. Attaining Thermal Comfort by Utilizing Polymer Dispersed Liquid Crystal Embedded Wind Shield and Roof of a Passenger Car; SAE Technical Paper No. 2021-28-0151; SAE International Warrendale: Pittsburgh, PA, USA, 2021. [Google Scholar]
- Islam, M.S.; Chan, K.; Azmi, A.S.; Pang, W.; Wong, S. Internet of Things-enabled Smart Controller for Polymer Dispersed Liquid Crystal Films. Int. J. Electron. Comput. Eng. 2023, 13, 4708–4720. [Google Scholar]
- Jabbar, J.J.; Zaki, S.M. Smart-glass Glazing using Arduino and Android Application. Int. J. Interact. Mob. Technol. 2021, 15, 54–65. [Google Scholar] [CrossRef]
- Wang, N.; Wang, A.; Zhang, C.; Shan, H.S.; Jia, H.Z.; Zheng, J.H.; Liu, Y.R.; Zuo, L. Self-adaptive PDLC Control Strategy with Smart Light Intensity Adjustment using Photovoltaic-thermoelectric Hybrid Energy Supply Technology. IEEE Trans. Ind. Electron. 2022, 70, 10146–10155. [Google Scholar] [CrossRef]
- Stelzmann, M.; Zahner, F.; Navarro de Sosa, I.; Nemati, A.; Kahnt, A.; Maaß, B.; Drossel, W.-G. Development of a Self-Regulating Solar Shading Actuator Based on the Thermal Shape Memory Effect. Actuators 2024, 13, 85. [Google Scholar] [CrossRef]
- Gadgil, C.; Ghosh, A.; Bhattacharjee, A.; Praveen, P.L. Electrically Powered Active Smart Windows. Next Sustain. 2024, 3, 100027. [Google Scholar] [CrossRef]
- Lami, M.; Al-naemi, F.; Issa, W. Automated Quantification System for Vision through Polymer-dispersed Liquid Crystal Double-glazed Windows: Circuit Implementation. IET Circuits Devices Syst. 2022, 17, 38–52. [Google Scholar] [CrossRef]
- Chu, Y.; Miao, Z.; Wang, D. Stepwise Driving and Multi-transparency of Polymer Dispersed Liquid Crystals. Liq. Cryst. 2022, 50, 222–230. [Google Scholar]
- Sanchez-Pena, J.M.; Vazquez, C.; Perez, I.; Rodriguez, I.; Oton, M. Electro-optic System for Online Light Transmission Control of Polymer-dispersed Liquid Crystal Windows. Opt. Eng. 2002, 41, 1608–1611. [Google Scholar]
- Alghamdi, H.; Almawgani, A.H.M. Smart and Efficient Energy Saving System using PDLC Glass. In Proceedings of the 2019 Smart City Symposium, Prague, Czech Republic, 23–24 May 2019. [Google Scholar]


| Gain | Value | Units |
|---|---|---|
| 0.1190 | V/(μmol/m2/s) | |
| 0.0714 | V/(μmol·s/m2/s) |
| Gain | Value | Units |
|---|---|---|
| 275,000 ± 0.005 | Ω | |
| 566 ± 0.0005 | nF | |
| 987.28 ± 0.005 | Ω |
| Coefficient | Value |
|---|---|
| 0.1331 | |
| −0.5184 | |
| 8.4437 | |
| 0.1811 | |
| −0.8825 | |
| 15.5613 |
| Coefficient | Up | Down | Average |
|---|---|---|---|
| 358,800 | 549,300 | 454,050 | |
| 1 | 1 | 1 | |
| 134.1 | 180.8 | 157.5 | |
| 16,440 | 22,100 | 19,370 | |
| 358,800 | 549,300 | 454,050 |
Disclaimer/Publisher’s Note: The statements, opinions and data contained in all publications are solely those of the individual author(s) and contributor(s) and not of MDPI and/or the editor(s). MDPI and/or the editor(s) disclaim responsibility for any injury to people or property resulting from any ideas, methods, instructions or products referred to in the content. |
© 2025 by the authors. Licensee MDPI, Basel, Switzerland. This article is an open access article distributed under the terms and conditions of the Creative Commons Attribution (CC BY) license (https://creativecommons.org/licenses/by/4.0/).
Share and Cite
Pesch, A.H.; Vetter, C. A Control-Oriented Model for Polymer-Dispersed Liquid Crystal Films as an Actuator for Natural Light Control. Actuators 2025, 14, 167. https://doi.org/10.3390/act14040167
Pesch AH, Vetter C. A Control-Oriented Model for Polymer-Dispersed Liquid Crystal Films as an Actuator for Natural Light Control. Actuators. 2025; 14(4):167. https://doi.org/10.3390/act14040167
Chicago/Turabian StylePesch, Alexander H., and Chiara Vetter. 2025. "A Control-Oriented Model for Polymer-Dispersed Liquid Crystal Films as an Actuator for Natural Light Control" Actuators 14, no. 4: 167. https://doi.org/10.3390/act14040167
APA StylePesch, A. H., & Vetter, C. (2025). A Control-Oriented Model for Polymer-Dispersed Liquid Crystal Films as an Actuator for Natural Light Control. Actuators, 14(4), 167. https://doi.org/10.3390/act14040167