Article

Association Model-Based Intermittent Connection Fault Diagnosis for Controller Area Networks

by
Longkai Wang
,
Shuqi Hu
and
Yong Lei
*
State Key Laboratory of Fluid Power and Mechatronic Systems, Zhejiang University, Hangzhou 310027, China
*
Author to whom correspondence should be addressed.
Actuators 2024, 13(9), 358; https://doi.org/10.3390/act13090358
Submission received: 13 August 2024 / Revised: 9 September 2024 / Accepted: 12 September 2024 / Published: 14 September 2024
(This article belongs to the Section Control Systems)

Abstract

:
Controller Area Networks (CANs) play an important role in many safety-critical industrial systems, which places high demands on their reliability performance. However, the intermittent connection (IC) of network cables, a random and transient connectivity problem, is a common but hard troubleshooting fault that can cause network performance degradation, system-level failures, and even safety issues. Therefore, to ensure the reliability of CANs, a fault symptom association model-based IC fault diagnosis method is proposed. Firstly, the symptoms are defined by examining the error records, and the domains of the symptoms are derived to represent the causal relationship between the fault locations and the symptoms. Secondly, the fault probability for each location is calculated by minimizing the difference between the symptom probabilities calculated from the count information and those fitted by the total probability formula. Then, the fault symptom association model is designed to synthesize the causal and the probabilistic diagnostic information. Finally, a model-based maximal contribution diagnosis algorithm is developed to locate the IC faults. Experimental results of three case studies show that the proposed method can accurately and efficiently identify various IC fault location scenarios in networks.

1. Introduction

Controller area networks (CANs), as field buses that effectively support distributed and real-time control, have been widely applied in many safety-critical networked automation applications, such as DeviceNet-based manufacturing systems, whose underlining physical and data-link layers use the CAN protocol [1]. However, in practice, numerous factors, such as mechanical vibration, environmental disturbances, and inappropriate human intervention, can cause faults in the CAN. Among the various faults in the networks, an intermittent fault (IF) is a difficult troubleshooting problem that recurs within a certain period of time at the same location [2]. The frequency of IFs is usually approximately 10 to 30 times that of permanent faults [3,4]. Intermittent connection (IC) faults, which are the focus of this paper, are a cable connection type of IF in which network cables randomly disconnect for a short duration; faults of this type have been reported in various industries, such as manufacturing and automotive [5]. For example, IC faults are reportedly one of the root causes of No Fault Found (NFF) events [6], which account for 21–70% of failure events in avionics and automotive electronic systems [5,7,8]. According to a survey conducted in a major automobile manufacturing plant, nearly 54% of network system downtime is caused by cable damage, wear, and loose connections [9]. On an automotive manufacturing line, IC faults often occur on trunk cables when the network is mounted in a vibration environment or on repetitively moving equipment, and IC faults on drop cables are also common since most system reconfigurations and maintenance actions involve disassembling and reconnecting the drop cables in the network, which are prone to wear and improper maintenance. During the early stage, an IC fault will cause transmission delay or message loss via random interruption of bus communication, leading to deterioration in network performance. In severe cases, IC faults can cause nodes to detach from the network, which can lead to the shutdown of safety-critical systems, increase network maintenance costs, and even cause safety hazards [10]. For example, IC faults have been reported as one of the major threats to customer satisfaction and automaker cost control [5,6,11,12]. The impacts of cable connection problems on the costs incurred by aviation system manufacturers have also been reported [13,14].
Unfortunately, IC faults are hidden and difficult to diagnose. First, since the CAN nodes share the bus medium, the cable disconnections resulting from IC faults affect the entire bus, making it challenging to establish a direct mapping between the fault location and the affected nodes. Second, IC faults appear randomly and cannot be reproduced when the system is shut down or idle. Therefore, online localization of IC faults before they cause further system-level damage is an important challenge in CAN-based industrial systems that urgently needs to be addressed.
In the literature, the fault diagnosis of electronic circuits has been widely studied. He et al. proposed an analog circuit fault diagnosis method in which cross-wavelet singular entropy is used for fault feature extraction and the optimal features obtained through parametric t-distributed stochastic neighbor embedding are entered into a support vector machine classifier to locate faulty components [15]. He et al. proposed an analog circuit component fault diagnosis method using the time–frequency features of fault signals and a vector-valued regularized kernel function approximation classification algorithm [16]. Zhang et al. proposed a multifault diagnosis method for a lithium-ion battery pack based on a voltage difference analysis technique, where the diagnosable faults included internal resistance faults and connection faults [17]. However, these methods are primarily oriented toward electronic component faults and do not apply to circuit line intermittent faults.
In recent years, an extensive literature related to IF diagnosis has been published. Some studies have focused on the detection and recognition of IFs [4,18,19,20,21,22,23,24,25,26]; for example, Fang et al. proposed a density peak clustering-based IF recognition method for analog circuits [4]. Zhang et al. proposed a residual evaluation model to detect sensor IFs [20]. Cai et al. proposed a dynamic Bayesian network-based fault diagnosis method for recognizing transient faults, IFs, and permanent faults in electronic systems [22]. Gouda et al. proposed a one-shot likelihood ratio test for evaluating the IF status of individual sensor nodes in wireless sensor networks [24]. However, a practical procedure for IF localization was not described in the aforementioned studies.
Studies have also been conducted on locating IFs in several industrial systems. For instance, Yu et al. developed an IF detection and isolation method for a steer-by-wire system based on a composite degradation model [27]. Yaramasu et al. proposed an intermittent wiring fault location method for aircraft power distribution systems based on the estimation of load circuit model coefficients and parameters [28]. Huang et al. proposed an improved deep forest classifier to locate IFs in analog circuits [29]. Furse et al. utilized spread spectrum time-domain reflectometry and sequence time-domain reflectometry to locate intermittent wiring faults in aircraft power circuits [30,31]. Jiang et al. developed a support vector machine-based IF location method for aircraft fuel systems [32]. Alamuti et al. proposed a method for locating intermittent arcing faults in low-voltage radial feeders based on time-domain formulations [33]. Farughian et al. proposed an intermittent earth fault passage indication method to locate the faulty segment in a compensated distribution network [34]. Li et al. presented a data-driven method based on dynamic principal component analysis for diagnosing IFs in spacecraft gyroscopes [35]. Li et al. proposed a fault diagnosis method based on dynamic analysis for electronic systems with transient faults and IFs [36]. Yan et al. proposed an IF detection and isolation method for linear stochastic systems [37]. Song et al. developed a probabilistic diagnosis algorithm to locate intermittently faulty nodes in a randomly generated network [38]. However, the methods proposed in [27,28,29,30,31,32,33,34,35,36,37,38] are applicable only to specific devices or ad hoc systems and are not suitable for CANs.
Various aspects of CANs have been studied. For example, in fault diagnosis-related studies, Kelkar et al. devised an adaptive fault diagnosis algorithm for CANs (AFDCAN), which uses a definite number of testing rounds and messages to detect faulty nodes in a CAN [39,40], and similar work was also reported by Nath et al. [41]. Yang et al. presented an anomaly detection method for detecting persistent anomalies in CAN buses, such as terminal resistance loss and cable degradation [42]. Hassen et al. located a wire fault in a CAN bus based on an orthogonal multitone time-domain reflectometry method [43]. Hu et al. implemented the online diagnosis of node faults and permanent communication link faults in a CAN based on a network management program [44]. Gao et al. determined fault duration based on the affected message time intervals and identified the fault type by monitoring the fault features [45]. However, the methods developed in [39,40,41,42,43,44,45] can address only permanent faults and are not suitable for diagnosing IFs in a CAN.
Several studies have also analyzed the CAN network performance under IFs, such as electrical fast transients (EFTs) and electromagnetic interference (EMI). For example, Pohren et al. analyzed the performance of the CAN with a Flexible Data (CAN-FD) protocol using the EFT injection method [46]. Roque et al. developed a runtime fault diagnostic mechanism to monitor the performance degradation of in-vehicle networks using an early fault modeling approach [47]. Nevertheless, localization techniques for cable IC faults are not addressed in these methods.
Recently, several studies have been conducted on the cable IC problem for CANs. Lei et al. proposed an early IC fault detection method based on a ranked probability control chart, which is effective at monitoring the shifting of error distributions [48]. However, identification of the IC fault location was not addressed. Lei and Djurdjanovic developed a graph-based IC fault location method [49]. Lei et al. also developed a drop cable IC fault location method using the confidence intervals of the parameters of a generalized zero-inflated Poisson model [50]. However, the methods proposed in [49,50] are constrained to IC faults on drop cables in the network. To localize IC faults on both drop and trunk cables, Lei et al. proposed a two-step IC fault location method based on the statistical significance of the error event model parameters [51]. However, this approach is not robust since it relies on analog information analysis based on physical layer information. In addition, this approach can only address a single trunk cable IC fault in the network. Subsequently, IC fault diagnosis methods based on the data link layer were studied. Zhang et al. proposed an IC fault location method based on data link layer error information that uses a concurrent localization algorithm to find faulty links [52]. Zhang et al. proposed a tree-based minimal cost diagnosis algorithm to diagnose IC faults [53]. However, the diagnostic strategies of [52,53] have poor discriminability and can only locate IC faults on up to two trunk cables in the network. In addition, these knowledge-based approaches cannot precisely quantify the probability of fault occurrence for every cable. Wang et al. proposed an IC fault diagnosis approach for CANs using a divide-and-conquer strategy [54]. However, this method requires that the cable connectors of all nodes be accessible to sensors, which is not always feasible in engineering environments. Furthermore, this method generally requires repeated diagnosis to locate all IC faults.
Table 1 presents a summary of the main aspects of the problem addressed in the literature and the corresponding research gaps. As shown in Table 1, even methods designed specifically to address the IC fault localization problem for CANs [49,50,51,52,53,54] still have the following drawbacks: First, existing methods cannot handle general IC location scenarios, such as cases in which multiple trunk cables suffer from IC faults, which are prone to occur in practical engineering environments. Second, due to the lack of precise quantification of the fault probability for every cable, the diagnostic accuracy of the existing methods is limited; i.e., the cable condition between the two most marginal trunk faults cannot be identified. Third, existing methods require repeated diagnosis for complete identification of multiple IC faults. In order to overcome the diagnosability and diagnostic accuracy limitations of existing methods without adjusting the sensor positions, as well as to overcome the diagnostic efficiency limitation of the existing methods that require repetitive diagnosis, there is a particular need to develop a generalized IC fault diagnosis method to accurately diagnose complex scenarios, such as multiple trunk cable IC faults, without need for repeated diagnosis, which is the gap covered by the present work, as highlighted in Table 1.
To this end, this paper proposes an IC fault diagnosis method for CANs based on fault symptom association models. The advantages of the proposed method are as follows:
  • The proposed diagnostic method has wider applicability to fault conditions as it can completely locate IC faults in complex location scenarios that cannot be handled by existing methods, such as IC faults on multiple trunk cables.
  • Fault symptom association models are developed for precisely quantifying the fault probability for each cable and the causality of each cable fault with respect to the recorded symptoms, thereby ensuring higher diagnostic accuracy than that of existing methods.
  • The proposed framework has higher diagnostic efficiency as it can produce the accurate result in a single diagnostic process, whereas the existing methods require repeated diagnosis of several areas in the network.
The results of this work will facilitate the development of an online IC fault diagnostic tool that can be attached to CAN-based systems to diagnose IC fault-induced system failures and ultimately improve system reliability.
The remainder of this paper is organized as follows: Section 2 introduces the characteristics of IC faults and presents the problem definition. The IC fault diagnosis methodology is proposed in Section 3, including the symptoms and their domains, the fault symptom association models, and the model-based maximal contribution diagnosis algorithm. Section 4 describes the construction of a testbed and reports case studies conducted to demonstrate the effectiveness of the proposed method. The proposed method is compared with the existing IC fault diagnosis methods in Section 5 to show the advantages and improvements of the proposed method. Section 6 concludes the paper and discusses future work.

2. Preliminaries

In this section, the CAN fault-handling mechanism and the categories of IC faults are introduced, and then the problems faced in this work are presented.

2.1. CAN Fault-Handling Mechanism

A CAN is a shared-medium access network that uses a two-wire differential signal, which has two logical states: recessive and dominant [55]. According to the bit-stuffing mechanism in the CAN protocol, after five identical logical bits appear, an opposite bit is automatically inserted [56]. Five types of errors can be detected: bit error, stuff error, CRC error, form error, and acknowledgment error. As soon as an error condition is detected, the corresponding node sends an error frame that contains six successive dominant bits, thus violating the bit-stuffing mechanism. Hence, other nodes in the network can learn of the error and send their own error frames to interrupt the current transmission. Communication will resume when the bus is idle again [55].

2.2. Introduction to IC Faults

The IC fault studied in this paper is the phenomenon of short-time cable disconnection. At the location where an IC fault occurs, this open-circuit fault will turn the dominant bit into the recessive bit. For the whole bus, different IC fault locations will result in different error patterns on the bus. Therefore, we classify IC faults into two categories based on location: a local IC fault occurs on the drop cable, and a trunk IC fault occurs on the trunk cable, as shown in Figure 1. To facilitate analysis, we assume in this section that node 1 is the sending node. The details of the possible error patterns on the bus are introduced as follows:

2.2.1. Local IC Faults

There are two scenarios in which a local IC fault may occur. As shown in Figure 1, scenario A is the case in which an IC fault occurs on the drop cable of the sending node, i.e., node 1. In this case, the data transmitted on the bus are different from those sent by node 1. Thus, all nodes will detect the error and send error frames simultaneously.
In scenario B, an IC fault occurs on the drop cable of a nonsending node, e.g., node 4. In this case, the data transmitted on the bus are the same as those sent by node 1. Since only node 4 is affected by the IC fault, only the data received by node 4 are different from the data transmitted on the bus. Thus, node 4 will be the first to send an error frame to interrupt transmission.

2.2.2. Trunk IC Faults

In scenario C, as shown in Figure 1, a trunk IC fault divides the bus into left and right segments. Due to the disruption caused by the trunk IC fault, only the data transmitted on the bus to the left of the IC fault are the same as those sent by node 1, whereas the data transmitted on the bus to the right of the IC fault are different from those sent by node 1. Hence, the nodes connected to the bus to the right of the IC fault, i.e., node 3 and node 4, will be the first to send error frames to interrupt transmission.

2.3. Problem Definition

It is easy to determine whether an IC fault has occurred in the network by detecting an error frame. However, locating the corresponding IC fault is quite difficult since the diagnostic information embedded in the error frame is limited. Therefore, to diagnose IC faults, the following problems must be addressed:
(1)
Given a sequence of error frames, how to describe the error patterns to enable identification of the IC fault category?
(2)
How to determine the range of possible IC faults implied by each error pattern? In addition, how to precisely quantify the possibility of each IC fault?
(3)
How to filter the exact IC fault location from the fault range without misdiagnosis and missed diagnosis?
Four assumptions are adopted in this paper: (1) The links connecting the data collection points to the network are reliable. (2) The occurrences of IC faults are independent from each other and persist over time. (3) Each node sends a finite amount of I/O status data frames. (4) The network configuration remains unchanged during system operation.

3. Methodology

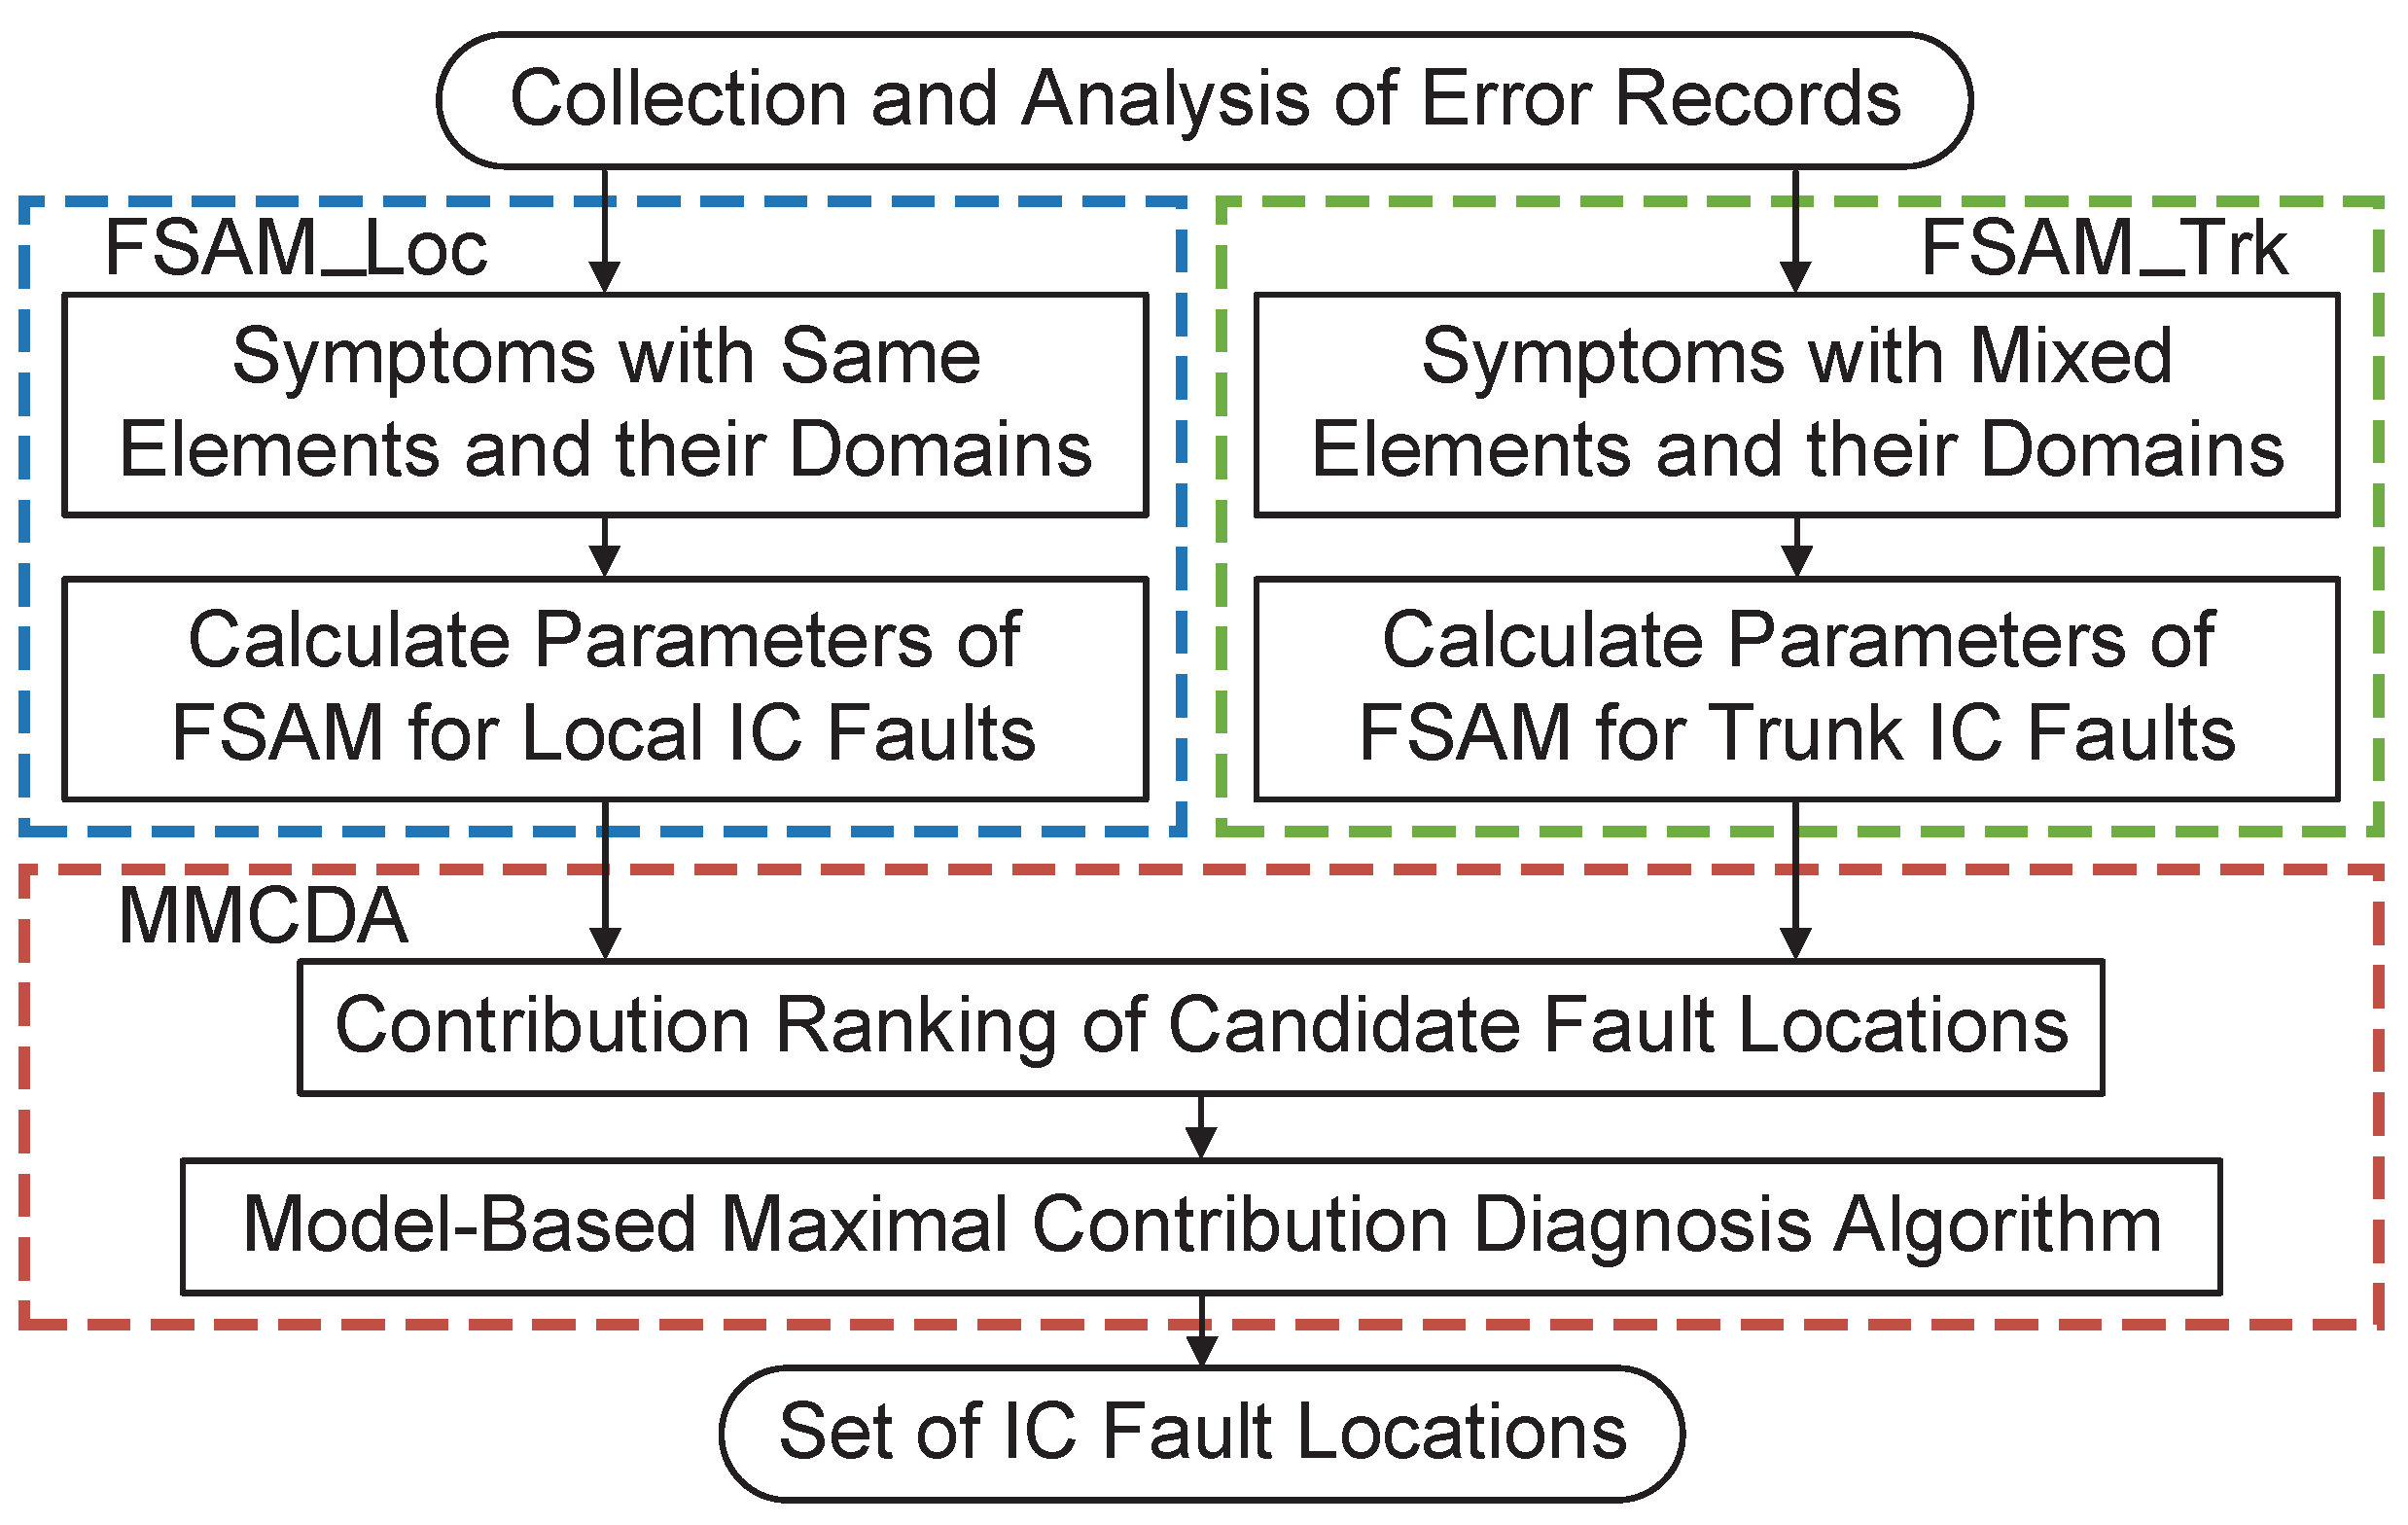
In this section, a fault symptom association model-based IC fault diagnosis method is proposed to identify various fault location scenarios in a CAN. The basic idea of this methodology is that by building fault symptom association models to quantitatively describe the fault probability for each cable link and the causality for each cable link with respect to the error records, it becomes possible to locate all IC faults by finding the link set that can best explain the error records in accordance with the fault probability.
The overall framework of the proposed method is shown in Figure 2. When a set of errors is recorded, the error records are analyzed to obtain the symptoms for all nodes. Then, the domains of the symptoms can be derived based on the network topology. Next, by using the count information of different symptoms, the parameters of fault symptom association models (FSAMs) for local (FSAM_Loc) and trunk (FSAM_Trk) IC faults, including the occurrence probability of each fault in the domain and the causality of each fault with respect to each symptom, can be calculated separately based on the total probability formula. Finally, based on the contribution rankings obtained from the two FSAMs, all IC faults can be accurately localized by applying a model-based maximum contribution diagnosis algorithm (MMCDA). The details of the proposed method are introduced as follows:

3.1. Collection and Analysis of Error Records

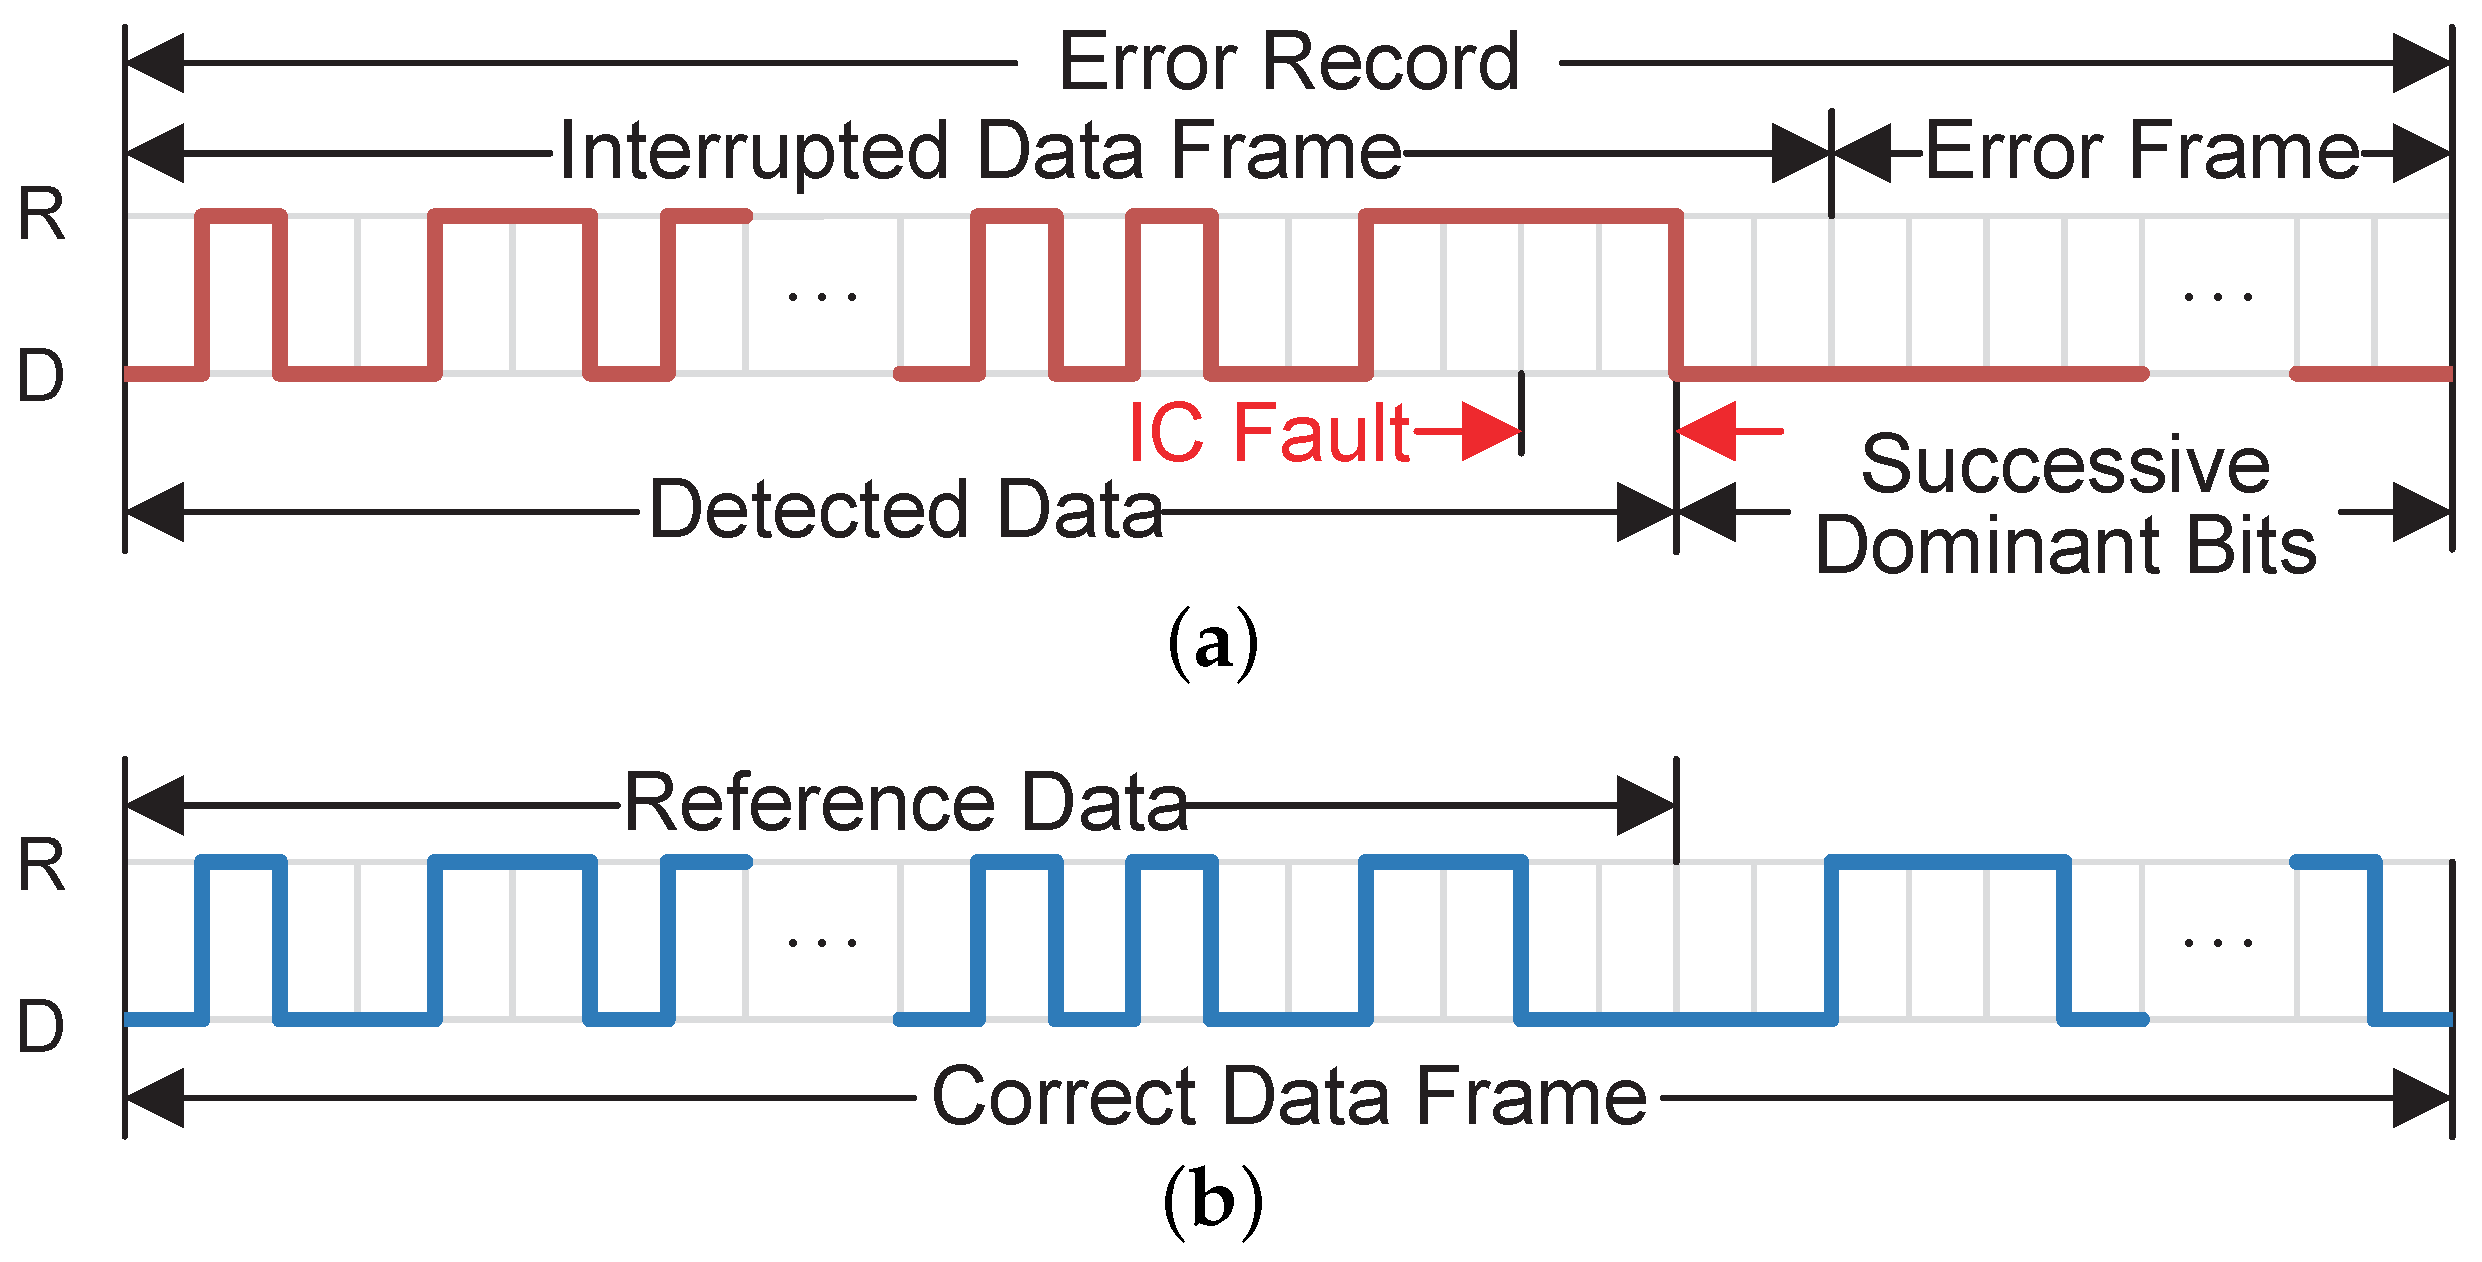
To retrieve the important information of each error, i.e., its sending node address and the difference between it and the correct data frame, the field programmable gate array (FPGA)-based collection hardware is deployed at both ends of the bus, as represented by collection points C 1 and C 2 in Figure 3. Once an error frame is detected, i.e., a frame with six successive dominant bits, the collection hardware is triggered to collect an error record. An example of an error record collected at a collection point is shown in Figure 4a, which includes the interrupted data frame and the error frame.
As illustrated in Figure 4a, the error frame may start at a dominant bit of the interrupted data frame; consequently, the end of the interrupted data frame cannot be identified, making it difficult to extract the interrupted data frame. Therefore, we define the logical sequence before the first bit of the sequence of successive dominant bits as the detected data, which form part of the interrupted data frame. The node address of each error record can be obtained by reading the address segment of the detected data. Additionally, the correctly transmitted data frame is recorded by a CAN analyzer, as shown in Figure 4b, in which the logical sequence corresponding to the detected data is defined as the reference data for further symptom analysis.

3.2. Generation of Symptoms

Once the node address of an error record is determined, the detected data recorded at the two collection points are compared with the reference data bit by bit. If the detected data are the same as the reference data, this indicates that no IC fault has occurred on the links between the sending node and the collection point, and the comparison result is defined as a “0” event. Otherwise, it can be concluded that IC faults have occurred on the links between the sending node and the collection point, and the comparison result is defined as a “1” event. Accordingly, for each error record, a symptom is generated by combining the comparison results from the two collection points:
S N r = ( s C 1 , s C 2 ) , s C 1 , s C 2 { 0 , 1 }
where N r is the node address of the error record, with r { 1 , 2 , , n } , and s C k is the comparison result from collection point C k , with k { 1 , 2 } . Thus, there are four possible symptom modes. For further analysis, suppose that there are m r possible symptom modes for node N r , which can be represented as follows:
S N r < 1 > = ( s C 1 < 1 > , s C 2 < 1 > ) S N r < 2 > = ( s C 1 < 2 > , s C 2 < 2 > ) S N r < m r > = ( s C 1 < m r > , s C 2 < m r > )
where S N r < t > is the t-th symptom mode for node N r , with t { 1 , 2 , , m r } , and s C k < t > is the comparison result from collection point C k in S N r < t > , with k { 1 , 2 } .
Definition 1. 
Communication Link: A communication link L N r C k is the minimum-size set of links through which data are transmitted from node N r to collection point C k . For example, the communication link L N 1 C 2 in the network topology shown in Figure 3 is { l 1 , l 5 , l 6 , l 7 } .
Under different IC fault scenarios, the system will exhibit distinct symptom modes. The details of the symptom modes are introduced as follows:

3.2.1. Symptom Modes for Local IC Faults

As discussed in Section 2.2.1, in scenario A, the detected data recorded at both collection points are different from the reference data; thus, the symptom for node 1 is S N 1 = ( 1 , 1 ) , which indicates that IC faults have occurred on communication links L N 1 C 1 and L N 1 C 2 . In scenario B, the detected data recorded at both collection points are the same as the reference data; thus, the symptom for node 1 is S N 1 = ( 0 , 0 ) , which indicates that communication links L N 1 C 1 and L N 1 C 2 are free of IC faults. Therefore, the symptom modes related to local IC faults correspond to symptoms with the same elements, i.e., ( 0 , 0 ) and ( 1 , 1 ) .

3.2.2. Symptom Modes for Trunk IC Faults

As discussed in Section 2.2.2, in scenario C, the detected data recorded at C 1 are the same as the reference data, while the detected data recorded at C 2 are different from the reference data. Thus, the symptom for node 1 is S N 1 = ( 0 , 1 ) , which indicates that L N 1 C 1 is free of IC faults, while L N 1 C 2 has suffered an IC fault. Similarly, if node 3 is transmitting when a trunk IC fault occurs, the symptom for node 3 is S N 3 = ( 1 , 0 ) . Therefore, the symptom modes related to trunk IC faults correspond to symptoms with mixed elements, i.e., ( 0 , 1 ) and ( 1 , 0 ) .

3.3. Derivation of Symptom Domains

Based on the above analysis, each symptom for a node contains information on whether IC faults have occurred on the communication links between that node and each collection point. Hence, in combination with the network topology, each symptom can be used to derive a set of possible faulty links.
Definition 2. 
Symptom Domain: The domain of symptom S N r , which is denoted by F N r , is defined as the set of possible faulty links that can lead to S N r ; that is, an IC fault occurring on any link in the corresponding symptom domain can result in S N r .
For the two types of symptom modes, the symptom domains are derived separately, as follows:

3.3.1. Symptom Domains for Local IC Faults

In this case, only the symptoms ( 0 , 0 ) and ( 1 , 1 ) are considered. For symptom S N r < t > = ( 0 , 0 ) , since s C 1 < t > = 0 and s C 2 < t > = 0 , then both L N r C 1 and L N r C 2 are free of IC faults. In other words, the possible faulty links can be inferred as the drop links other than L N r C 1 and L N r C 2 . Thus, the domain of symptom S N r < t > = ( 0 , 0 ) can be derived as
F N r < t > = { l j | l j ( L D L N r C 1 L N r C 2 ) } , s.t. , S N r < t > = ( 0 , 0 )
where L D is the set of all drop links in the network.
For symptom S N r < t > = ( 1 , 1 ) , since s C 1 < t > = 1 and s C 2 < t > = 1 , then the IC fault exists on both L N r C 1 and L N r C 2 at the same time. That is, the possible faulty links can be inferred as the overlap between L N r C 1 and L N r C 2 . Thus, the domain of symptom S N r < t > = ( 1 , 1 ) can be derived as
F N r < t > = { l j | l j L N r C 1 L N r C 2 } , s.t. , S N r < t > = ( 1 , 1 )

3.3.2. Symptom Domains for Trunk IC Faults

In this case, only the symptoms ( 0 , 1 ) and ( 1 , 0 ) are considered. For node N r , if there exists a collection point C v , v { 1 , 2 } such that s C v = 0 during the whole data collection process, then L N r C v can be inferred to be fault-free. By conducting the same analysis for all nodes, the set of normal (fault-free) trunk links can be obtained, i.e.,
L n o r m a l = r = 1 n v : s C v = 0 L N r C v
In this way, the possible faulty links are first compressed to the trunk links except those in L n o r m a l , i.e., L T L n o r m a l , where L T is the set of all trunk links in the network.
For symptom S N r < t > = ( 0 , 1 ) , s C 1 < t > = 0 indicates that L N r C 1 is fault-free while s C 2 < t > = 1 indicates that L N r C 2 has an IC fault. That is, the possible faulty links can be inferred as the trunk links that belong to L N r C 2 and not to L N r C 1 . Thus, in combination with (5), the domain of symptom S N r < t > = ( 0 , 1 ) can be derived as
F N r < t > = { l j | l j L T L n o r m a l ( L N r C 2 L N r C 1 ) } , s.t. , S N r < t > = ( 0 , 1 )
In the same way, it is easy to obtain the following derivation for the domain of symptom S N r < t > = ( 1 , 0 ) :
F N r < t > = { l j | l j L T L n o r m a l ( L N r C 1 L N r C 2 ) } , s.t. , S N r < t > = ( 1 , 0 )
Example 1. 
Derivation of the symptom domains: To facilitate the reader’s understanding, the bus topology shown in Figure 3 is used in the following examples. If we assume that an IC fault has occurred on l 2 , then the symptom for node 2 is S N 2 < 1 > = ( 1 , 1 ) , and those for the other nodes are S N 1 < 1 > = S N 3 < 1 > = S N 4 < 1 > = ( 0 , 0 ) . The domains of S N 2 < 1 > = ( 1 , 1 ) and S N 1 < 1 > = ( 0 , 0 ) can be derived as follows:
Based on the network topology, we can obtain L N 2 C 1 = { l 2 , l 5 } and L N 2 C 2 = { l 2 , l 6 , l 7 } . Since S N 2 < 1 > = ( 1 , 1 ) , we can obtain its domain by applying (4).
F N 2 < 1 > = L N 2 C 1 L N 2 C 2 = { l 2 }
Based on the network topology, we can obtain L D = { l 1 , l 2 , l 3 , l 4 } , L N 1 C 1 = { l 1 } , and L N 1 C 2 = { l 1 , l 5 , l 6 , l 7 } . Since S N 1 < 1 > = ( 0 , 0 ) , we can obtain its domain by applying (3).
F N 1 < 1 > = L D L N 1 C 1 L N 1 C 2 = { l 2 , l 3 , l 4 }

3.4. Fault Symptom Association Model (FSAM)

According to Definition 2 in Section 3.3, each link has a causal relationship with the symptoms whose domains contain that link. That is, if l j F N u , then IC faults occurring on l j will increase the quantity of observations of symptom S N u . Therefore, for each link, the probability of IC faults occurring on that link can be calculated from the count values of all symptoms causally related to that link.
In this work, FSAMs are used to quantitatively describe the relationship between links and symptoms, including the fault probability for each link and which symptoms a fault on this link can cause. The symptom domains for the two types of IC faults are used to construct separate FSAMs for local and trunk IC faults. In the following subsections, we first introduce the detailed construction process for the local IC fault FSAM and then emphasize the differences in the trunk IC fault FSAM.

3.4.1. FSAM for Local IC Faults (FSAM_Loc)

In this subsection, only the local IC fault-related symptoms ( 0 , 0 ) and ( 1 , 1 ) and their corresponding domains are used to build the FSAM for local IC faults (FSAM_Loc).
Let S l o c denote the symptom set formed by sequentially combining the local IC fault-related symptoms of all n nodes:
S l o c = { S N 1 < 1 > , , S N 1 < m 1 l o c > , S N 2 < 1 > , , S N 2 < m 2 l o c > , , S N n < 1 > , , S N n < m n l o c > } = { S 1 , S 2 , , S m 1 l o c + m 2 l o c + + m n l o c }
where m r l o c denotes the number of symptom modes related to local IC faults for N r and S i denotes the i-th symptom in S l o c .
Let F S l o c denote the candidate fault location set for S l o c , i.e., the union of the domains of the symptoms in S l o c :
F S l o c = r = 1 n t = 1 m r l o c F N r < t >
Based on the count information for each symptom, the actual probability of the occurrence of symptom S i can be calculated directly from the proportion of the quantity of symptom S i to the quantity of all symptoms, that is,
p ( S i ) = val ( S i ) S o S l o c val ( S o )
where val ( S i ) denotes the count value for symptom S i .
Using the law of total probability, the probability of the occurrence of S i ( p ( S i ) ) can also be estimated as follows:
p ^ ( S i ) = l j : l j F S l o c p ( S i | l j ) · p ( l j )
where p ( l j ) is the fault probability for link l j and p ( S i | l j ) is the probability of detecting S i when an IC fault occurs on l j .
As elaborated in Section 3.3, the domain of a symptom specifies the fault links that can lead to that symptom. Thus, p ( S i | l j ) can be calculated based on the domain information of each symptom. If the domain of symptom S i does not include l j , then when the IC fault occurs on l j , one can not detect S i , hence p ( S i | l j ) = 0 . Otherwise, p ( S i | l j ) should be the proportion of the quantity of symptom S i among the quantity of all symptoms that an IC fault on l j can lead to, and the symptoms that can be caused by the IC fault on l j can also be determined by the symptom domains. Hence, p ( S i | l j ) can be calculated by
p ( S i | l j ) = val ( S i ) S o : l j F S o val ( S o ) , if l j F S i 0 , if l j F S i
Then, based on (10)–(12), the fault probability p ( l j ) can be estimated by minimizing the difference between the actual symptom probability p ( S i ) and the fitted symptom probability p ^ ( S i ) , that is,
p ^ ( l j ) = argmin p ( l j ) , l j F S l o c S i S l o c | p ( S i ) p ^ ( S i ) | 2
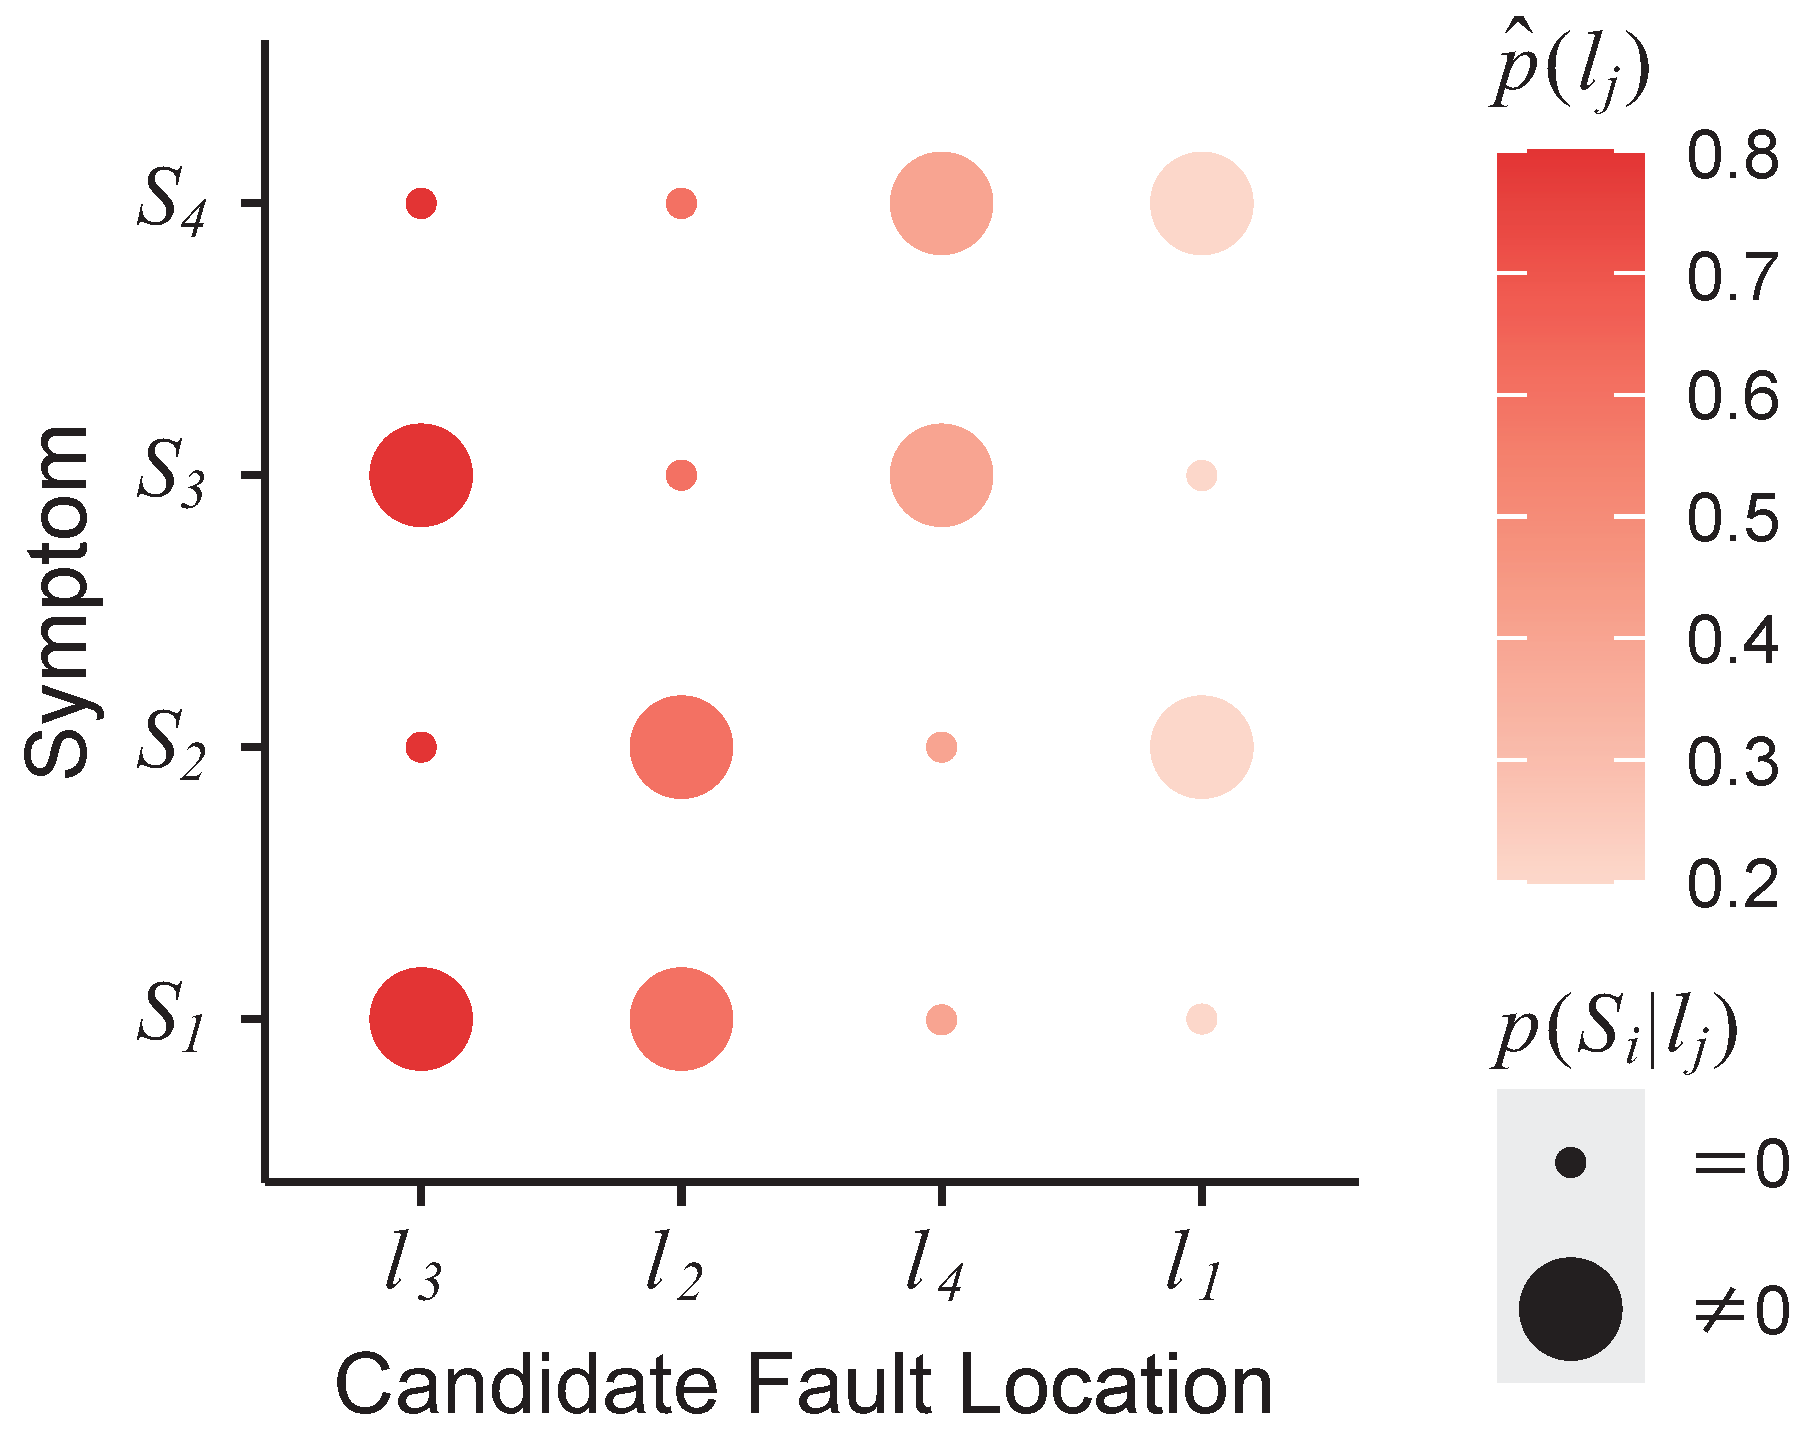
To describe the associations between the symptom set S l o c and the candidate fault location set F S l o c , FSAM_Loc is built using a matrix bubble diagram, as illustrated in Figure 5. In FSAM_Loc, the Y-axis variable is S l o c ; the X-axis variable is F S l o c , the values of which are ordered by the corresponding values of the color variable; the color variable is p ^ ( l j ) , which reflects the degree of contribution of IC faults on l j to S l o c ; and the size variable is p ( S i | l j ) , which reflects whether an IC fault on l j can lead to S i .
Definition 3. 
Contribution Ranking: The contribution ranking R is defined as the X-axis vector of the FSAM, which ranks the candidate fault locations in descending order of their fault probabilities. For example, the contribution ranking of the FSAM_Loc shown in Figure 5 is R = [ l 3 , l 2 , l 4 , l 1 ] .
In this paper, contribution rankings are used to determine the order in which candidate fault locations are diagnosed in the subsequent diagnosis algorithm.

3.4.2. FSAM for Trunk IC Faults (FSAM_Trk)

In this subsection, only the trunk IC fault-related symptoms ( 0 , 1 ) and ( 1 , 0 ) and their corresponding domains are used to build the FSAM for trunk IC faults (FSAM_Trk).
The symptom set denoted by S t r k is formed by sequentially combining the trunk IC fault-related symptoms of all n nodes:
S t r k = { S N 1 < 1 > , , S N 1 < m 1 t r k > , S N 2 < 1 > , , S N 2 < m 2 t r k > , , S N n < 1 > , , S N n < m n t r k > } = { S 1 , S 2 , , S m 1 t r k + m 2 t r k + + m n t r k }
where m r t r k denotes the number of symptom modes related to trunk IC faults for N r . Moreover, the candidate fault location set for S t r k is
F S t r k = r = 1 n t = 1 m r t r k F N r < t >
Then, the processes of calculating p ( S i | l j ) and p ^ ( l j ) and constructing FSAM_Trk are the same as those presented in Section 3.4.1; however, note that l j F S t r k and S i S t r k . Finally, the contribution ranking R for trunk IC fault diagnosis can be obtained.
Example 2. 
Construction of an FSAM: In this example, the network topology and the fault location assumption are the same as in Example 1.
The symptoms and corresponding count values for all nodes shown in Figure 3 are S N 1 < 1 > = ( 0 , 0 ) , with a count of 216; S N 2 < 1 > = ( 1 , 1 ) , with a count of 253; S N 3 < 1 > = ( 0 , 0 ) , with a count of 233; and S N 4 < 1 > = ( 0 , 0 ) , with a count of 626. Accordingly, the symptom set is S l o c = { S N 1 < 1 > , S N 2 < 1 > , S N 3 < 1 > , S N 4 < 1 > } = { S 1 , S 2 , S 3 , S 4 } .
The symptom domains can be obtained by applying (3) and (4), yielding F N 1 < 1 > = { l 2 , l 3 , l 4 } , F N 2 < 1 > = { l 2 } , F N 3 < 1 > = { l 1 , l 2 , l 4 } , and F N 4 < 1 > = { l 1 , l 2 , l 3 } . Thus, the candidate fault location set is F S l o c = { l 1 , l 2 , l 3 , l 4 } .
Taking S 1 as an example, its actual occurrence probability can be calculated by applying (10), yielding
p ( S 1 ) = val ( S 1 ) i { 1 , 2 , 3 , 4 } val ( S i ) = 216 216 + 253 + 233 + 626
In the same way, we can obtain p ( S 2 ) , p ( S 3 ) , and p ( S 4 ) .
Taking l 1 as an example, since l 1 F S 1 , l 1 F S 2 , l 1 F S 3 and l 1 F S 4 , the probabilities p ( S i | l 1 ) can be calculated by applying (12), as follows:
p ( S 1 | l 1 ) = 0 p ( S 2 | l 1 ) = 0 p ( S 3 | l 1 ) = val ( S 3 ) val ( S 3 ) + val ( S 4 ) = 233 233 + 626 p ( S 4 | l 1 ) = val ( S 4 ) val ( S 3 ) + val ( S 4 ) = 626 233 + 626
In the same way, we can obtain p ( S i | l 2 ) , p ( S i | l 3 ) , and p ( S i | l 4 ) . The results for all probabilities p ( S i | l j ) in this example are shown in Table 2.
Then, we can calculate the fault probabilities for all candidate fault locations using (11) and (13). The results are shown in Table 3.
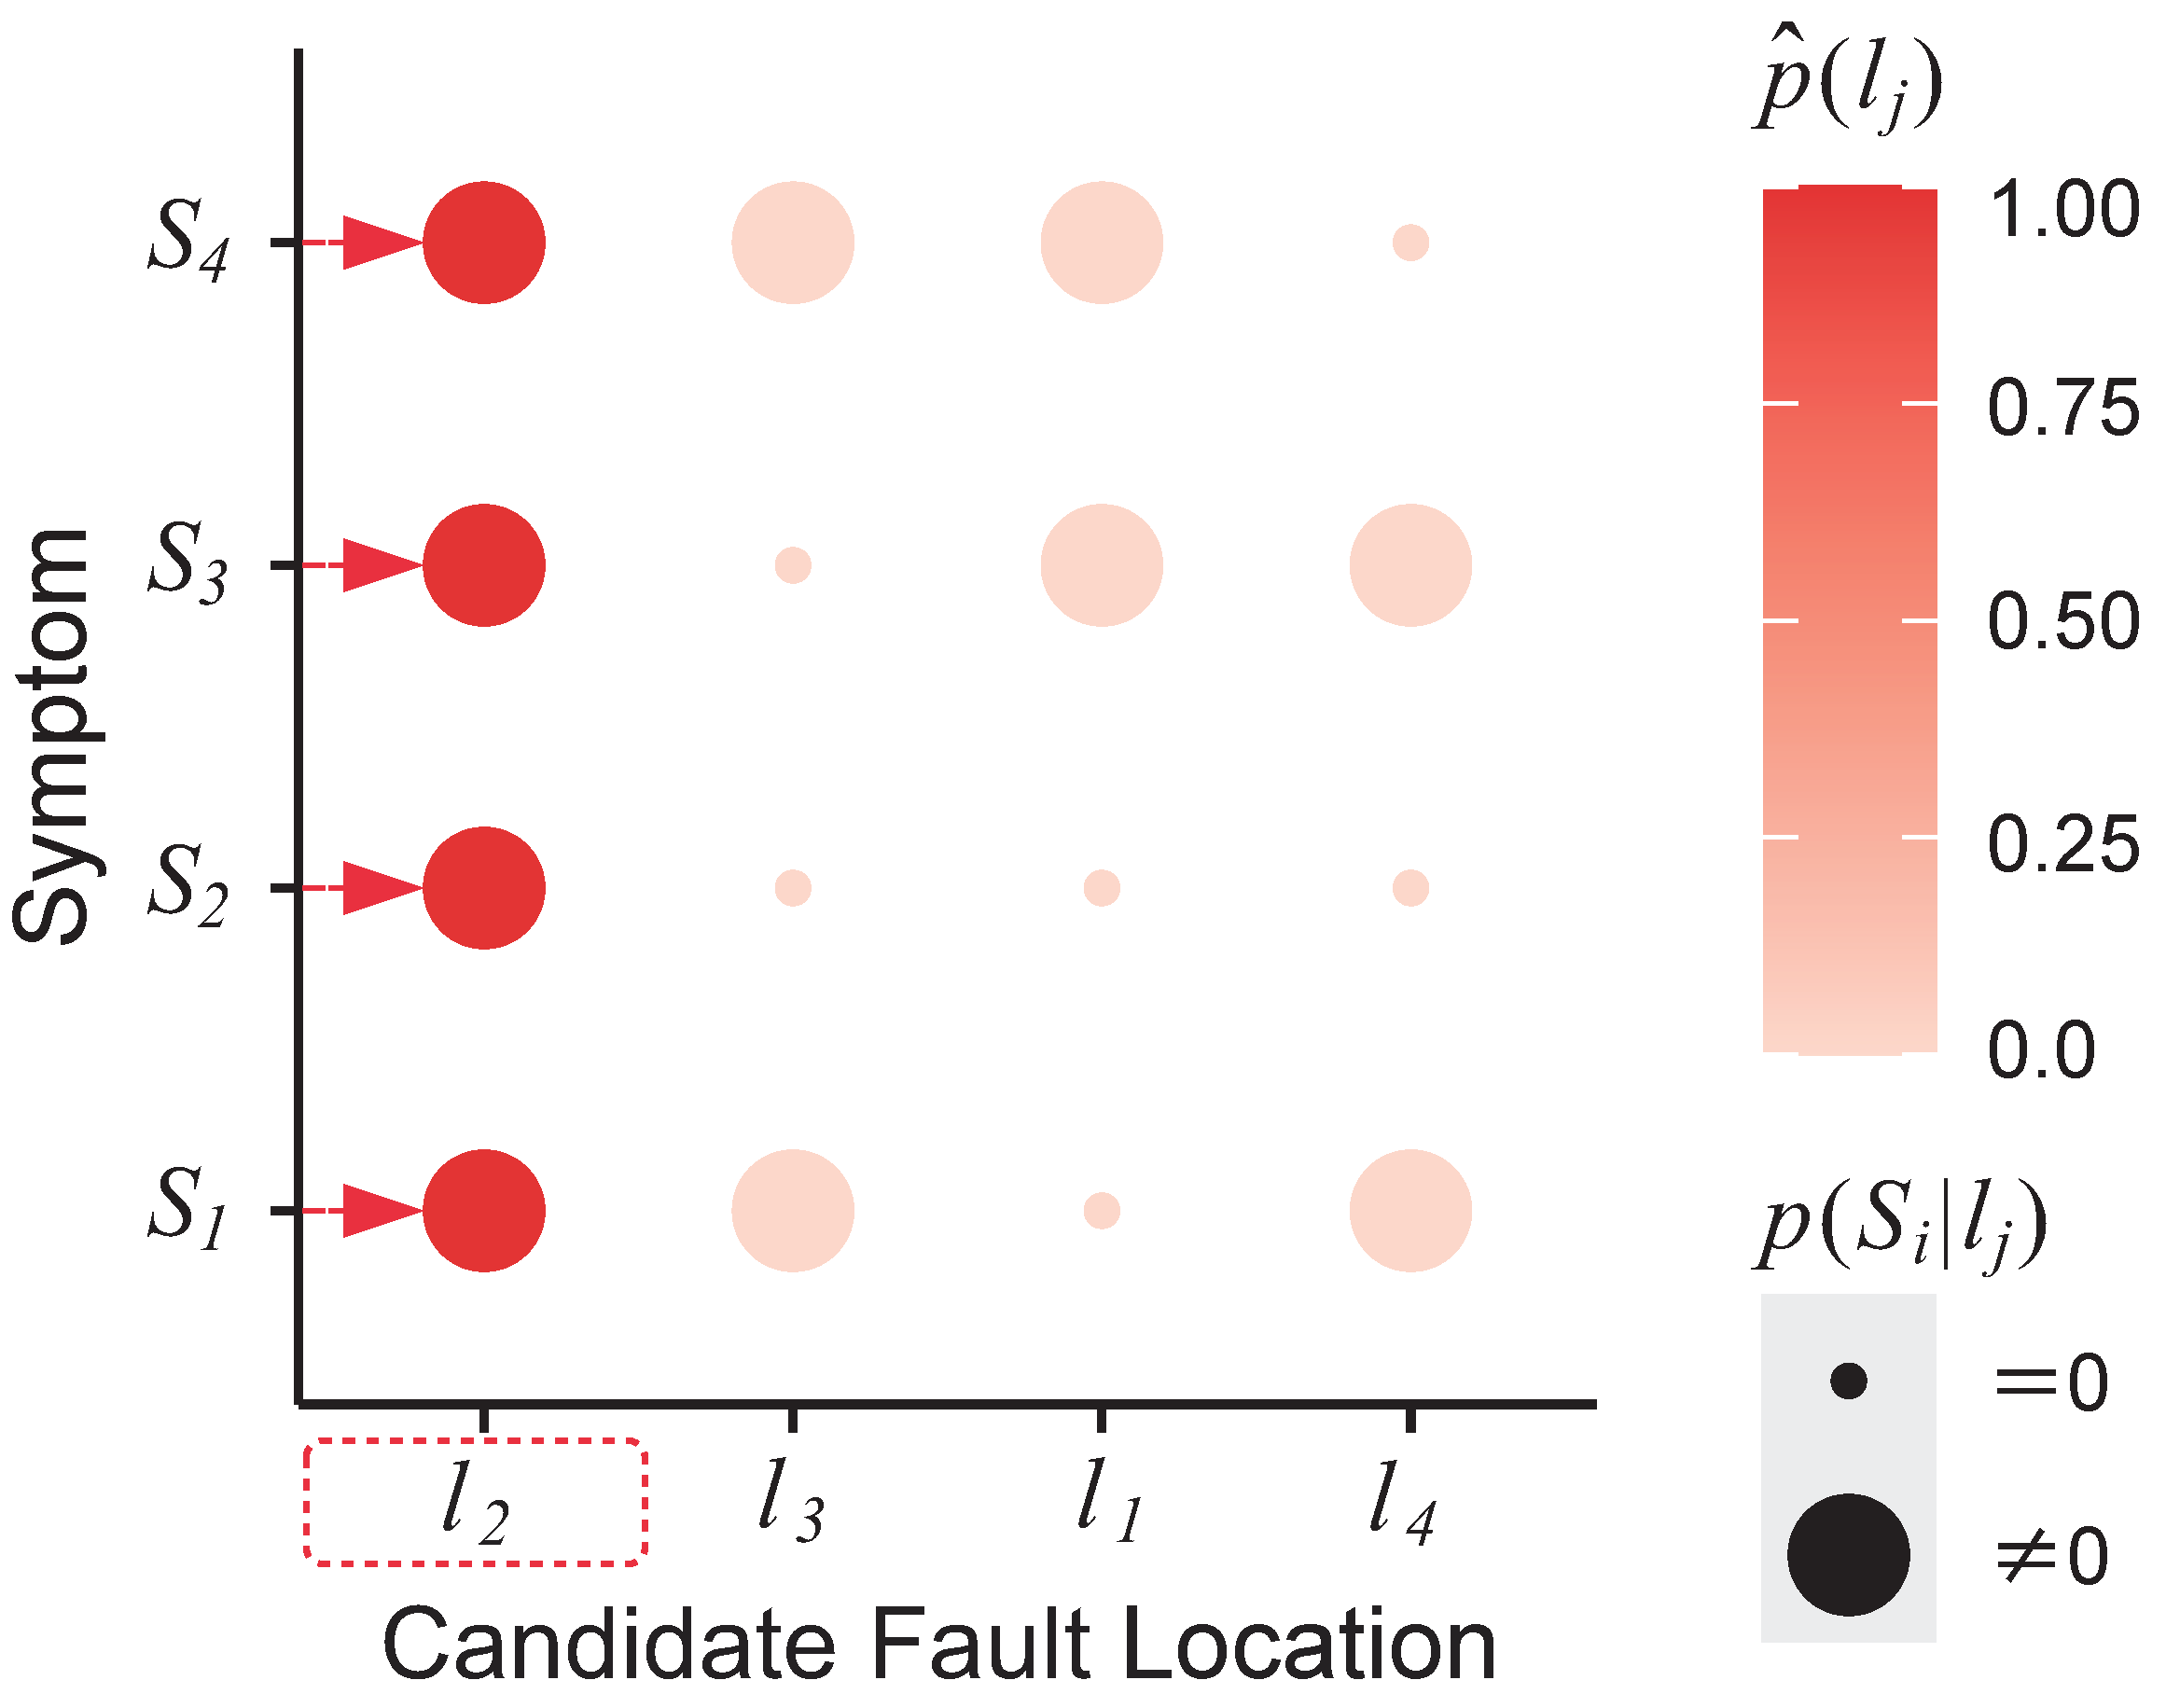
Finally, the FSAM can be built based on the p ( S i | l j ) in Table 2 and the p ^ ( l j ) in Table 3, as shown in Figure 6.

3.5. Model-Based Maximal Contribution Diagnosis Algorithm (MMCDA)

The process of IC fault diagnosis can be converted into the process of searching for the subset of contribution ranking R that provides the best explanation for the symptom set S l o c (or S t r k ), as shown in Algorithm 1. The best explanation has two properties: (1) the symptoms produced by this subset of faults can cover S l o c (or S t r k ), and (2) on the premise that the first condition is satisfied, the number of fault locations in the selected subset is as small as possible.
Algorithm 1 Model-Based Maximal Contribution Diagnosis Algorithm (MMCDA)
Input: symptom set S l o c (or S t r k ), contribution ranking R
Output: best-explanation fault set F
1:
Initialize the set of symptoms explained by the current link, S F = ; the set of symptoms that have already been explained, S R = ; the candidate fault location set for S R , F R = ; and the best-explanation fault set, F =
2:
for  l j R do
3:
      for  S i S l o c ( S t r k )  do
4:
           if  p ( S i | l j ) 0  then
5:
                 S F = S F S i
6:
      if  S R S R S F  then
7:
            S R = S R S F
8:
            F R = F R { l j }
9:
      if  S R = S l o c ( S t r k )  then
10:
           F = F R
11:
     else
12:
           S F =
13:
return F
Algorithm 1 operates as follows: Initially, the set of symptoms explained by the current link ( S F ), the set of symptoms that have already been explained ( S R ), the candidate fault location set for S R ( F R ), and the best-explanation fault set (F) are all empty. Then, the algorithm sequentially selects links from the contribution ranking R and performs the following steps: Step 1: Determine the explainable symptom set S F of the current link based on the size variable p ( S i | l j ) in the FSAM. Step 2: Determine whether the explainable symptom set S F of the current link can increase the size of the explained symptom set S R . If so, include S F in S R and add the current link l j to F R . Step 3: Judge whether the explained symptom set S R can cover S l o c (or S t r k ). If so, keep F R in F; otherwise, initialize S F as empty and repeat the above steps until this condition is satisfied. Finally, the elements of the set F are the IC fault locations in the system that collectively provide the best explanation for the symptom set.
Example 3. 
Diagnosis of IC faults using MMCDA: In this example, we perform IC fault diagnosis based on the FSAM shown in Figure 6. From the X-axis of the FSAM, we can obtain the contribution ranking R = [ l 2 , l 3 , l 1 , l 4 ] . In accordance with Algorithm 1, link l 2 is examined first.
Algorithm step 1: As shown in Figure 6, p ( S 1 | l 2 ) 0 , p ( S 2 | l 2 ) 0 , p ( S 3 | l 2 ) 0 , and p ( S 4 | l 2 ) 0 ; thus, the explainable symptom set corresponding to l 2 is S F = { S 1 , S 2 , S 3 , S 4 } .
Algorithm step 2: The set of symptoms that have already been explained is S R = S F = { S 1 , S 2 , S 3 , S 4 } , and the candidate fault location set is F R = { l 2 } .
Algorithm step 3: Since S R can cover the symptom set S l o c , we can obtain the fault set F = F R = { l 2 } , i.e., the IC fault location is l 2 , which agrees with the initial location assumption in Example 1.

4. Experiments

This section describes the construction of a testbed and reports three case studies conducted to demonstrate the effectiveness of the proposed method. In case study 1, the diagnostic procedure is illustrated in detail using a simple scenario where double trunk IC faults coexist with local IC faults. Then, in case study 2, the complex scenario where three trunk IC faults coexist with local IC faults is studied. Finally, in case study 3, the complex scenario in which four trunk IC faults coexist is investigated.

4.1. Testbed Setup

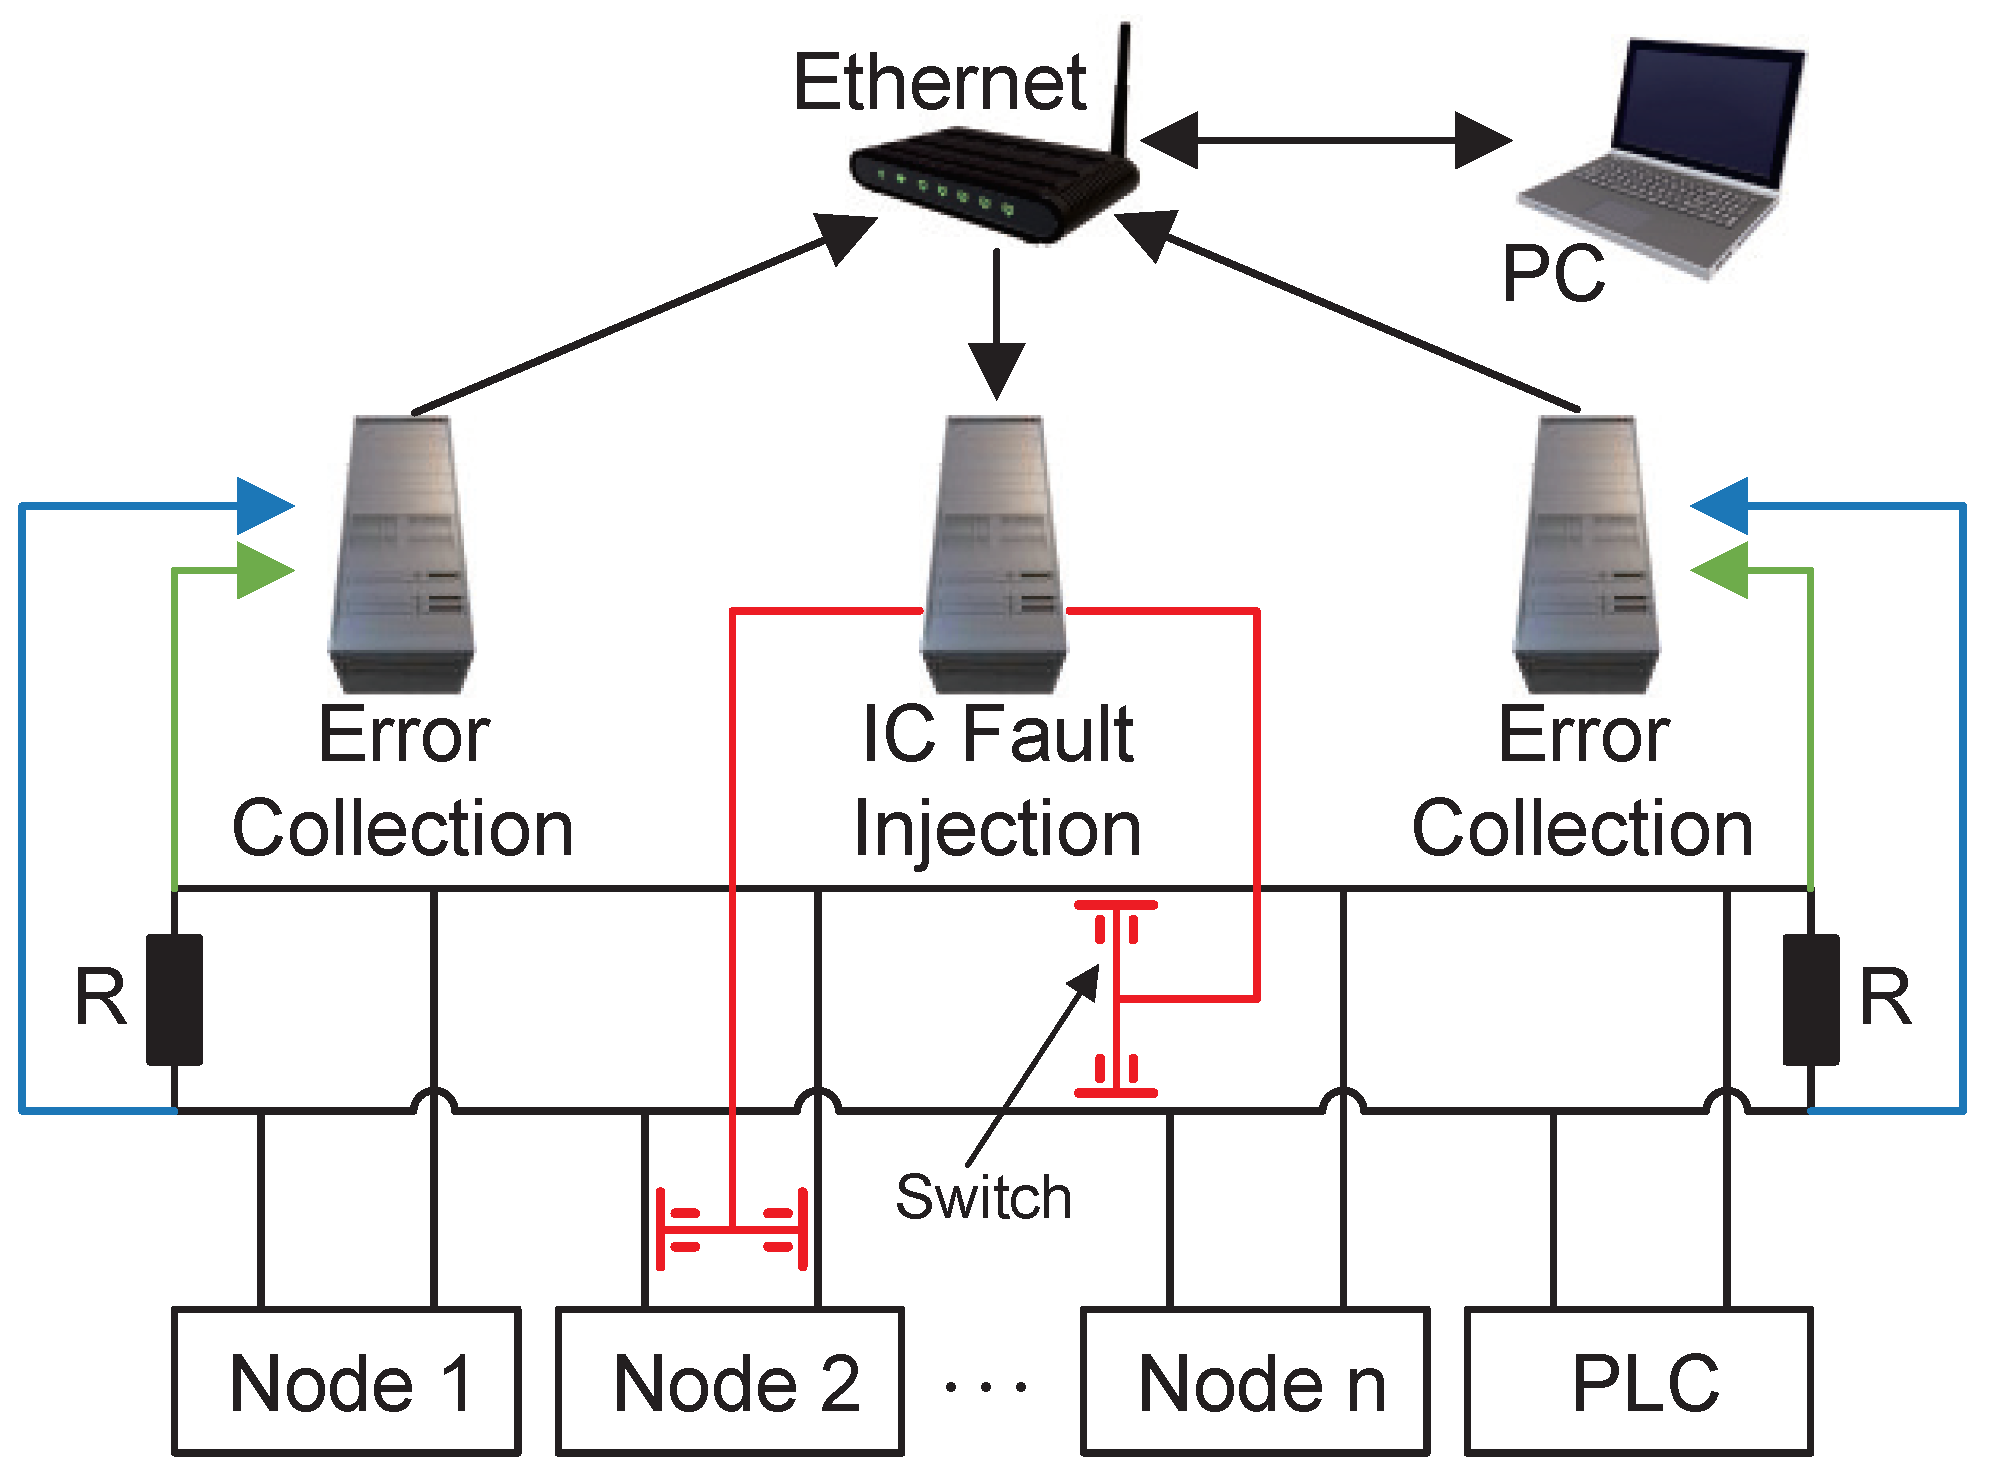
The schematic layout of the testbed is shown in Figure 7. The testbed is composed of a CAN communication module, an IC fault injection module, and an error collection module. DeviceNet hardware (Rockwell Automation Inc., Milwaukee, WI, USA) is adopted for the communication module, in which the CAN protocol is in both the physical and data link layers. The IC fault injection module includes high-speed analog switches and NI CompactRIO controllers (National Instruments Corp., Austin, TX, USA). The switches are inserted into the cables that need to be injected with IC faults, and each switch is controlled by an independent controller. The occurrences of cable disconnection events follow a Poisson process with an arrival rate of λ I C . The error collection module consists of a CAN transceiver and NI CompactRIO FPGA hardware. When six consecutive dominant bits are detected, the error collection module triggers the collection of bus error records at the two collection points.
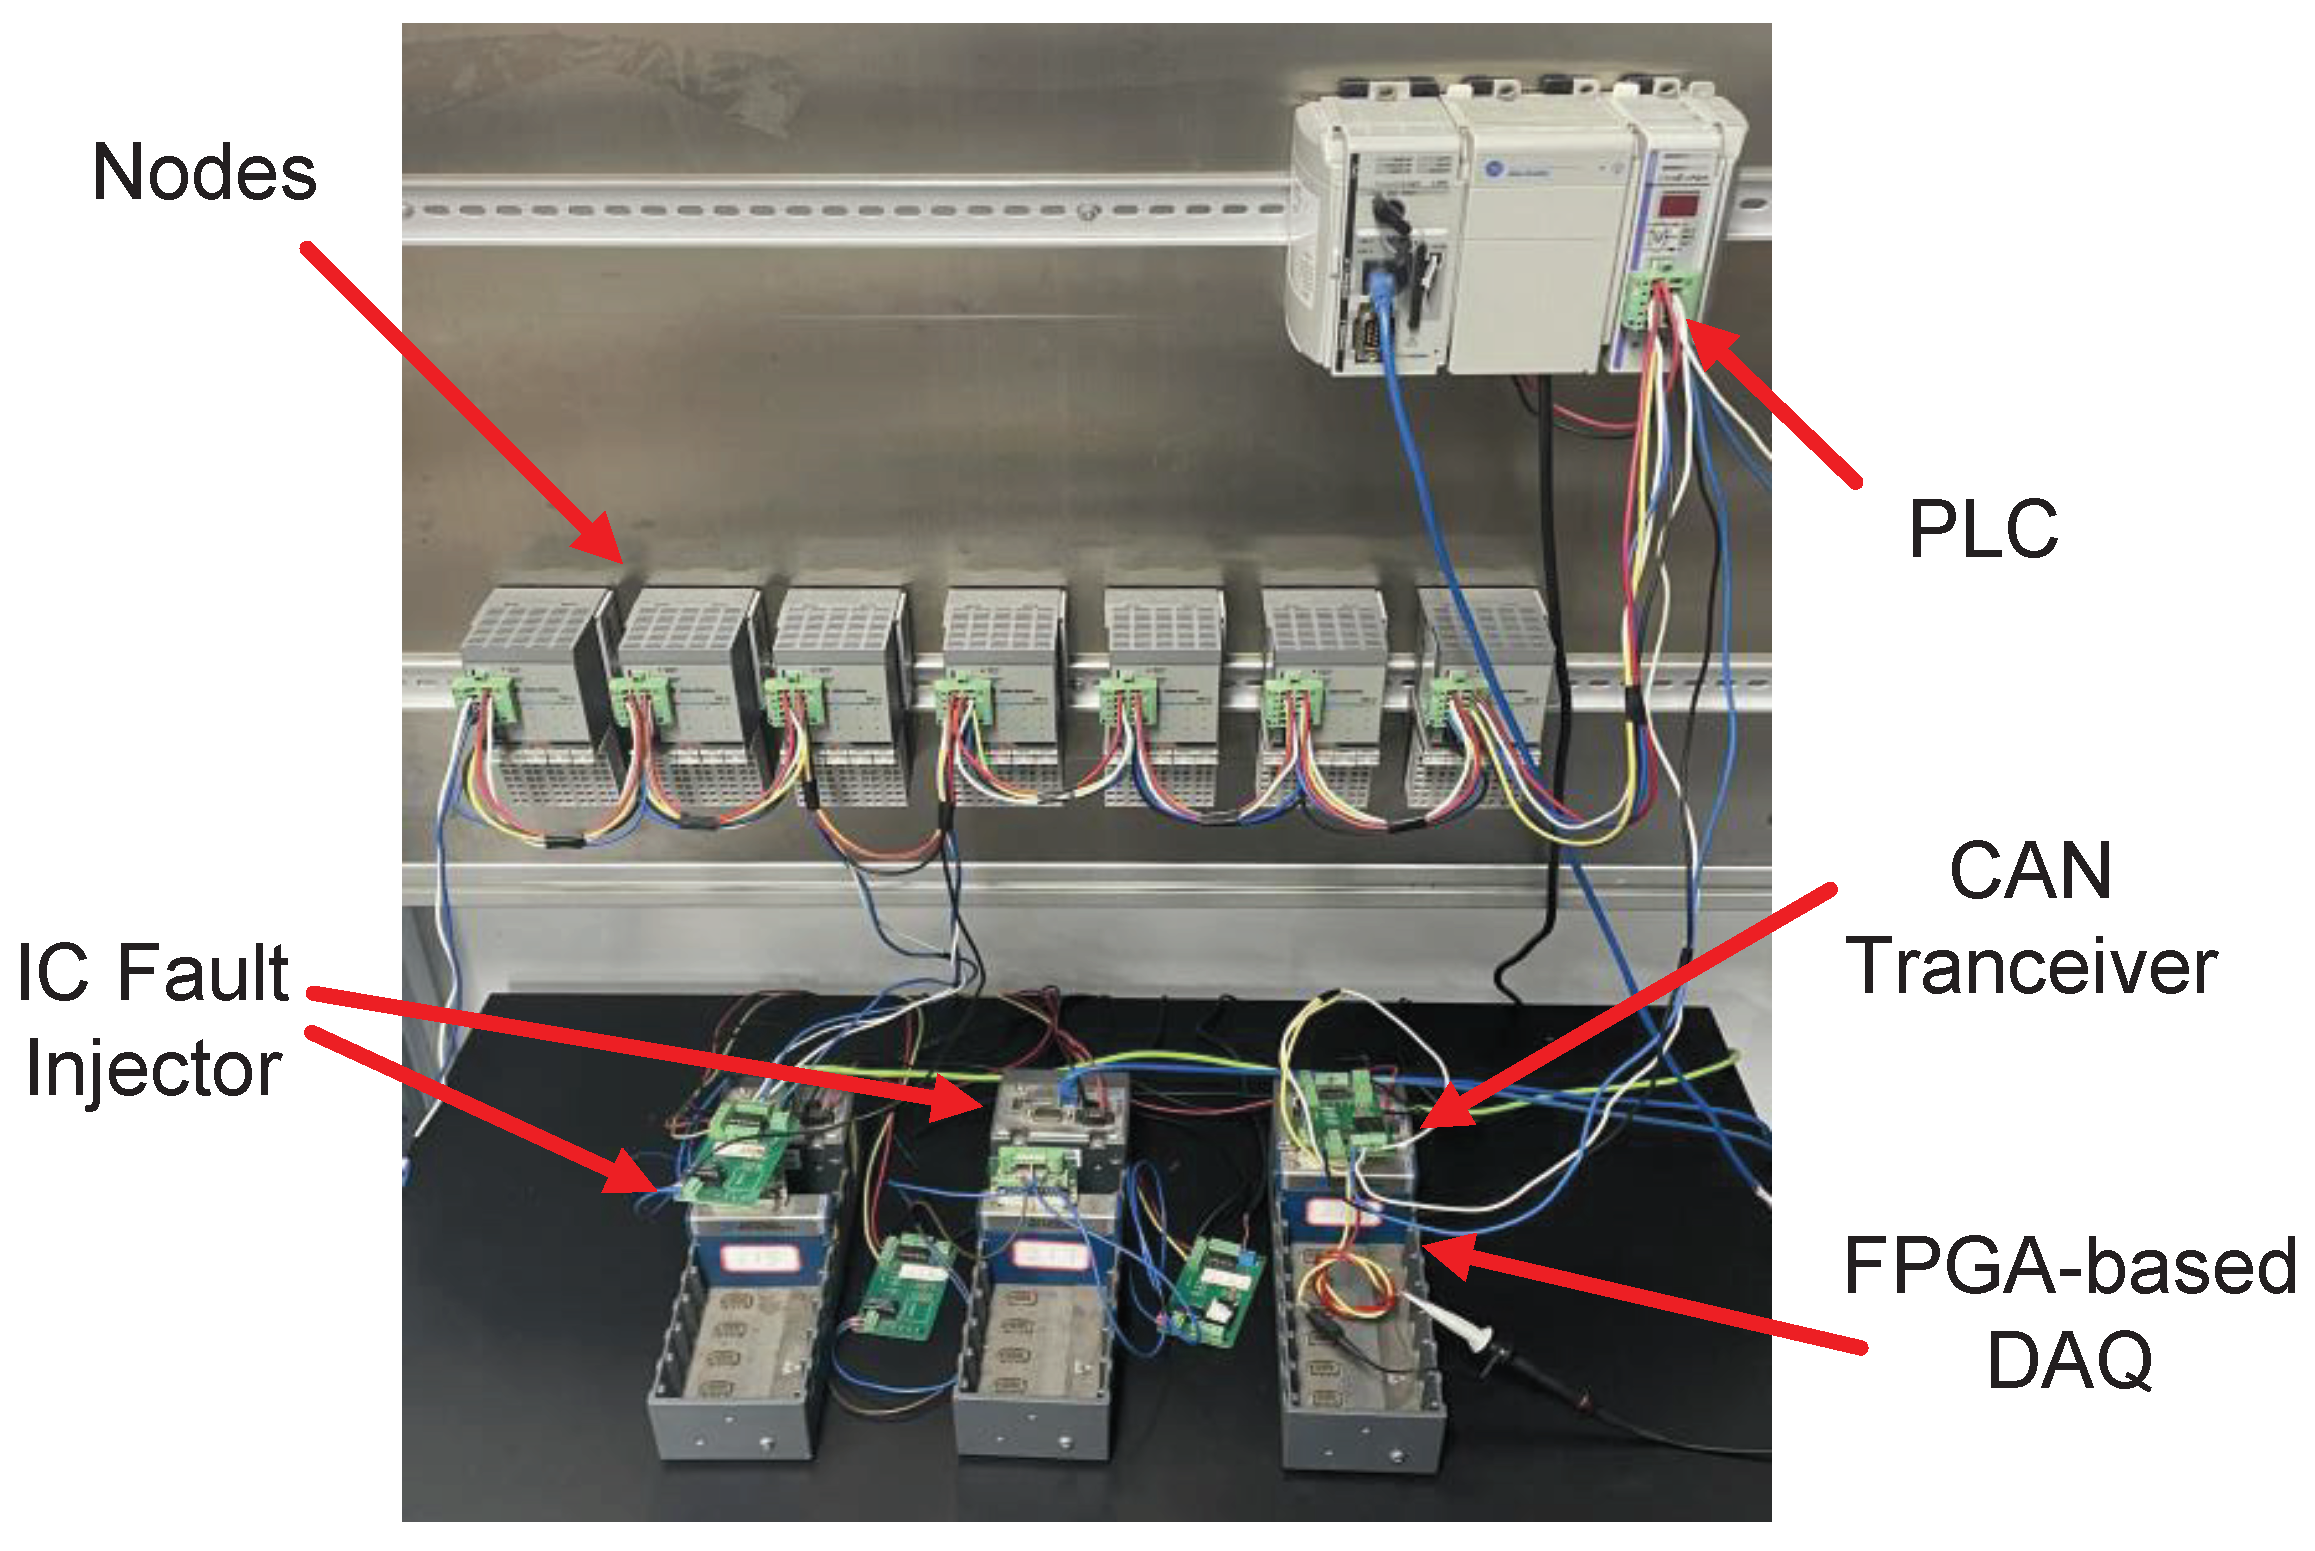
The testbed constructed for the case studies is shown in Figure 8. There are eight nodes in the network: node 1, node 2, node 5, node 6, node 10, node 11, node 12, and the PLC. The equivalent topology of the system is shown in Figure 9, where C 1 and C 2 are the collection points and N 1 denotes node 1.

4.2. Case Study 1: Two Local IC Faults and Two Trunk IC Faults

In this case study, as represented by fault locations B, C, D, and F in Figure 9, IC faults occur independently on two different trunk cables and two different local cables, i.e., l 11 , l 14 , l 3 , and l 5 . Locations B and D correspond to local IC fault scenarios with fault injection rates of λ I C B = 67 faults/s and λ I C D = 56 faults/s, respectively. Locations C and F correspond to trunk IC fault scenarios with fault injection rates of λ I C C = 50 faults/s and λ I C F = 83 faults/s, respectively. For this case study, a total of 12,645 error records were collected, 12,490 of which contained complete address information for symptom generation. The symptom modes for each node and their corresponding count values are shown in Table 4.

4.2.1. Local IC Fault Diagnosis

In this work, only the symptoms whose ratios to the total number of records for the corresponding node are more than 1% are considered significant for diagnosis. Hence, based on (8) and the symptoms for local IC faults whose ratios are more than 1% in Table 4, the symptom set utilized to diagnose local IC faults is S l o c = { S N 1 < 1 > , S N 2 < 1 > , S N 5 < 1 > , S N 5 < 2 > , S N 6 < 1 > , S N 10 < 1 > , S N 10 < 2 > , S N 11 < 1 > , S N 12 < 1 > , S N P L C < 1 > } = { S 1 , S 2 , S 3 , S 4 , S 5 , S 6 , S 7 , S 8 , S 9 , S 10 } .
Step 1: Derive the domains of all symptoms in S l o c via (3) and (4). The results are shown in Table 5. Then, the candidate fault set F S l o c = { l 1 , l 2 , l 3 , l 4 , l 5 , l 6 , l 7 , l 8 } can be obtained by applying (9).
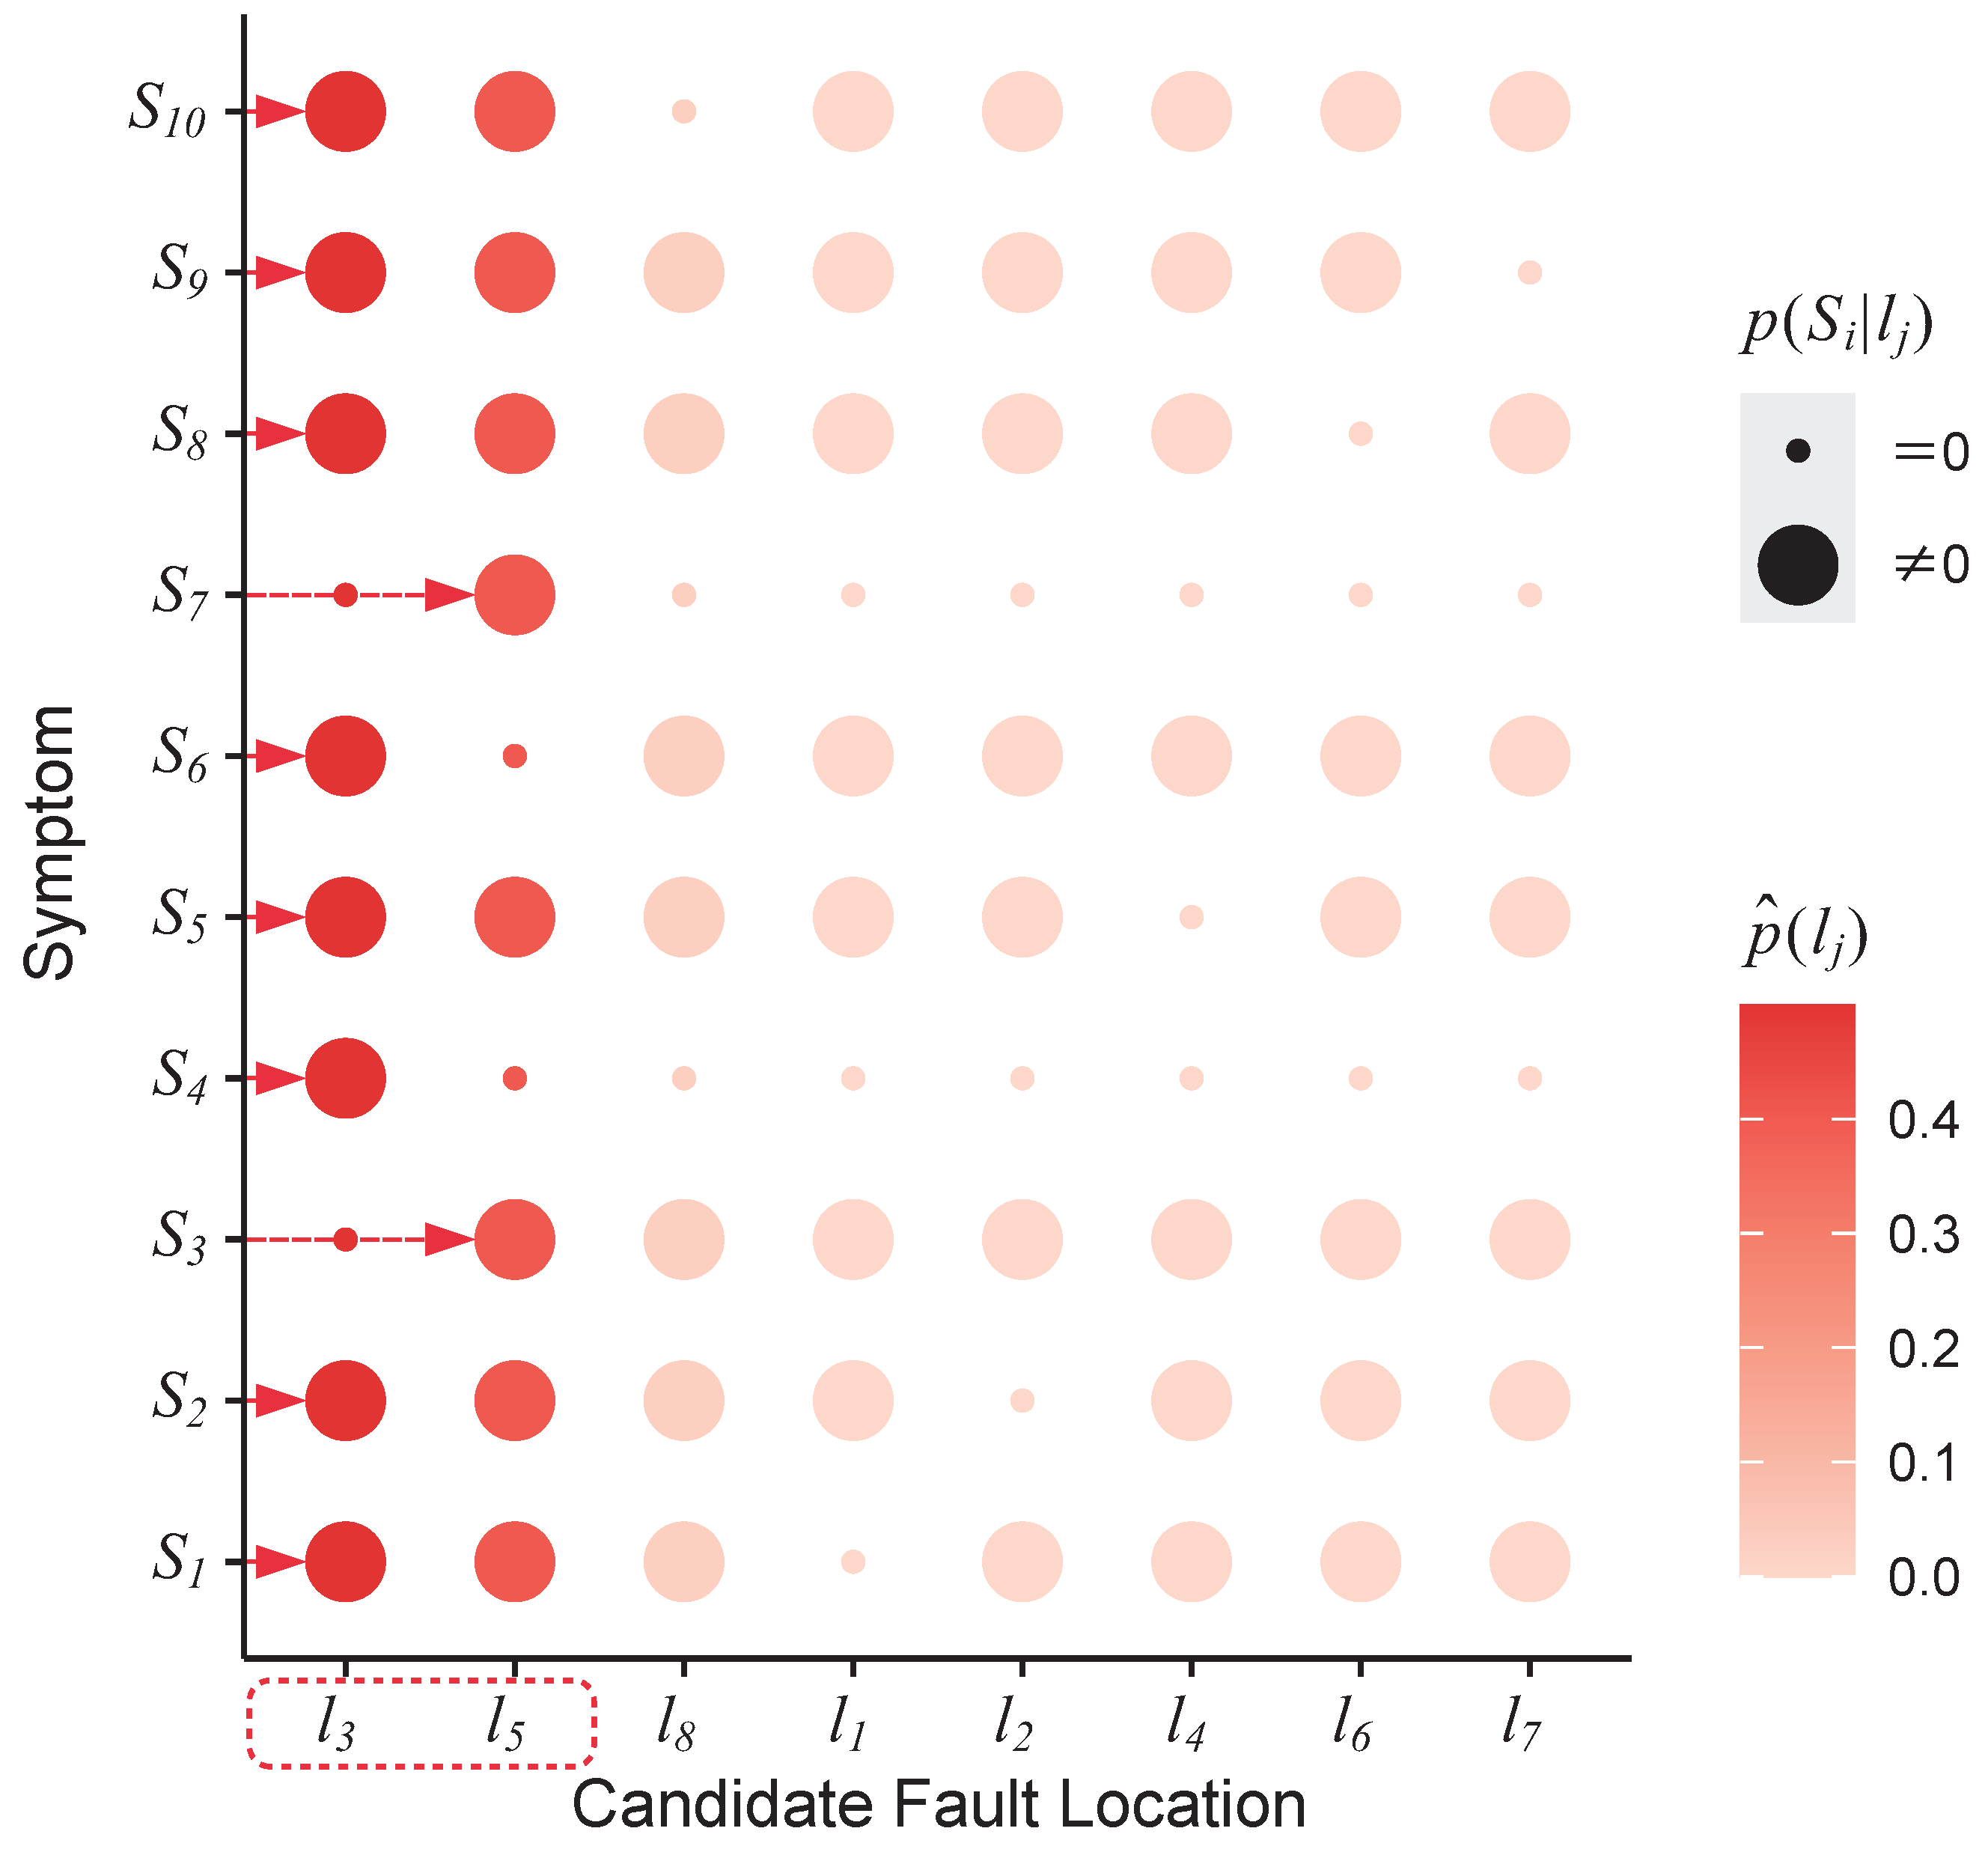
Step 2: Construct FSAM_Loc based on the local IC fault-related symptom count values in Table 4 and (10)–(13). The results are shown in Figure 10. Accordingly, the contribution ranking is R = [ l 3 , l 5 , l 8 , l 1 , l 2 , l 4 , l 6 , l 7 ] .
Step 3: Execute MMCDA based on the FSAM_Loc. As illustrated in Figure 10, the symptoms explained by { l 3 } are { S 1 , S 2 , S 4 , S 5 , S 6 , S 8 , S 9 , S 10 } and they cannot yet cover S l o c ; additionally, the symptoms explained by { l 3 , l 5 } can cover S l o c ; thus, the local IC fault locations are l 3 and l 5 .

4.2.2. Trunk IC Fault Diagnosis

Based on (14) and the significant symptoms for trunk IC faults in Table 4, the symptom set utilized to diagnose trunk IC faults is S t r k = { S N 1 < 1 > , S N 2 < 1 > , S N 5 < 1 > , S N 6 < 1 > , S N 6 < 2 > , S N 10 < 1 > , S N 10 < 2 > , S N 11 < 1 > , S N 11 < 2 > , S N 12 < 1 > , S N P L C < 1 > } = { S 1 , S 2 , S 3 , S 4 , S 5 , S 6 , S 7 , S 8 , S 9 , S 10 , S 11 } .
Step 1: Derive the domains of all symptoms in S t r k via (6) and (7). The results are shown in Table 6. Then, the candidate fault set F S t r k = { l 11 , l 12 , l 13 , l 14 } can be obtained by applying (15).
Step 2: Construct FSAM_Trk based on the trunk IC fault-related symptom count values in Table 4 and (10)–(13). The results are shown in Figure 11. Accordingly, the contribution ranking is R = [ l 14 , l 11 , l 12 , l 13 ] .
Step 3: Execute MMCDA based on the FSAM_Trk. As illustrated in Figure 11, the symptoms explained by { l 14 } are { S 1 , S 2 , S 3 , S 4 , S 6 , S 8 , S 10 , S 11 } and they cannot yet cover S t r k ; additionally, the symptoms explained by { l 14 , l 11 } can cover S t r k ; thus, the trunk IC fault locations are l 11 and l 14 . In summary, the IC fault locations in the network are identified as l 3 , l 5 , l 11 , and l 14 , in agreement with the experimental setup.

4.3. Case Study 2: One Local IC Fault and Three Trunk IC Faults

In this case study, as represented by fault locations A, C, D, and F in Figure 9, IC faults occur independently on three different trunk cables and a local cable, i.e., l 10 , l 11 , l 14 , and l 5 . Location D corresponds to a local IC fault scenario with a fault injection rate of λ I C D = 40 faults/s. Locations A, C, and F correspond to trunk IC fault scenarios with fault injection rates of λ I C A = 56 faults/s, λ I C C = 67 faults/s, and λ I C F = 50 faults/s, respectively. For this case study, a total of 13,266 error records were collected, 13,053 of which contained complete address information for symptom generation. The symptom modes for each node and their corresponding count values are shown in Table 7.

4.3.1. Local IC Fault Diagnosis

By using the significant symptoms for local IC faults and the corresponding count values in Table 7 and following the same procedure as in Section 4.2.1, the local IC fault location l 5 can be determined.

4.3.2. Trunk IC Fault Diagnosis

Based on (14) and the significant symptoms for trunk IC faults in Table 7, the symptom set utilized to diagnose trunk IC faults is S t r k = { S N 1 < 1 > , S N 2 < 1 > , S N 5 < 1 > , S N 5 < 2 > , S N 6 < 1 > , S N 6 < 2 > , S N 10 < 1 > , S N 10 < 2 > , S N 11 < 1 > , S N 11 < 2 > , S N 12 < 1 > , S N P L C < 1 > } = { S 1 , S 2 , S 3 , S 4 , S 5 , S 6 , S 7 , S 8 , S 9 , S 10 , S 11 , S 12 } .
Step 1: Derive the domains of all symptoms in S t r k via (6) and (7). The results are shown in Table 8. Then, the candidate fault set F S t r k = { l 10 , l 11 , l 12 , l 13 , l 14 } can be obtained by applying (15).
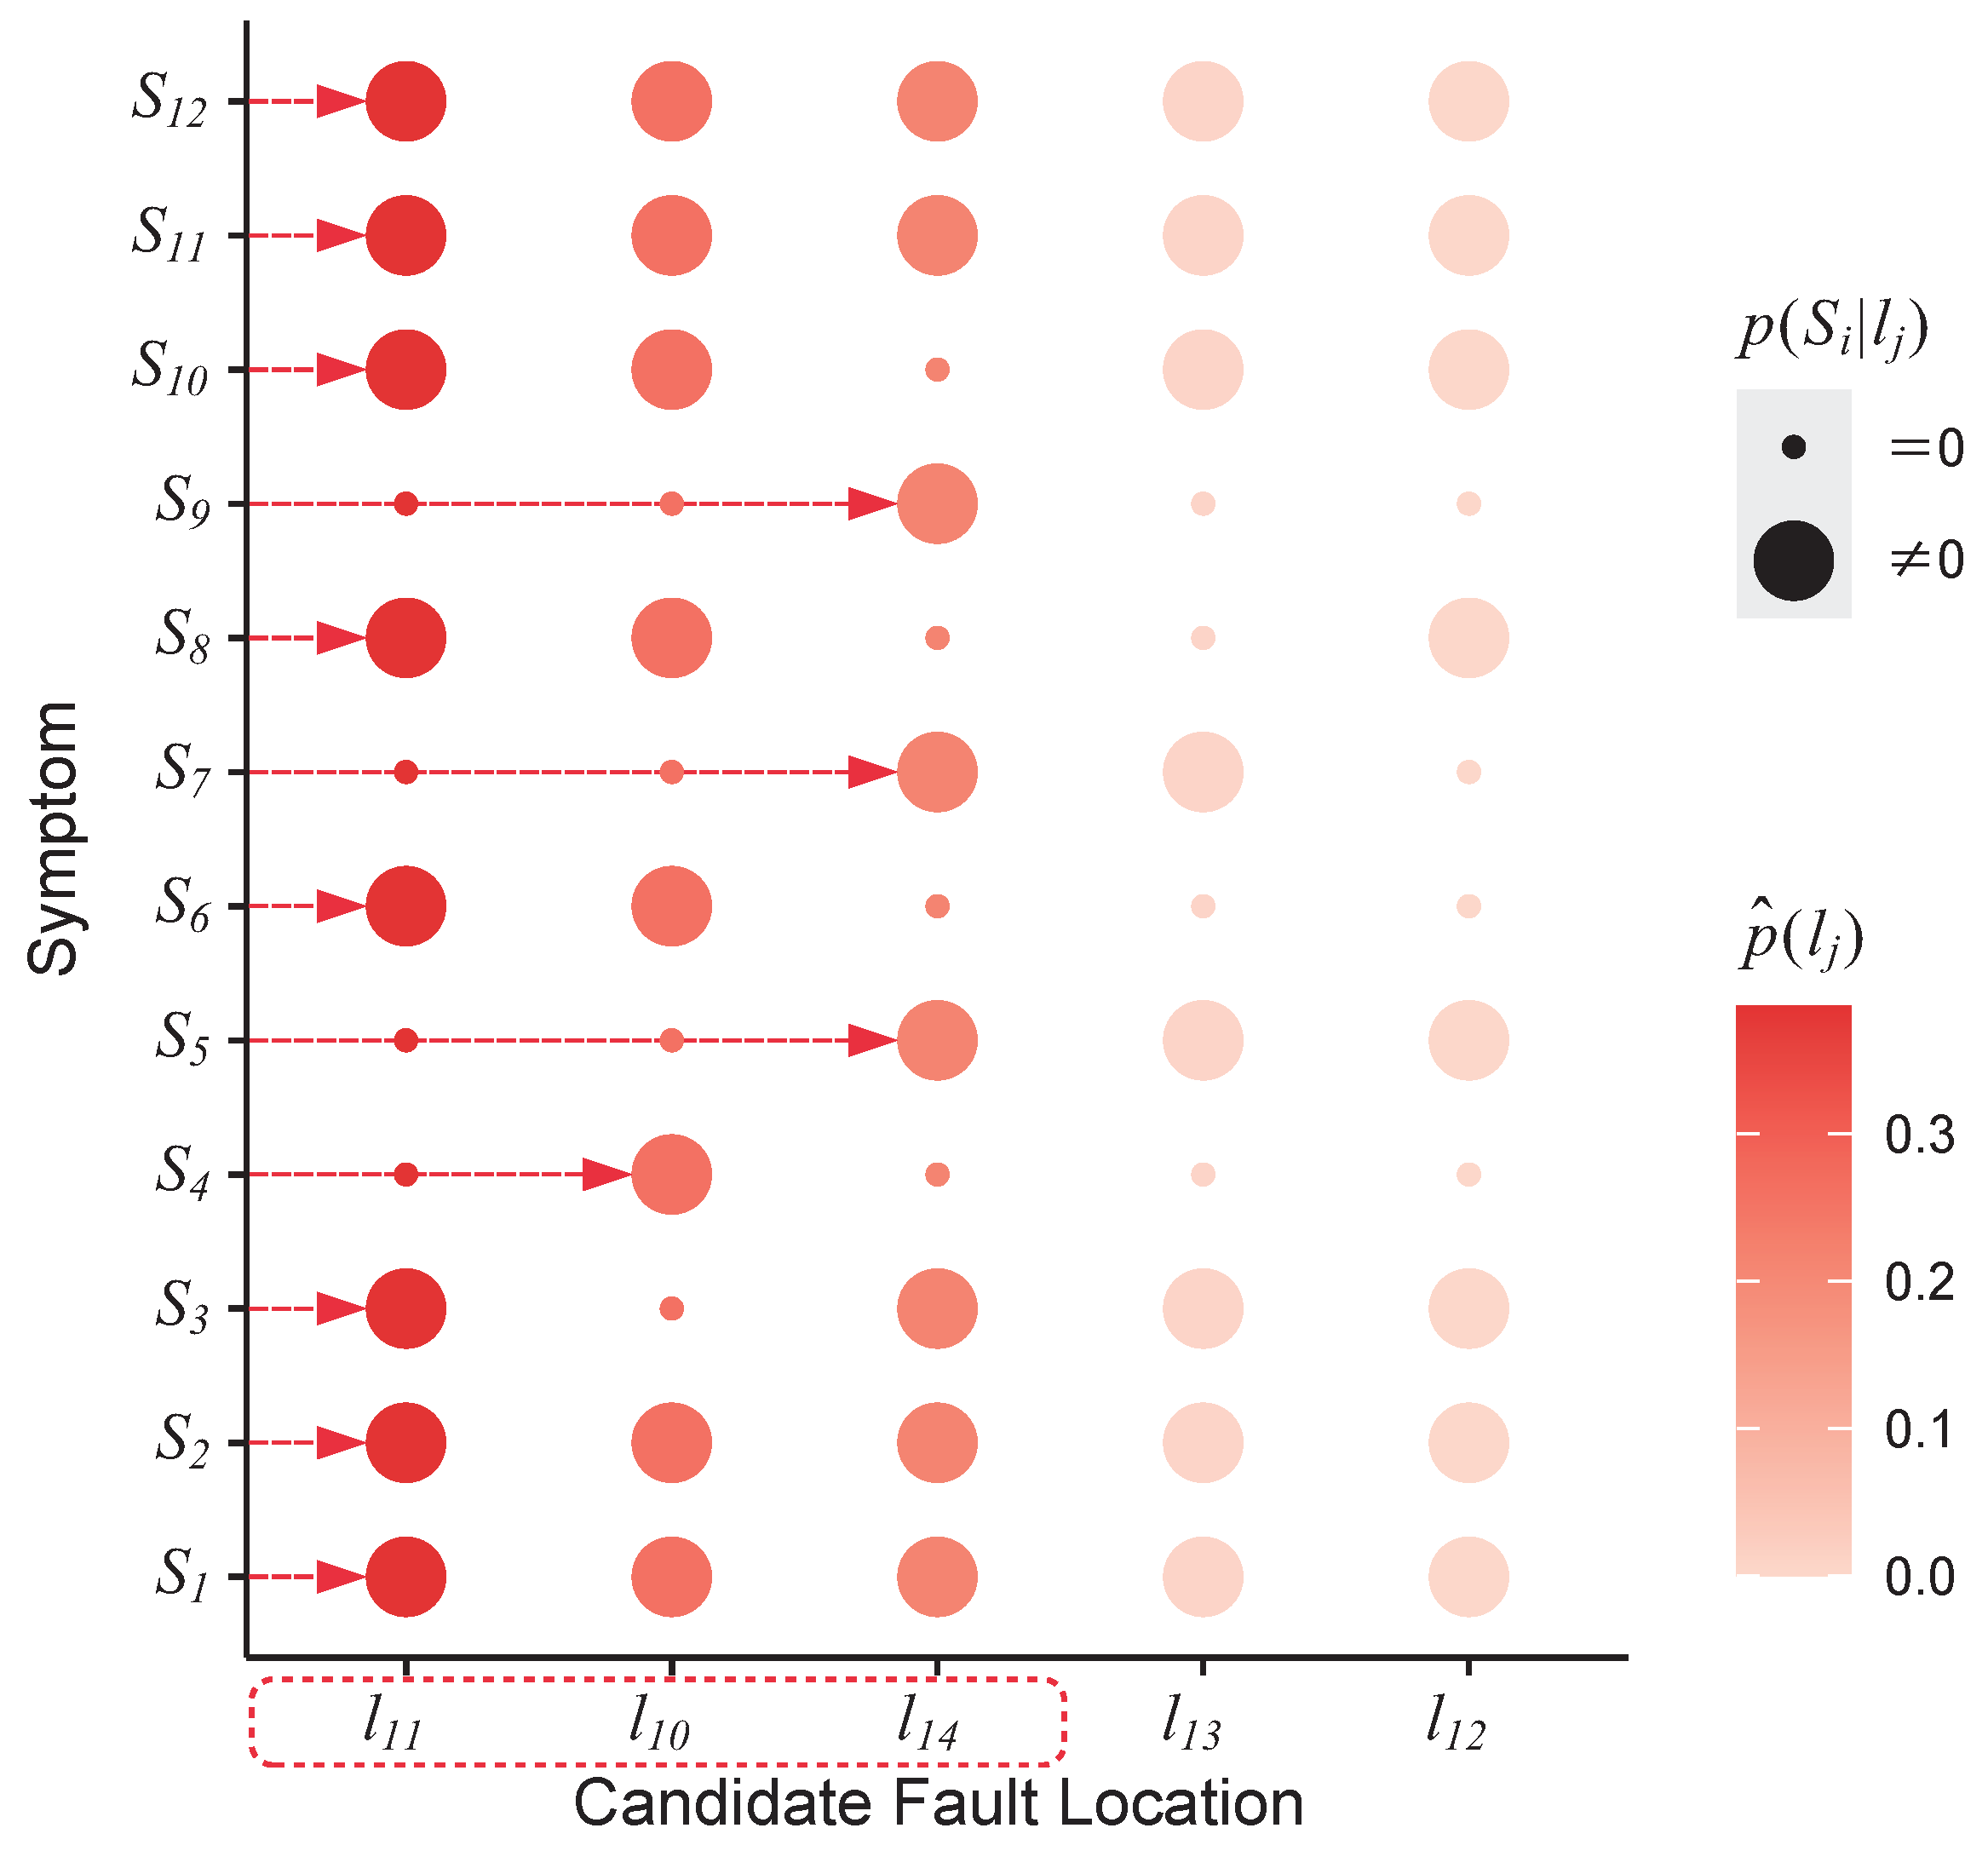
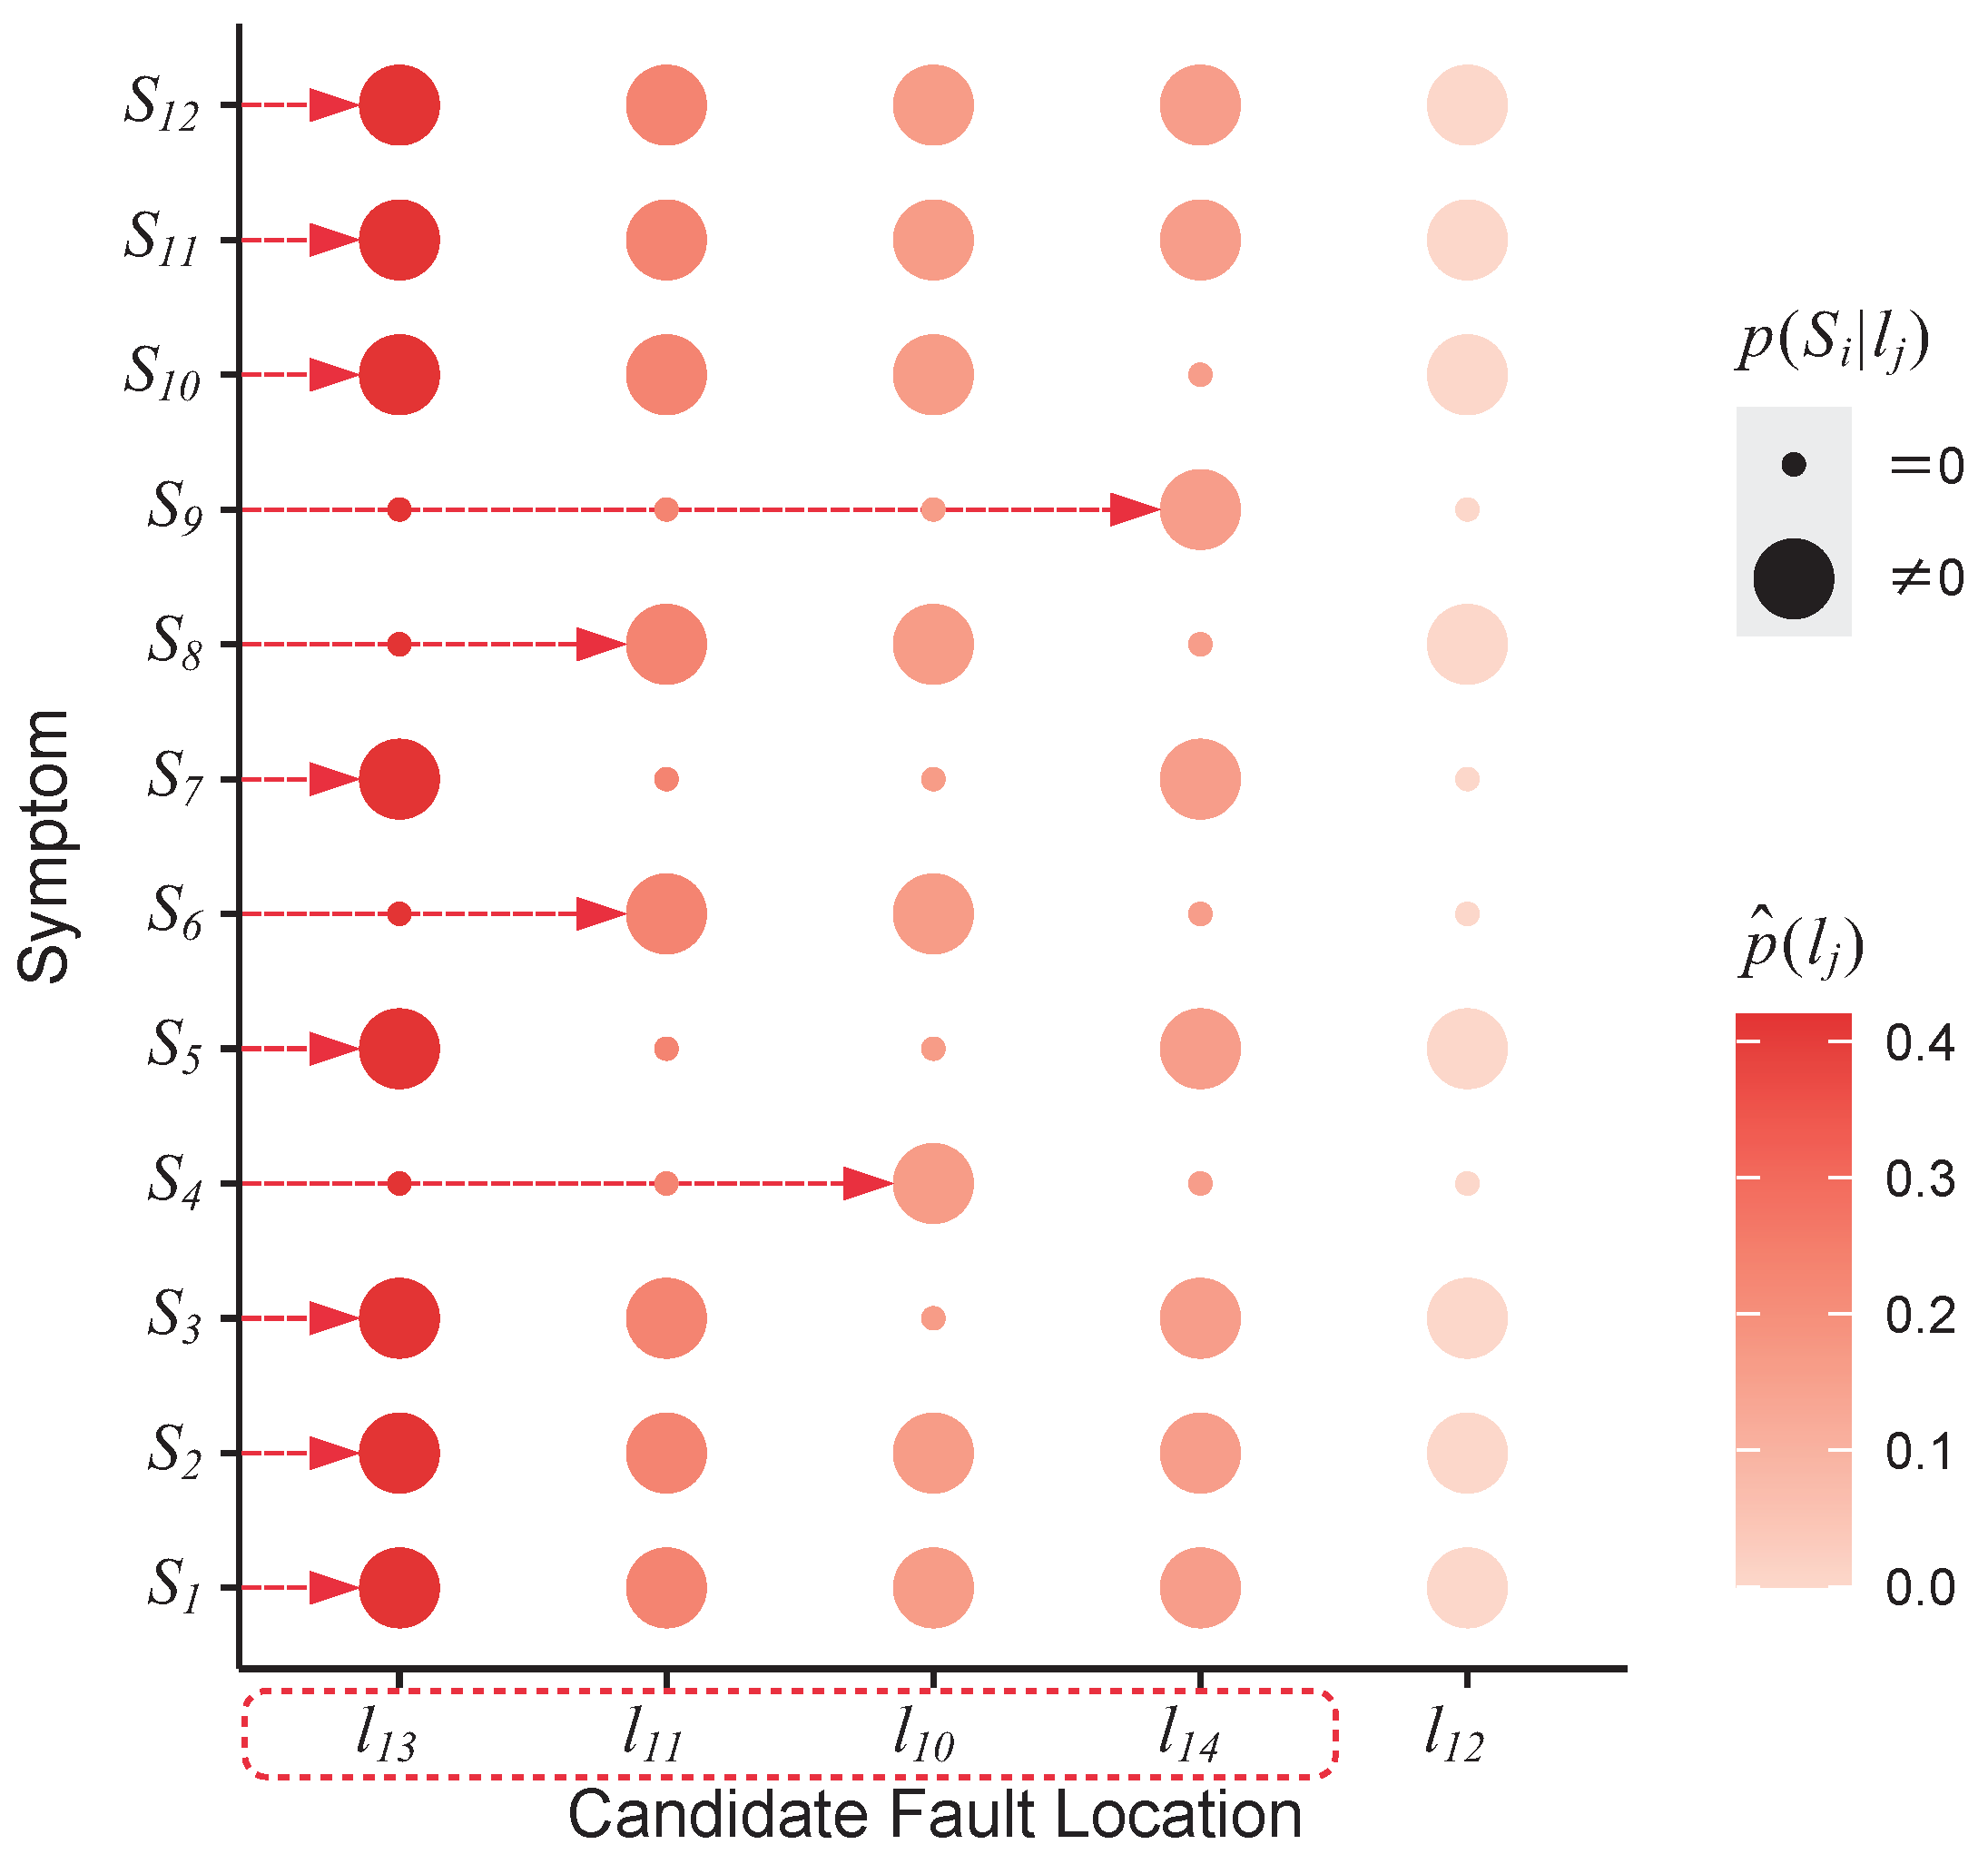
Step 2: Construct FSAM_Trk based on the trunk IC fault-related symptom count values in Table 7 and (10)–(13). The results are shown in Figure 12. Accordingly, the contribution ranking is R = [ l 11 , l 10 , l 14 , l 13 , l 12 ] .
Step 3: Execute MMCDA based on the FSAM_Trk. As illustrated in Figure 12, the symptoms explained by { l 11 , l 10 , l 14 } can cover S t r k ; thus, the trunk IC fault locations are l 10 , l 11 , and l 14 . In summary, the IC fault locations in the network are identified as l 5 , l 10 , l 11 , and l 14 , in agreement with the experimental setup.

4.4. Case Study 3: Four Trunk IC Faults

In this case study, as represented by fault locations A, C, E, and F in Figure 9, IC faults occur independently on four different trunk cables, i.e., l 10 , l 11 , l 13 , and l 14 , with fault injection rates of λ I C A = 56 faults/s, λ I C C = 67 faults/s, λ I C E = 67 faults/s, and λ I C F = 50 faults/s, respectively. For this case study, a total of 14,259 error records were collected, 13,798 of which contained complete address information for symptom generation. The symptom modes for each node and their corresponding count values are shown in Table 9. Since only ( 0 , 1 ) and ( 1 , 0 ) symptoms were significant for diagnosis, it can be concluded that only trunk IC faults exist in the network.
Based on (14) and the significant symptoms for trunk IC faults in Table 9, the symptom set utilized to diagnose trunk IC faults is S t r k = { S N 1 < 1 > , S N 2 < 1 > , S N 5 < 1 > , S N 5 < 2 > , S N 6 < 1 > , S N 6 < 2 > , S N 10 < 1 > , S N 10 < 2 > , S N 11 < 1 > , S N 11 < 2 > , S N 12 < 1 > , S N P L C < 1 > } = { S 1 , S 2 , S 3 , S 4 , S 5 , S 6 , S 7 , S 8 , S 9 , S 10 , S 11 , S 12 } .
Step 1: Derive the domains of all symptoms in S t r k via (6) and (7). The results are the same as those shown in Table 8. Then, the candidate fault set F S t r k = { l 10 , l 11 , l 12 , l 13 , l 14 } can be obtained by applying (15).
Step 2: Construct FSAM_Trk based on the symptom count values in Table 9 and (10)–(13). The results are shown in Figure 13. Accordingly, the contribution ranking is R = [ l 13 , l 11 , l 10 , l 14 , l 12 ] .
Step 3: Execute MMCDA based on the FSAM_Trk. As illustrated in Figure 13, the symptoms explained by { l 13 , l 11 , l 10 , l 14 } can cover S t r k ; thus, the IC fault locations in the network are l 10 , l 11 , l 13 , and l 14 , in agreement with the experimental setup.

5. Discussion

In this section, the method proposed in this paper is compared to the existing state-of-the-art IC fault diagnosis methods [52,53,54] to show the advantages of the proposed method.

5.1. Diagnostic Accuracy

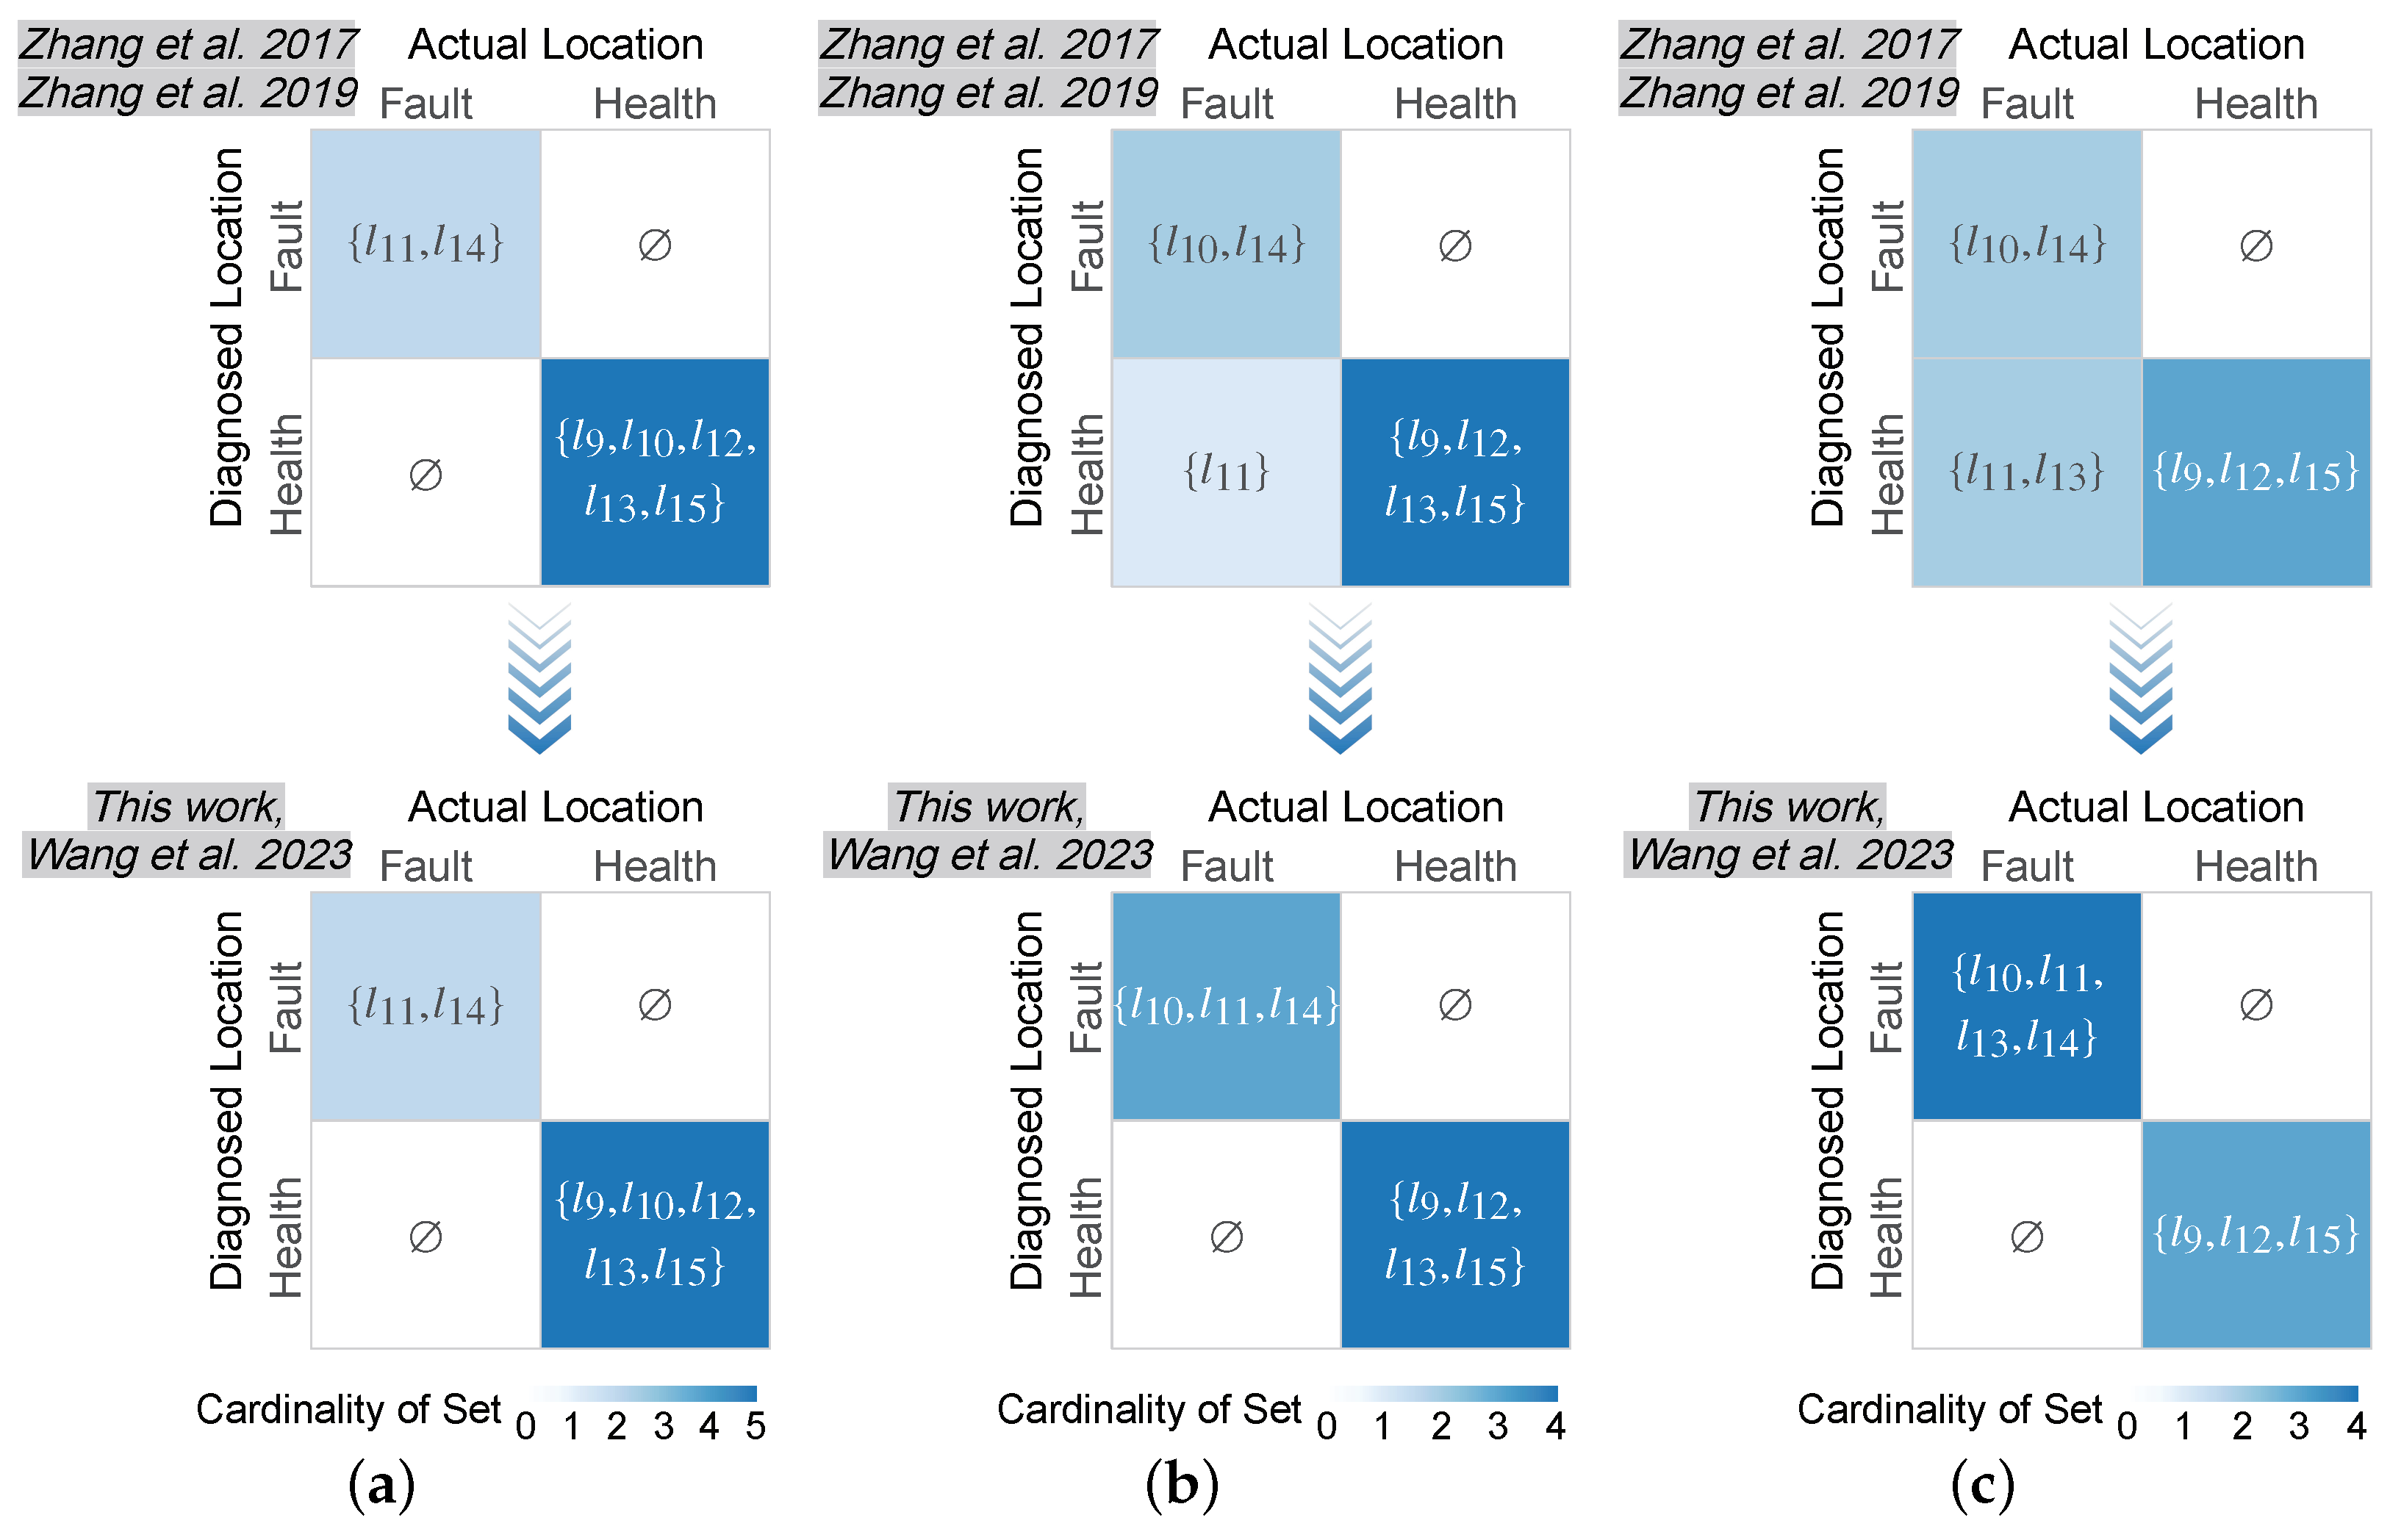
In the three case studies of Section 4, the trunk IC fault diagnosis results using different methods are summarized in Figure 14 in the form of confusion matrices, and the corresponding diagnostic performance metrics are then obtained and presented in Table 10, in which the false-negative rate (FNR), the false-positive rate (FPR), and the accuracy (ACC) are calculated by
F N R = F N T P + F N × 100 % , F P R = F P F P + T N × 100 % , A C C = T P + T N T P + T N + F P + F N × 100 %
where T P , T N , F P , and F N are the values of true positives, true negatives, false positives, and false negatives, respectively.
The diagnostic results can be summarized as follows: Firstly, the methods proposed in [52,53] can only make an accurate diagnosis under the condition of double trunk IC faults, while having some extent of missed diagnosis under the condition of multiple trunk IC faults. More specifically, the existing methods can only identify the fault boundaries, e.g., l 11 , l 14 in case study 1 and l 10 , l 14 in case studies 2 and 3, while the health status of the links within these boundaries is nondiagnosable. This is because the existing methods use the fault probabilities of links that are roughly estimated only from the symptom distribution to diagnose IC faults, whereas, in essence, the symptom distribution depends on the fault boundaries. (For example, a node will produce the symptom (0, 1) if there is a trunk IC fault to the right of that node; hence, the range of nodes exhibiting the symptom (0, 1) depends only on the location of the rightmost trunk IC fault.) Therefore, even if there is a trunk IC fault within the fault boundaries, this trunk IC fault will be missed and the diagnostic result will still be the fault boundaries since the symptom distribution will not change.
In contrast, both the methods proposed in [54] and in this paper have zero FNR and FPR and 100% ACC under various fault conditions, which indicates that there is no missed diagnosis or misdiagnosis with these two methods. More specifically, these two methods can accurately diagnose the health status of each link in the network, including that within fault boundaries; e.g., these two methods indicate that in the fault boundaries l 10 and l 14 of case study 3, l 11 and l 13 have IC faults, while l 12 does not. The reasons for obtaining this accurate result of the two methods are different and are analyzed separately as follows: For the method in [54], this is because this method can gradually find the locations of all IC faults by performing an additional diagnosis for the subnetwork within each fault boundary. (Note that although this method yields accurate diagnostic results, it is less efficient than the proposed method due to the repeated diagnostic process; see the next subsection for relevant comparison and discussion.) For the method in this work, this is because the proposed method takes into account that the occurrence of a trunk IC fault within the fault boundary will cause a change in the number of symptoms observed; in this way, all trunk links with IC faults can be distinguished from normal links based on the exact fault probability for each link calculated from the symptom count values. Therefore, it can be concluded that the diagnostic accuracy of the proposed method has an improvement over that of most existing methods and is the highest among the existing methods.
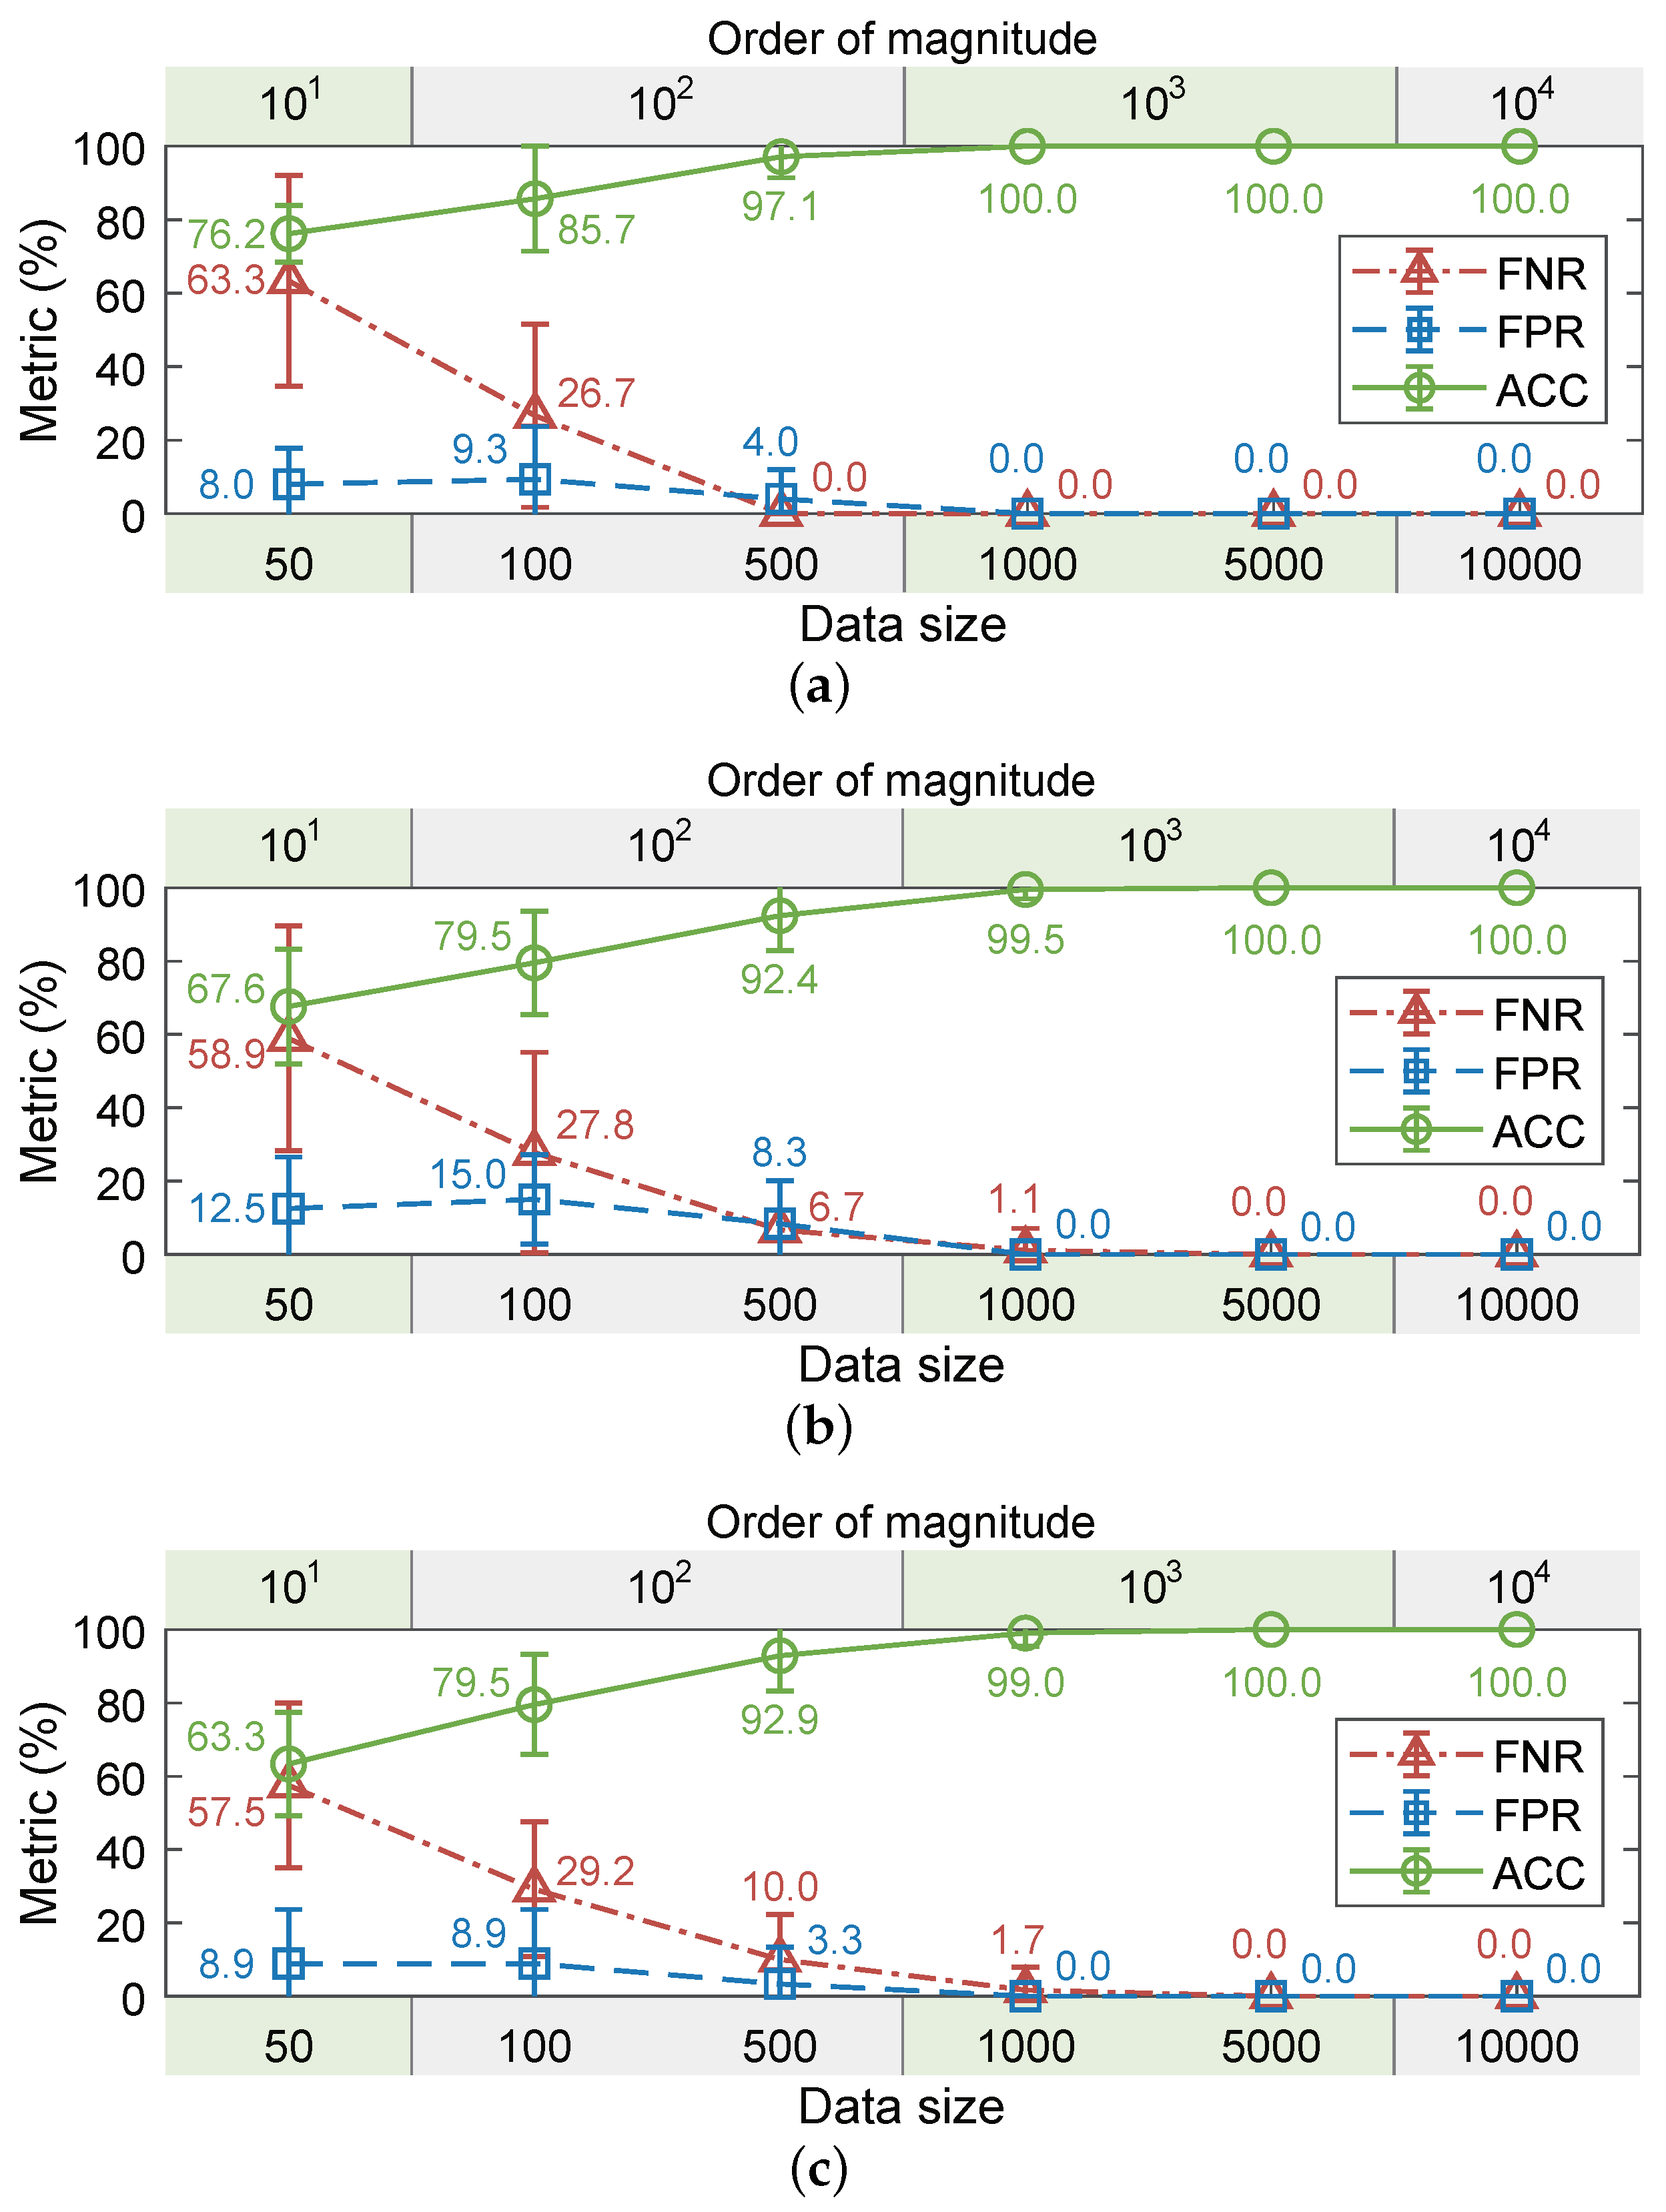
In addition, the impact of the number of error records on the diagnostic accuracy of the proposed method is analyzed. For the different fault conditions in the three case studies, we apply the proposed method for diagnosis under six different data sizes, respectively. Under each data condition, we conduct 300 groups of repeated experiments to obtain the means and standard deviations of the diagnostic performance metrics. Figure 15 shows the trends of several diagnostic performance metrics versus data size. As seen in the figure, under different fault conditions, (1) as the data size grows, both FNRs and FPRs decrease and the ACCs increase; (2) when the data size is below the order of magnitude of 10 3 , the ACCs vary in wide ranges and their means have not uniformly reached 95.0%, and the FPRs and FNRs are relatively large (>3.0%), which implies that there are considerable degrees of misdiagnosis and missed diagnosis; (3) when the data size is above the order of magnitude of 10 3 , as the data size increases, the ACCs can uniformly stabilize above 99.0% and the FPRs and FNRs uniformly stabilize below 3.0%. Therefore, it can be concluded that, as a rule of thumb, 1000 error records are generally sufficient for an accurate diagnosis by the proposed method.

5.2. Diagnostic Efficiency

In this paper, we use the number of diagnostic rounds required to accurately localize all trunk IC faults to evaluate the efficiency of a diagnosis method, where a diagnostic round consists of installing sensors, processing data, and executing algorithms. The higher the number of diagnostic rounds, the lower the diagnostic efficiency. The numbers of diagnostic rounds for different methods in three case studies are shown in Table 11 and the relevant details are analyzed as follows:
Both [52,53] perform only one round of diagnosis on the network. As discussed in Section 5.1, [52,53] are only able to make an accurate diagnosis of the dual trunk fault scenario, such as case study 1, and hence the number of diagnostic rounds for [52,53] in case study 1 is 1. Whereas in case studies 2 and 3, [52,53] cannot diagnose the fault locations correctly at all, hence the numbers of diagnostic rounds are not considered. In [54], its divide-and-conquer diagnosis process is repetitive. It first diagnoses the whole network to determine the fault boundaries, then diagnoses the subnetwork within the fault boundaries individually to determine new fault boundaries, and so on until there is no fault boundary.
For example, in case study 3, [54] locates the faults on l 10 and l 14 in the first diagnostic round, and determines that the fault boundaries are l 10 and l 14 ; the second round is then performed on the subnetwork between l 10 and l 14 , which locates the faults on l 11 and l 13 and determines that the new fault boundaries are l 11 and l 13 ; the third round is then performed on the subnetwork between l 11 and l 13 , from which it is determined that the links within this subnetwork are fault-free; thus, the number of diagnostic rounds for [54] is 3 in case study 3.
In contrast, the method proposed in this work determines the IC fault locations based on the exact fault probability of each link, which allows the proposed method to locate all trunk IC fault locations with only one diagnostic round. Therefore, the number of diagnostic rounds for the proposed method is 1 in all three case studies. As shown in Table 11, the proposed method requires fewer rounds to make an accurate diagnosis than existing methods, which indicates that the diagnostic efficiency of the proposed method has an improvement over that of the existing methods.
In addition, note that the proposed method only needs to attach the sensor to the end of the network, a position commonly using open ports to facilitate hookup of external devices, whereas [54] requires reconfiguring the sensor layout and repeatedly hooking up and removing the sensors inside the network when diagnosing the subnetworks within the fault boundaries.
However, the interior of some CAN-based industrial networks (e.g., DeviceNet) is often not directly accessible. The method proposed in this work is, therefore, more practical to implement in industrial environments than existing methods.
In summary, compared with [52,53], the proposed method has shown clear improvements in both diagnostic accuracy and efficiency; compared with [54], the proposed method has shown higher diagnostic efficiency while guaranteeing the same 100% diagnostic accuracy. Therefore, it can be concluded that the comprehensive diagnostic capability of the proposed method is superior to that of the existing methods.

6. Conclusions

In this paper, a fault symptom association model-based IC fault diagnosis method for CANs using symptom count information is developed. The symptoms observed in various IC location scenarios and their domains are derived. Fault symptom association models are built to quantitatively describe the dependence between symptoms and fault locations, based on which a model-based maximal contribution diagnosis algorithm is developed to locate the IC faults in the network. The experimental results of case studies conducted to demonstrate the effectiveness of the proposed method show that the IC fault locations determined via the proposed method agree well with the imposed experimental conditions in various scenarios, including double IC faults on both drop and trunk cables, multiple IC faults on trunk cables, and multiple IC faults on both drop and trunk cables. Further discussion shows that the comprehensive diagnostic capability of the proposed method is superior to that of the existing IC fault diagnosis methods, as evidenced by the fact that the proposed method achieves more accurate diagnosis with higher efficiency.
Considering that the proposed method and existing works are constrained to open-circuit faults, bus topology networks, and limited-variation data frames, future work will include (1) extending the current method to other common wiring fault scenarios, such as short-circuit IC faults and hybrid faults with coexisting open-circuit IC faults and short-circuit IC faults, (2) improving the current method to enable its application to several complex topologies, such as tree topologies and star topologies, and (3) developing the particular data treatment procedure for real-time data frames, such as sensor/actuator-related binary/text data frames.

Author Contributions

Conceptualization, L.W., S.H. and Y.L.; methodology, L.W., S.H. and Y.L.; software, L.W. and S.H.; validation, L.W. and S.H.; formal analysis, L.W. and S.H.; investigation, L.W. and S.H.; resources, Y.L.; data curation, L.W.; writing—original draft preparation, L.W.; writing—review and editing, L.W. and Y.L.; visualization, L.W.; supervision, Y.L.; project administration, Y.L.; funding acquisition, Y.L. All authors have read and agreed to the published version of the manuscript.

Funding

This study is supported by the National Natural Science Foundation of China under Grant 52072341.

Data Availability Statement

Data are included in the article.

Conflicts of Interest

The authors declare no conflicts of interest.

References

  1. Farsi, M.; Ratcliff, K.; Barbosa, M. An overview of controller area network. Comput. Control Eng. J. 1999, 10, 113–120. [Google Scholar] [CrossRef]
  2. Technical Report IEEE Standard 100-2000; The Authoritative Dictionary of IEEE Standards Terms. IEEE: Piscataway, NJ, USA, 2000.
  3. Ismaeel, A.A.; Bhatnagar, R. Test for detection and location of intermittent faults in combinational circuits. IEEE Trans. Reliab. 1997, 46, 269–274. [Google Scholar] [CrossRef]
  4. Fang, X.; Qu, J.; Tang, Q.; Chai, Y. Intermittent fault recognition of analog circuits in the presence of outliers via density peak clustering with adaptive weighted distance. IEEE Sens. J. 2023, 23, 13351–13359. [Google Scholar] [CrossRef]
  5. Sydor, P.; Kavade, R.; Hockley, C.J. Warranty Impacts from No Fault Found (NFF) and an Impact Avoidance Benchmarking Tool. In Advances in Through-Life Engineering Services; Redding, L., Roy, R., Shaw, A., Eds.; Springer International Publishing: Cham, Switzerland, 2017; pp. 245–259. [Google Scholar] [CrossRef]
  6. Khan, S.; Phillips, P.; Jennions, I.; Hockley, C. No fault found events in maintenance engineering Part 1: Current trends, implications and organizational practices. Reliab. Eng. Syst. Saf. 2014, 123, 183–195. [Google Scholar] [CrossRef]
  7. Bâzu, M.; Bǎjenescu, T. Failure Analysis: A Practical Guide for Manufacturers of Electronic Components and Systems; Wiley: Chichester, UK, 2011; pp. 37–70. [Google Scholar] [CrossRef]
  8. Shannon, R.; Quiter, J.; D’Annunzio, A.; Meseroll, R.; Lebron, R.; Sieracki, V. A systems approach to diagnostic ambiguity reduction in naval avionic systems. In Proceedings of the IEEE Autotestcon, Orlando, FL, USA, 26–29 September 2005; pp. 194–200. [Google Scholar] [CrossRef]
  9. Lei, Y. Intelligent Maintenance in Networked Industrial Automation Systems. Ph.D. Dissertation, Department of Mechanical Engineering, University of Michigan, Ann Arbor, MI, USA, 2007. [Google Scholar]
  10. Cauffriez, L.; Conrard, B.; Thiriet, J.; Bayart, M. Fieldbuses and their influence on dependability. In Proceedings of the IEEE 20th Instrumentation and Measurement Technology Conference, Vail, CO, USA, 20–22 May 2003; pp. 83–88. [Google Scholar] [CrossRef]
  11. Söderholm, P. A system view of the no fault found (NFF) phenomenon. Reliab. Eng. Syst. Saf. 2007, 92, 1–14. [Google Scholar] [CrossRef]
  12. Thomas, D.A.; Ayers, K.; Pecht, M. The ‘trouble not identified’ phenomenon in automotive electronics. Microelectron. Reliab. 2002, 42, 641–651. [Google Scholar] [CrossRef]
  13. Moffat, B.; Abraham, E.; Desmulliez, M.; Koltsov, D.; Richardson, A. Failure mechanisms of legacy aircraft wiring and interconnects. IEEE Trans. Dielectr. Electr. Insul. 2008, 15, 808–822. [Google Scholar] [CrossRef]
  14. Beniaminy, I.; Joseph, D. Reducing the ‘no fault found’ problem: Contributions from expert-system methods. In Proceedings of the Proceedings, IEEE Aerospace Conference, Big Sky, MT, USA, 9–16 March 2002; pp. 9–16. [Google Scholar] [CrossRef]
  15. He, W.; He, Y.; Li, B.; Zhang, C. Analog circuit fault diagnosis via joint cross-wavelet singular entropy and parametric t-SNE. Entropy 2018, 20, 604. [Google Scholar] [CrossRef]
  16. He, W.; He, Y.; Luo, Q.; Zhang, C. Fault diagnosis for analog circuits utilizing time-frequency features and improved VVRKFA. Meas. Sci. Technol. 2018, 29, 045004. [Google Scholar] [CrossRef]
  17. Zhang, C.; Zhao, S.; Yang, Z.; He, Y. A multi-fault diagnosis method for lithium-ion battery pack using curvilinear Manhattan distance evaluation and voltage difference analysis. J. Energy Storage 2023, 67, 107575. [Google Scholar] [CrossRef]
  18. Zhou, D.; Shi, J.; He, X. Review of intermittent fault diagnosis techniques for dynamic systems. Acta Autom. Sin. 2014, 40, 161–171. [Google Scholar] [CrossRef]
  19. Deng, G.; Qiu, J.; Liu, G.; Lyu, K. A discrete event systems approach to discriminating intermittent from permanent faults. Chin. J. Aeronaut. 2014, 27, 390–396. [Google Scholar] [CrossRef]
  20. Zhang, K.; Gou, B.; Xiong, W.; Feng, X. An online diagnosis method for sensor intermittent fault based on data-driven model. IEEE Trans. Power Electron. 2023, 38, 2861–2865. [Google Scholar] [CrossRef]
  21. Bondavalli, A.; Chiaradonna, S.; Giandomenico, F.D.; Grandoni, F. Threshold-based mechanisms to discriminate transient from intermittent faults. IEEE Trans. Comput. 2000, 49, 230–245. [Google Scholar] [CrossRef]
  22. Cai, B.; Liu, Y.; Xie, M. A dynamic-bayesian-network-based fault diagnosis methodology considering transient and intermittent faults. IEEE Trans. Automat. Sci. Eng. 2017, 14, 276–285. [Google Scholar] [CrossRef]
  23. Yu, M.; Wang, D. Model-based health monitoring for a vehicle steering system with multiple faults of unknown types. IEEE Trans. Ind. Electron. 2014, 61, 3574–3586. [Google Scholar] [CrossRef]
  24. Gouda, B.S.; Panda, M.; Panigrahi, T.; Das, S.; Appasani, B.; Acharya, O.; Zawbaa, H.M.; Kamel, S. Distributed intermittent fault diagnosis in wireless sensor network using likelihood ratio test. IEEE Access 2023, 11, 6958–6972. [Google Scholar] [CrossRef]
  25. Mahapatro, A.; Khilar, P.M. Detection and diagnosis of node failure in wireless sensor networks: A multiobjective optimization approach. Swarm Evol. Comput. 2013, 13, 74–84. [Google Scholar] [CrossRef]
  26. Syed, W.A.; Perinpanayagam, S.; Samie, M.; Jennions, I. A novel intermittent fault detection algorithm and health monitoring for electronic interconnections. IEEE Trans. Compon. Packag. Manuf. Technol. 2016, 6, 400–406. [Google Scholar] [CrossRef]
  27. Yu, M.; Wang, Z.; Wang, H.; Jiang, W.; Zhu, R. Intermittent fault diagnosis and prognosis for steer-by-wire system using composite degradation model. IEEE J. Emerg. Sel. Top. Circuits Syst. 2023, 13, 557–571. [Google Scholar] [CrossRef]
  28. Yaramasu, A.; Cao, Y.; Liu, G.; Wu, B. Intermittent wiring fault detection and diagnosis for SSPC based aircraft power distribution system. In Proceedings of the IEEE/ASME International Conference on Advanced Intelligent Mechatronics, Kaohsiung, Taiwan, 11–14 July 2012; pp. 1117–1122. [Google Scholar] [CrossRef]
  29. Huang, C.; Shen, Z.; Zhang, J.; Hou, G. BIT-based intermittent fault diagnosis of analog circuits by improved deep forest classifier. IEEE Trans. Instrum. Meas. 2022, 71, 3519213. [Google Scholar] [CrossRef]
  30. Furse, C.; Smith, P.; Safavi, M.; Lo, C. Feasibility of spread spectrum sensors for location of arcs on live wires. IEEE Sens. J. 2005, 5, 1445–1450. [Google Scholar] [CrossRef]
  31. Smith, P.; Furse, C.; Gunther, J. Analysis of spread spectrum time domain reflectometry for wire fault location. IEEE Sens. J. 2005, 5, 1469–1478. [Google Scholar] [CrossRef]
  32. Jiang, Y.; Miao, Y.; Qiu, Z.; Wang, Z.; Pan, J.; Yang, C. Intermittent fault detection and diagnosis for aircraft fuel system based on SVM. In Proceedings of the CSAA/IET International Conference on Aircraft Utility Systems (AUS), Online, 18–21 September 2020; pp. 1255–1258. [Google Scholar] [CrossRef]
  33. Alamuti, M.M.; Nouri, H.; Ciric, R.M.; Terzija, V. Intermittent fault location in distribution feeders. IEEE Trans. Power Del. 2012, 27, 96–103. [Google Scholar] [CrossRef]
  34. Farughian, A.; Kumpulainen, L.; Kauhaniemi, K.; Hovila, P. Intermittent earth fault passage indication in compensated distribution networks. IEEE Access 2021, 9, 45356–45366. [Google Scholar] [CrossRef]
  35. Li, L.; Wang, Z.; Shen, Y. Fault diagnosis for the intermittent fault in gyroscopes: A data-driven method. In Proceedings of the 35th Chinese Control Conference (CCC), Chengdu, China, 27–29 July 2016; pp. 6639–6643. [Google Scholar] [CrossRef]
  36. Huakang, L.; Kehong, L.; Yong, Z.; Qiu, J.; Liu, G. Study of solder joint intermittent fault diagnosis based on dynamic analysis. IEEE Trans. Compon. Packag. Manuf. Technol. 2019, 9, 1748–1758. [Google Scholar] [CrossRef]
  37. Yan, R.; He, X.; Wang, Z.; Zhou, D. Detection, isolation and diagnosability analysis of intermittent faults in stochastic systems. Int. J. Control 2018, 91, 480–494. [Google Scholar] [CrossRef]
  38. Song, J.; Lin, L.; Huang, Y.; Hsieh, S.Y. Intermittent fault diagnosis of split-star networks and its applications. IEEE Trans. Parallel Distrib. Syst. 2023, 34, 1253–1264. [Google Scholar] [CrossRef]
  39. Kelkar, S.; Kamal, R. Adaptive fault diagnosis algorithm for controller area network. IEEE Trans. Ind. Electron. 2014, 61, 5527–5537. [Google Scholar] [CrossRef]
  40. Kelkar, S.; Kamal, R. Implementation of data reduction technique in adaptive fault diagnosis algorithm for controller area network. In Proceedings of the International Conference on Circuits, Systems, Communication and Information Technology Applications, Mumbai, India, 4–5 April 2014; pp. 156–161. [Google Scholar] [CrossRef]
  41. Nath, N.N.; Pillay, V.R.; Saisuriyaa, G. Distributed node fault detection and tolerance algorithm for controller area networks. In Intelligent Systems Technologies and Applications; Springer International Publishing: Cham, Switzerland, 2016; pp. 247–257. [Google Scholar] [CrossRef]
  42. Yang, Y.; Wang, L.; Li, Z.; Shen, P.; Guan, X.; Xia, W. Anomaly detection for controller area network in braking control system with dynamic ensemble selection. IEEE Access 2019, 7, 95418–95429. [Google Scholar] [CrossRef]
  43. Hassen, W.B.; Auzanneau, F.; Pérės, F.; Tchangani, A.P. Diagnosis sensor fusion for wire fault location in CAN bus systems. In Proceedings of the IEEE SENSORS, Baltimore, MD, USA, 3–6 November 2013; pp. 1–4. [Google Scholar] [CrossRef]
  44. Hu, H.; Qin, G. Online fault diagnosis for controller area networks. In Proceedings of the Fourth International Conference on Intelligent Computation Technology and Automation, Shenzhen, China, 28–29 March 2011; pp. 452–455. [Google Scholar] [CrossRef]
  45. Gao, D.; Wang, Q. Health monitoring of controller area network in hybrid excavator based on the message response time. In Proceedings of the IEEE/ASME International Conference on Advanced Intelligent Mechatronics, Besacon, France, 8–11 July 2014; pp. 1634–1639. [Google Scholar] [CrossRef]
  46. Pohren, D.H.; Roque, A.d.S.; Kranz, T.A.I.; de Freitas, E.P.; Pereira, C.E. An analysis of the impact of transient faults on the performance of the CAN-FD protocol. IEEE Trans. Ind. Electron. 2020, 67, 2440–2449. [Google Scholar] [CrossRef]
  47. Roque, A.D.S.; Jazdi, N.; Freitas, E.P.D.; Pereira, C.E. A fault modeling based runtime diagnostic mechanism for vehicular distributed control systems. IEEE Trans. Intell. Transp. Syst. 2022, 23, 7220–7232. [Google Scholar] [CrossRef]
  48. Lei, Y.; Yuan, Y.; Zhao, J. Model-based detection and monitoring of the intermittent connections for CAN networks. IEEE Trans. Ind. Electron. 2014, 61, 2912–2921. [Google Scholar] [CrossRef]
  49. Lei, Y.; Djurdjanovic, D. Diagnosis of intermittent connections for DeviceNet. Chin. J. Mech. Eng. 2010, 23, 606–612. [Google Scholar] [CrossRef]
  50. Lei, Y.; Yuan, Y.; Sun, Y. Fault location identification for localized intermittent connection problems on CAN networks. Chin. J. Mech. Eng. 2014, 27, 1038–1046. [Google Scholar] [CrossRef]
  51. Lei, Y.; Xie, H.; Yuan, Y.; Chang, Q. Fault location for the intermittent connection problems on CAN networks. IEEE Trans. Ind. Electron. 2015, 62, 7203–7213. [Google Scholar] [CrossRef]
  52. Zhang, L.; Lei, Y.; Chang, Q. Intermittent connection fault diagnosis for CAN using data link layer information. IEEE Trans. Ind. Electron. 2017, 64, 2286–2295. [Google Scholar] [CrossRef]
  53. Zhang, L.; Yang, F.; Lei, Y. Tree-based intermittent connection fault diagnosis for controller area network. IEEE Trans. Veh. Technol. 2019, 68, 9151–9161. [Google Scholar] [CrossRef]
  54. Wang, L.; Zhang, L.; Lei, Y. Diagnosis of intermittent connection faults for CAN networks with complex topology. IEEE Access 2023, 11, 52199–52213. [Google Scholar] [CrossRef]
  55. Technical Report ISO 11898-1:2003; Road Vehicles-Controller Area Network (CAN)-Part 1: Data Link Layer and Physical Signalling. ISO: Geneva, Switzerland, 2003.
  56. Bosch, R. CAN Specification Version 2.0; Technical Report, Postfach; Rober Bousch GmbH: Stuttgart, Germany, 1991. [Google Scholar]
Figure 1. Different scenarios of IC locations in a CAN. Scenarios A and B have IC faults on the drop cables of the sending node and a nonsending node, respectively. Scenario C has IC faults on a trunk cable.
Actuators 13 00358 g001
Figure 2. Overall framework of the proposed IC fault diagnosis method.
Actuators 13 00358 g002
Figure 3. Equivalent topology and error collection architecture of the CAN shown in Figure 1.
Actuators 13 00358 g003
Figure 4. Illustration of (a) an error record and (b) the corresponding correct data frame. R denotes a recessive bit. D denotes a dominant bit.
Actuators 13 00358 g004
Figure 5. Example of a fault symptom association model for local IC faults. The causality between candidate fault locations and symptoms is represented by the dot size, with a large dot indicating that a fault on link l j can lead to symptom S i and a small dot indicating that it cannot. The fault probabilities for the candidate fault locations are represented by the dot color, by which the candidate fault locations are ordered.
Actuators 13 00358 g005
Figure 6. Fault symptom association model for IC fault diagnosis in Examples 2 and 3. To clearly show the diagnostic process and result in Example 3, the dashed arrows are used to illustrate the candidate fault location that provides the best explanation for each symptom, and the dashed box on the horizontal coordinate is used to indicate that the fault locations are determined.
Actuators 13 00358 g006
Figure 7. Schematic layout of the IC fault injection and error collection testbed for CAN IC fault diagnosis.
Actuators 13 00358 g007
Figure 8. Layout of the experimental testbed constructed for the case studies.
Actuators 13 00358 g008
Figure 9. Equivalent topology of the eight-node network and summary of the IC fault injection locations considered in all case studies.
Actuators 13 00358 g009
Figure 10. Fault symptom association model for diagnosing local IC faults in case study 1. To clearly show the result, the dashed arrows are used to illustrate the candidate fault location that provides the best explanation for each symptom, and the dashed box on the horizontal coordinate is used to indicate that the faults are determined.
Actuators 13 00358 g010
Figure 11. Fault symptom association model for diagnosing trunk IC faults in case study 1.
Actuators 13 00358 g011
Figure 12. Fault symptom association model for diagnosing trunk IC faults in case study 2.
Actuators 13 00358 g012
Figure 13. Fault symptom association model for diagnosing trunk IC faults in case study 3.
Actuators 13 00358 g013
Figure 14. Comparison of trunk IC fault diagnosis results of methods proposed in [52,53,54] and this work in (a) case study 1, (b) case study 2, and (c) case study 3.
Actuators 13 00358 g014
Figure 15. Trends in mean values of performance metrics of the proposed method versus data size in (a) case study 1, (b) case study 2, and (c) case study 3. The upper and lower bounds of the error bars are the positive and negative standard deviations of the corresponding metrics.
Actuators 13 00358 g015
Table 1. Summary of related work.
ReferenceMain ApproachResearch Gap
[15,16,17]Fault diagnosis methods for electronic circuitsOnly permanent component faults are considered, not IFs.
[4,18,19,20,21,22,23,24,25,26]IF detection and recognition methods for electrical systemsIF localization is not addressed.
[27,28,29,30,31,32,33,34,35,36,37,38]IF localization methods for electrical systemsSpecialized for specific systems, not applicable to IF diagnosis for CANs.
[39,40,41,42,43,44,45]Fault diagnosis methods for CANsOnly permanent faults are considered, not IFs.
[46,47]Analysis of IF-induced performance anomalies for CANsIF localization is not addressed, and cable faults are not considered.
[48]IC fault detection method for CANsIC fault localization is not addressed.
[49,50]Physical layer-based location methods for drop cable IC faults in CANsIC faults on trunk cables cannot be located.
[51]Physical layer-based IC fault location methods for CANsRobustness is poor, and only one trunk cable IC fault can be located.
[52,53]Data link layer-based IC fault location methods for CANsOnly up to two trunk cable IC faults can be located, and the fault probability for every cable cannot be quantified.
[54]Indirect method of locating IC faults in complex topology CANsMultiple trunk cable IC faults can be located, but it requires repeated diagnosis.
This workDirect method of locating IC faults in CANs(Covered gap) Locate multiple trunk cable IC faults accurately without need for repeated diagnosis.
Table 2. Probabilities p ( S i | l j ) in Example 2.
p ( S i | l j ) l 1 l 2 l 3 l 4
S 1 00.160.260.48
S 2 00.1900
S 3 0.270.1800.52
S 4 0.730.470.740
Table 3. Fault probabilities for all candidate fault locations in F S l o c in Example 2.
l j l 1 l 2 l 3 l 4
p ^ ( l j ) 3.33 × 10 15 1 3.49 × 10 15 1.72 × 10 15
Table 4. Symptoms and corresponding count values for all nodes in case study 1.
Node
r
Symptoms for Local IC FaultSymptoms for Trunk IC Fault
S N r < 1 > val S N r < 2 > val S N r < 1 > val S N r < 2 > val
1 ( 0 , 0 ) 538 ( 1 , 1 ) 3 ( 0 , 1 ) 611 ( 1 , 0 ) 3
2 ( 0 , 0 ) 524 ( 0 , 1 ) 560 ( 1 , 0 ) 2
5 ( 0 , 0 ) 261 ( 1 , 1 ) 350 ( 0 , 1 ) 586
6 ( 0 , 0 ) 473 ( 1 , 1 ) 2 ( 0 , 1 ) 330 ( 1 , 0 ) 130
10 ( 0 , 0 ) 312 ( 1 , 1 ) 331 ( 0 , 1 ) 392 ( 1 , 0 ) 121
11 ( 0 , 0 ) 445 ( 1 , 1 ) 2 ( 0 , 1 ) 394 ( 1 , 0 ) 119
12 ( 0 , 0 ) 540 ( 1 , 0 ) 513
PLC ( 0 , 0 ) 2605 ( 1 , 1 ) 4 ( 1 , 0 ) 2339
Table 5. Domains of the symptoms contained in S l o c in case study 1.
Node
r
Domains of Symptoms for Local IC Fault
F N r < 1 > F N r < 2 >
1 { l 2 , l 3 , l 4 , l 5 , l 6 , l 7 , l 8 }
2 { l 1 , l 3 , l 4 , l 5 , l 6 , l 7 , l 8 }
5 { l 1 , l 2 , l 4 , l 5 , l 6 , l 7 , l 8 } { l 3 }
6 { l 1 , l 2 , l 3 , l 5 , l 6 , l 7 , l 8 }
10 { l 1 , l 2 , l 3 , l 4 , l 6 , l 7 , l 8 } { l 5 }
11 { l 1 , l 2 , l 3 , l 4 , l 5 , l 7 , l 8 }
12 { l 1 , l 2 , l 3 , l 4 , l 5 , l 6 , l 8 }
PLC { l 1 , l 2 , l 3 , l 4 , l 5 , l 6 , l 7 }
Table 6. Domains of the symptoms contained in S t r k in case study 1.
Node
r
Domains of Symptoms for Trunk IC Fault
F N r < 1 > F N r < 2 >
1 { l 11 , l 12 , l 13 , l 14 }
2 { l 11 , l 12 , l 13 , l 14 }
5 { l 11 , l 12 , l 13 , l 14 }
6 { l 12 , l 13 , l 14 } { l 11 }
10 { l 13 , l 14 } { l 11 , l 12 }
11 { l 14 } { l 11 , l 12 , l 13 }
12 { l 11 , l 12 , l 13 , l 14 }
PLC { l 11 , l 12 , l 13 , l 14 }
Table 7. Symptoms and corresponding count values for all nodes in case study 2.
Node
r
Symptoms for Local IC FaultSymptoms for Trunk IC Fault
S N r < 1 > val S N r < 2 > val S N r < 1 > val S N r < 2 > val
1 ( 0 , 0 ) 294 ( 0 , 1 ) 901
2 ( 0 , 0 ) 275 ( 1 , 1 ) 2 ( 0 , 1 ) 860 ( 1 , 0 ) 2
5 ( 0 , 0 ) 280 ( 1 , 1 ) 2 ( 0 , 1 ) 521 ( 1 , 0 ) 333
6 ( 0 , 0 ) 226 ( 0 , 1 ) 296 ( 1 , 0 ) 510
10 ( 0 , 0 ) 3 ( 1 , 1 ) 301 ( 0 , 1 ) 310 ( 1 , 0 ) 506
11 ( 0 , 0 ) 205 ( 0 , 1 ) 299 ( 1 , 0 ) 515
12 ( 0 , 0 ) 251 ( 1 , 0 ) 853
PLC ( 0 , 0 ) 1284 ( 1 , 1 ) 7 ( 1 , 0 ) 4017
Table 8. Domains of the symptoms contained in S t r k in case study 2.
Node
r
Domains of Symptoms for Trunk IC Fault
F N r < 1 > F N r < 2 >
1 { l 10 , l 11 , l 12 , l 13 , l 14 }
2 { l 10 , l 11 , l 12 , l 13 , l 14 }
5 { l 11 , l 12 , l 13 , l 14 } { l 10 }
6 { l 12 , l 13 , l 14 } { l 10 , l 11 }
10 { l 13 , l 14 } { l 10 , l 11 , l 12 }
11 { l 14 } { l 10 , l 11 , l 12 , l 13 }
12 { l 10 , l 11 , l 12 , l 13 , l 14 }
PLC { l 10 , l 11 , l 12 , l 13 , l 14 }
Table 9. Symptoms and corresponding count values for all nodes in case study 3.
Node
r
Symptoms for Local IC FaultSymptoms for Trunk IC Fault
S N r < 1 > val S N r < 2 > val S N r < 1 > val S N r < 2 > val
1 ( 0 , 0 ) 3 ( 1 , 1 ) 1 ( 0 , 1 ) 1230
2 ( 0 , 0 ) 2 ( 1 , 1 ) 2 ( 0 , 1 ) 1172 ( 1 , 0 ) 2
5 ( 0 , 0 ) 3 ( 1 , 1 ) 2 ( 0 , 1 ) 869 ( 1 , 0 ) 332
6 ( 0 , 0 ) 3 ( 0 , 1 ) 587 ( 1 , 0 ) 510
10 ( 0 , 0 ) 2 ( 1 , 1 ) 1 ( 0 , 1 ) 651 ( 1 , 0 ) 506
11 ( 0 , 0 ) 2 ( 0 , 1 ) 298 ( 1 , 0 ) 824
12 ( 0 , 0 ) 1 ( 1 , 1 ) 1 ( 1 , 0 ) 1178
PLC ( 0 , 0 ) 9 ( 1 , 1 ) 7 ( 1 , 0 ) 5600
Table 10. Comparison of trunk IC fault diagnosis performance of different methods.
MethodCase Study 1Case Study 2Case Study 3
FNRFPRACCFNRFPRACCFNRFPRACC
[52]00100%33%086%50%071%
[53]00100%33%086%50%071%
[54]00100%00100%00100%
This work00100%00100%00100%
Table 11. Comparison of diagnostic rounds of different methods.
MethodDiagnostic Round
Case Study 1Case Study 2Case Study 3
[52]1
[53]1
[54]223
This work111
Disclaimer/Publisher’s Note: The statements, opinions and data contained in all publications are solely those of the individual author(s) and contributor(s) and not of MDPI and/or the editor(s). MDPI and/or the editor(s) disclaim responsibility for any injury to people or property resulting from any ideas, methods, instructions or products referred to in the content.