Abstract
For the application of Delta robots with a 3-R(RPaR) configuration in machining tasks, this paper constructed a 54-parameter kinematic error model and a simplified dynamic model incorporating an integrated joint’s position error and friction, respectively. Utilizing Singular Value Decomposition (SVD) of the Linear Model Coefficient Matrix (LMCM) and the coefficient chart, a criterion for identifiability of error components is established. For good identification results, the optimal measurement surface with Fourier series form is obtained using a combination of the Hook–Jeeves Direct Search Algorithm (DSA) and Inner Point Method (IPM). The friction coefficients and other dynamic parameters are obtained through fitting the integrated joint torque-angle pairs measured along specific trajectories using nonlinear least squares regression. The validation of the calibration process is conducted through simulations and experiments. The calibration results provide a foundation for the precise control of integrated joints and the high-precision motion of robots.
1. Introduction
In comparison to serial robots, parallel robots offer significant advantages, including enhanced stiffness and improved repeatability. Delta robots, as a highly successful configuration of parallel robots, have found extensive applications in various fields such as Pick-and-Place [1], 3D printing [2], medical fields [3], and machining [4]. For machining applications, Delta robots demand exceptional motion precision. Precision in robotic systems is typically achieved through two approaches: precise analysis during the design stage and error compensation following assembly. Error calibration and compensation, facilitated using algorithms and software, substantially enhance the precision of deployed robots [5,6].
Kinematic modeling serves as the cornerstone of robot error calibration. Various methods are employed, including the Denavit–Hartenberg (DH) method [7], exponential product [8], and vector loop method [9]. The vector loop method formulates closed-loop motion equations through position vectors at the link ends or joints within kinematic chains and is highly suitable for parallel robots. Vischer et al. [10] utilized the vector loop method to construct two kinematic models, “Model 54” and “Model 24”, for the 3-R(2-SS) configuration. “Model 54” considers geometric errors in all mechanical components except for the spherical joints; if the spatial parallelogram is assumed to remain perfect, “Model 54” can be simplified to “Model 24”. In “Model 24”, the direction of the Delta robot’s moving platform is assumed to be constant. Li et al. [11], also focusing on the 3-R(2-SS) configuration, demonstrated a significant influence of parallel mechanism errors on motion precision, especially in the Z-direction, with an increase in the tilt angle of the moving platform. Shen et al. [12], utilizing the variational method, studied the effect of error components (including the parallelogram mechanism) on the motion precision of Delta-RU robots, significantly enhancing the accuracy of the end effector through compensation. While scholars have recently introduced data-driven approaches for kinematic calibration, the model-based method continues to be predominant. This preference stems from its clear physical significance and the extensive measurement data demanded by the former [13].
Kinematic parameter identification is typically based on redundant equations formed using kinematic models and multiple measurement points. Considering noises in measurement data, the final parameter solution is obtained through nonlinear least squares solutions, with the Levenberg–Marquardt algorithm being the most commonly used algorithm [14]. Other probabilistic methods, such as maximum likelihood estimation and Kalman filtering, are less commonly used. Different parameter error components have varying degrees of influence on the total pose error, typically characterized using sensitivity analysis [15,16]. A local parameter sensitivity can be defined as the ratio of the sensitivity coefficient of a single error component to the combined one of all errors at a measurement point. A global sensitivity can be defined as the integration of local sensitivity over the robot workspace. Sensitivity analysis can identify the dominant error components of the robot. In addition to the calibration for link dimensions and assembly errors, scholars have also investigated the calibration of joint clearance. Kim et al. [17] discussed the relationship between the end effector pose error of the Stewart platform and the tolerance limits of its joints. Tannous et al. [18] conducted a sensitivity analysis on joint clearance using interval analysis methods, taking three manipulators as examples.
The problem of identifying dynamic parameters of robots involves several aspects, including specific identification parameters, dynamic models, excitation trajectories, and solution algorithms. Jan et al. [19] proposed a statistical framework for the dynamic parameter identification of multi-joint serial robots. The excitation trajectories were defined as finite Fourier series on each joint, with the optimal criterion being the uncertainty on the estimated parameters or a lower bound for it. The parameters identified included mass, inertia parameters, and friction parameters. In another study, the coefficients of the Fourier series were optimized to minimize the sensitivity of the identification to measurement disturbances [20]. Zafer et al. [21] used the least squares (LS) method and particle swarm optimization (PSO) technique to estimate distinct inertia parameters of the Staubli RX-60 robot, showing that the PSO method had a smaller identification error. Grotjahn et al. [22] investigated the identification of friction and rigid-body dynamics in parallel kinematic structures, achieving their separation via point-to-point motions. Han et al. [23] considered measurement errors in the process of optimizing excitation trajectories, integrating weighted least squares (WLS) and nonlinear error models, and iteratively reweighted least squares to unify the modeling process of friction and rigid-body dynamics. Dong et al. [24] first identified the friction parameters in the nonlinear Tustin friction model using the LS method during forward and reverse rotations, then estimated the remaining dynamic parameters of the Stäubli TX-90 robot using the symbiotic organisms search (SOS) algorithm. Song et al. [25] implemented the load parameter identification of parallel robots based on the Extended Kalman Filter. Ohno et al. [26] designed target trajectories for the detection of joint clearances based on actuation torque fluctuation. Diaz-Rodriguez et al. [27] developed a simplified dynamic model for a 3-DOF prismatic-revolute-spherical parallel manipulator to improve trajectory tracking precision and reduce the real-time computational burden. Abed Azad et al. [28] obtained the base inertial parameters through singular value decomposition, constructing an optimized path containing several harmonics within the desired bandwidth, achieving offline–online identification of the base inertial parameters.
Measurement processes can be categorized into two types: with or without external measurement devices. Without external measurement device support, the end effector of the robot is virtually constrained to a point, line, or surface [29,30], commonly applied in serial robots. The calibration process of parallel robots often employs external measurement devices, including laser trackers, laser interferometers, coordinate measurement machines (CMMs), vision-based measurement systems, ball-bar systems, etc. [10,31,32,33]. The selection of measurement points directly affects the quality of error parameter identification, leading to an optimization problem, typically aiming for an observation metric as the optimization objective along with constraints. Specific solving methods include local search methods represented by gradient descent and global search algorithms represented by meta-heuristic algorithms. Daney et al. [34] proposed a constrained optimization method for iteratively selecting measurement poses to minimize indicators based on the Jacobi matrix, utilizing the tabu search metaheuristic algorithm to avoid local optima.
This study tackles the relatively unexplored challenge of kinematic error modeling and dynamic calibration for the 3-R(RPaR) configuration Delta robot integrated into a self-built five-axis blade grinding device. It specifically investigates how geometric errors affect the poses of parallelogram mechanism while considering the constraints imposed by the robot’s DoF. Departing from conventional measurement point selection methods, this research reframes the issue as an optimization problem aimed at shaping the measurement workpiece surface, under the assumption that pose errors can be inferred from surface machining errors. Given the complexity of existing parameter sensitivity approaches, the paper seeks to establish criteria for parameter identifiability through the singular value decomposition (SVD) of the LMCM. For machining tasks with smooth and uniform motion, a simplified dynamic model with friction coefficients and other dynamic parameters is established and identified. The objective of this study is to devise a Delta robot calibration methodology tailored for machining environments.
The structure of the subsequent sections is as follows: Section 2 provides an introduction to the blade grinding device and details the kinematic and dynamic models of the Delta robot. Section 3 examines the influence of geometric errors on the parallel mechanism and describes the development of the kinematic error model tailored for the 3-R(RPaR) configuration. In Section 4, the identifiability criteria for error components are proposed, along with the definition of periodic error measurement surfaces and the optimization models under constraints. Section 5 delves into solution algorithms for the optimization problem and validates the kinematic calibration process through simulation. Section 6 validates the dynamic calibration method through experiments. The paper concludes with a summary of the findings and final remarks.
2. Kinematic and Dynamic Modeling
The blade grinding equipment, depicted in Figure 1, includes an optical platform, an aluminum alloy frame, a grinding head unit with a C and B axis, and a Delta robot unit suspended at the top of the frame. The Delta robot’s static platform is secured to the frame’s top, while a six-axis force sensor is mounted on its moving platform and connected to the workpiece. The C axis rotates vertically on the optical platform, and the B axis is perpendicular to its rotation axis. A spindle, mounted perpendicular to the B axis, holds an abrasive flap wheel via an extension rod. In this paper, only the Delta robot unit of the equipment is addressed, with the angular positions of the C and B axis held fixed during the calibration process.
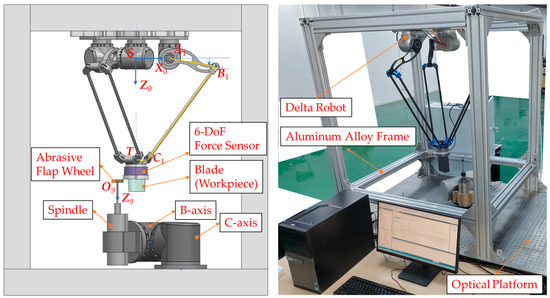
Figure 1.
Five-axis blade grinding equipment based on the Delta robot.
The Delta robot is composed of a stationary platform (base), a moving platform, and three interconnected kinematic chains. This study focuses on the 3-R(RPaR) configuration, illustrated in Figure 2. Each chain connects the base to an active arm via an active revolute joint denoted as Ai (i = 1, 2, 3). The active arm is linked to a parallelogram mechanism, consisting of four revolute joints (Di, Ei, Fi, Gi) and four links, through another passive revolute joint labeled as Bi. The moving platform connects to the parallel mechanism through a passive revolute joint denoted as Ci. The three chains are evenly distributed around the stationary platform, spaced 120° apart, with the Z0 axis defined as the central axis. The origin S of the stationary coordinate system {W0} is at the intersection of the plane containing A1A2A3 with the X0 axis, and Y0 = Z0 × X0. Coordinate systems {Wi,1} and {Wi,2} are established at Ai, fixed to the stationary platform and the active arm, respectively. Zi,1 is oriented along the rotation axis of joint Ai, while Yi,1 is parallel to Z0 but in the opposite direction. Zi,2 is aligned with Zi,1, and Xi,2 is oriented along the vector AiBi. The angle between Xi,2 and Xi,1 is denoted as θi, representing the rotation angle of the active arm. The unit vector of DiEi is denoted as Zi,3, and the unit vector of CiGi is denoted as Zi,4. Zi,4 also serves as the Z-axis in {Wi,4}, fixed to point Ci and the moving platform. The direction of Yi,4 is consistent with Z0. The lengths SAi and TCi represent the radius r1 of the stationary platform and the radius r2 of the moving platform, respectively. lp and ln denote the lengths of active arm AiBi and the vector BiCi, respectively, defining the four basic parameters of the Delta robot. Φ1 = 0°, Φ2 = 120°, and Φ3 = 240° indicate the angles between the three active arm rotation planes and Z0X0 plane for chains 1, 2, and 3, respectively. Under ideal conditions, the moving platform only undergoes translation, maintaining a fixed orientation. A local coordinate system {W5} is established with T as the origin, aligned with {W0}. {W7}, {W8} and {W9} in Figure 2 are, respectively, associated with the C axis, B axis, and the grinding tool, which are not involved in the subsequent sections.
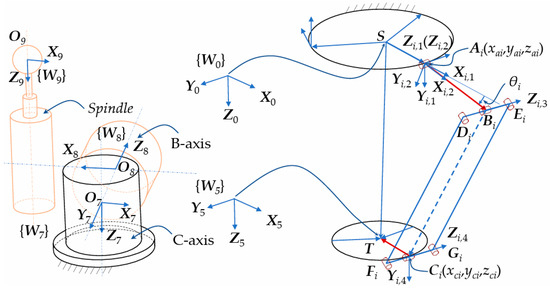
Figure 2.
Coordinate systems of the blade grinding equipment.
T is the center of C1, C2 and C3 and is denoted as 0T (xt, yt, zt) and i,1T(i,1xt, i,1yt, i,1zt) in {W0} and {Wi,1}, respectively. In {Wi,1},
where , , . Substituted into Equation (1),
BiCi always satisfies:
The relationship of T coordinates in {W0} and {Wi,1} can be represented as the following:
where Rot(axis, angle) represents the rotation matrix around axis by angle. The fundamental kinematic equations of the Delta robot are formed by substituting Equation (3) for i = 1,2,3, respectively. Given θ1, θ2, and θ3, if the goal is to determine xt, yt, zt, it constitutes a forward kinematics problem. Conversely, it represents an inverse kinematics problem. By substituting Equation (2) into Equation (3),
Beginning with the inverse kinematics, Equation (5) yields the following:
where , , . Solving Equation (6),
Proceeding to obtain the forward solution, similarly derived from Equation (5),
where , , , , and Δr = r1 − r2. The solutions for xt, yt and zt are obtained through the resolution of quadratic equations, the details of which are omitted here for brevity. In both forward and inverse solutions, the selection among multiple solutions is necessary. The viable solution must adhere to inequality (9).
where the left superscript “0” denotes the vector value in {W0}, and , , , .
In accordance with the principle of virtual work, the virtual work carried out using all non-inertial forces should equal the virtual work carried out using inertial forces. This principle is applied to driving integrated joints:
where Γ represents the motor torque, Γc represents frictional torque, I denotes the moment of inertia of the integrated joints (including active arms), J signifies the Jacobian matrix, FA stands for the inertial force generated by the moving platform mass (me), FG represents the gravitational force acting on me, ΓCM accounts for the gravitational moment produced by the unbalanced mass of the integrated joints (including active arms), δΘ represents virtual displacement, and denotes joint acceleration. Here, it is assumed that the mass of the parallelogram linkage segment is negligible, or it can be separately accounted for at either end of integrated joints or the moving platform.
3. Kinematic Error Modeling for the 3-R(RPaR) Configuration
Geometric errors of the Delta robot unit result in pose deviations of the workpiece mounted on the moving platform during grinding operations. Under error conditions, the relationships between coordinate systems are adjusted. Variables labeled with the right superscript “0” represent their nominal values.
3.1. Transfer Relationships between Coordinate Systems or Points
The orientation and origin of {Wi,1} in {W0} are expressed as Equations (11) and (12), respectively.
where the nominal values of φi, γi, xai, yai, zai are denoted as , , , , , respectively, and , , , , .
The origin of {Wi,2} is the same as that of {Wi,1} and the relative orientation is the following:
where the nominal value of is . is the zero position offset of the active revolute joint i.
The coordinate of Bi in {Wi,2} is as follows:
where the nominal value of the active arm length is .
The relationship between and is as follows:
where Δαi and Δβi are approximate infinitesimal errors, Zi,2 and Zi,3 are approximately parallel under error conditions.
The orientation and origin of {Wi,4} in {W5} are the following:
where the nominal values of , , xci, yci, zci are denoted as , , , , , respectively, and , , , , .
The orientation and origin of {W5} in {W0} are the following:
3.2. The Influence of Parallelogram Mechanism Errors
As shown in Figure 3, in the part of the parallelogram mechanism, the nominal points of Di, Ei, Fi and Gi are denoted as , , and , respectively. The following relations are satisfied: , , , , , , , . In the RPaR configuration, even if there are errors Δlbi and Δlci, it can be assumed that Bi and Ci are located at the midpoint of DiEi and FiGi, respectively. Establishing a coordinate system {Wi,3} with Bi as the origin, where its Z-axis is Zi,3, the X axis is perpendicular to the plane DiEiGiFi and points outward from the paper, denoted as Xi,3, and Yi,3= Zi,3 × Xi,3. The unit vector along BiCi is denoted as , . The angle between and is ξi.
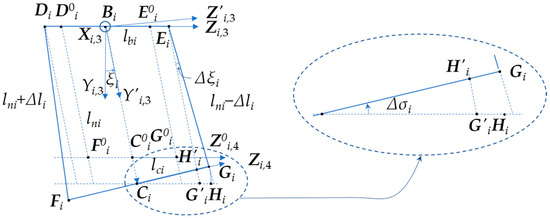
Figure 3.
The errors of parallelogram mechanism within the kinematic chain.
Due to the presence of Δlci and Δli, an angle Δξi exists between EiGi and , and an angle Δσi exists between Zi,4 and Zi,3. In Figure 3, the new point obtained by rotating Gi around Ci by Δσi is denoted as Hi. CiHi has the same direction as Zi,3. lies on the line CiHi, and is parallel to . The intersection point of and FiGi is . In the area enclosed by , assuming errors Δlci, Δσi, Δli, Δξi are small, and , , then
Equation (21) depicts the extension of by the distance Δlci to reach point Hi, followed by the rotation of Hi around Ci by Δσi to reach point Gi on the left side. Conversely, on the right side, it illustrates the shortening of lni by Δli to form segment , followed by the rotation of around Ei by Δξi to reach point Gi. Considering the relationship between and , as well as and , and , , it is derived that,
where Rot(X, ξi) represents the rotation matrix around X axis by ξi. Equations (23) and (24) can be derived along Yi,3 and Zi,3.
Therefore, it can be solved that,
Equation (25) reveals that the deviations Δli of links DiFi and EiGi, and the Δlci of links DiEi and FiGi cause relative pose changes in link FiGi. The value of ξi also affects Δσi when Δli and Δlci remain constant. Notably, lbi and Δσi exhibit an inverse relationship, where larger lbi values mitigate the impact of installation and manufacturing errors on link poses.
Although this analysis focuses on point Gi, a similar approach can be applied to point Fi. Assuming small Δlci, Δσi, Δli, Δξi, Equation (25) still holds. Based on these considerations, the Delta robot necessitates the calibration of 54 parameters (Table 1), all of which can be assumed to have small errors.

Table 1.
Parameters for calibration in Delta robot.
3.3. The Kinematic Equations under Error Conditions
Under error conditions, the kinematic chain of the Delta robot satisfies the following equations:
Equations (26) and (27) can be further expressed as follows:
Expand Equations (28) and (29), and the results can be formally represented as follows:
When the Delta robot with the 3-R(RPaR) configuration satisfies nominal geometric parameters, according to the modified Chebyshev–Grübler–Kutzbach formula [35], the mechanism’s DoF is as follows:
where n is the number of bodies, g is the number of kinematic pairs, fq is the DoF of the qth joint, and κ represents the internal mobilities or idle DoF. ν = νPM + νCJ = 3 + 9 = 12; here, νPM is the number of overconstraints assembling the kinematic chains to a parallel manipulator and νCJ is the number of overconstraints within the complex joints.
In Figure 3, deviations in parameter errors may lead to non-parallelism between FiGi and DiEi. Connecting the three kinematic chains to the moving and stationary platforms alters the overconstraint situation, resulting in a vPM value of 0. Thus, v = νPM + νCJ = 0 + 9 = 9, and M3-R(RPaR) = 0, indicating zero DoF for the Delta robot. Forcefully driving all three active arms induces deformation in the kinematic chains, creating surplus DoF. This paper defines structural deformation in line with the characteristics of the 3-R(RPaR) structure and referencing motion under error in 3-R(2-SS) as the rotation of link FiGi (Figure 3) about the Yi,3 axis passing Ci. To clarify this process, in the planar state depicted in Figure 3, FiGi is redefined as in Figure 4. Upon rotating about the Yi,3 axis by Δηi, the final FiGi is obtained.
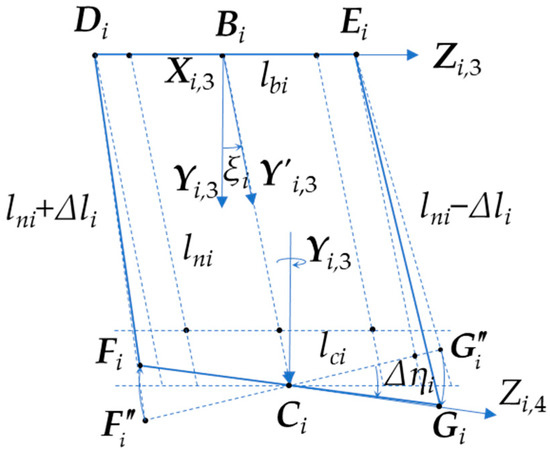
Figure 4.
The structural deformation of the parallelogram mechanism.
The pose relationship described by Equation (21) is redefined as follows:
where Rot(0Yi,3, Δηi) represents the rotation matrix around 0Yi,3 by Δηi and Rot(0Xi,3, Δσi) represents the rotation matrix around 0Xi,3 by Δσi. Both sides of Equation (33) represent unit vectors. Given the small Z-component of these unit vectors in {W0} (attributable solely to errors), this paper formulates equations based on their X and Y components. With three chains (i = 1, 2, 3), Equation (33) yields six independent equations, formally expressed as follows:
Equations (30), (34) and (35) collectively depict the kinematic equations of the Delta robot in the 3-R(RPaR) configuration under error conditions. These equations entail multiple nonlinear terms involving trigonometric functions and higher-order factors, rendering the solution process cumbersome. To streamline these equations, parameters are initially expressed as the sum of nominal values and errors, as presented below:
The right superscript “0” denotes the nominal value of a parameter, while the prefix Δ represents the parameter’s error. For example, and Δxai represent the nominal and error values of xai, respectively. All parameter error values are considered small quantities. Taking φi as an example, the simplification is as follows:
The other angle parameters γi, θi, εi, τi, follow a similar pattern of φi. Additionally, all second-order and higher small quantities are omitted.
Equations (30), (34) and (35) can be expressed in matrix form after simplification as follows:
where , , , , , , , , , , , , , .
Δηi satisfies small quantity assumption. Using to eliminate Δηi, Equations (47) and (48) can be rearranged as:
where , , , .
Equations (46) and (49) constitute the linear kinematic equations of the Delta robot with the 3-R(RPaR) configuration under error conditions.
In theory, utilizing Equations (28) and (33) to derive the partial derivatives of xt, yt, zt, as well as α5, β5 and γ5 with respect to each error component, yields a similar error model to Equation (50) containing the Jacobian matrix. However, since xt, yt, zt and α5, β5, γ5 are implicit in Equations (28) and (33), the solving process becomes relatively complex. This paper adopts the assumption of small errors and follows the principles of small quantity operations for a more intuitive process. Given that the error values of xt, yt, zt and α5, β5, γ5 consist of various error components and are relatively large, for enhanced accuracy, the relevant elements in matrices Fp and Go remain expressed as functions of xt, yt, zt and α5, β5, γ5, rather than their corresponding linear error terms.
4. The Identification of Parameter Errors
4.1. Parameter Error Identifiability
Parameter identifiability comprises two primary aspects: the linear correlation between parameters, potentially impeding accurate individual parameter identification, and parameter sensitivity, indicating the relative impact of parameter errors on overall error. Traditional methods often struggle to effectively address both concerns, resulting in complex analyses. This study employs a simplified approach, the workspace random points + SVD method, to address these challenges. By selecting n random points within the Delta robot’s workspace, their actual poses are computed using Equation (50).
In Equation (25), ; if Δlbi is regarded as a first-order small quantity, it will be absorbed in calculations. Consequently, this study overlooks the impact of Δlbi and does not account for it. In Equation (50), the component Δlbi in the parameter error vector v is consistently treated as zero. To streamline the analysis, Δlb1, Δlb2 and Δlb3 are omitted from v. Utilizing Equation (50), an equation set is formulated at each point, yielding the following:
where M is the Linear Model Coefficient Matrix (LMCM). Since Δlbi is excluded from v, M has a size of 6n × 51, and the bias b has a size of 6n × 1. Performing SVD on matrix M, Equation (51) can be rewritten as follows:
where U and W represent orthogonal matrices of size 6n × 6n and 51 × 51, respectively. ui and wi (for i = 1, …, 51) denote the row vectors of U and W, respectively. Σ is a 6n × 51 matrix, with the first 51 rows forming a diagonal matrix consisting of the singular values of M arranged in descending order. The remaining rows of Σ are all zeros. To examine the influence of singular values on the parameter solution, Equation (52) can be expressed in terms of ui and wi:
The structure of Equation (53) indicates that the smaller is, the lower the impact on the parameter solution. The magnitude of is represented by a vector norm, and
In Equation (54), it is evident that the magnitude of the term depends on the size of λi when v is given or held constant. When λi is sufficiently small, can be disregarded in Equation (53). Higher-order small terms are neglected during the derivation of Equation (50) due to the assumption of small errors. Therefore, the accuracy of equations built upon Equation (50) does not surpass the order of . By comparison with in Equation (54), the following criterion can be deduced:
When λi satisfies Equation (55), the corresponding parameter becomes unidentifiable. The relationship between λi and the parameters will be illustrated through examples in the simulation section.
The linearity correlation of parameters can be analyzed from the coefficients of the error parameters. For example, in Equation (46), the coefficient of Δxai is as follows:
The coefficient fi,15 can be derived as well, but due to its lengthy equation, it is not listed here. Without assuming α5, β5, γ5 as small quantities, there exists no fixed linear relationship between fi,1 and fi,15. However, by assuming α5, β5, γ5 as small quantities and sin() = 0, cos() = 1, then
Similarly, the coefficients corresponding to Δyai and Δyci, as well as Δzai and Δzci, exhibit the same relationship. Given these linear relationships, Δxai, Δyai and Δzai can directly replace Δxai − Δxci, Δyai − Δyci, and Δzai − Δzci. This simplifies the dimensionality of v. Analyzing or determining linear relationships between parameters directly from lengthy coefficient expressions is often challenging. In the simulation section, these linear relationships will be illustrated graphically with examples.
4.2. Measurement Surface Optimization
This paper assumes that the pose error of the moving platform can be determined through measuring the surface form error of the machined workpiece, termed as the measurement surface. Assuming a fixed form of point acquisition on this surface, its shape directly influences the error parameter identification process. This section aims to identify the optimal measurement surface to enhance the identification process.
First, the measurement surface is parameterized. The coordinate system of the measurement surface is defined as {W6}, with {W6} being fixed relative to {W5}. The origin of {W6} is offset along the Z axis of {W5} by a distance of Hq, with the axes of {W6} parallel and opposite to those of {W5}, respectively. Hq is the height of the measurement surface. Within {W6}, the measurement surface Q(s, t) is defined. This surface can be extended periodically in both the s and t directions within a finite region, creating an infinitely free-from surface. Alternatively, Q(s, t) can be viewed as a single-period surface on an infinitely periodic surface.
where Qr(s) and Qh(t) are both single-period functions, constructed using multiplication to form the Q(s, t) surface. This construction method guarantees that any iso-parameter curve, such as Q(s0, t) = Qr(s0)Qh(t) or Q(s, t0) = Qr(s)Qh(t0), remains periodic.
According to the Fourier series expansion theorem, Qr(s) and Qh(t) can be further represented as follows:
The Fourier series is an infinite sum of trigonometric functions, with high-frequency terms typically having a minimal impact on function values. Here, both m and n are set to 3, a sufficient choice for engineering purposes. Additionally, to capture the symmetry of the three kinematic chains in the XY plane of {W5}, coefficients relative to s are represented in a 3m form. Consequently, the workpiece’s cross-sectional lines in the XY plane of {W5} consist of three identical periodic curves, each spanning 120°.
Subsequently, the optimization problem formulation is established, with Equation (50) serving as the core of parameter identification. At multiple measurement points, an over-constrained equation set can be derived from Equation (50), as detailed in Equation (54) in Section 4.1. The quality of solving Equation (51) is most aptly reflected in the condition number of M. Hence, the optimization problem in this paper is defined as follows:
where , , and cond(M) denotes the condition number of M in Equation (51). Rq denotes the maximum radius of the measurement surface in the X5Y5 plane. Rq must be smaller than the maximum radius Rwmax of the cylindrical workspace of the Delta robot. Simultaneously, Rq should not be excessively small, as this could compromise the strength of the workpiece, leading to fractures, or result in deep grooves that are challenging to measure. The lower limit of Rq is set to Rwmin. The height Hq of the measurement surface is equal to the maximum height Hwmax of the robot cylindrical workspace by replacing t in Equation (60) with .
The process of measurement surface optimization and parameter identification is shown in Figure 5. Specific implementation details are described in Section 5. The “triangle” in the upper left corner indicates the start, and the “circle” in the lower right corner indicates the end.
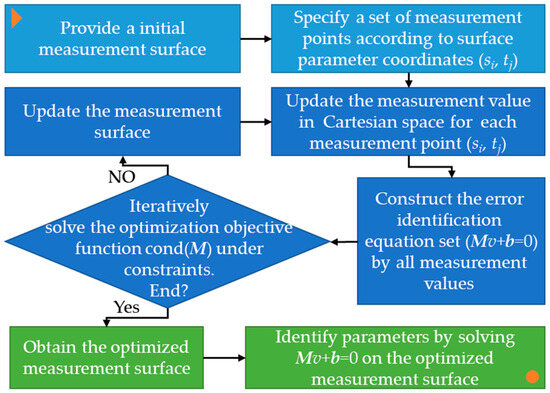
Figure 5.
The process of measurement surface optimization and parameter identification.
5. Simulation
This section validates the proposed kinematic calibration method for the Delta robot with 3-R(RPaR) configuration through computational cases. Initially, nominal geometric parameters are specified: r1 = 0.127 m, r2 = 0.046 m, lp = 0.22751 m, ln = 0.55361 m, and = 0.1 m. Eliminating Δlbi, the other 51-dimensional (or positional) error terms are set to 1 × 10⁻⁴ m, and angular (or orientation) error terms are set to 0.01° (1.745 × 10⁻⁴ rad). For instance, Δxai = 1 × 10⁻⁴ m and Δθi = 0.01°.
1. Verification of parameter identifiability. A total of 50 points are randomly selected in the Delta robot’s workspace, as detailed in Section 4.1 with n = 50. Figure 6 illustrates the singular values of the LMCM M from Equation (51), plotted in descending order on a log10 scale. The singular values of M form three distinct tiers, labeled I, II, and III, with magnitudes of approximately 100, 10−7, and 10−15, respectively. Given that position and angle errors are on the order of 10−4, the magnitude of is also 10−4. According to inequality (55), parameters can be ignored when λi < 10−4. Therefore, parameters corresponding to tiers other than tier I will be ignored. The lowest point in tier I corresponds to the singular value λ24.
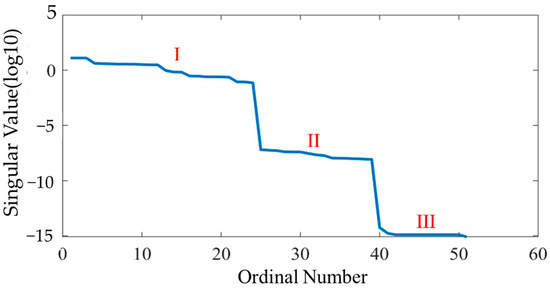
Figure 6.
Singular values of the LMCM M (Tier I: 100, Tier II: 10-7, Tier III: 10-15).
Rewriting Equation (52) yields the following:
where v denotes the 51-component error vector excluding Δlb1, Δlb2, and Δlb3. Figure 7 displays a scatter plot of the components of the column vectors wi, with each color corresponding to the same i value. The jth component of wi also serves as the coefficient for the jth error component of v. The horizontal axis in Figure 7 represents each of the 17 error components in each chain, ordered as chains 1, 2, and 3. Notably, the component values in wi have been preprocessed based on the error scale; specifically, if the absolute value of a component in wi is less than 10−4, it is set to zero.
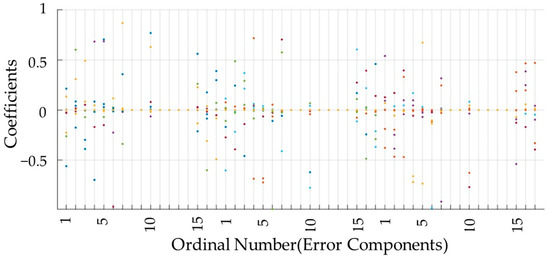
Figure 7.
Coefficient distribution of error components.
From Figure 7, it is evident that the coefficients corresponding to components 8, 9, 11, 12, 13, and 14 in the error vectors within each chain consistently evaluate to zero. Consequently, these parameters are deemed unidentifiable. Furthermore, the coefficients of components 1, 2, and 3 within each chain exhibit sign symmetry in relation to the coefficients of components 15, 16, and 17, respectively. This indicates that either the error components 1, 2, and 3, or the error components 15, 16, and 17, cannot be individually discerned. What can be discerned are vci(1)–vci(15), vci(2)–vci(16), and vci(3)–vci(17), where vci(j) represents the jth component of the vci vector. In subsequent optimization, vci(1), vci(2) and vci(3) will be utilized to denote vci(1)–vci(15), vci(2)–vci(16), and vci(3)–vci(17), respectively. The remaining identifiable parameters for each chain are as follows:
2. Determining the optimal measurement surface. The cylindrical workspace of the Delta robot is characterized by a maximum radius Rwmax = 0.265 m, a given minimum radius Rwmin = 0.100 m, and a height Hwm = 0.2 m, with its zero point in {W0} along the Z axis positioned at Zhome = 0.3795 m. When evaluating in Problem (61), the surface coefficients in Equations (59) and (60) are considered given, and a point acquisition method on the surface needs to be specified. Here, , , and s and t are uniformly divided into 36 and 12 parts, respectively, generating a grid of points. Since the s direction forms a closed curve, it is iterated from i = 0 to 35 and j = 0 to 12, yielding a total of 36 × 13 non-repeating grid points in space. While more points theoretically enhance the accuracy of the grid, an excessive number would escalate measurement and computation times. In this study, the choice of points is balanced; even for trigonometric components with m, and n = 3 in Equations (59) and (60), a minimum of four sampling points per cycle is ensured.
This paper employs a hybrid solving algorithm that combines the Hook–Jeeves Direct Search Algorithm (DSA) with the Inner Point Method (IPM) for the optimization problem outlined in Problem (61). Initially, the constrained optimization problem is converted into an unconstrained one through the application of the interior point method. Here, the constraints refer to “<” and “>” constraints, while equality constraints can be ensured through the definition of the measurement surface. The augmented objective function needed for the interior point method is formulated as follows:
where τ > 0 is the penalty factor.
The essence of the interior point method is to transform a constrained optimization problem into a sequence of unconstrained optimization problems , where , as shown in “IPM” part of Figure 8. In the simulation process, ρ = 0.5, τ0 = 1. The barrier function is defined as follows:
where Rq is achieved by separately solving the maximum value of and , i.e., . As k increases, will gradually decrease. The termination criterion for the iterative process is . In simulation process, .
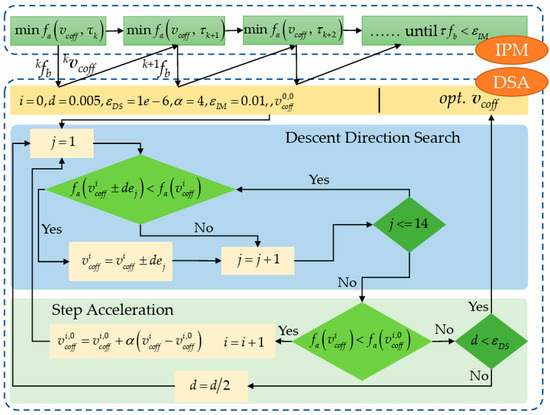
Figure 8.
IPM + DSA hybrid optimization algorithm.
Each undergoes optimization using the Hook–Jeeves DSA to determine the minimum value. While DSAs may not converge as rapidly as derivative-based methods like gradient descent or Newton’s method, the latter are susceptible to local optima. The DSA, being derivative-free, offers global optimality and requires fewer parameters than heuristic algorithms, making it well-suited for engineering applications. The Hook–Jeeves algorithm comprises two key components: Descent Direction Search (DDS) and Step Acceleration (SA), depicted in the “DSA” section of Figure 8. In DDS, the search progresses along the positive and negative directions of each unit component ej of the vcoff vector sequentially, with a step size of d. The initial value of vcoff is denoted as . Upon identifying a direction of function reduction, the SA phase is initiated. During SA, the step length is accelerated using the acceleration factor to update vcoff and commence a new cycle of DDS. In the simulation process, α= 4. If a direction of function reduction is not detected, d = d/2, and DDS continues. The termination criterion for the Hook–Jeeves DSA is d < εDS. In simulations, the initial value of d is set to 0.005, with εDS = 10−6.
Figure 9 illustrates the iterative convergence process of the augmented objective function. The horizontal axis represents the number of iterations of the Hook–Jeeves DSA, which is the ordinal of the sequence minfa(vcoff, τk). The convergence process is very rapid, with the augmented objective function entering a bottom plateau phase after approximately five iterations. The value of the augmented objective function decreases from 1239.6853 to 236.8953, a decrease of more than five times. Figure 10a and 10b, respectively, depict the iterative convergence process of the surface coefficients as0, as1, as3, bs1, bs2, bs3 and at0, at1, at2, at3, bt1, bt2, bt3 with the same horizontal axis as Figure 9. From Figure 10, it can be observed that the amplitudes of as0 and bs0 are significantly larger compared to other trigonometric coefficients, and their initial values change noticeably during the initial iterations.
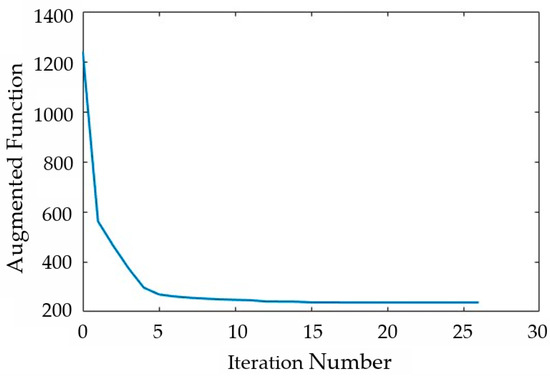
Figure 9.
Iterative convergence of augmented function.
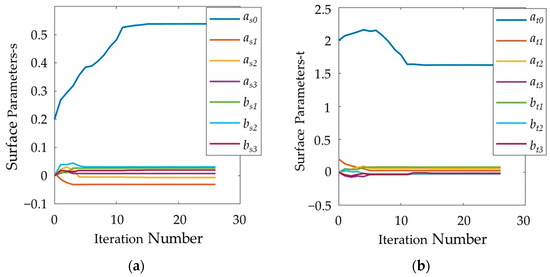
Figure 10.
Iterative convergence of surface parameters. (a): Qr(s). (b): Qh(t).
Figure 11 depicts the optimized surface profile. In the 3D representation shown in Figure 11a, the surface demonstrates pronounced periodicity along both the s and t directions. Moreover, the surface’s position and height in the Z direction align with the specified values. As illustrated in Figure 11b, the optimized surface profile adheres to the “<” and “>” constraints outlined in Problem (60), with both constraint boundaries being attained.
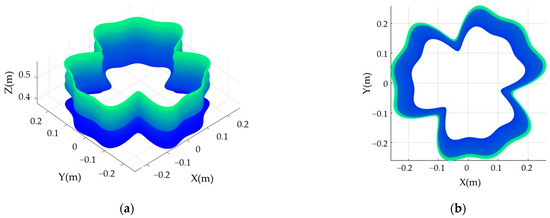
Figure 11.
The optimized surface profile. (a): 3D view. (b): XY-plane view.
Table 2 presents the conditions used in the optimization process, the values of the surface coefficients before and after optimization, and the values of the augmented objective function before and after optimization.

Table 2.
The optimized result for measurement surface.
3. Identify the parameter errors. Firstly, simulation error data are generated for the measurement surface. Assuming a uniform error distribution, Δlbi, Δxci, Δyci and Δzci are set to zero, and the remaining 42 positional and angular errors are set to 1 × 10⁻⁴ m and 0.01°, respectively. These errors are then added to the nominal parameter values accordingly. Utilizing the actual parameter values, the pose vectors for the points Q(si, tj) on the measurement surface are computed directly by Equations (30), (34), and (35), without introducing linearization errors. This method ensures a more precise assessment of the comprehensive error magnitude. Additionally, besides acquiring the pose components of the moving platform control point T, the non-planar deformation angles for the three parallelogram mechanisms are also calculated. Notably, in the linearized Equation (50), , and have been eliminated as intermediate variables.
Subsequently, parameter identification is performed based on the simulated error data. By employing the linearized Equation (51) and the identifiable error vector in Equation (63), a set of linear over-constrained equations is established. The identifiable error components in Equation (63) are then resolved using the least squares method, and the outcomes are presented in Table 3. In Table 3, “GV” denotes the error values provided during the construction of the simulation data, “CV” represents the error components computed based on Equations (51) and (63), and “Error” indicates the relative deviation between the two. Notably, Table 3 illustrates that the maximum absolute relative deviation is 0.9%, thereby affirming the efficacy of the proposed method for parameter error identification. This also corroborates the parameter identifiability judgment. Furthermore, it suggests that the error components not listed in Table 3 have a negligible impact on the overall error.

Table 3.
The calibration results of Delta robot’s geometric parameter errors.
In Ref. [12], Table 3 presented the simulation results of kinematic parameter identification for a Delta robot. It showed that the accuracy of the identification results varied with different spatial distributions of measurement points, with Set 1 achieving the best accuracy. The maximum deviation between the identified and given errors in Ref. [12] is 1.6%, which is larger than 0.9%. In our research, the measurement surface or the distribution of measurement points is optimized, allowing the algorithm to determine a unique set of measurement points.
To verify the parameter identification performance of the algorithm under error conditions, random errors of ±5% ΔTi,jare added to the pose error vector ΔTi,j, and the error components are recalculated. Table 4 presents a typical result of parameter identification under random measurement errors. The maximum identification error in the identification results is −10.36%. Although this is considerably larger than the results in Table 3, it is still sufficient for engineering applications.

Table 4.
Parameter error calibration results with random measurement noises.
6. Experiments
The dynamic calibration method is validated by experiments. The nominal geometric parameters are specified: r1 = 0.065 m, r2 = 0.035 m, lp = 0.1042 m, ln = 0.1650 m. The motor used has a rated current of 3.47 A, a torque constant of 25.9 mNm/A, a no-load speed of 8810 rpm at 24 V voltage, and a reduction ratio of 12. In contrast to the top-mounted configuration illustrated in Figure 1, in the experiment, the Delta robot is laterally installed, and a preloaded spring in the upper kinematic chain compensates for the torque of the integrated joint. The spring torque is defined as follows:
where ks and τs0 are the proportional coefficient and initial torque of the spring, respectively. During the grinding task, the robot usually follows a smooth and slow curve with very small acceleration and deceleration. Therefore, the parameters in the simplified dynamic model in this paper mainly include friction and mass, and the inertia parameters closely related to acceleration are not reflected, i.e., , JTFA, and ΓCM are negligible. Consequently, these three factors will be disregarded in the identification process. Additionally, accounting for the frictional forces of integrated joints, the motor torque Γ will be adjusted to incorporate the effect of the frictional torque Γc. The Coulomb model is employed as the friction model,
where Γc = [τc1, τc2, τc3]T. Therefore, the dynamic equation can be re-defined as follows:
The excitation trajectory adopts a uniform synchronous curve in joint space, i.e., θ1(t) = θ2(t) = θ3(t) = vt + θmin, where v is the moving speed, with a motion range of θmin = −32° and θmax = 72°. A suitable velocity, such as 5°/s, is selected. Under the servo driver’s CSP mode, the system moves from the starting point to the ending point at a constant speed. The joint angle is obtained through the encoder at the rear of the motor, and the torque is acquired by reading the motor’s current value and combining it with the torque constant and reduction ratio. Both the encoder values and current values are read in real-time at a 1 ms cycle from the corresponding variables inside the driver using the TwinCAT software (v3.1.4024.11). The same procedure is repeated from the ending point back to the starting point. The joint angle is obtained through the encoder at the rear of the motor, and the torque is acquired by reading the motor’s current value and combining it with the torque constant and reduction ratio. Both the encoder values and current values are read in real-time at a 1 ms cycle from the corresponding variables inside the driver using the TwinCAT software.
This simple curve form can fully meet the identification needs of the dynamic model in this paper. Additionally, this curve can be implemented at the early stage of robot controller development, without requiring interpolation in Cartesian space or worrying whether the T point after synthesizing the three joint motions always remains within the robot workspace.
Figure 12 display the raw torque-angle data and the data after applying moving average filtering for positive and negative movements. Based on the filtered data, nonlinear least squares fitting was conducted to obtain the calibration results of the dynamic parameters, as shown in Table 5. Figure 12 also depicts the model prediction curves based on the identified dynamic parameters. The torque RMSEs between the filtered data and model-predicted data for the three joints are 14.5529 mNm, 26.2232 mNm, and 31.7745 mNm, which are approximately 1.42%, 2.55%, and 3.09% of the joints’ rated torques, respectively. Apart from slightly larger deviations at the beginning and end, the prediction curves fit the actual curves very well in most regions.
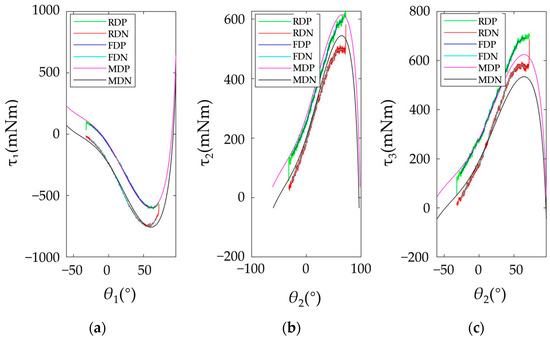
Figure 12.
The curves of joint torque vs. joint position, RDP: raw data for positive movement, RDN: raw data for negative movement, FDP: filtered data for positive movement, FDN: filtered data for negative movement, MDP: model prediction data for positive movement, MDN: model prediction data for negative movement. (a): For joint 1. (b): For joint 2. (c): For joint 3.

Table 5.
Dynamic parameter calibration results.
In Ref. [28], Table 6 provided the simulation results of RMSE between the given torques and the predicted torques of the identified model for a Delta robot. Ref. [28] did not provide the rated torques of robot joints. To compare with the results in our research, it is assumed that the maximum output torque in Ref. [28] is 0.7 times the rated torque, making it consistent with the situation our research. Additionally, the units in Ref. [28] are converted to mNm. First, looking at the offline parameter identification results in Table 6 of Ref. [28], the RMSE was 632.7 mNm, which is 4.4% of the rated torque. The identification process in our paper is also offline, and the maximum RMSE between the model-predicted torque and the actual torque is 3.09% of the rated torque, which is better than the offline identification results in Ref. [28]. Additionally, Ref. [28] provides online identification results, with the corresponding torque RMSE being 31.5 mNm, or 0.22% of the rated torque. It is worth noting that the results in Table 6 of Ref. [28] are simulation results, while our research provides experimental results. The results in our research include data noise and other unknown factors.
7. Conclusions
This paper focused on the calibration of kinematic errors and dynamic parameters for Delta robots driven by integrated joints with 3-R(RPaR) configuration in machining tasks, including position errors and frictions of integrated joints.
The influence of parallelogram mechanism dimension errors was analyzed based on the vector loop method for the 3-R(RPaR) configuration. The modeling of the in-plane deviation angle of the connecting platform link was conducted. This paper also defined the spatial deformation angle of the parallelogram mechanism constrained by the robot’s DoF, ultimately forming a 54-parameter kinematic error model and its corresponding linearized model.
By employing the SVD of LMCM, this paper established criteria for the identifiability of error component combinations based on the inequality between the singular value and the error vector norm. A measurement surface with Fourier series form containing 14 coefficients was conducted. The condition number of LMCM derived from the measurement surface was defined as the optimization objective. A hybrid algorithm that combines the Hook–Jeeves DSA with IPM was successfully applied to solve the optimal measurement surface under constraints.
The friction coefficients of integrated joints and other dynamic parameters were obtained by fitting the joint torque-angle pairs measured along specific trajectories using nonlinear least squares regression.
The simulation and experiment results validated the proposed kinematic and dynamic calibration methods, providing a foundation for precise control of integrated joints and high-precision motion of robots.
Based on the actual conditions of the grinding process, this study assumed that the motion process is always smooth and uniform, and based on this, the simplified dynamic model was established. If the motion behavior of the robot during the grinding process differs significantly from the assumption, the simplified model proposed in this paper will no longer be applicable, and the calibration accuracy will also be affected.
Our next step is to implement force–position hybrid control during the grinding process, examine the quality of the actual machined surface, and further optimize the dynamic performance through online optimization.
Author Contributions
Conceptualization, Z.J. and T.S.; methodology, Z.J.; software, Y.W.; writing—original draft, Y.W. and D.L.; writing—review and editing, Z.J. All authors will be informed about each step of manuscript processing including submission, revision, revision reminder, etc. via emails from our system or assigned Assistant Editor. All authors have read and agreed to the published version of the manuscript.
Funding
This research was funded by National Natural Science Foundation of China, grant number 52105510, Shanghai Science and Technology Innovation Action Plan (High-tech Field Project), grant number 22511102102, Shanghai Science and Technology Planning Project, grant number 20DZ2251400.
Data Availability Statement
The datasets used and/or analyzed during the current study are available from the corresponding author on reasonable request.
Conflicts of Interest
The authors declare no conflicts of interest.
References
- Li, Y.; Huang, T.; Chetwynd, D.G. An approach for smooth trajectory planning of high-speed pick-and-place parallel robots using quintic B-splines. Mech. Mach. Theory 2018, 126, 479–490. [Google Scholar] [CrossRef]
- Moustris, G.P.; Tzafestas, C.S. Modelling and analysis of a parallel double delta mechanism for robotic surgery. In Proceedings of the 2022 30th Mediterranean Conference on Control and Automation (MED), Vouliagmeni, Greece, 28 June–1 July 2022; pp. 861–866. [Google Scholar]
- Chen, J.; San, H. Workspace analysis for a five degrees of freedom hybrid engraving plotter. J. Eng. 2019, 13, 278–283. [Google Scholar] [CrossRef]
- Kelaiaia, R. Improving the pose accuracy of the Delta robot in machining operations. Int. J. Adv. Manuf. Technol. 2017, 91, 2205–2215. [Google Scholar] [CrossRef]
- Ma, J.; Shen, Y.; Zhang, S.; Yan, H.; Jia, Z. A New error compensation method for Delta robots combining geometric error modeling with spatial interpolating. J. Mech. Robot. 2024, 16, 051012. [Google Scholar] [CrossRef]
- Bentaleb, T.; Iqbal, J. On the improvement of calibration accuracy of parallel robots–modeling and optimization. Theor. Appl. Mech. Lett. 2020, 58, 261–272. [Google Scholar] [CrossRef]
- Denavit, J.; Hartenberg, R.S. A kinematic notation for lower pair mechanisms based on matrices. J. Appl. Mech. 1995, 77, 215–221. [Google Scholar] [CrossRef]
- Okamura, K.; Park, F.C. Kinematic calibration using the product of exponentials formula. Robotica 1996, 14, 415–421. [Google Scholar] [CrossRef]
- Ottaviano, E.; Gosselin, C.M.; Ceccarelli, M. Singularity analysis of CaPaMan: A three-degree of freedom spatial parallel manipulator. In Proceedings of the 2001 ICRA. IEEE International Conference on Robotics and Automation (Cat. No. 01CH37164), Seoul, Republic of Korea, 21–26 May 2001; pp. 1295–1300. [Google Scholar]
- Vischer, P.; Clavel, R. Kinematic calibration of the parallel Delta robot. Robotica 1998, 16, 207–218. [Google Scholar] [CrossRef]
- Li, Y.; Shang, D.; Liu, Y. Kinematic modeling and error analysis of Delta robot considering parallelism error. INT J. Adv. Robot. Syst. 2019, 16, 1729881419878927. [Google Scholar] [CrossRef]
- Shen, H.; Meng, Q.; Li, J.; Deng, J.; Wu, G. Kinematic sensitivity, parameter identification and calibration of a non-fully symmetric parallel Delta robot. Mech. Mach. Theory 2021, 161, 104311. [Google Scholar] [CrossRef]
- Tian, W.; Huo, M.; Zhang, X.; Song, Y.; Wang, L. A general approach for robot pose error compensation based on an equivalent joint motion error model. Measurement 2022, 203, 111952. [Google Scholar] [CrossRef]
- Shi, J.; Yu, C.; Li, Z. Kinematic model identification of planar delta manipulator using Random Levenberg-Marquardt algorithm. In Proceedings of the 2011 9th World Congress on Intelligent Control and Automation, Taipei, Taiwan, 21–25 June 2011; pp. 1097–1102. [Google Scholar]
- Caro, S.; Binaud, N.; Wenger, P. Sensitivity analysis of 3-RPR planar parallel manipulators. J. Mech. Des. 2009, 131, 121005. [Google Scholar] [CrossRef]
- Wang, L.; Li, M.; Yu, G. A Novel Sensitivity Analysis Method for Geometric Errors of a Parallel Spindle Head. In Proceedings of the International Conference on Intelligent Robotics and Applications, Hangzhou, China, 5–7 July 2023; pp. 202–211. [Google Scholar]
- Kim, H.S.; Choi, Y.J. The kinematic error bound analysis of the Stewart platform. J. Robot. Syst. 2000, 17, 63–73. [Google Scholar] [CrossRef]
- Tannous, M.; Caro, S.; Goldsztejn, A. Sensitivity analysis of parallel manipulators using an interval linearization method. Mech. Mach. Theory 2014, 71, 93–114. [Google Scholar] [CrossRef]
- Swevers, J.; Ganseman, C.; Tukel, D.B.; De Schutter, J.; Van Brussel, H. Optimal robot excitation and identification. IEEE Trans. Robot. Autom. 1997, 13, 730–740. [Google Scholar] [CrossRef]
- Park, K.J. Fourier-based optimal excitation trajectories for the dynamic identification of robots. Robotica 2006, 24, 625–633. [Google Scholar] [CrossRef]
- Bingül, Z.; Karahan, O. Dynamic identification of Staubli RX-60 robot using PSO and LS methods. Expert Syst. Appl. 2011, 38, 4136–4149. [Google Scholar] [CrossRef]
- Grotjahn, M.; Heimann, B.; Abdellatif, H. Identification of friction and rigid-body dynamics of parallel kinematic structures for model-based control. Multibody Syst. Dyn. 2004, 11, 273–294. [Google Scholar] [CrossRef]
- Han, Y.; Wu, J.; Liu, C.; Xiong, Z. An iterative approach for accurate dynamic model identification of industrial robots. IEEE Trans. Robot. 2020, 36, 1577–1594. [Google Scholar] [CrossRef]
- Dong, J.; Xu, J.; Zhou, Q.; Zhu, J.; Yu, L. Dynamic identification of industrial robot based on nonlinear friction model and LS-SOS algorithm. IEEE Trans. Instrum. Meas. 2021, 70, 1–12. [Google Scholar] [CrossRef]
- Song, S.; Dai, X.; Huang, Z.; Gong, D. Load parameter identification for parallel robot manipulator based on extended Kalman filter. Complexity 2020, 2020, 8816374. [Google Scholar] [CrossRef]
- Ohno, M.; Takeda, Y. Design of target trajectories for the detection of joint clearances in parallel robot based on the actuation torque measurement. Mech. Mach. Theory 2021, 155, 104081. [Google Scholar] [CrossRef]
- Diaz-Rodriguez, M.; Valera, A.; Mata, V.; Valles, M. Model-based control of a 3-DOF parallel robot based on identified relevant parameters. IEEE-ASME Trans. Mechatron. 2012, 18, 1737–1744. [Google Scholar] [CrossRef]
- Abed Azad, F.; Ansari Rad, S.; Hairi Yazdi, M.R.; Tale Masouleh, M.; Kalhor, A. Dynamics analysis, offline–online tuning and identification of base inertia parameters for the 3-DOF Delta parallel robot under insufficient excitations. Meccanica 2022, 57, 473–506. [Google Scholar] [CrossRef]
- Liu, Y.; Xi, N. Low-cost and automated calibration method for joint offset of industrial robot using single-point constraint. Ind. Robot. 2011, 38, 577–584. [Google Scholar] [CrossRef]
- Li, M.; Wang, L.; Yu, G.; Li, W. A new calibration method for hybrid machine tools using virtual tool center point position constraint. Measurement 2021, 181, 109582. [Google Scholar] [CrossRef]
- Bai, P.; Mei, J.; Huang, T.; Chetwynd, D.G. Kinematic calibration of Delta robot using distance measurements. Proc. Inst. Mech. Eng. Part C J. Mech. Eng. Sci. 2016, 230, 414–424. [Google Scholar] [CrossRef]
- Li, M.; Wang, L.; Yu, G.; Li, W.; Kong, X. A multiple test arbors-based calibration method for a hybrid machine tool. Robot. Cim-Int. Manuf. 2023, 80, 102480. [Google Scholar] [CrossRef]
- Xiao, B.; Alamdar, A.; Song, K.; Ebrahimi, A.; Gehlbach, P.; Taylor, R.H.; Iordachita, I. Delta robot kinematic calibration for precise robot-assisted retinal surgery. In Proceedings of the 2022 International Symposium on Medical Robotics (ISMR), Atlanta, GA, USA, 13–15 April 2022; pp. 1–7. [Google Scholar]
- Daney, D.; Papegay, Y.; Madeline, B. Choosing measurement poses for robot calibration with the local convergence method and Tabu search. Int. J. Robot. Res. 2005, 24, 501–518. [Google Scholar] [CrossRef]
- Brinker, J.; Corves, B.; Takeda, Y. Kinematic performance evaluation of high-speed Delta parallel robots based on motion/force transmission indices. Mech. Mach. Theory 2018, 125, 111–125. [Google Scholar] [CrossRef]
Disclaimer/Publisher’s Note: The statements, opinions and data contained in all publications are solely those of the individual author(s) and contributor(s) and not of MDPI and/or the editor(s). MDPI and/or the editor(s) disclaim responsibility for any injury to people or property resulting from any ideas, methods, instructions or products referred to in the content. |
© 2024 by the authors. Licensee MDPI, Basel, Switzerland. This article is an open access article distributed under the terms and conditions of the Creative Commons Attribution (CC BY) license (https://creativecommons.org/licenses/by/4.0/).