Article

Analysis of Parameter Matching on the Steady-State Characteristics of Permanent Magnet-Assisted Synchronous Reluctance Motors under Vector Control

1
College of Electrical Engineering, Zhejiang University, Hangzhou 310027, China
2
Jiang Chao Motor Technology Co., Ltd., Huzhou 313014, China
3
National Engineering Research Center for REPM Electrical Machines, Shenyang University of Technology Shenyang, Shenyang 110870, China
*
Author to whom correspondence should be addressed.
Actuators 2024, 13(6), 198; https://doi.org/10.3390/act13060198
Submission received: 28 April 2024 / Revised: 18 May 2024 / Accepted: 21 May 2024 / Published: 22 May 2024
(This article belongs to the Special Issue Power Electronics and Actuators)

Abstract

:
In this paper, the impact of parameter matching on the steady-state performance of permanent magnet-assisted synchronous reluctance motors (PMaSynRM) under vector control is analyzed and discussed. First, based on the mathematical model of motors under the maximum torque per ampere (MTPA) control strategy, an analysis is conducted concerning two main parameters, i.e., the matching relationship between the back electromotive force (back-EMF) and the saliency ratio. The impact of these two parameters on the operational status of the motor is investigated. Then, the motor’s voltage operating conditions are examined, and the operating curve under minimum voltage is derived. Furthermore, in the overvoltage region under the MTPA control strategy, the operation of the motor under the maximum torque per voltage (MTPV) control strategy is explored. This analysis illuminated the patterns of influence exerted by the back-EMF and the saliency ratio on the motor’s voltage operating condition. Between these two control strategies, there remains scope for the motor to operate at its limits. An enhanced understanding of the effects of the back-EMF and saliency ratio within this range on motor performance was achieved, resulting in the optimal matching curve for the back-EMF and saliency ratio. Finally, a 45 kW PMaSynRM was designed, prototyped, and tested to validate the correctness of the design techniques, with the motor achieving IE5 efficiency.

1. Introduction

The permanent magnet synchronous motor (PMSM) is known for its high efficiency and high power density [1,2], with its drawback lies in its high cost. Therefore, there is increasing attention on high-efficiency motor technologies with fewer or no rare-earth materials [3]. The permanent magnet-assisted synchronous reluctance motor (PMaSynRM) embeds neodymium-iron-boron (NdFeB) or ferrite magnets in its rotor magnetic barriers [4], with the main portion of the output torque being reluctance torque [5,6]. The added small number of permanent magnets primarily serves to improve the motor power factor [7,8]. Its good performance and relatively low cost [9,10] make it one of the potential alternatives comparable to PMSM. The rotor structure of PMaSynRM is complex [11,12], and the parameter matching is rich and diverse [13], which has prompted extensive research by many scholars.
Researchers from Zhejiang University conducted comparative studies on SynRM, IPMSM, and PMaSynRM motors [14]. The constant losses among these three types of motors are similar. The interior PMSM has the lowest copper loss, while SynRM has the highest; PMaSynRM’s copper loss is intermediate, mainly due to differences in power factor and current. A study on the design of the saliency ratio of PMaSynRM indicated that the motor’s saliency ratio should be designed above 2.73. Through optimization, the designed 5 kW motor can achieve an efficiency of 90.46% and a power factor of 0.73 [15]. Another research focused on a hybrid NdFeB and ferrite synchronous reluctance motor structure, optimizing a 28 kW prototype that achieved an efficiency of 93.42% at rated conditions, with a cost reduction of about 42 dollar compared to permanent magnet motors, although its peak torque is reduced [16]. Further studies investigated a hybrid permanent magnet assisted rotor structure, utilizing a multislot stator and a three-layer barrier rotor, with the first layer using NdFeB and the second and third layers using ferrite [17]. Its torque output and current are comparable to those of PMaSynRMs, with a high-efficiency zone close to that of PMSMs. However, the increase in types of motor materials leads to higher procurement management and production costs. Another research introduced a top-level optimization design concept for PMaSynRMs, where a 7.5 kW prototype achieved a power factor of 0.88 and an efficiency of 92.9%, surpassing IE4 efficiency levels [18]. A multi-degree-of-freedom parametric method was proposed, which allows for control over the barrier shape by altering coordinates on the barrier edge curve [19]. More degrees of freedom in control result in more diverse barrier shapes, aiding in finer optimization of motor performance, thus improving torque by 4.5% and enhancing the power factor. Italian researchers studied the reinforcement ribs of magnetic barriers [20]. Through the optimized design of these ribs, while maintaining the strength of the laminations, motor performance improved, increasing the saliency ratio by 31.3% and enhancing torque, efficiency, and power factor. In [21], a rotor structure incorporating V-shaped permanent magnets is analyzed, aligning the peak phase angles of permanent magnet torque and reluctance torque, thereby enhancing motor torque and reducing NdFeB usage by 4%.
The main research methods involve qualitatively pointing out first that placing permanent magnets in the barrier structure can enhance the motor’s power facto and torque output, based on classical motor equations and vector diagrams. Further analysis considers how structural dimensions like barrier layers, magnet placement, split ratio, hybrid magnet structures, and axial hybrid rotor structures impact motor performance. The findings suggest diverse performance outcomes and complex conclusions, restricted to specific structures without forming clear principles for parameter matching design.
The paper is organized as follows. First, the relationship between back electromotive force (back-EMF) and saliency ratio under the maximum torque per ampere (MTPA) control strategy is derived and analyzed in Section 2, based on the mathematical model of the motor under vector control. Then, the impact of parameter matching under the maximum torque per voltage (MTPV) control strategy on motor operating states is investigated in Section 3. The optimal matching curve of back EMF and saliency ratio under vector control for PMaSynRM is discussed in Section 4, proposing principles for parameter matching that achieve high performance and cost-effectiveness. In Section 5, a 45 kW PMaSynRM is developed, with tests showing that it could achieve IE5 energy efficiency while effectively reducing costs. Finally, some conclusions are given in Section 6.

2. Typical Operational State of PMaSynRMs under MTPA Control Strategy

SynRM without permanent magnet excitation lacks a permanent magnet flux linkage. Define i d , i q , L d , and L q as the current and inductances in d and q-axis, accordingly. e 0 is the back-EMF. The torque curve in the i d i q coordinate plane draws a hyperbolic shape, symmetrically distributed along the plane’s diagonal as the axis of symmetry, as shown in Figure 1a. The intersection of the current circle and torque curve is always at the current phase angle β = 135°, regardless of changes in L d and L q .The angle of current remains constant, even when operating at maximum torque per ampere. However, L d and L q affect the magnitude of voltage and power angle. Larger inductances result in higher voltages, and greater differences in inductance result in smaller power angles, with a limit approaching 90°. SynRMs exhibit a low power factor under maximum torque per ampere conditions accompanied by significant reactive current.
For PMaSynRM with permanent magnet excitation and permanent magnet flux linkage and back-EMF, the torque curve on the i d i q coordinate shifts rightward as depicted in Figure 1b. The intersection point of the current circle and torque curve no longer remains fixed at β = 135° but also shifts rightward. The power factor increases, reactive current decreases, and operating current is reduced. The specific intersection point depends on the matching of e 0 , L d , and L q . As the back-EMF increases and the saliency ratio decreases, the power factor of the motor operating at MTPA shifts from low to high. Figure 1c shows the torque curve and current circle trajectory for a power factor of 1.
The analysis indicates that to operate the motor at MTPA while reducing reactive current, it is necessary to increase the back-EMF and reduce the saliency ratio. Thus, during the MTPA state, the purpose of pursuing a high power factor is contradictory to enhancing saliency ratio and reluctance torque and reducing the use of permanent magnets. Therefore, aiming for an extreme power factor of 1 is not advisable. However, there should be an optimal operational state under the MTPA control strategy.

3. Analysis of Operational State of PMaSynRM under MTPA Control Strategy

3.1. Mathematical Model of Motors under MTPA Control

Based on the voltage, flux linkage, and torque equations of PMaSynRMs, the steady-state motor equations can be derived:
u d = ω L q i q u q = ω L d i d + e 0 i d = e 0 / ω + ( e 0 / ω ) 2 + 4 ( L d L q ) 2 i q 2 2 ( L d L q ) T e m = p [ e 0 ω i q + ( L d L q ) i d i q ] i s 2 = i d 2 + i q 2 u s 2 = u d 2 + u q 2
where i s and u s are the stator current voltage. i d , i q , u d , u q , and L d , L q are the current, voltage, and inductances in the d and q-axis, accordingly. e 0 is the back-EMF. Once the motor’s pole number p, target torque T e m , and speed ω are set, these parameters are considered constants. Meanwhile, a six-variable quadratic equation for variables u d , u q , u s , i d , i q is formed in (1). The magnitude and phase of u s and i s are correspondingly related.
Let
B = e 0 / ω + ( e 0 / ω ) 2 + 4 ( L d L q ) 2 i q 2
Then,
i d = B 2 ( L d L q )
yields the q-axis voltage
u q = ω L d B 2 ( L d L q ) + e 0
Combined with the d-axis voltage to obtain the stator voltage
u s 2 = ( ω L q i q ) 2 + ω L d B 2 ( L d L q ) + e 0 2
further leads to
u s 2 = ( ω L q i q ) 2 + ( ω L d B ) 2 4 ( L d L q ) 2 + ω L d B e 0 ( L d L q ) + e 0 2
The torque equation, when substituted with the d-axis current, gives
T em = p [ e 0 ω i q + ( L d L q ) B 2 ( L d L q ) i q ]
and further leads to
T em = p i q ( e 0 ω + B 2 )
which yields the q-axis current
i q = T em p ( e 0 ω + B 2 )
connected with (2) to obtain
B ( e 0 / ω ) 2 + 4 ( L d L q ) 2 T em p ( e 0 ω + B 2 ) 2 + e 0 / ω = 0
The equation has a solution for B, depending on L d , L q , e 0 , T e m , and ω . Once the motor’s design target is set, T e m and ω can be considered constants. At this time, the solution for B depends on L d , L q , and e 0 . When different parameter matchings are determined, B can be seen as a constant.
The q-axis current can also be expressed as
i q 2 = i s 2 B 2 4 ( L d L q ) 2
Substituting into (6) results in
u s 2 = ω 2 L q 2 i s 2 + ω 2 B 2 ( L d 2 + L q 2 ) 4 ( L d L q ) 2 + ω L d B e 0 ( L d L q ) + e 0 2
From (12), the corresponding relationship between u s and i s is closely related to e 0 , L d , and L q (which can be represented by two more intuitive parameters E 0 / U and saliency ratio ρ ), changing as the parameter matching changes.

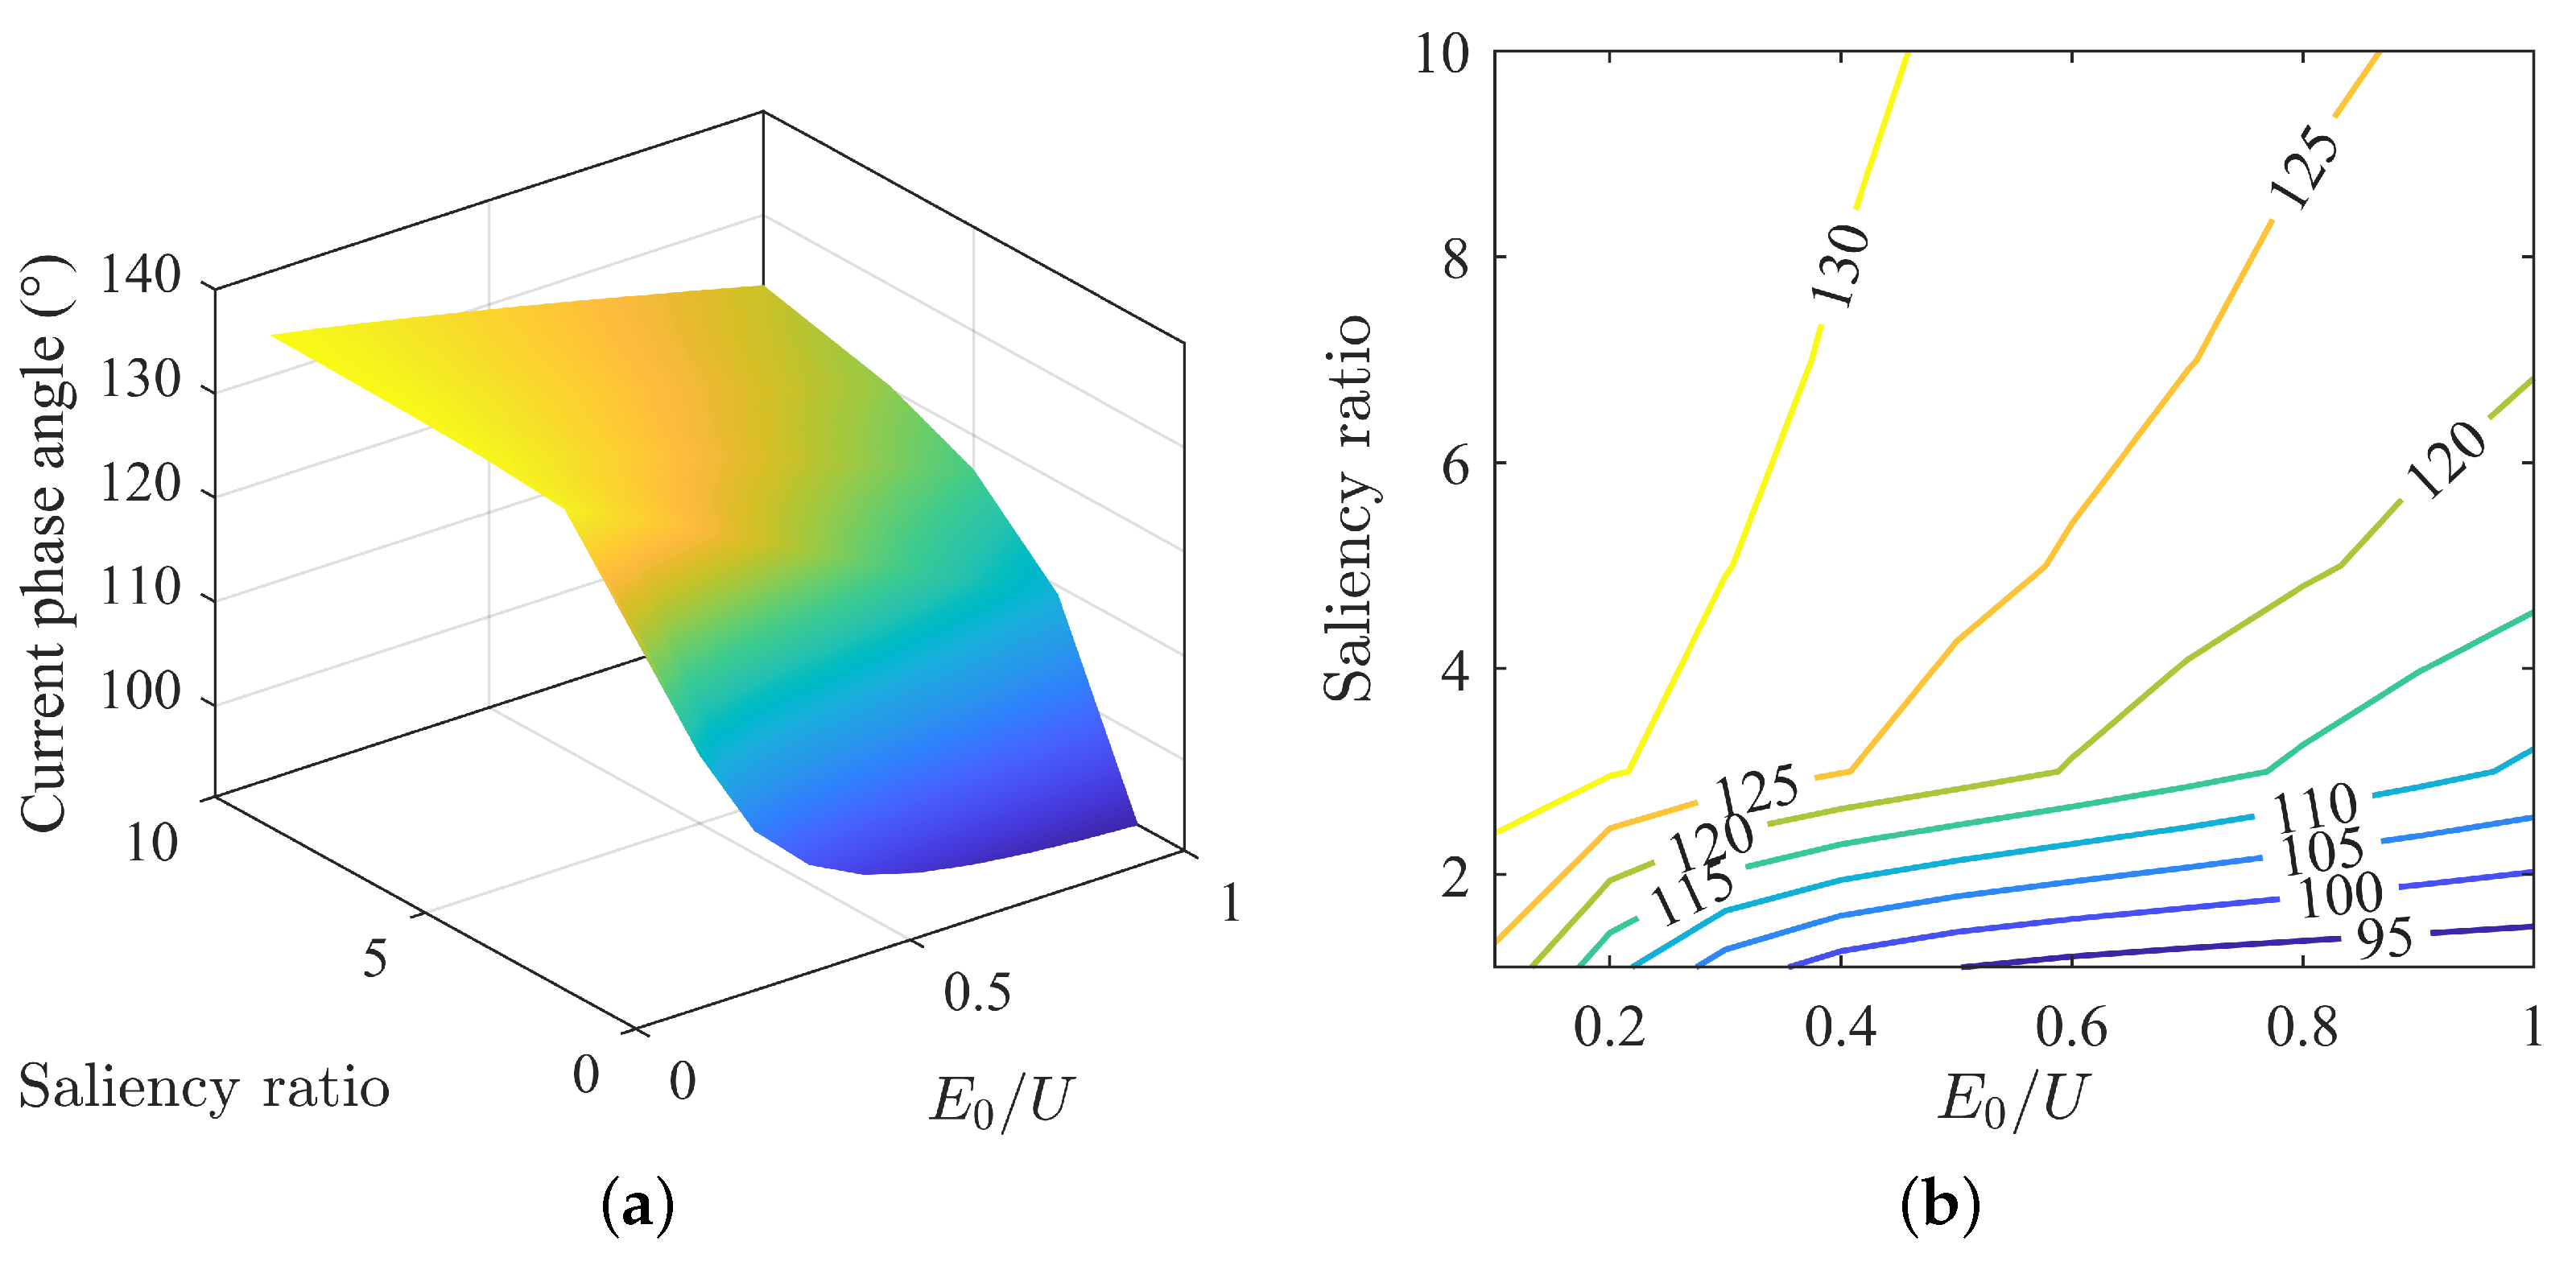
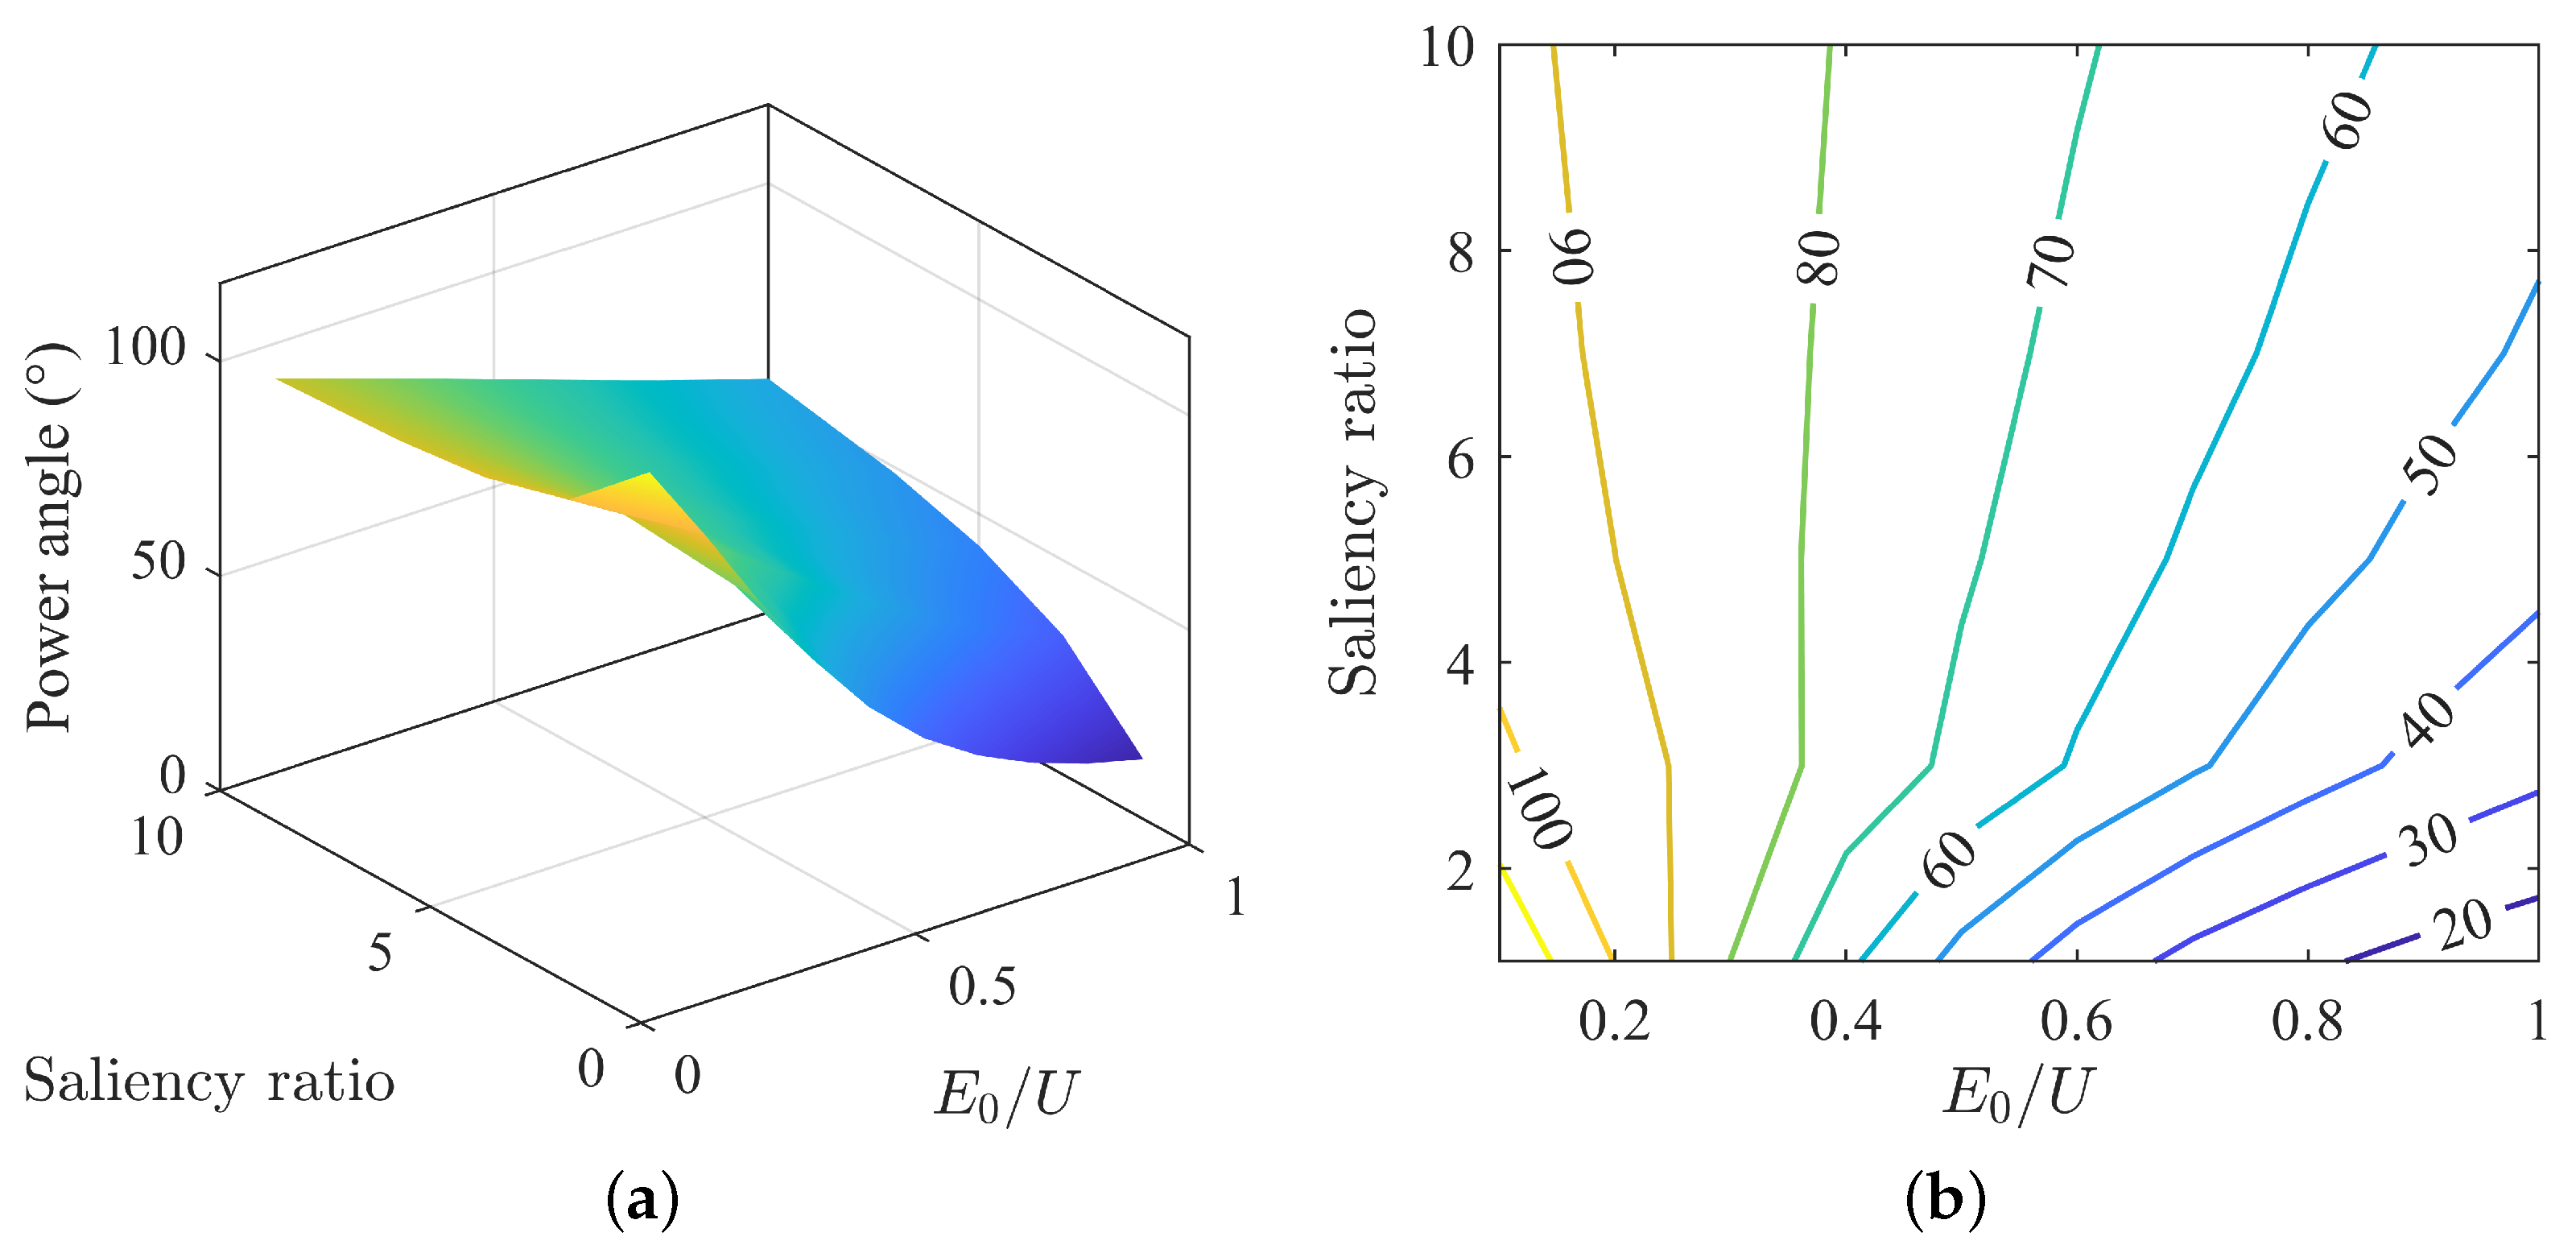
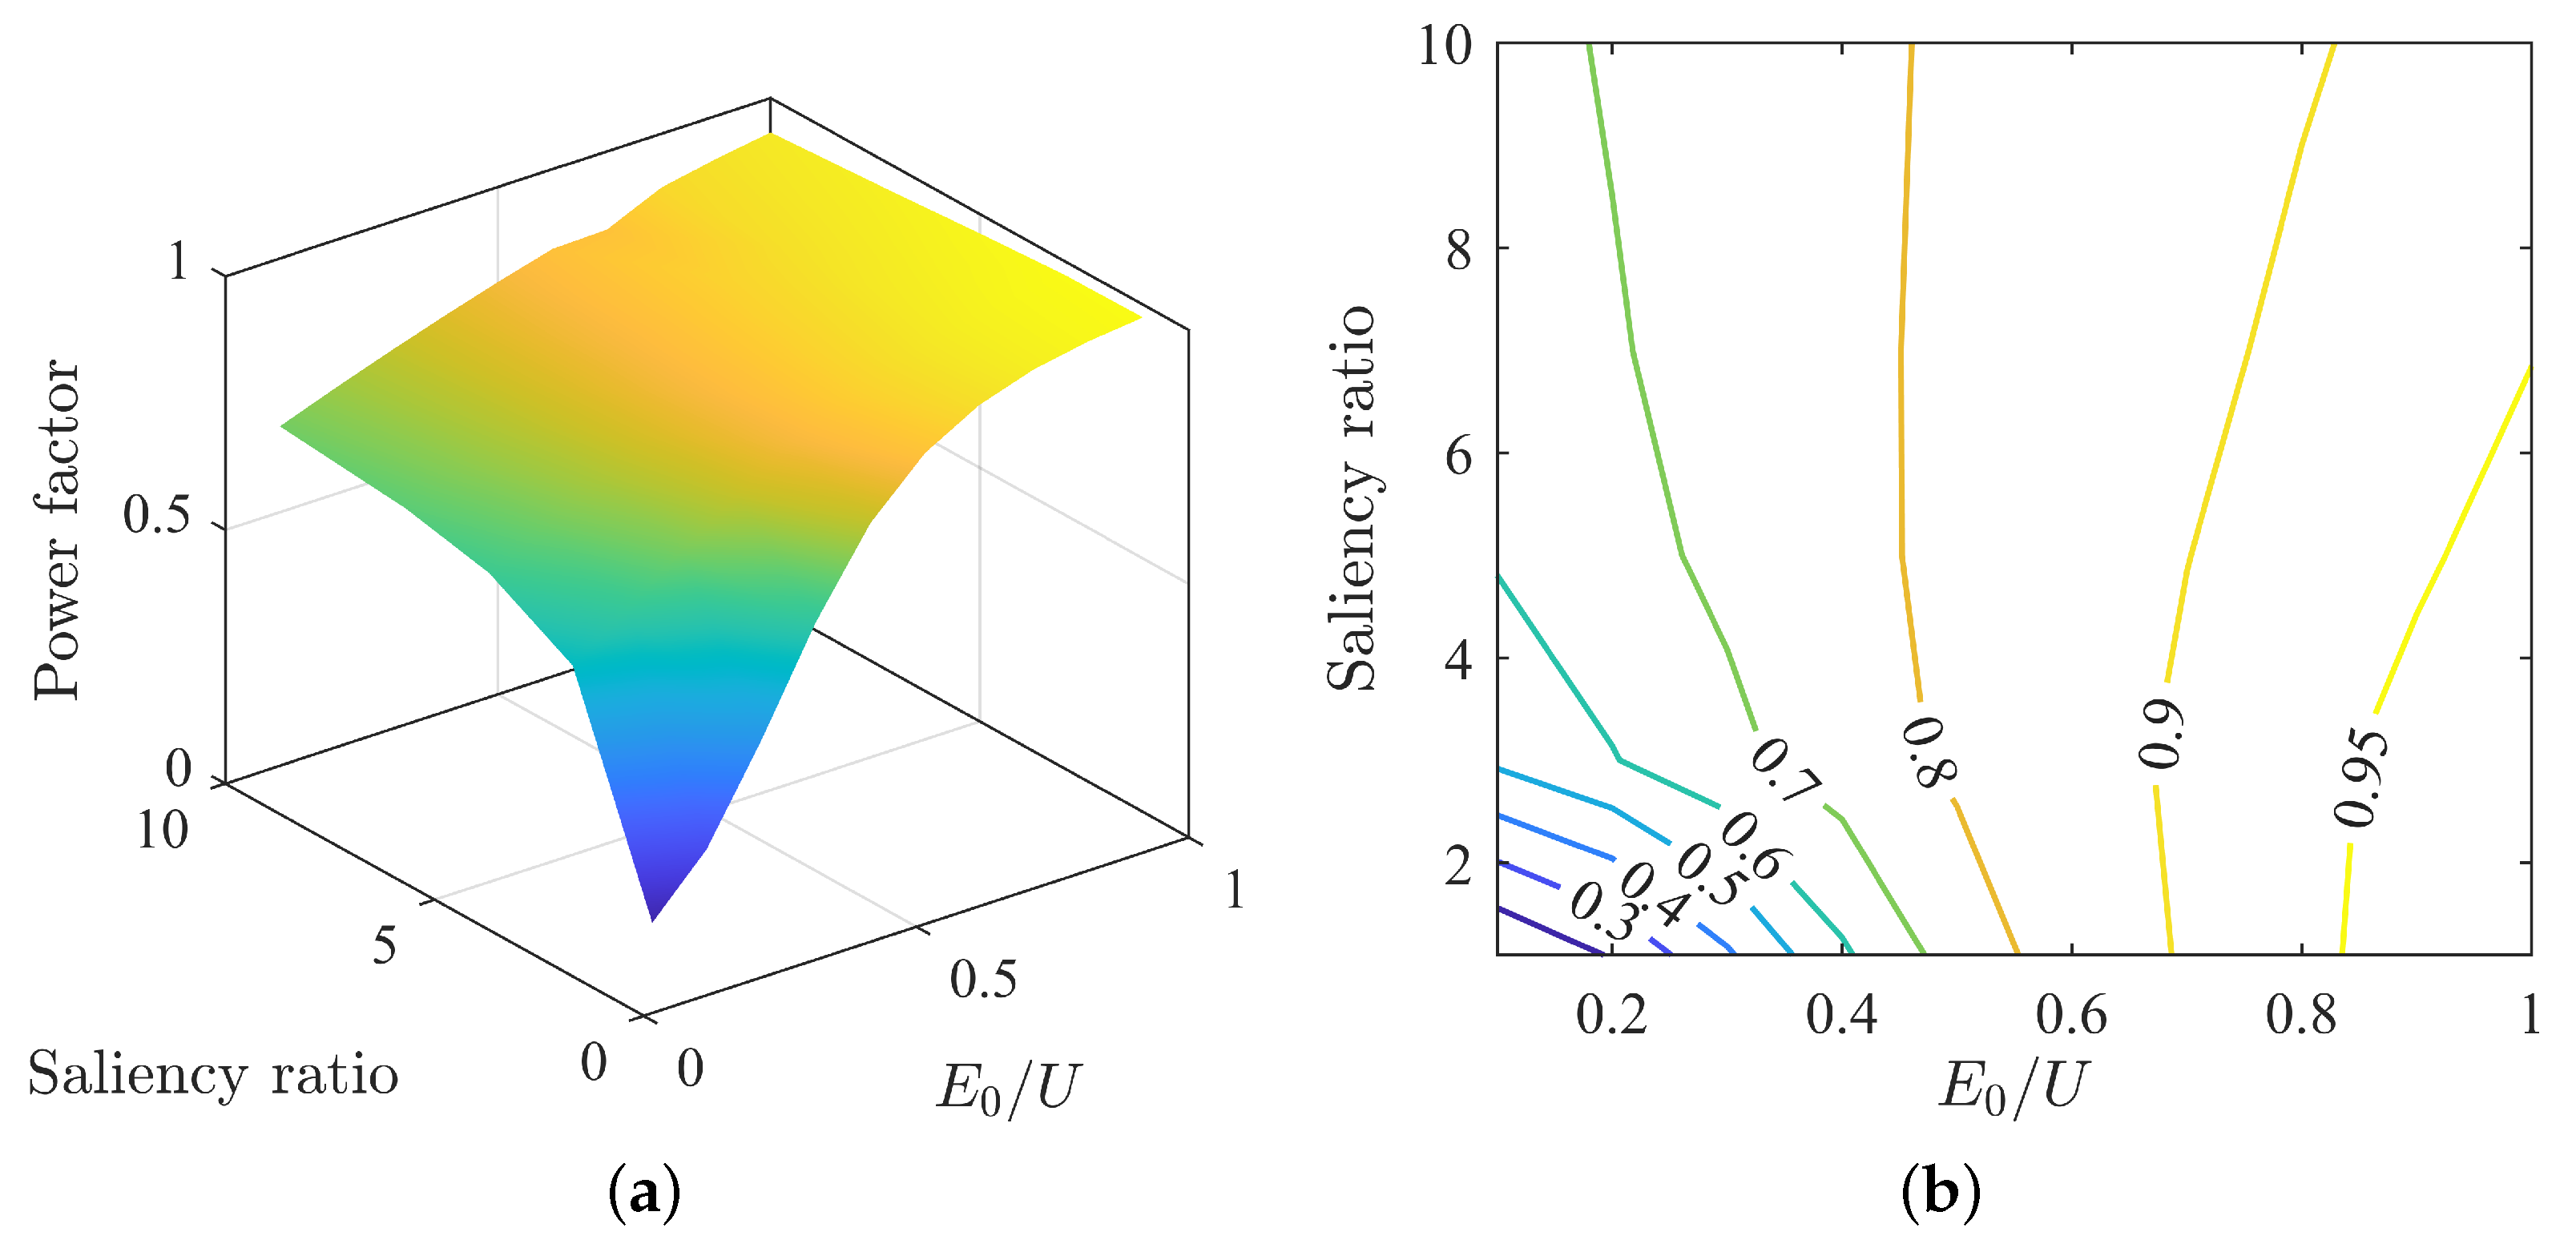
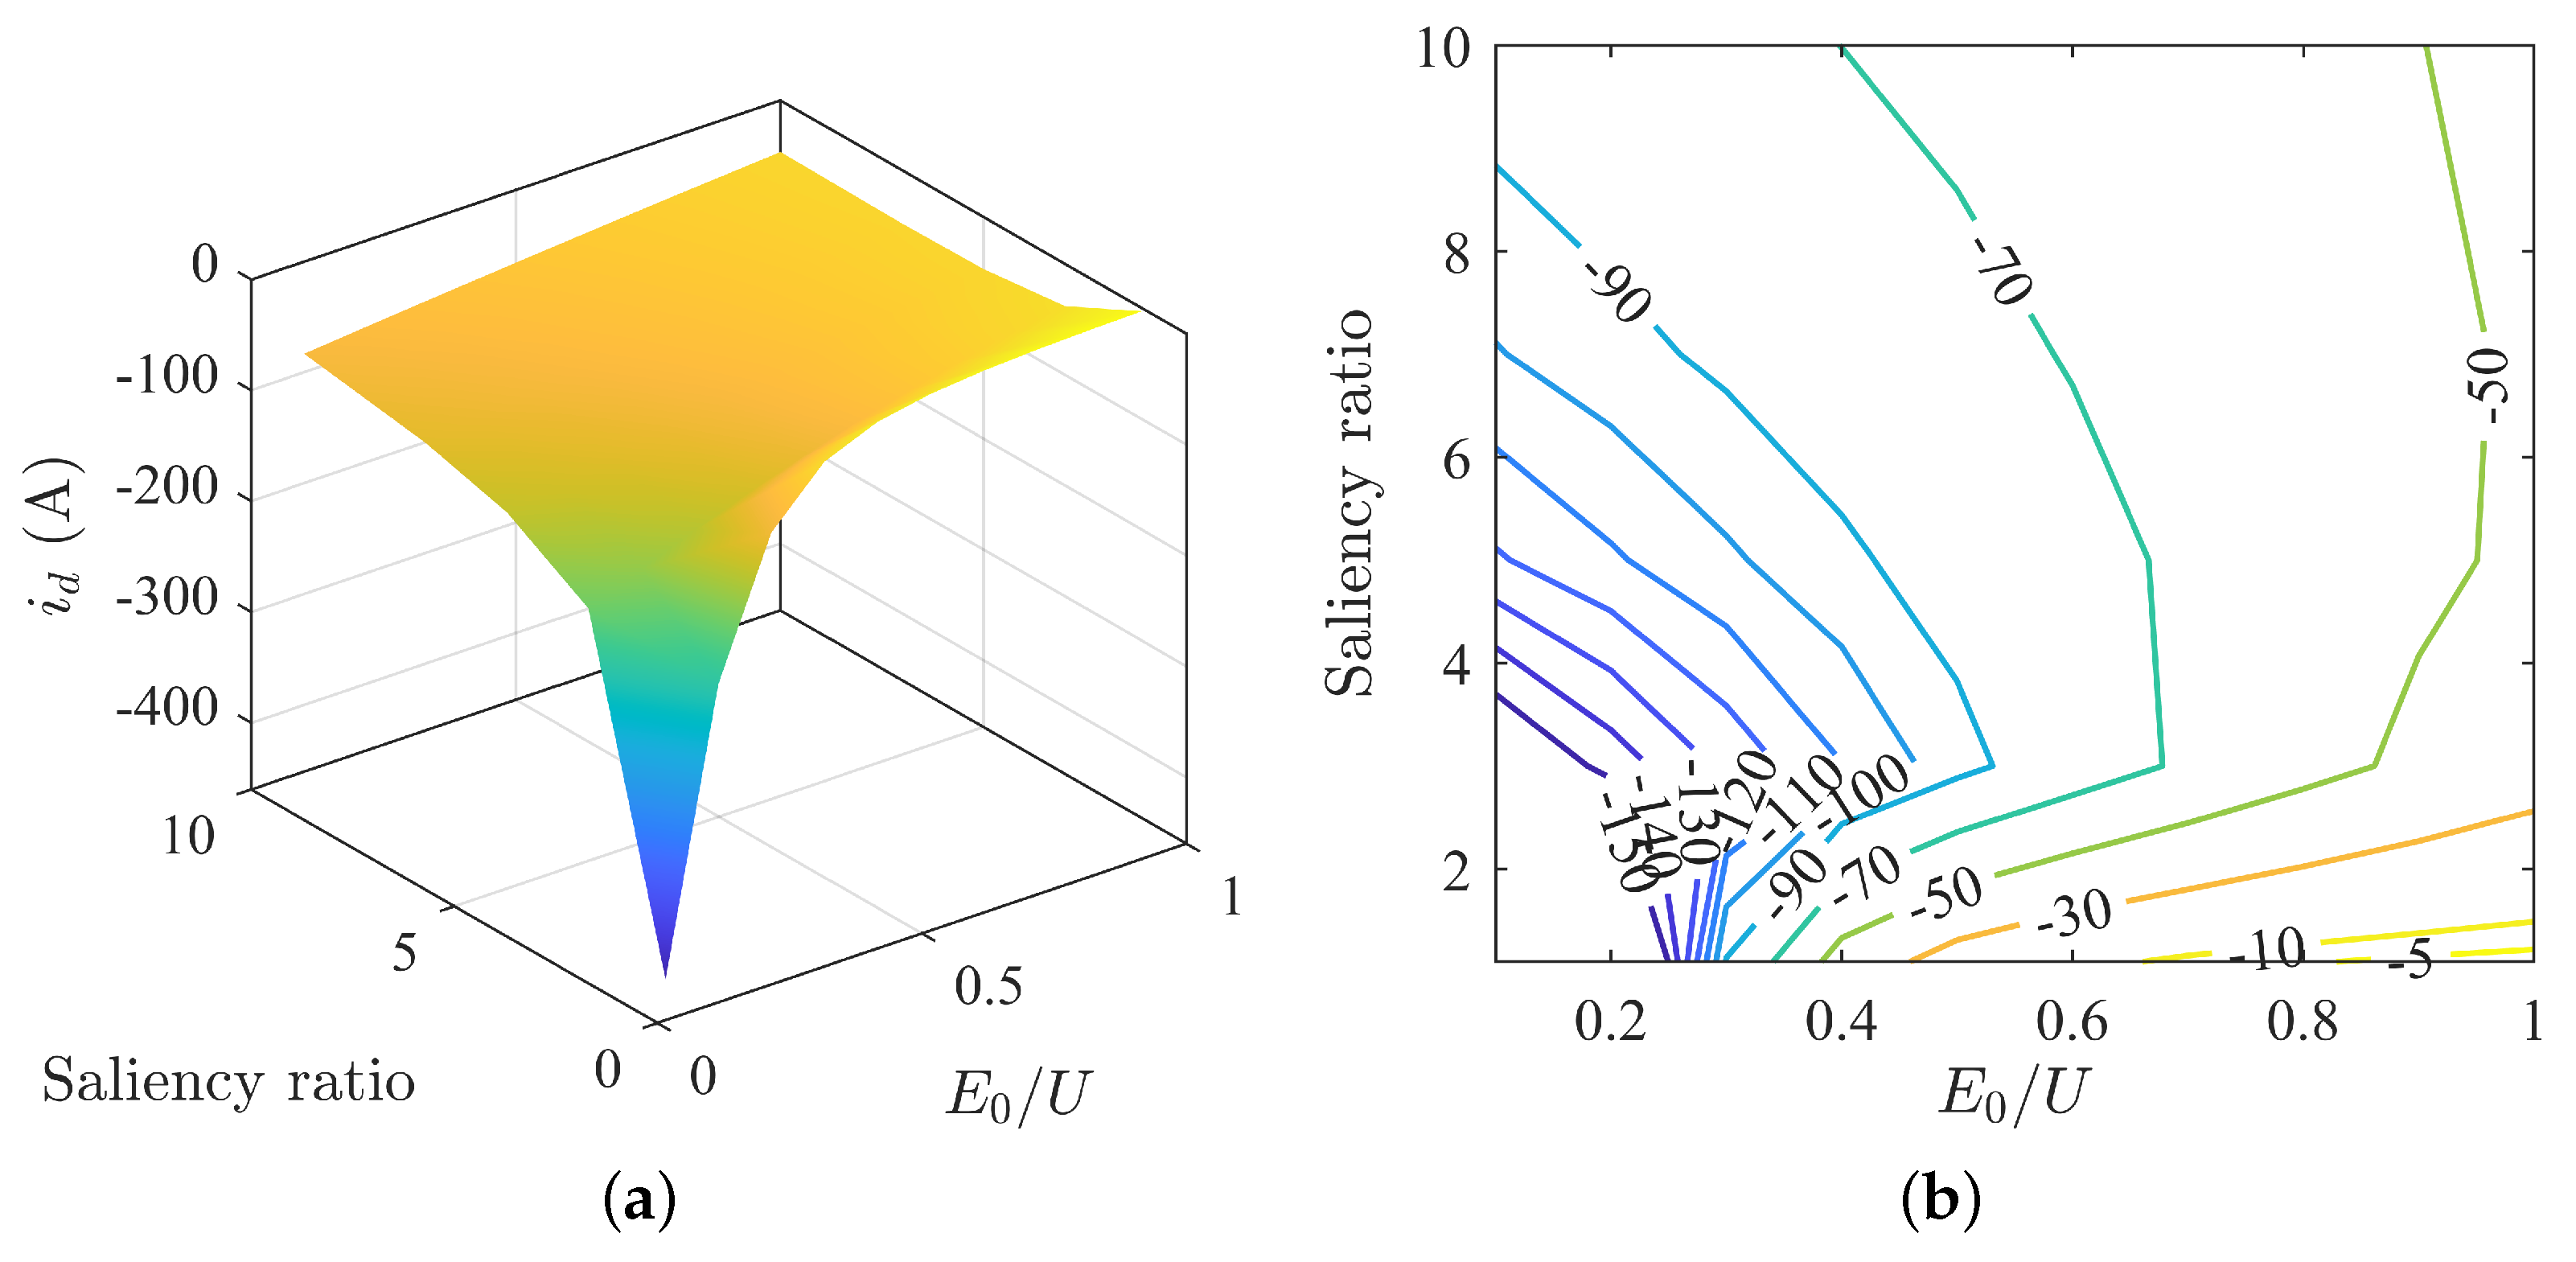
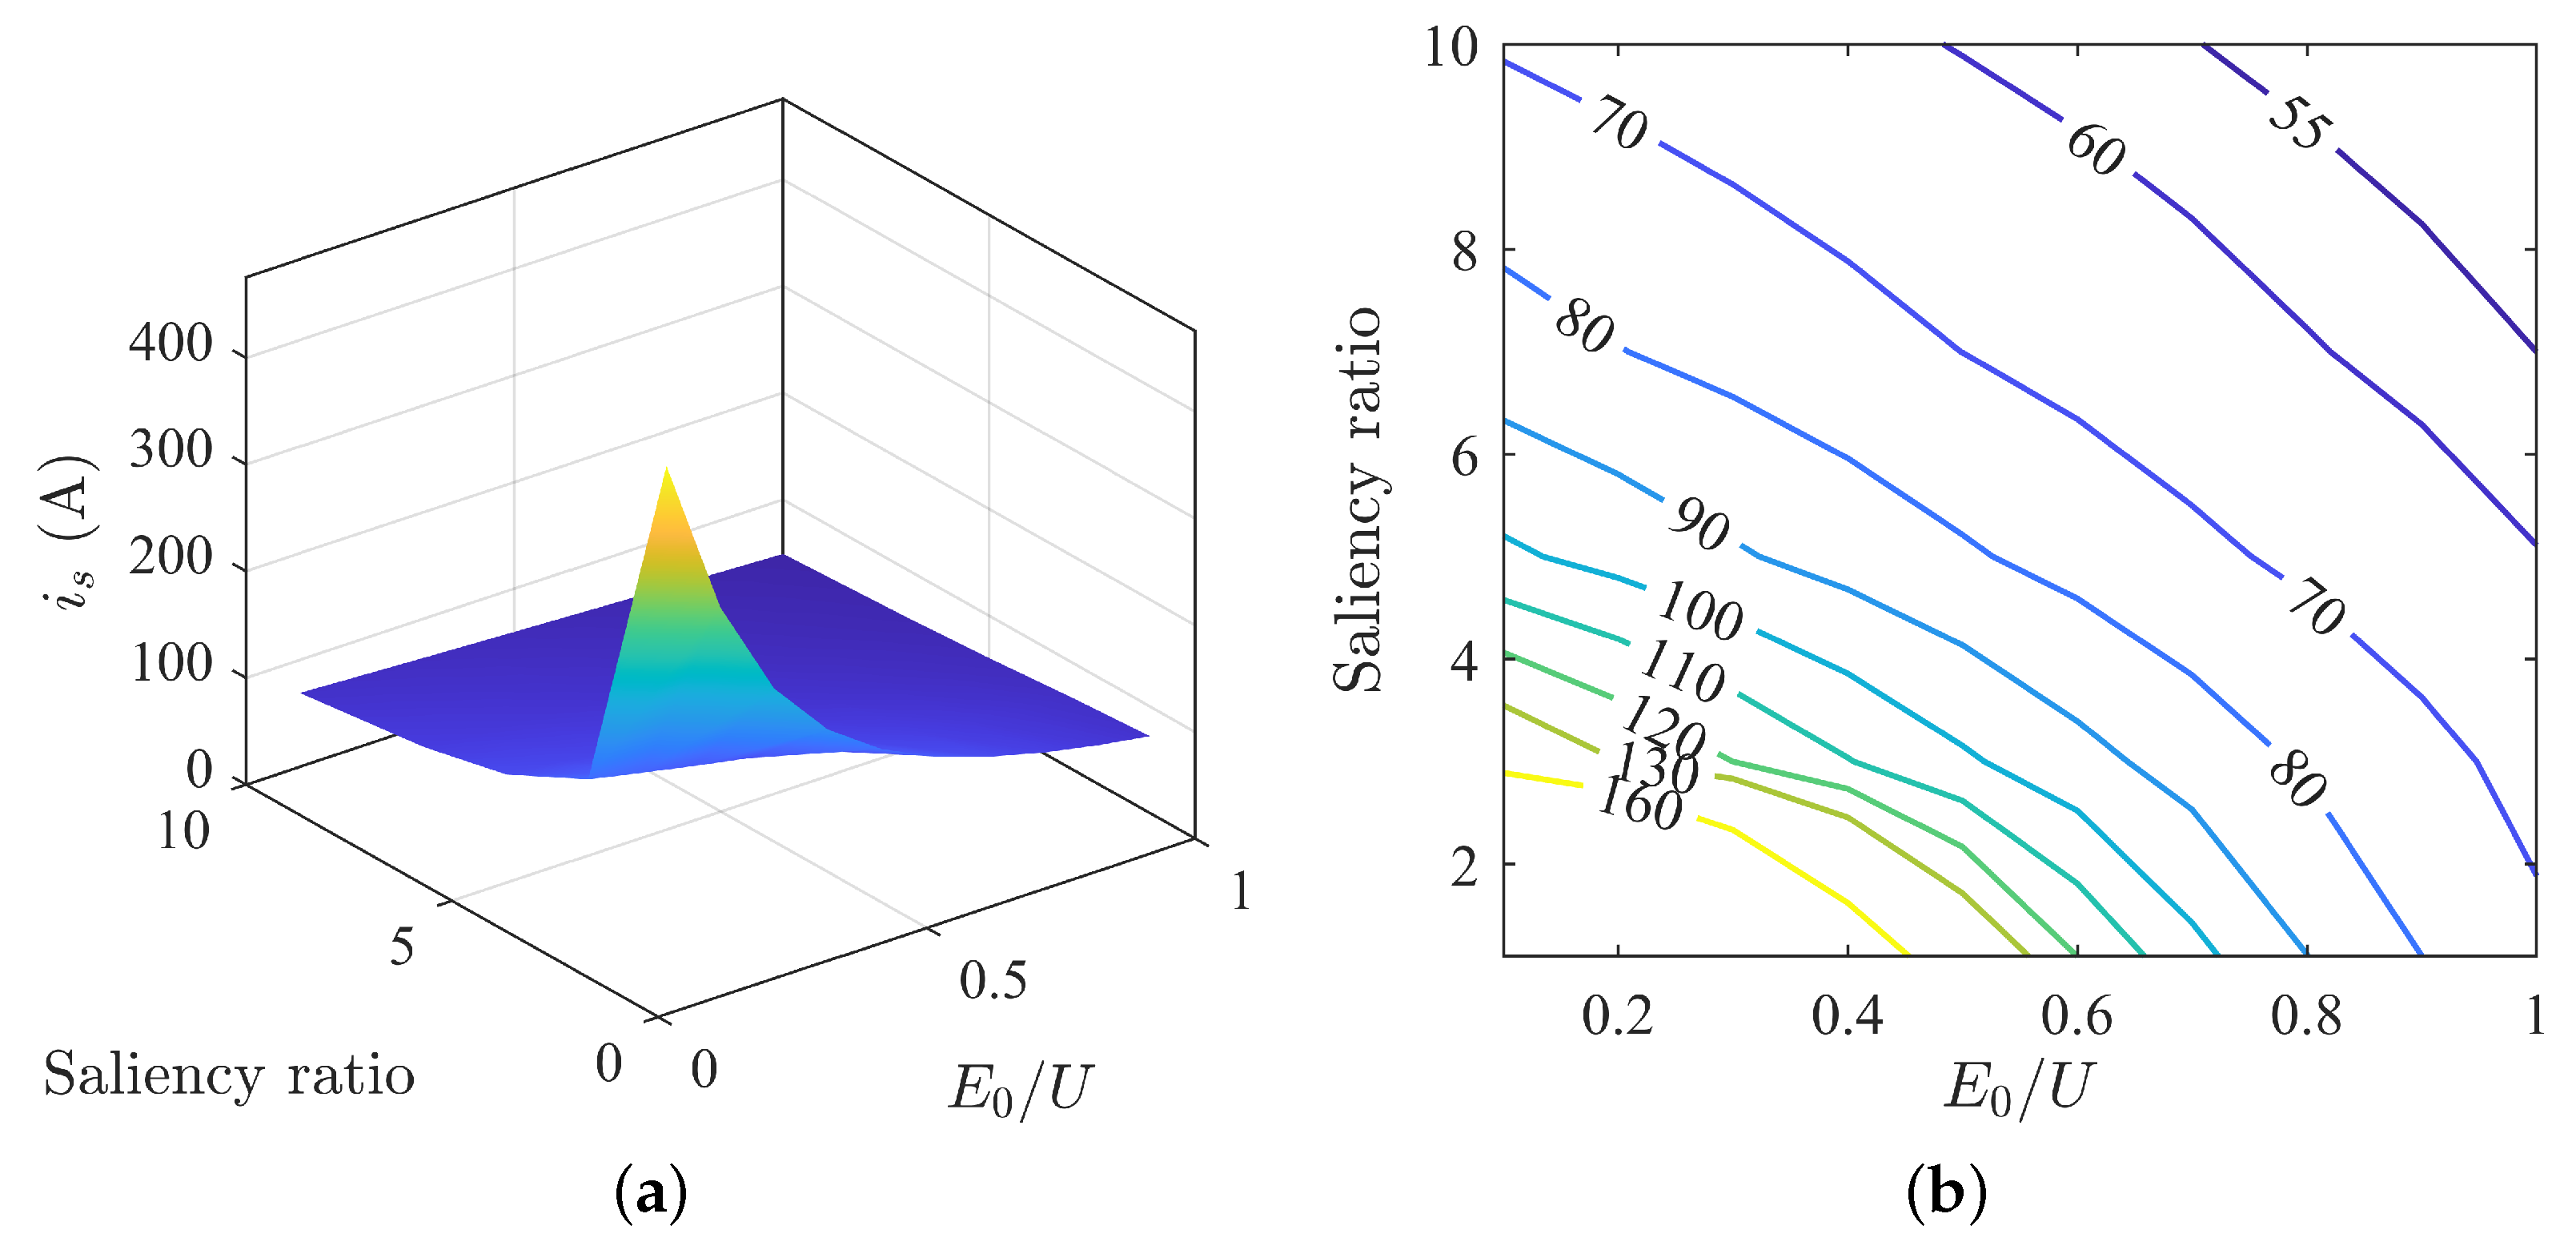
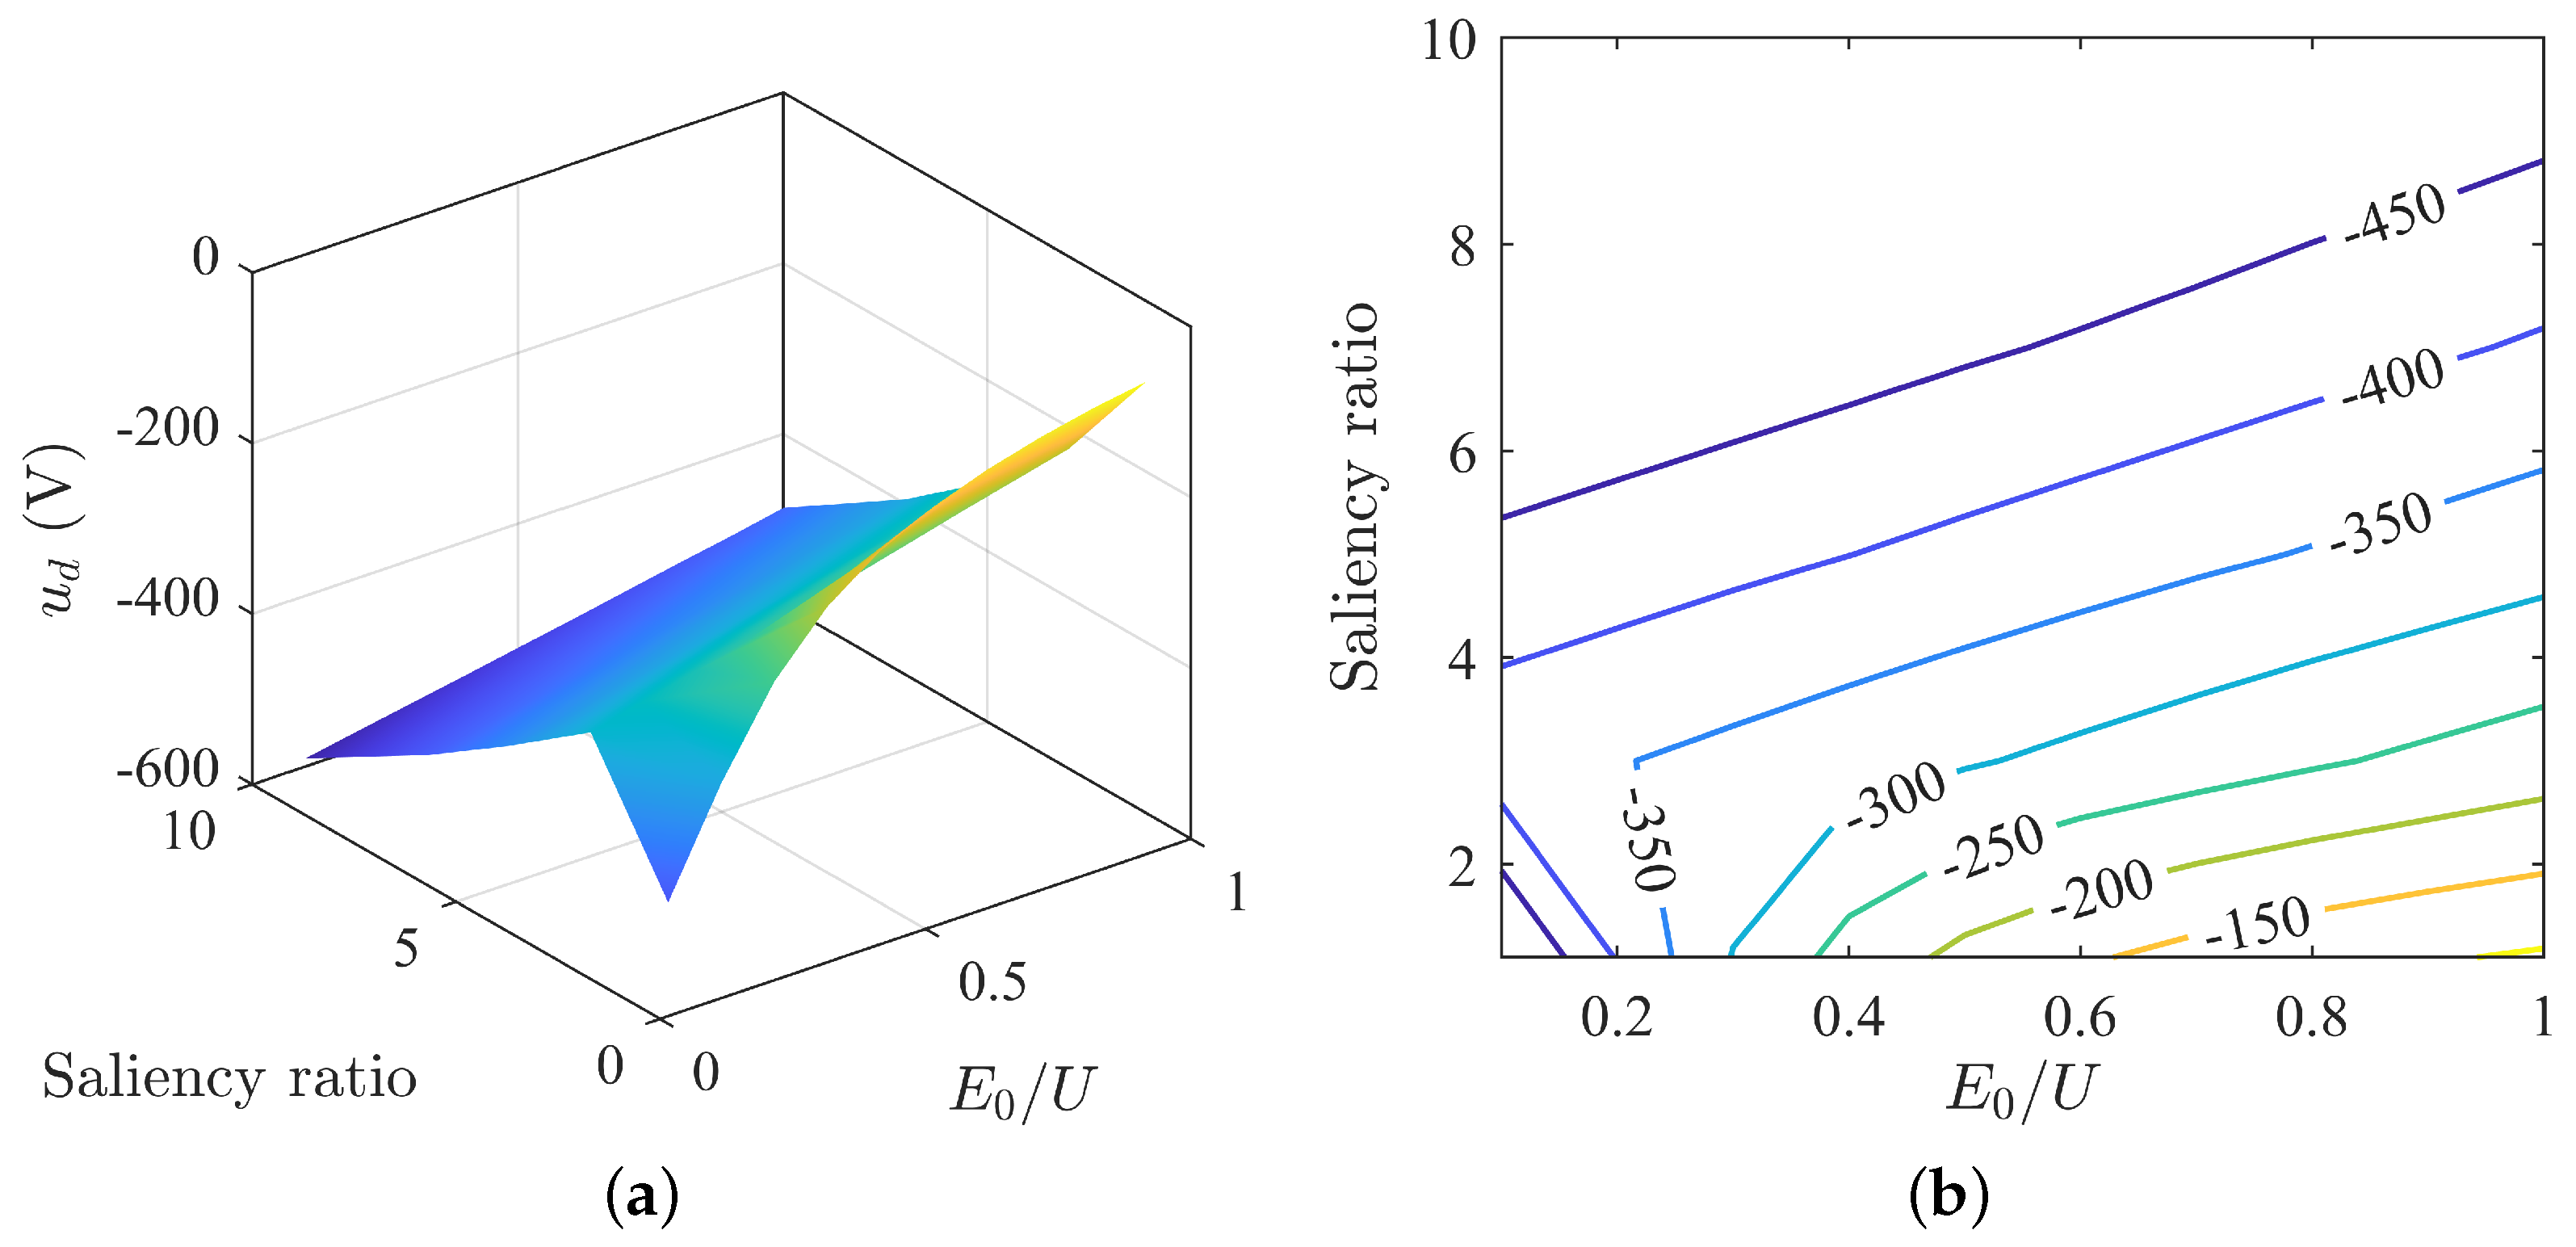
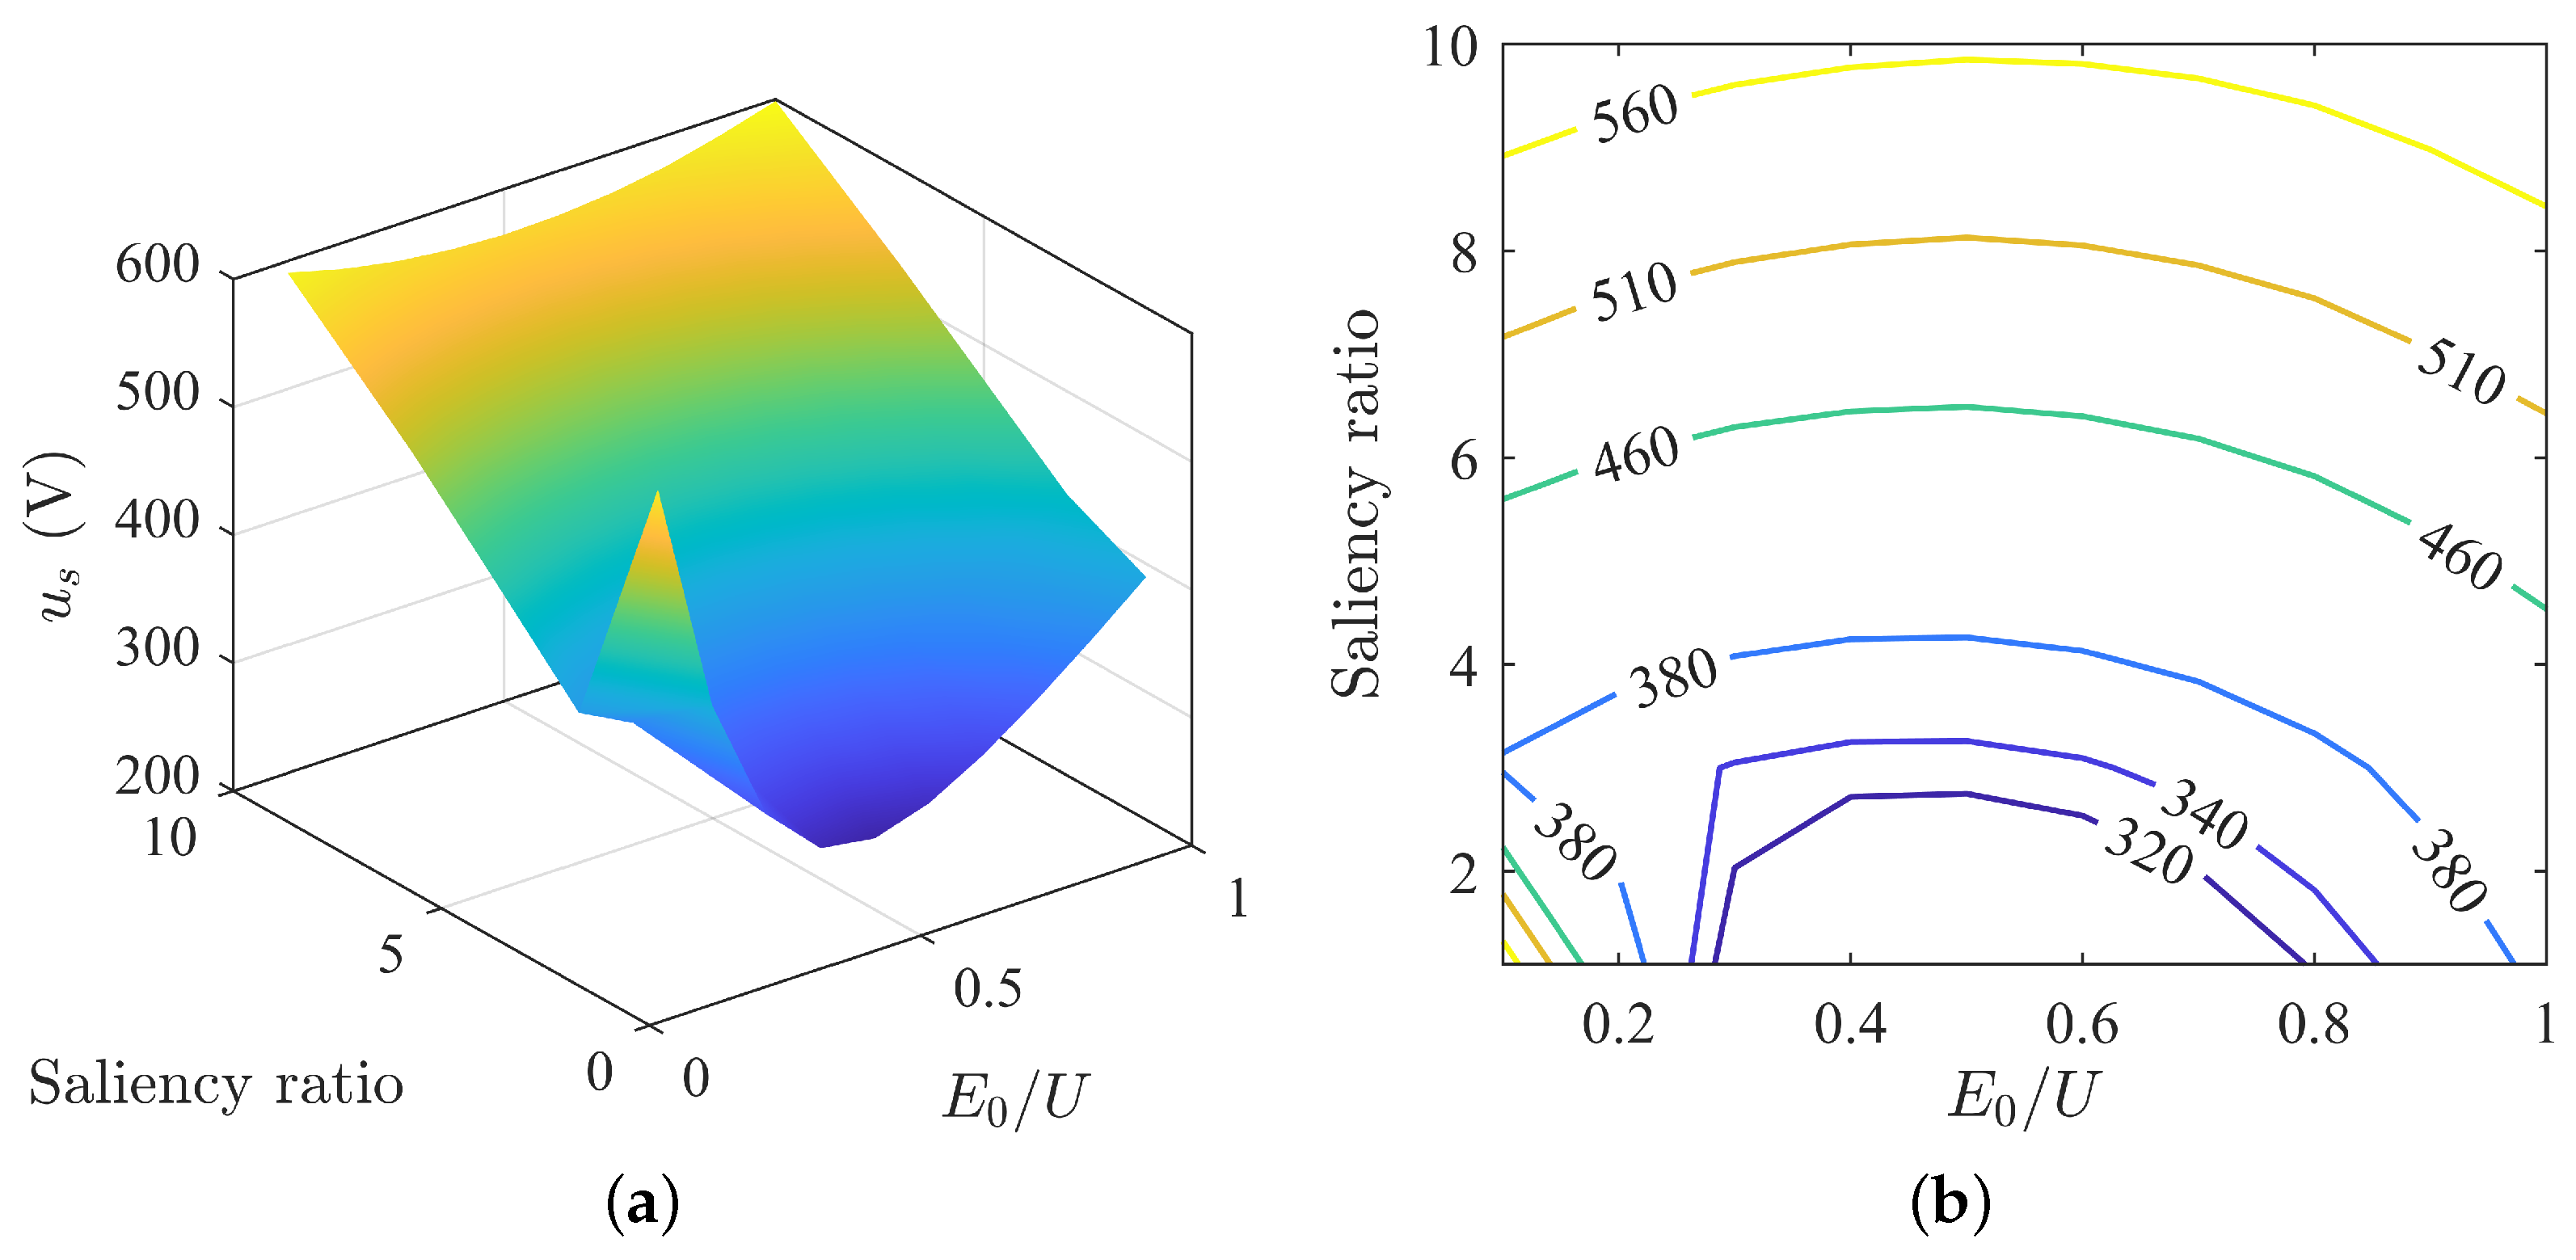
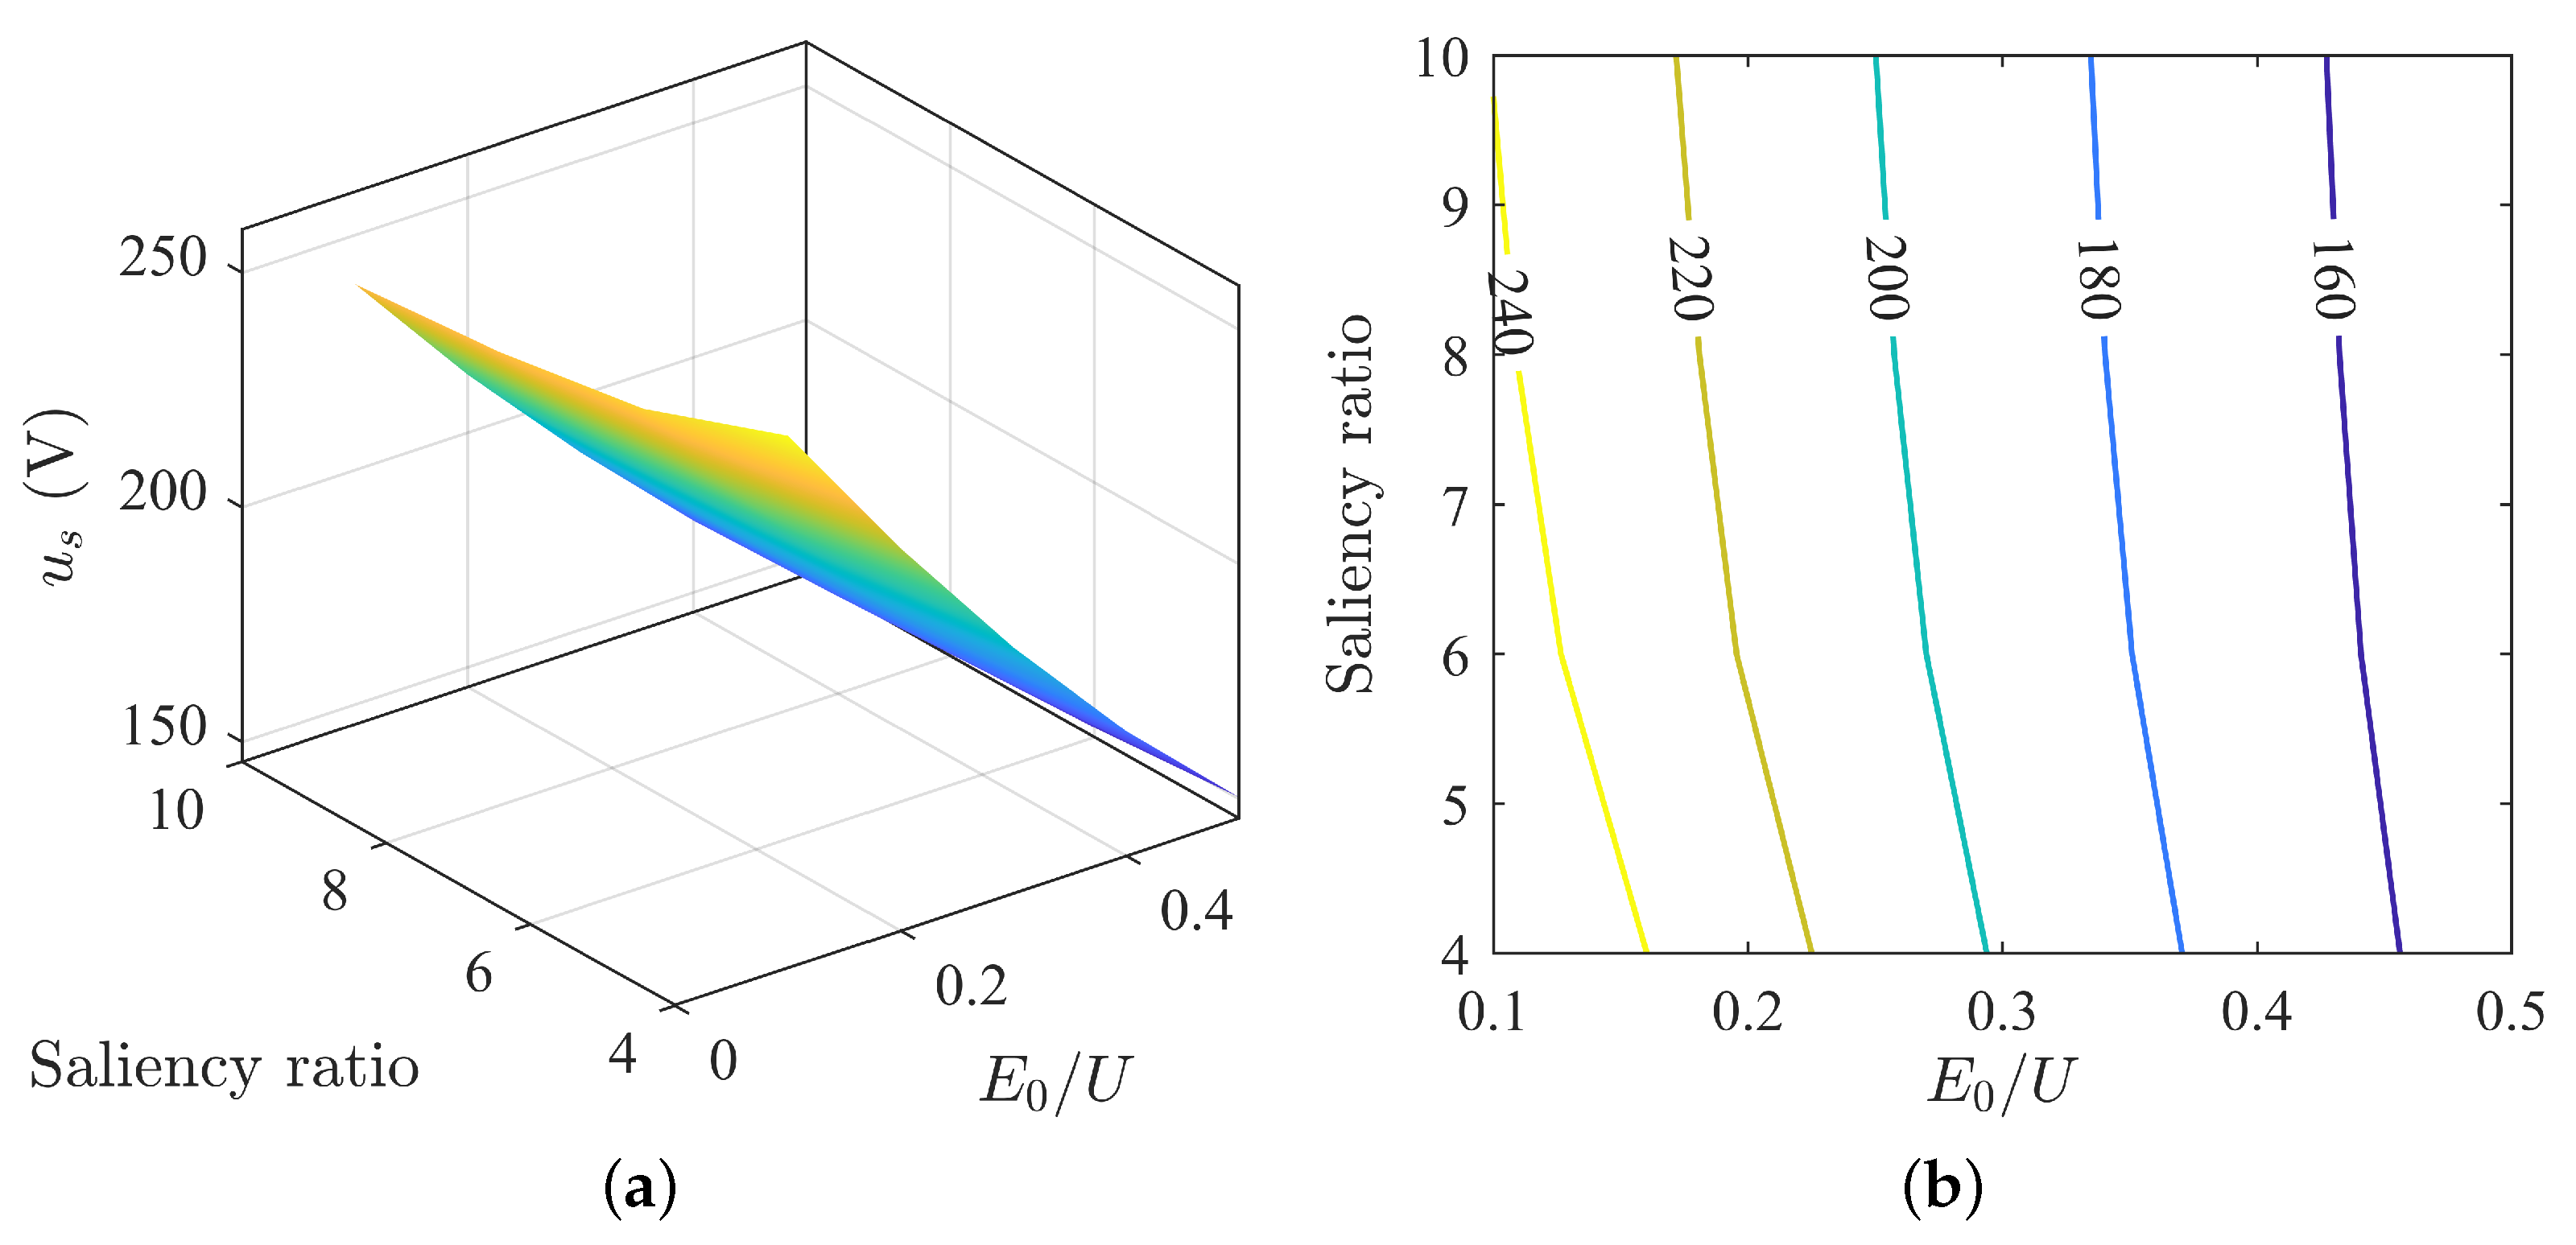
3.2. Impact of Back-EMF and Saliency Ratio on Motor Operating Characteristics under MTPA Control Strategy

Results derived from mathematical models include theoretically all possible operating states. However, due to limitations in manufacturing processes or design constraints, not all states can be realized in actual prototypes. To make the analysis more applicable to real situations, this paper is based on a 45 kW, four-pole motor operating at a speed of 1500 rpm. The following is the analysis of operating states under different parameter matchings.
The variation in current phase angle β under different back-EMF and saliency ratio matches is shown in Figure 2a.
From the current phase angle surface plot, the maximum and minimum values of the current phase angle are generally located at the two ends of the diagonal, decreasing gradually from a point of high saliency ratio and low back-EMF to a point of low saliency ratio and high back-EMF. This decrease is not linear but nonlinear, with the magnitude of decrease accelerating over time. The nonlinear decrease in current is not uniform across the entire surface. As shown in Figure 2b, the overall trend is that the current angle decreases with a decrease in saliency ratio and increases in back-EMF. When the saliency ratio is high, the increase in back-EMF has a smaller reduction in current angle. And when the saliency ratio is low, the reduction is more significant.
The variation in power angle θ under different back-EMF and saliency ratio matches is shown in Figure 3a. From the surface plot, the maximum power angle is near the point of minimum back-EMF and saliency ratio, and the minimum power angle is near the point of maximum back-EMF and minimum saliency ratio. The surface is relatively flat, and the variation in power angle is more uniform compared to the current angle.
As shown in Figure 3b, the power angle decreases with an increase in back-EMF and increases with an increase in saliency ratio. At higher saliency ratios, the decrease in power angle with increasing back-EMF is relatively linear, and the range of decrease is smaller. At lower saliency ratios, the decrease is more nonlinear and the range of decrease is larger.
The power factor and power factor angle corresponding to each other vary under different parameter matchings, as shown in Figure 4a. From the surface plot, as back-EMF increases, the power factor also increases. As shown in Figure 4b, when E 0 / U is less than 0.5, the power factor increases with an increase in saliency ratio. When E 0 / U is greater than 0.6, the power factor decreases with an increase in saliency ratio. Between E 0 / U of 0.5 and 0.6, the power factor does not change significantly. From the perspective of power factor changes, under the MTPA control strategy, an increase in back-EMF leads to an increase in power factor, but an increase in saliency ratio does not necessarily lead to an increase in power factor. It also depends on the match with back-EMF.
The variation in d-axis current under different parameter matchings is shown in Figure 5. The plot indicates that the d-axis current increases with an increase in back-EMF. The trend in d-axis current is not consistent with an increase in saliency ratio. When E 0 / U is greater than 0.2, the d-axis current first increases then decreases with an increase in saliency ratio, with a smaller fluctuation range. When E 0 / U is less than 0.2, the d-axis current decreases with an increase in saliency ratio, with a larger fluctuation range.
The variation in q-axis current under different parameter matchings is shown in Figure 6. The q-axis current decreases consistently with an increase in back-EMF and saliency ratio. When the saliency ratio is high, the range of change in the q-axis current with changing back-EMF is relatively small. Conversely, when the saliency ratio is low, the range of change in the q-axis current with changing back-EMF is relatively large.
The variation in stator current under different parameter matchings is shown in Figure 7. It can be observed that the maximum and minimum values of the stator current are generally located at the two ends of the diagonal, and the overall trend is a gradual decrease from the point of low saliency ratio and low back-EMF to the point of high saliency ratio and high back-EMF. The surface plot reveals steep and relatively flat slopes, indicating that the change in stator current is nonlinear. The smaller the saliency ratio and back-EMF, the greater the change. The larger the saliency ratio and back-EMF, the smaller the change. From Figure 7, it is evident that increasing the back EMF can reduce the stator current, and increasing the saliency ratio can also decrease the stator current.
The d-axis voltage varies with parameter matching as shown in Figure 8. Overall, the d-axis voltage increases as the back-EMF decreases. The change in d-axis voltage with saliency ratio is not consistent. When E 0 / U is less than 0.2, the d-axis voltage first decreases then increases with increasing saliency ratio. And when E 0 / U is greater than 0.2, the d-axis current increases with increasing saliency ratio.
The q-axis voltage changes with parameter matching as depicted in Figure 9. It is apparent that as the back-EMF decreases, the q-axis current gradually reduces until it reaches the zero crossing point, after which the q-axis current reverses and increases. As the saliency ratio increases, the overall trend of the q-axis voltage initially decreases and then increases. This variation is relatively mild when the back-EMF is high and more fluctuant when it is low.
Under different parameter matching conditions, the change in stator voltage is shown in Figure 10. From the surface map, it is evident that the overall stator voltage presents a state where the side with a higher saliency ratio is higher and the side with a lower saliency ratio is lower. The corners of the surface are higher at the sides with small and large back-EMF, and lower in the middle value of back-EMF. The entire surface resembles the shape of a “slide”, with a curve across the surface where each point is a local minimum. The contour map shows that as the saliency ratio increases, the stator voltage increases, and as the back EMF increases, the stator voltage first decreases and then increases.
From Figure 10b, it can be seen that the contour lines are higher in the middle and lower on both sides, with the highest points of each contour line generally located at E 0 / U = 0.5, indicating the presence of a minimum voltage curve when the back-EMF is half of the rated voltage.
The relationship between current and voltage under different back EMF and saliency ratio matches is shown in Figure 11.
It can be seen that each curve has a minimum, and connecting these minimum points forms the minimum voltage curve. With the minimum voltage curve as a boundary, the plane can be divided into two areas, A and B. In area A, the current is smaller, while in area B, the current is larger. The voltage in both areas gradually increases from the minimum voltage towards both sides. Looking at different saliency ratios, when the saliency ratio is small, the voltage is generally in a lower range. And when it is large, the voltage is generally in a higher range. When the saliency ratio is small, the current is generally larger. And when it is large, the current is generally smaller. As the saliency ratio changes, the overall distribution trend of current and voltage is not consistent, and the best parameter match should be either low voltage and low current, or when the voltage does not exceed the limit voltage and the current is small. The state in area B is not ideal, being either low-voltage and high-current or high-voltage and high-current. The state in area A is either low-current and low-voltage or low-current and high-voltage, with overlapping voltage curves at different saliency ratios, indicating an optimal state.
As shown in Figure 12, the stator voltage increases with the saliency ratio and shows a linear change. This indicates that using MTPA control strategy, there exists a minimum voltage curve under different back-EMF and saliency ratio matches, and as the saliency ratio increases, the minimum voltage linearly increases.

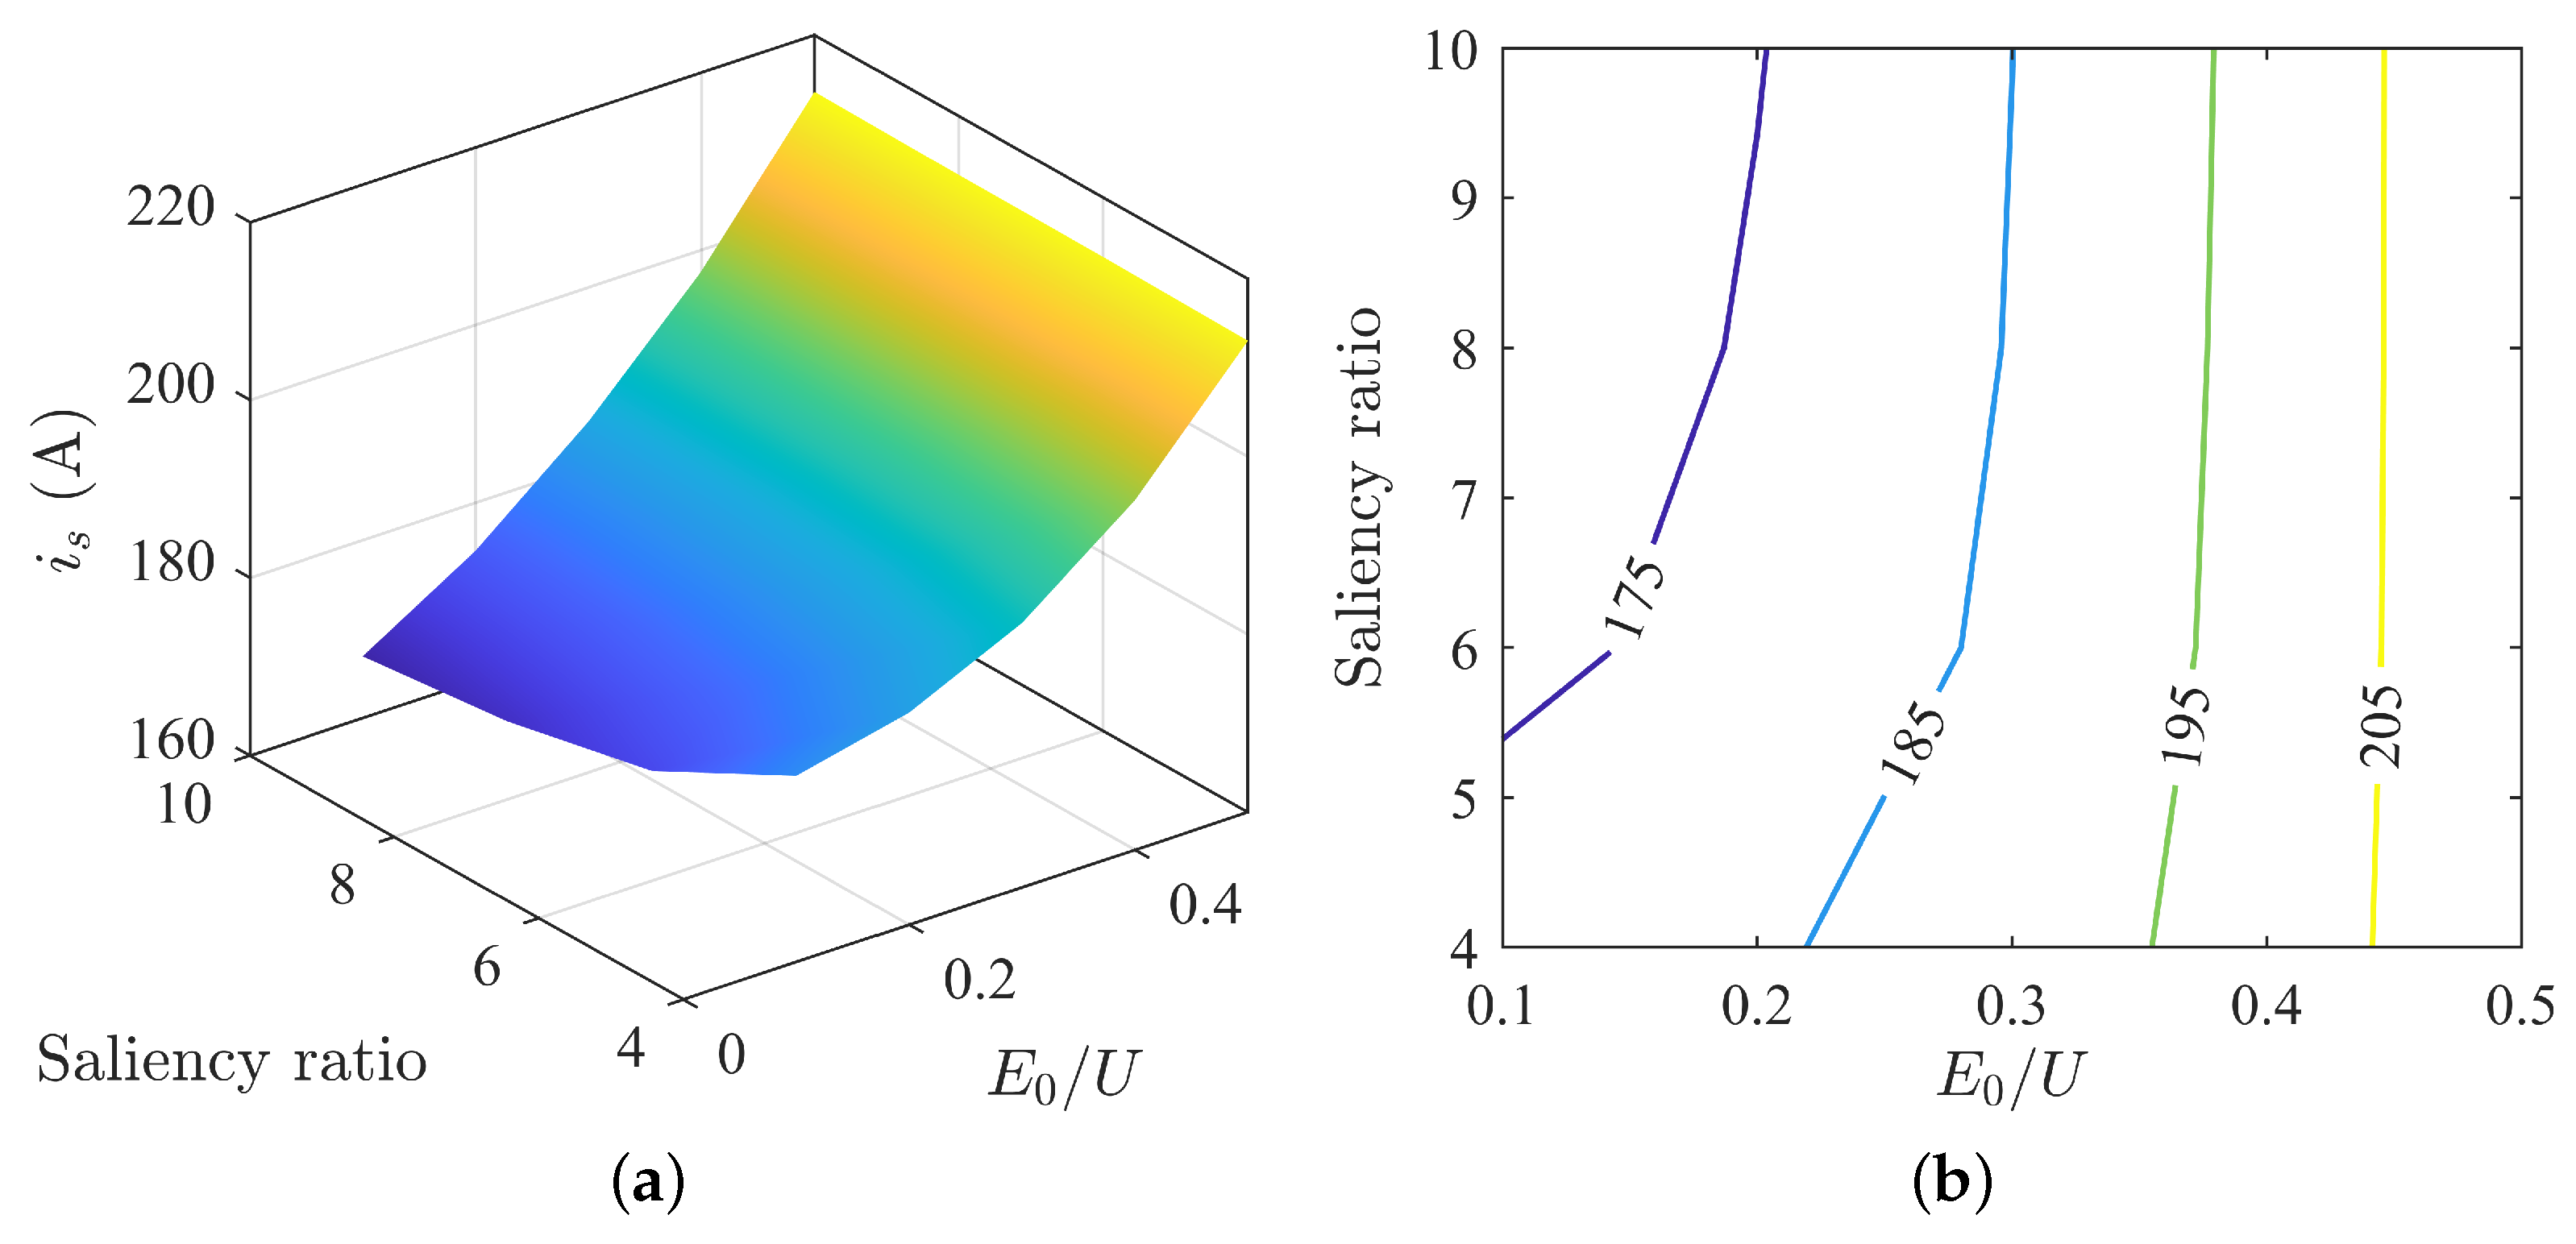
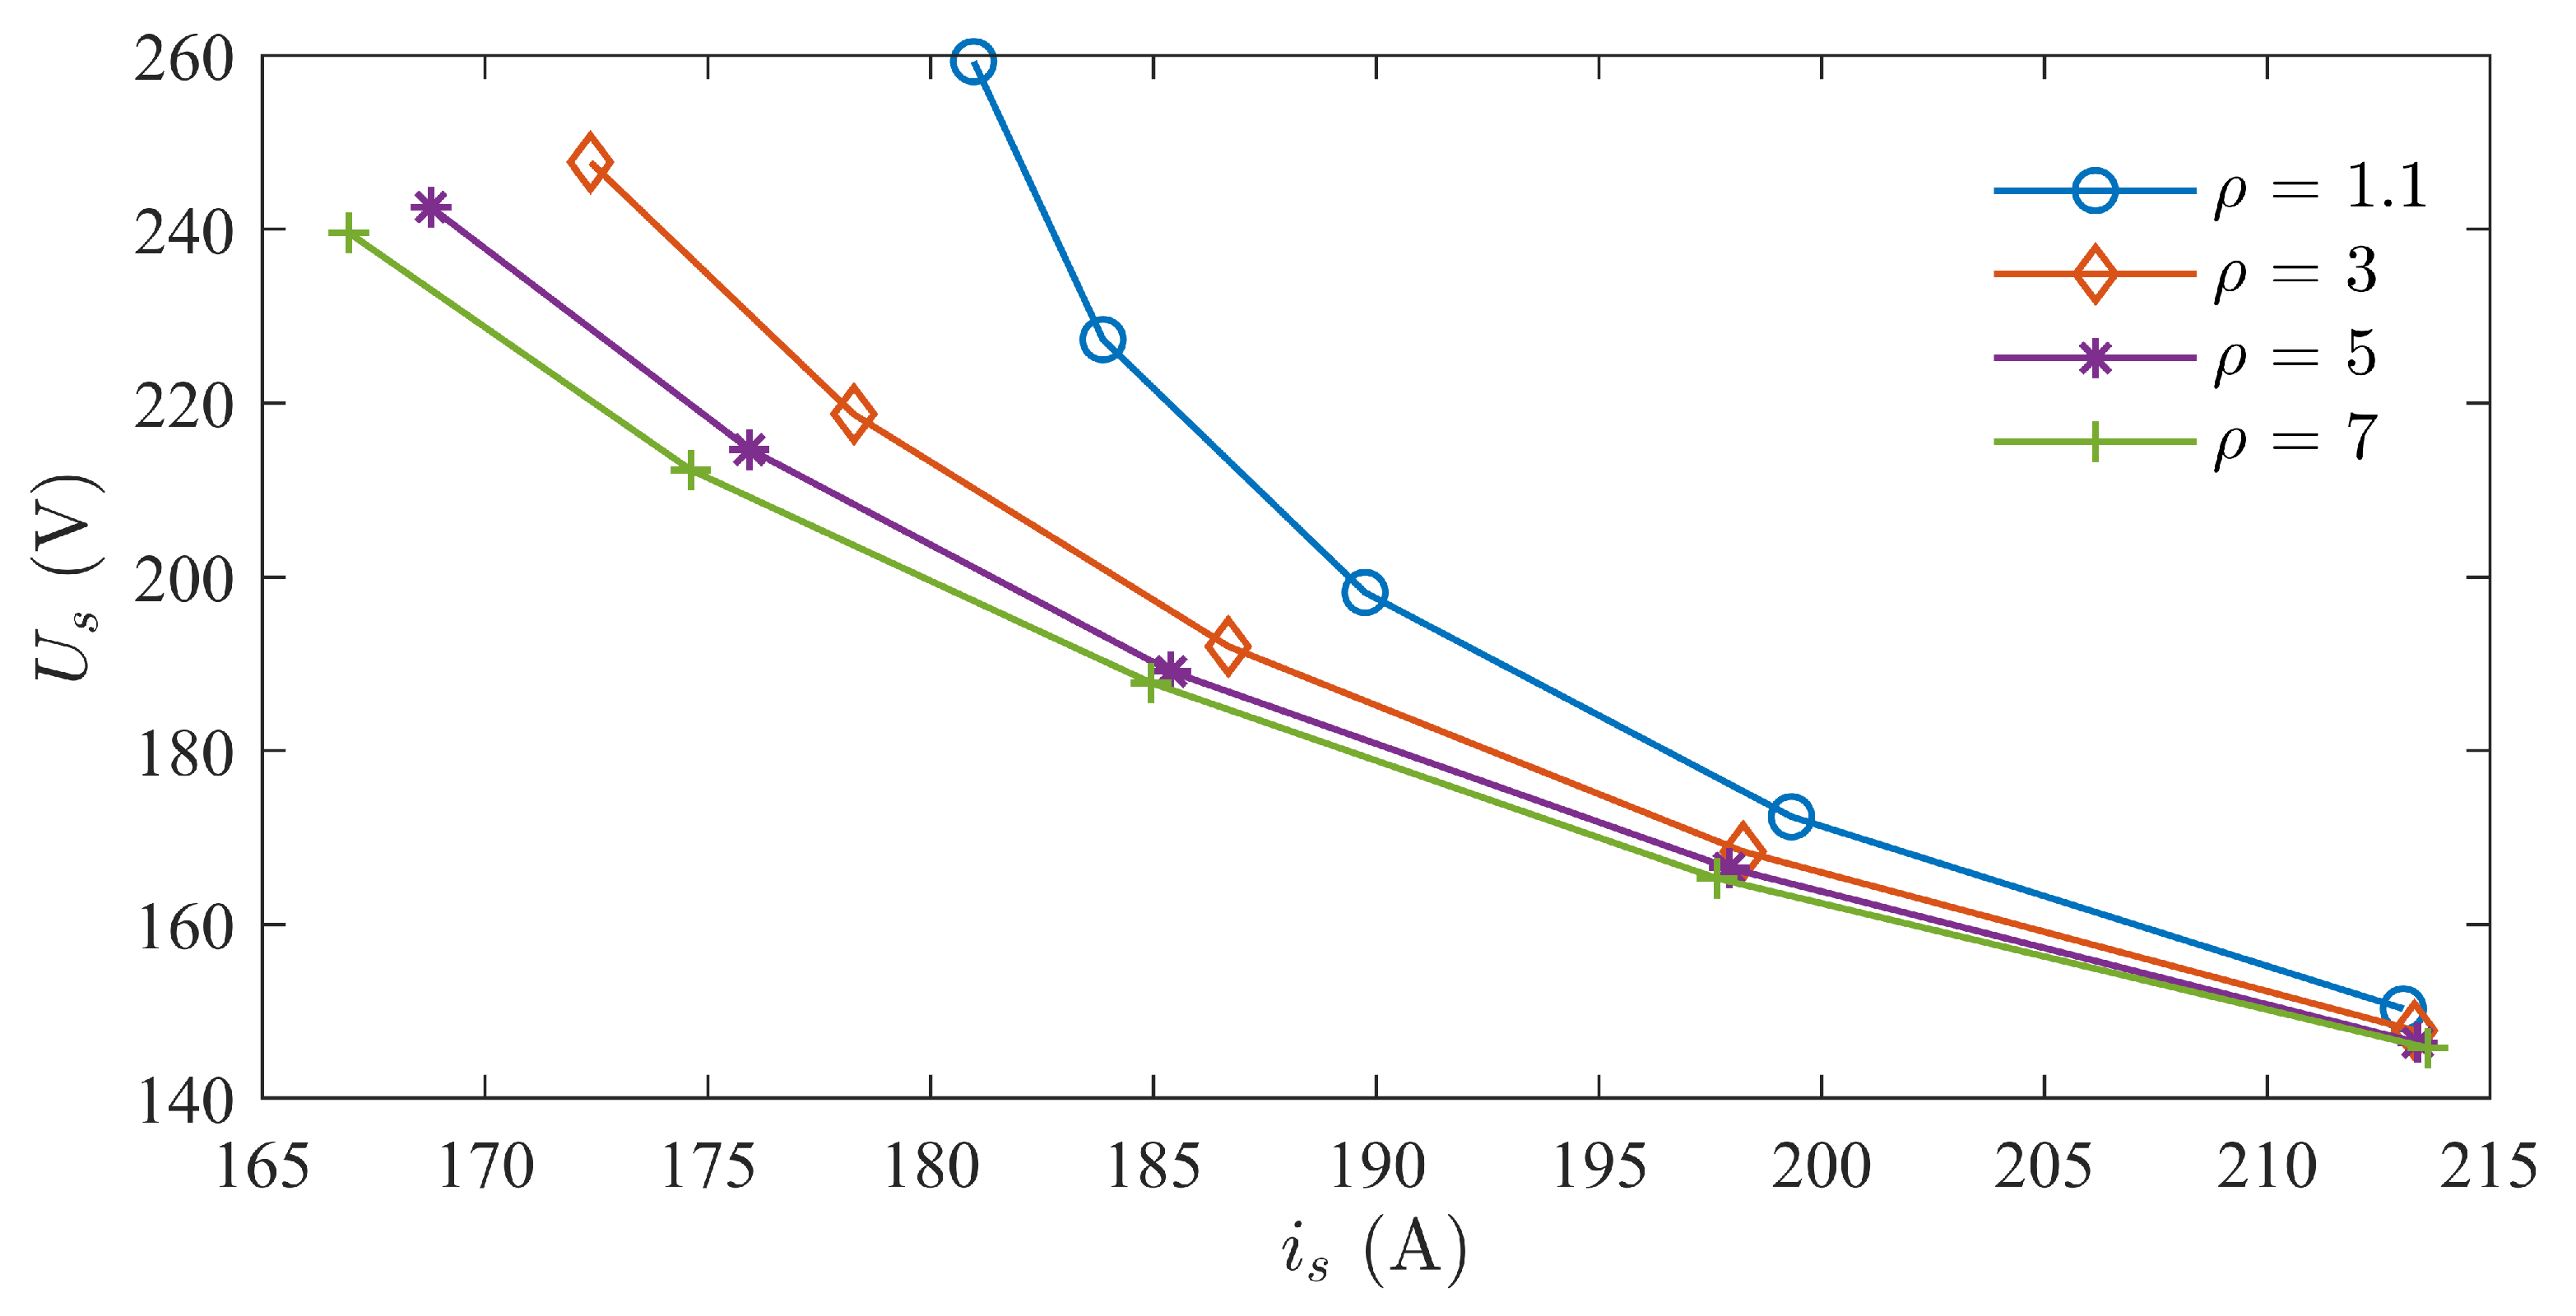
3.3. Analysis of Parameter Matching under MTPA Control Strategy

The selection of optimal parameter matching under MTPA current control strategy is crucial. Through the above analysis, the motor voltage and current states are obtained, and based on their distribution patterns, the optimal matching of back-EMF and saliency ratio can be determined. The voltage and current contour lines on the entire plane are divided into four regions, with the horizontal dividing line selected as the curve with the lowest voltage and the vertical dividing line selected as the line tangent to the 380 V voltage contour, as shown in Figure 13. The plane is divided into four regions, labeled as ➀ ➁ ➂ ➃.
Region ➀ has relatively low back-EMF and a high saliency ratio, with high voltage and low current.
A lower back-EMF requires fewer permanent magnets, resulting in lower motor costs. However, a higher saliency ratio imposes relatively higher structural and manufacturing requirements on the motor. Despite the lower current, the high voltage in this region may easily exceed the voltage limit.
Region ➁ exhibits higher back-EMF and saliency ratio with the lowest current and higher voltage. While the high back-EMF requires more permanent magnets, leading to higher motor costs, the high saliency ratio and associated manufacturing complexities pose challenges. Although this region features the lowest current, its advantages are offset by high costs, manufacturing complexities, and the risk of exceeding voltage limits.
Region ➂ demonstrates higher back-EMF with smaller saliency ratio, relatively smaller current, and lower voltage. While this region offers better motor performance with lower manufacturing complexities, the increased usage of permanent magnets leads to higher costs.
Region ➃ shows lower back-EMF and smaller saliency ratio with the highest current and lower voltage. Despite the lower usage of permanent magnets and lower manufacturing complexities, the high operating current in this region may not meet the motor’s performance requirements. Moreover, considering the effects of saturation, achieving the required torque might be challenging.
Considering the above analysis, Region ➃ exhibits an excessively high operating current, failing to meet the motor’s performance requirements. Region ➁, with its high costs, manufacturing complexities, and high voltage, is challenging to overcome. Therefore, neither Region ➁ nor Region ➃ are suitable parameter-matching regions. Region ➂, with its lower current, voltage meeting the voltage limit requirement, and lower manufacturing complexities, appears to be a better parameter-matching region from a performance perspective. However, the increased usage of permanent magnets and higher costs present challenges, making it not the optimal state pursued for permanent magnet-assisted synchronous reluctance motors.
Looking at Region ➀, with fewer permanent magnets, lower costs, and smaller current, it represents the targeted area for PMaSynRMs. If we can manufacture rotor laminations with higher saliency ratios within our existing manufacturing capabilities, the only remaining issue would be the high voltage. There are two potential solutions: Firstly, increasing the limit voltage of the inverter to enable the motor to operate normally. However, this method is only feasible for customization and may not be applicable to general industrial motors. Secondly, stopping operating the motor under the MTPA state to meet the voltage limit requirements, which would result in increased operating current. Figure 13b indicates that this region has relatively smaller currents, providing some room for current increase. If this method proves feasible, it could facilitate the application of general industrial motors.

4. Optimal Parameter Matching of PMaSynRM under Vector Control Strategy

4.1. Analysis of Operating States under MTPV Control Strategy

Under MTPA control, Region ➀ exhibits excessively high operating voltage. Analyzing the voltage and current states under MTPV control, as shown in Figure 14, Figure 15 and Figure 16. The higher the saliency ratio, the lower the voltage at the same current, making it less prone to overvoltage during motor operation. Overall, within Region ➀, under the MTPV control strategy, the motor operates at low voltage and high current. Although it is not an ideal operating state, it indicates the existence of non-overvoltage operating states within Region ➀.

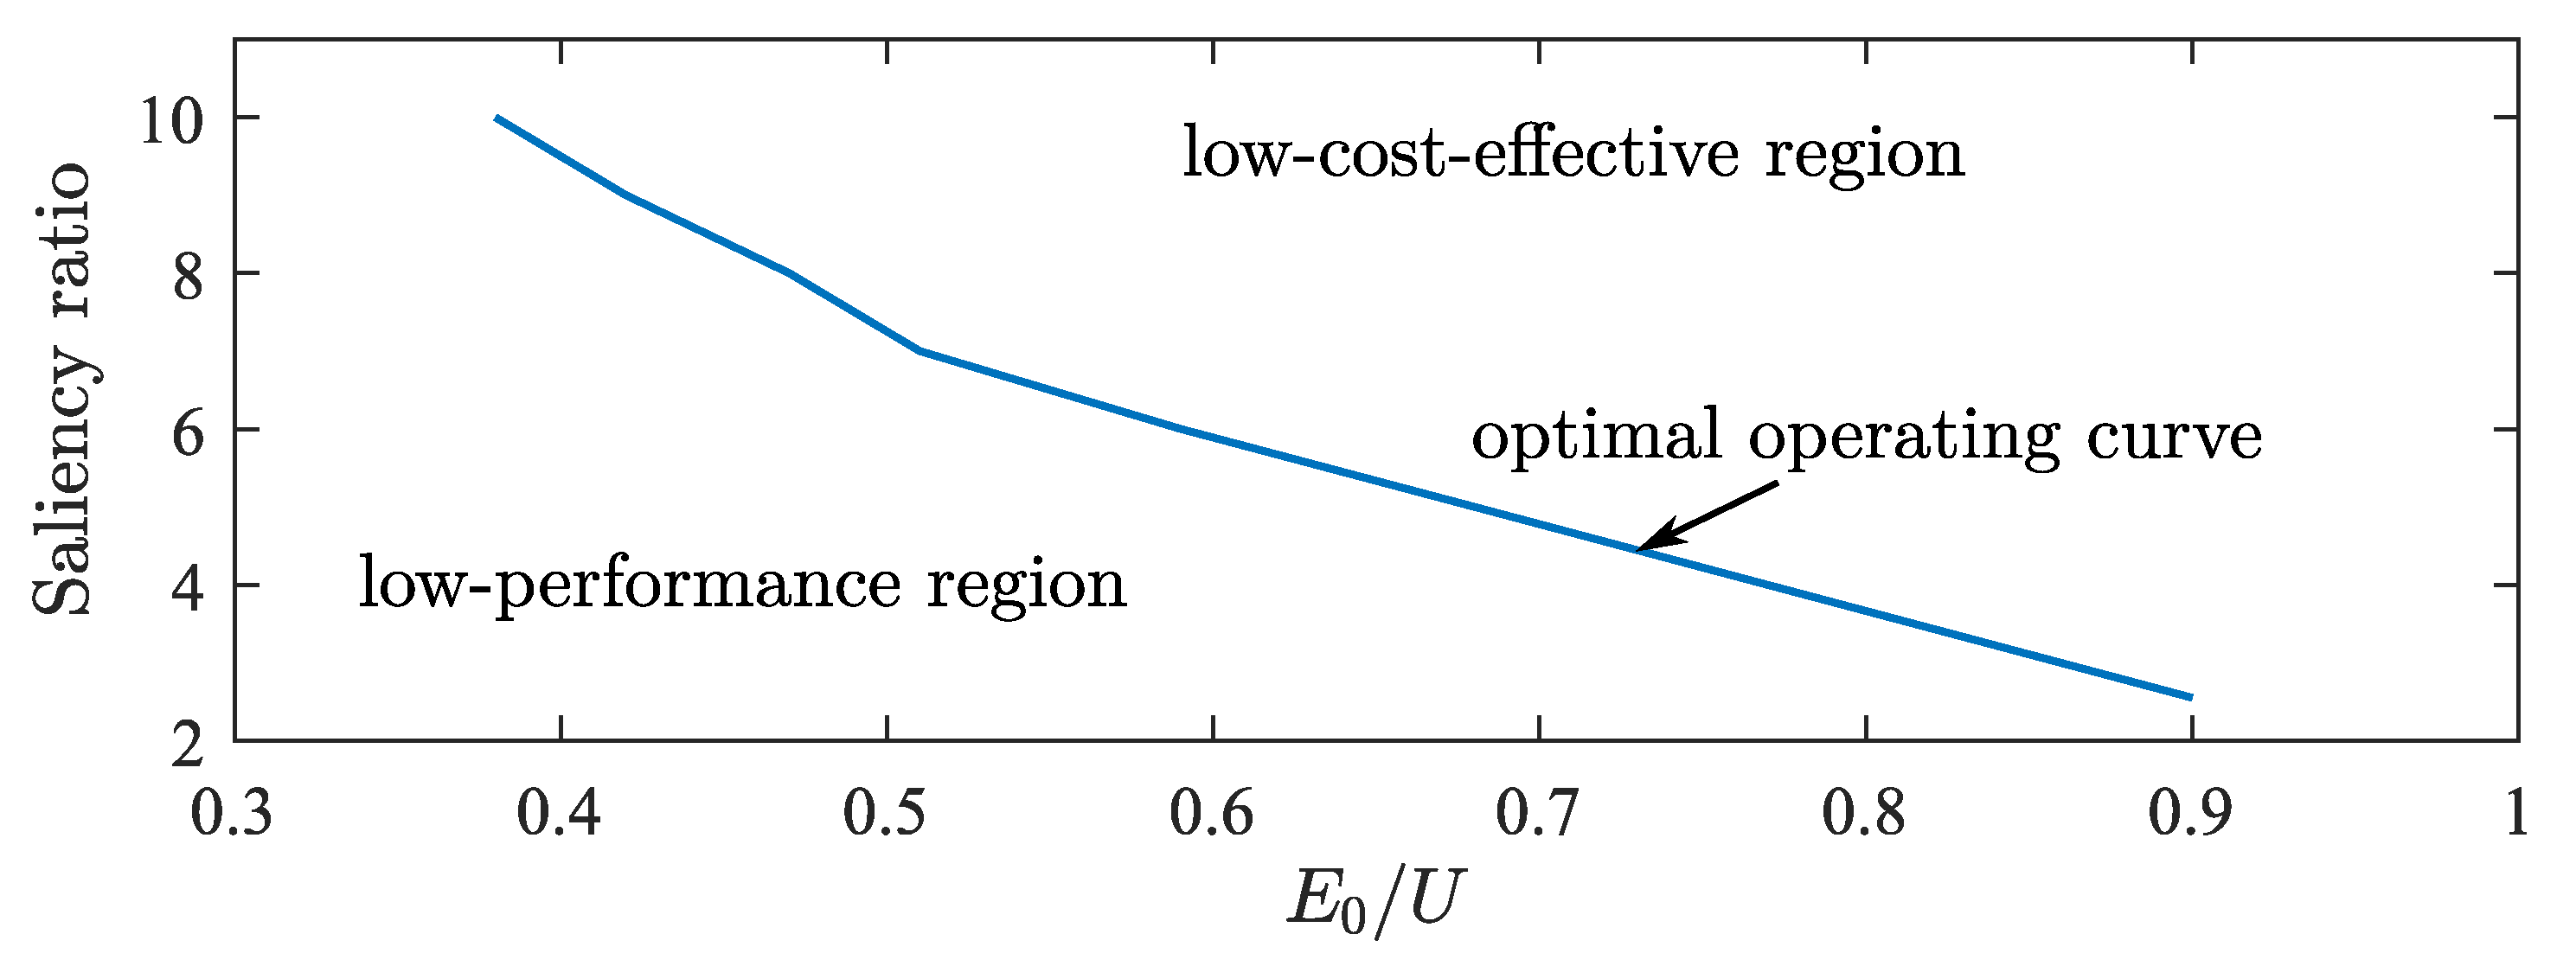
4.2. Optimal Parameter-Matching Curve under Vector Control
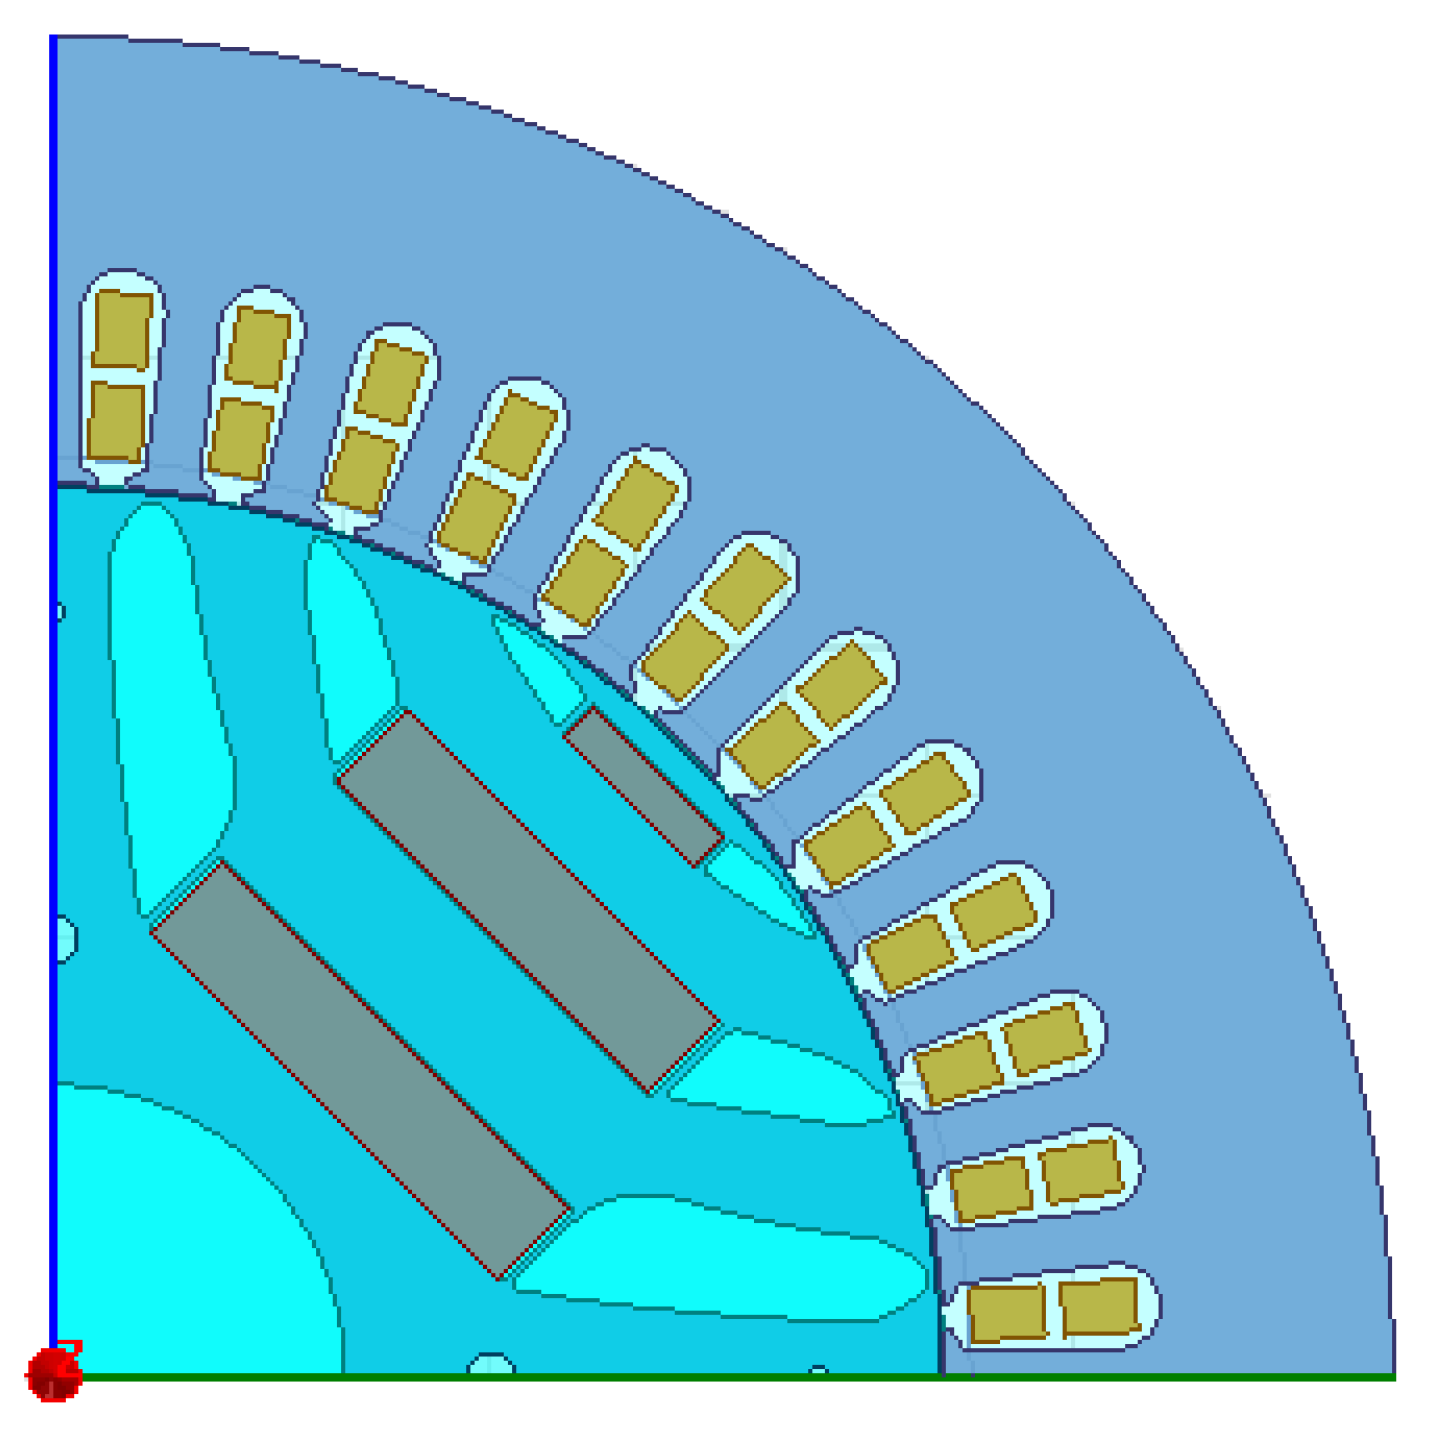
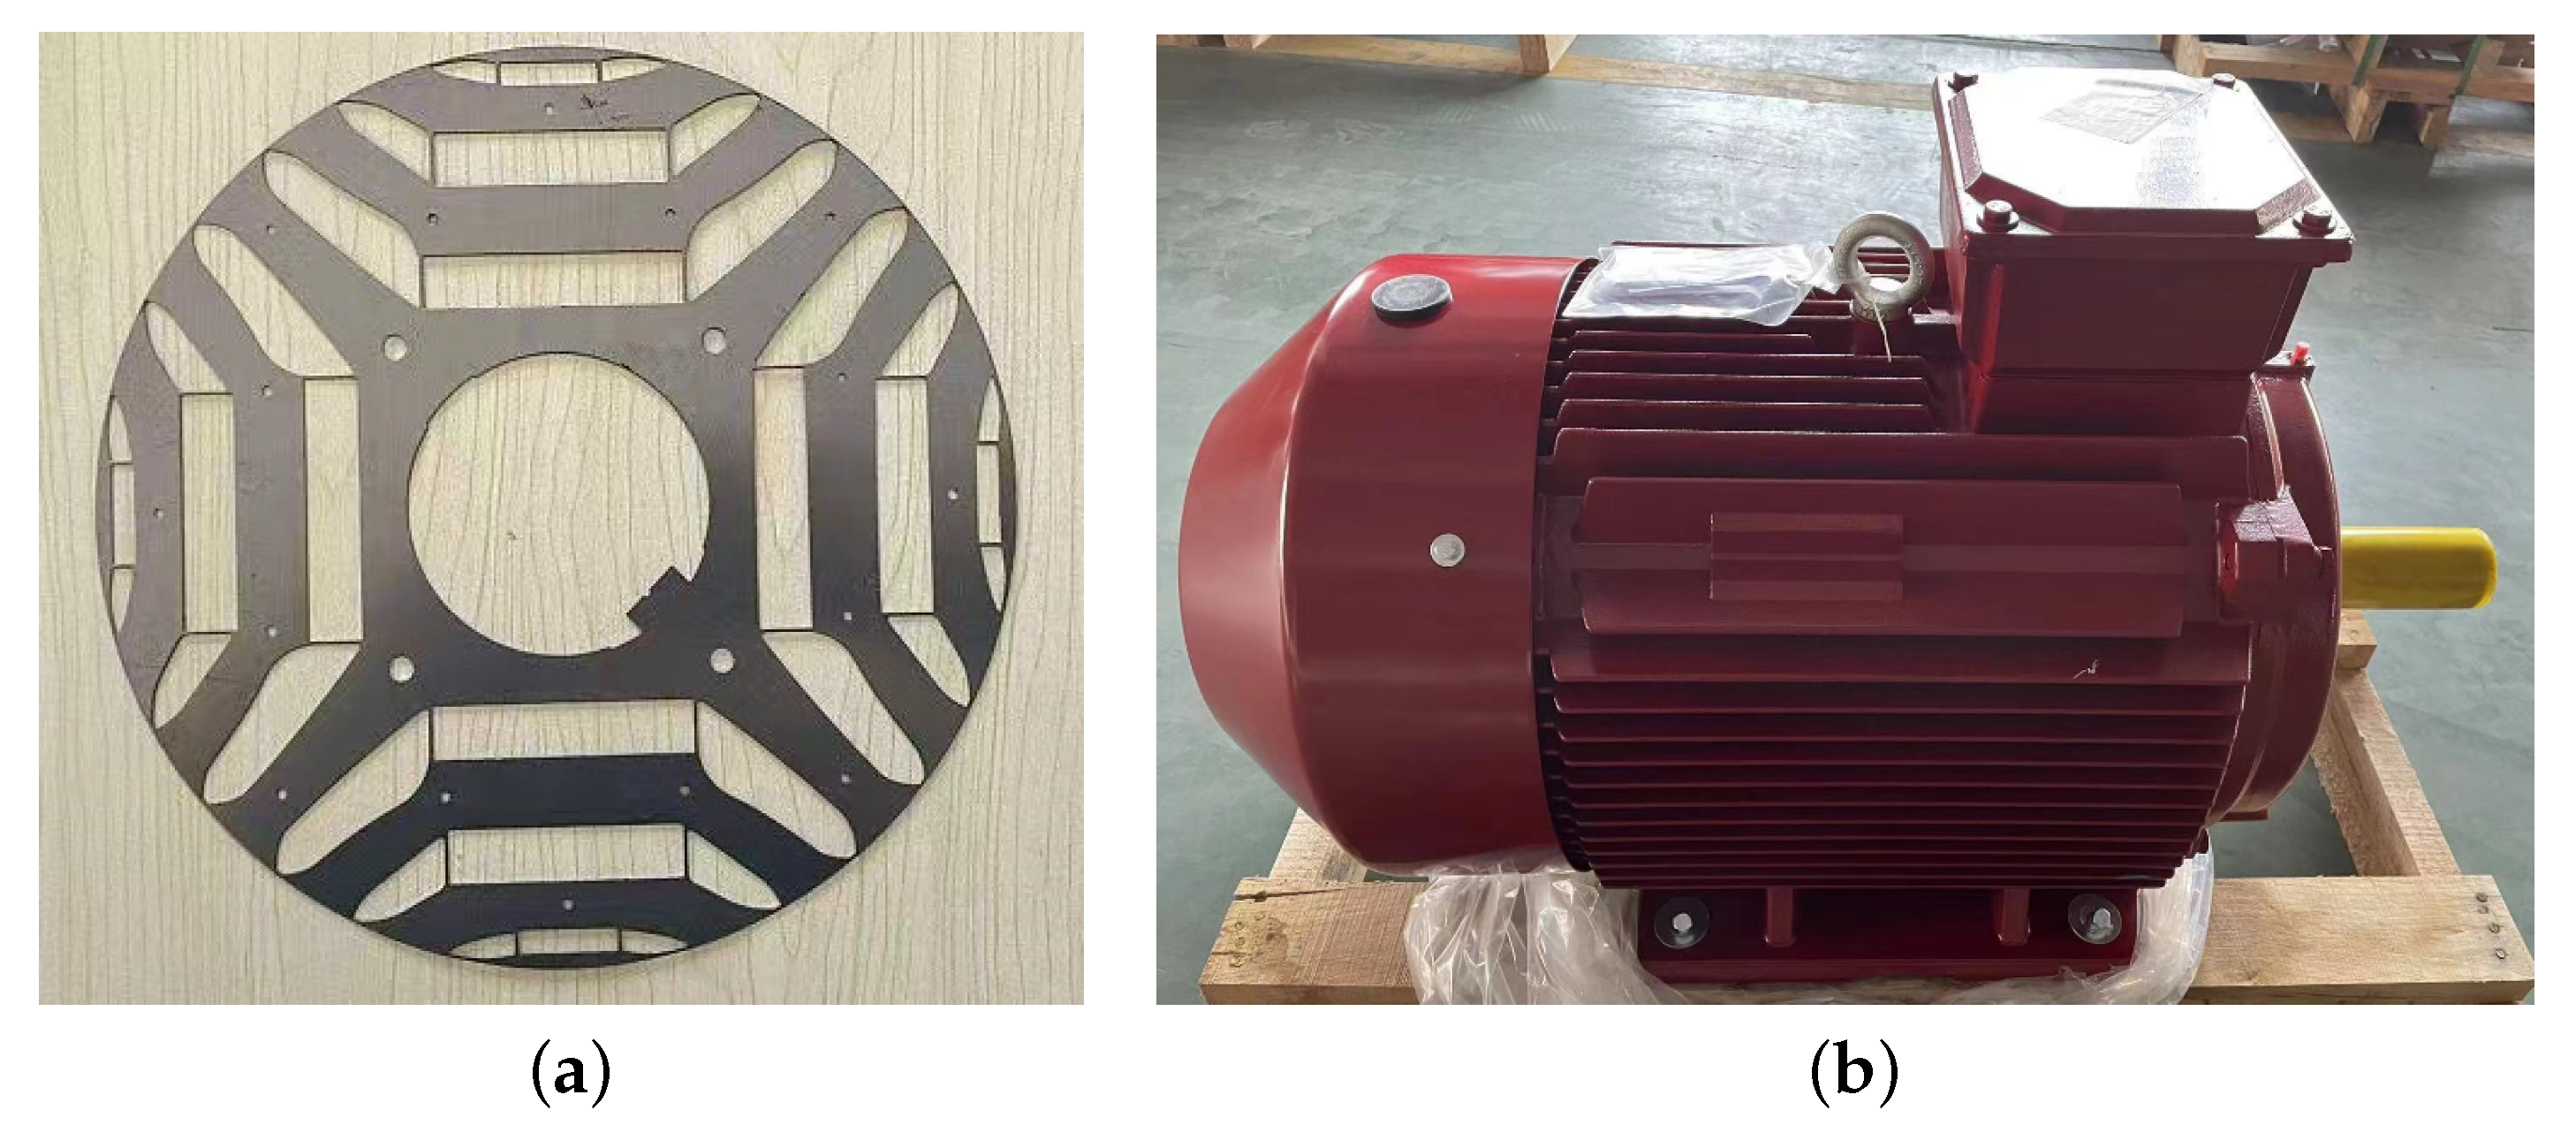
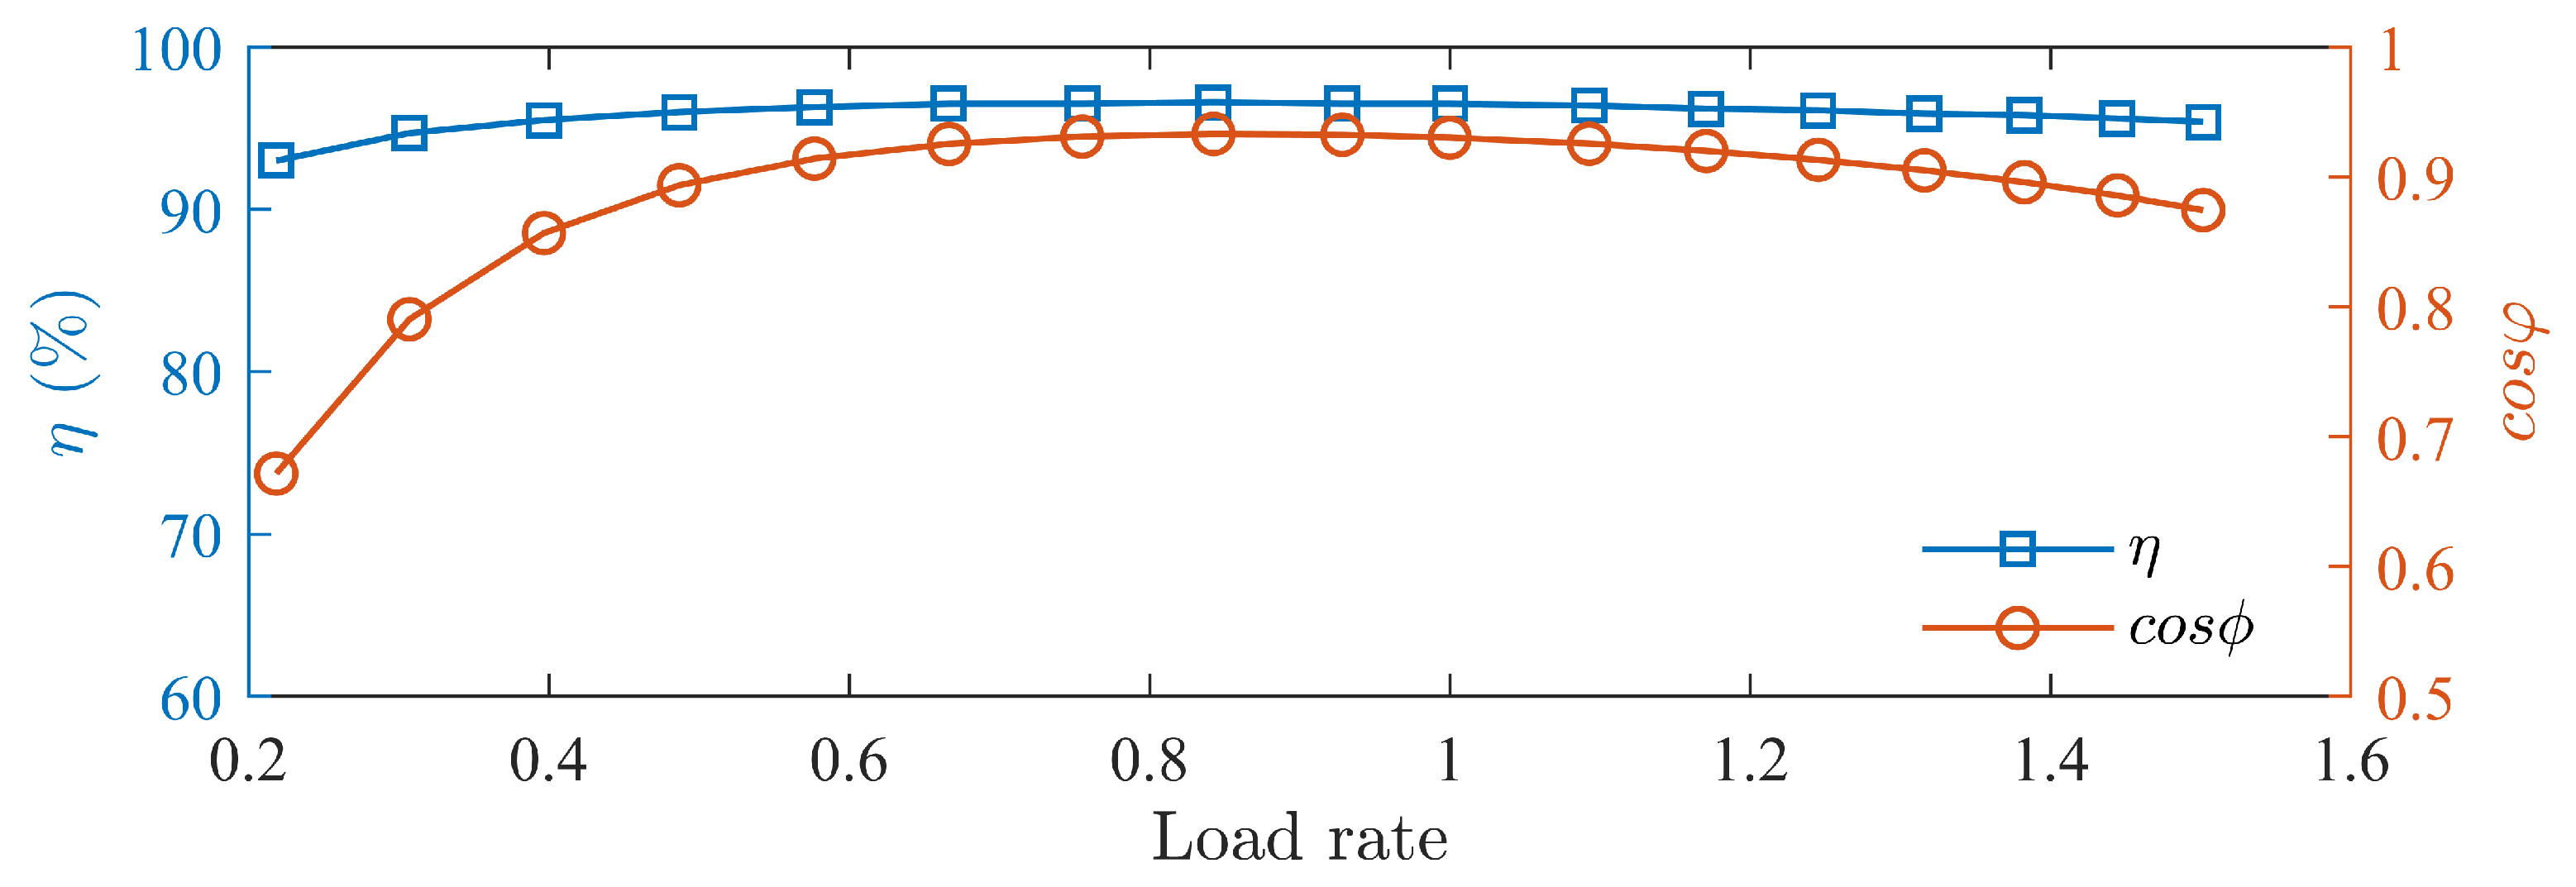
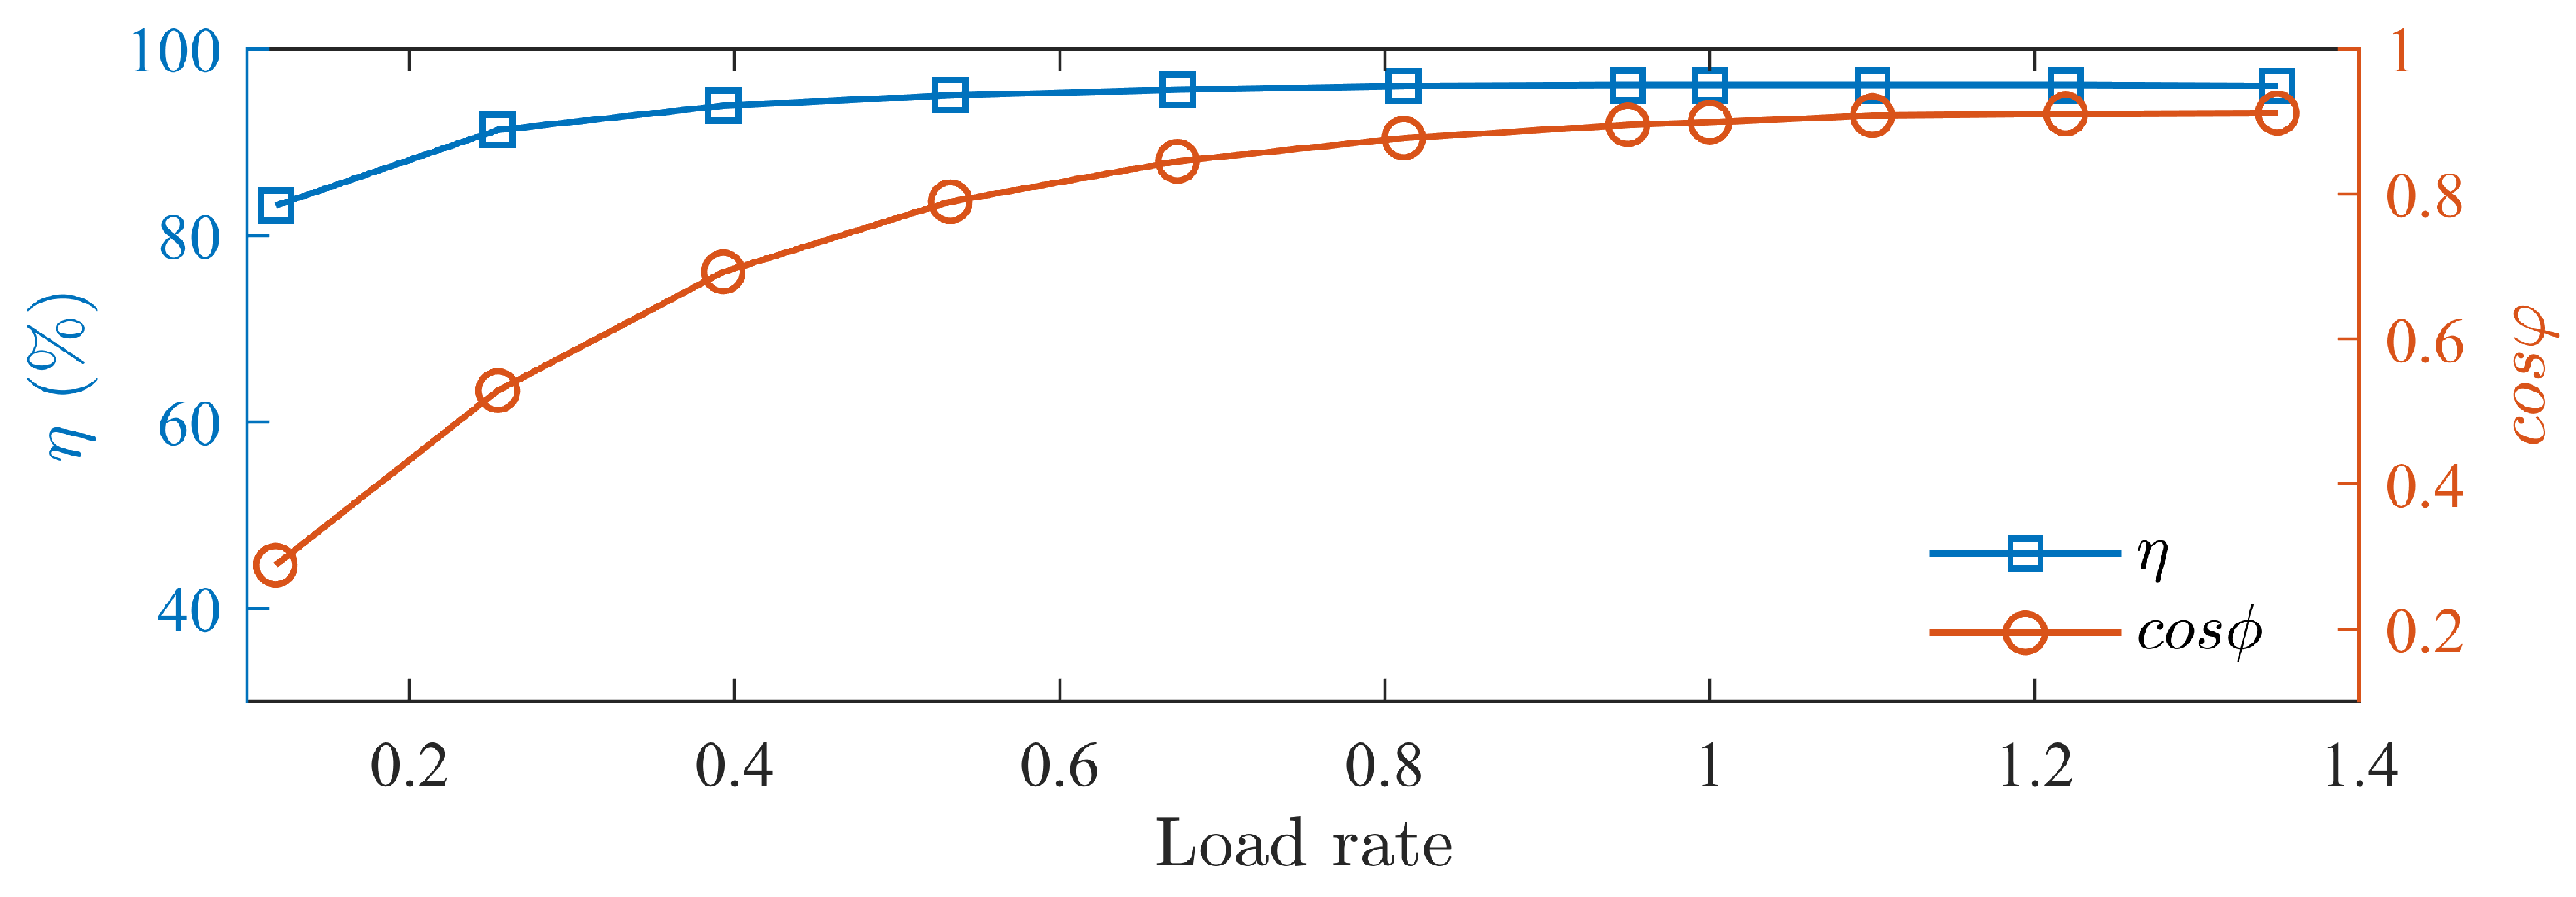
It is explained that there exist operating states between the MTPV control strategy and the MTPA control strategy that satisfy the limit voltage, as shown in Figure 17. From the figure, it can be observed that there is a significant space between the MTPA voltage ellipse and the MTPV voltage ellipse, including many voltage states, among which the voltage limit exists. The intersection of the voltage ellipse and the torque curve represents the current at that voltage state.
It is indicated that under parameter matching in Region ➀, operation at the voltage limit state is feasible. Furthermore, whether parameter matching in Region ➀ is desirable depends on whether the current level under operation at the voltage limit state can reach the current level in Region ➂.
Following is the further analysis of the limit voltage operating state in Region ➀. Firstly, the optimal operating state in Region ➂ is selected as the reference target, with E 0 / U = 0.9 and ρ = 2.55 on the 380 V contour considered the optimal operating state in Region ➂. By calculating the motor characteristics under different parameter matchings in Region ➀ at 380 V voltage state, points where the current reaches the optimal operating state in Region ➂ are found, and the specific operating states of these points are as follows.
Overall, the power angle is less than 90°, and the voltage vector is in the second quadrant. The trend of the power angle varies inconsistently with the changes in saliency ratio and back-EMF. The power angle decreases as the back-EMF increases and increases with the increase in saliency ratio (Figure 18).
The current phase angle ranges mostly below 160°, and the current vector is in the second quadrant. When the saliency ratio is large and the back-EMF is small, the current phase angle exceeds 135°, deviating from the trajectory of maximum torque ratio current, and the current increases. This is to avoid the motor voltage exceeding the voltage limit, caused by changes in the magnitude and angle of the current vector. The current phase angle decreases as the back-EMF increases and increases with the increase in saliency ratio. It can be foreseen that with the continued increase in the saliency ratio, the current phase angle will gradually increase until it approaches 180°. Therefore, as the saliency ratio increases, the magnitude of the increase in current phase angle is not consistent. When the saliency ratio is small, the magnitude of the increase in current phase angle is larger, while when the saliency ratio is large, the magnitude of the increase in current angle is smaller. The list of currents for the aforementioned points is presented in Table 1. It can be observed that the currents at these points are generally comparable to the point with E 0 / U = 0.9 and ρ = 2.55.
On the plane of back-EMF and saliency ratio, points with the same operating characteristics mentioned above are connected into curves, as shown in Figure 19.
From the figure, the upper right part represents the low-cost-effective region, while the lower left part represents the low-performance region, separated by a curve. Points on the curve represent the optimal parameter matching state. The low-performance region fails to meet the requirements of high-quality motors and is not a desirable parameter matching state. The low-cost-effective region requires more material and process costs and is also not a desirable parameter-matching state. Meanwhile, as the low-cost-effective region gradually shifts to the right, the performance will gradually decrease after reaching the theoretical optimum, making it even more uneconomical to enter this region. On the optimal operating curve, towards the lower right, the saliency ratio is smaller, and the back-EMF is higher, approaching traditional PMSM. As the saliency ratio increases towards the upper left, the back-EMF gradually decreases. When the saliency ratio is 7, the normalized value of back-EMF is around 0.5, entering Region ➀, significantly reducing the cost of permanent magnet materials. With further increases in the saliency ratio, the amount of permanent magnet material is further reduced. The application of ferrite can further reduce costs, but its magnetic energy product is small, and its remanence is low, making it more suitable when the saliency ratio is above 9.

5. Results

Based on the analysis above of a 45 kW PMaSynRM, the motor’s specifications are listed in Table 2, with its lamination structure shown in Figure 20. The no-load air-gap flux density waveform is shown in Figure 21a, along with the d-q axis inductance curves in Figure 21b.
The flux density waveform has a stepped shape, with a peak close to 0.2 T, which is significantly smaller compared to that of a PMSM. The permanent magnet torque is very small, with the reluctance torque being the main driving torque of the motor. As the current increases, both the d- and q-axis inductances decrease, with the quadrature axis inductance showing a large variation and significantly affected by core saturation. From the graph, it is evident that the motor’s saliency ratio can reach above 9 under full load conditions.
An analysis of the torque composition at rated conditions of the motor is conducted. The permanent magnet torque accounts for 17% of the total torque, while the reluctance torque constitutes 83%, primarily providing the driving torque.
Following the design and manufacturing, a prototype is manufactured as shown in Figure 22.
Experimental setup is depicted in Figure 23. The test motor is connected to a torque sensor and a load machine for testing its performance under various speeds and loads.
Load tests of the prototype is conducted, measuring the prototype’s efficiency and power factor curves at different speed as shown in Figure 24, Figure 25 and Figure 26. The motor’s efficiency reaches 96.5%, achieving an IE5 energy efficiency level.

6. Conclusions

This paper analyzes the impact of parameter matching on the steady-state characteristics of a PMaSynRM under vector control, summarizing its features and patterns. Based on this, a 45 kW prototype was designed, manufactured, and tested, achieving a high energy efficiency level, while also achieving the goal of not using rare-earth materials, thus reducing the cost of the motor. Specific conclusions are as follows:
Starting from the mathematical model of the motor under the MTPA control strategy, it was derived and analyzed that there is a corresponding relationship between the amplitude and phase of voltage and current, closely related to the parameters E 0 / U and saliency ratio ρ . It was found that under different parameter matchings of MTPA control strategy, there exists a lowest voltage curve, with the corresponding back-EMF near 0.5 times the rated voltage. Operating voltages will be higher on either side of this. A higher saliency ratio with lower back-EMF results in a higher operating voltage.
The correspondence between voltage and current under MTPV control strategy was analyzed. It was found that under MTPV control, the higher the saliency ratio, the lower the operating voltage at the same current, staying below the limit voltage. This proves that there is a margin between MTPA and MTPV controls, allowing for a high saliency ratio and low back-EMF parameter matchings to operate without over-voltage. On this basis, the optimal parameter match curve for vector control was obtained. A 45 kW prototype is then designed, manufactured, and tested, achieving IE5 efficiency, and effectively reducing the cost of the motor.

Author Contributions

Conceptualization, Y.-H.L. and J.W.; methodology, Y.-H.L. and J.W.; software, Y.-H.L. and J.W.; validation, Y.-H.L. and J.W.; formal analysis, Y.-H.L.; investigation, Y.-H.L.; resources, Y.-H.L.; data curation, Y.-H.L.; writing—original draft preparation, Y.-H.L.; writing—review and editing, W.-J.W.; visualization, Y.-H.L. and W.-J.W.; supervision, J.W. All authors have read and agreed to the published version of the manuscript.

Funding

This research received no external funding.

Data Availability Statement

The data presented in this study are available on request from the corresponding author. The data are not publicly available due to privacy.

Conflicts of Interest

Author Yu-Hua Lan was employed by Jiang Chao Motor Technology Co., Ltd. The remaining authors declare that the research was conducted in the absence of any commercial or financial relationships that could be construed as a potential conflict of interest.

References

  1. Zhang, J.; Zhu, D.; Jian, W.; Hu, W.; Peng, G.; Chen, Y.; Wang, Z. Fractional Order Complementary Non-Singular Terminal Sliding Mode Control of PMSM Based on Neural Network. Int. J. Automot. Technol. 2024, 25, 213–224. [Google Scholar] [CrossRef]
  2. Zhang, J.; Chen, Y.; Gao, Y.; Wang, Z.; Peng, G. Cascade ADRC Speed Control Base on FCS-MPC for Permanent Magnet Synchronous Motor. J. Circuits Syst. Comput. 2021, 30, 2150202. [Google Scholar] [CrossRef]
  3. Sun, Q.; Lyu, G.; Liu, X.; Niu, F.; Gan, C. Virtual Current Compensation-Based Quasi-Sinusoidal-Wave Excitation Scheme for Switched Reluctance Motor Drives. IEEE Trans. Ind. Electron. 2023, 1–11. [Google Scholar] [CrossRef]
  4. Lu, Y.; Li, J.; Xu, H.; Yang, K.; Xiong, F.; Qu, R.; Sun, J. Comparative study on vibration behaviors of permanent magnet assisted synchronous reluctance machines with different rotor topologies. IEEE Trans. Ind. Appl. 2021, 57, 1420–1428. [Google Scholar] [CrossRef]
  5. Xu, M.; Liu, G.; Chen, Q.; Ji, J.; Zhao, W. Design and optimization of a fault tolerant modular permanent magnet assisted synchronous reluctance motor with torque ripple minimization. IEEE Trans. Ind. Electron. 2020, 68, 8519–8530. [Google Scholar] [CrossRef]
  6. Guo, H.; He, X.; Xu, J.; Tian, W.; Sun, G.; Ju, L.; Li, D. Design of an aviation dual-three-phase high-power high-speed permanent magnet assisted synchronous reluctance starter-generator with antishort-circuit ability. IEEE Trans. Power Electron. 2022, 37, 12619–12635. [Google Scholar] [CrossRef]
  7. Gallicchio, G.; Di Nardo, M.; Palmieri, M.; Marfoli, A.; Degano, M.; Gerada, C.; Cupertino, F. High speed permanent magnet assisted synchronous reluctance machines—Part I: A general design approach. IEEE Trans. Energy Convers. 2022, 37, 2556–2566. [Google Scholar] [CrossRef]
  8. Di Nardo, M.; Gallicchio, G.; Palmieri, M.; Marfoli, A.; Degano, M.; Gerada, C.; Cupertino, F. High Speed Permanent Magnet Assisted Synchronous Reluctance Machines—Part II: Performance Boundaries. IEEE Trans. Energy Convers. 2022, 37, 2567–2577. [Google Scholar] [CrossRef]
  9. Michalski, T.D.; Romeral, J.L.; Mino-Aguilar, G. Open-Phase Faulty Five-Phase Permanent Magnet Assisted Synchronous Reluctance Motor Model With Stepped Skew. IEEE Trans. Magn. 2021, 57, 1–7. [Google Scholar] [CrossRef]
  10. Chai, W.; Yang, H.M.; Xing, F.; Kwon, B.I. Analysis and Design of a PM-Assisted Wound Rotor Synchronous Machine With Reluctance Torque Enhancement. IEEE Trans. Ind. Electron. 2021, 68, 2887–2897. [Google Scholar] [CrossRef]
  11. Maroufian, S.S.; Pillay, P. Design and Analysis of a Novel PM-Assisted Synchronous Reluctance Machine Topology With AlNiCo Magnets. IEEE Trans. Ind. Appl. 2019, 55, 4733–4742. [Google Scholar] [CrossRef]
  12. Huynh, T.A.; Hsieh, M.F.; Shih, K.J.; Kuo, H.F. An Investigation Into the Effect of PM Arrangements on PMa-SynRM Performance. IEEE Trans. Ind. Appl. 2018, 54, 5856–5868. [Google Scholar] [CrossRef]
  13. Baka, S.; Sashidhar, S.; Fernandes, B.G. Design of an Energy Efficient Line-Start Two-Pole Ferrite Assisted Synchronous Reluctance Motor for Water Pumps. IEEE Trans. Energy Convers. 2021, 36, 961–970. [Google Scholar] [CrossRef]
  14. Shen, J.X.; Cai, S.; Shao, H.; Hao, H. Evaluation of low-cost high-performance synchronous motors for ventilation application. In Proceedings of the 2015 International Conference on Sustainable Mobility Applications, Renewables and Technology (SMART), Kuwait City, Kuwait, 23–25 November 2015; pp. 1–6. [Google Scholar] [CrossRef]
  15. Wu, W.; Zhu, X.; Quan, L.; Du, Y.; Xiang, Z.; Zhu, X. Design and Analysis of a Hybrid Permanent Magnet Assisted Synchronous Reluctance Motor Considering Magnetic Saliency and PM Usage. IEEE Trans. Appl. Supercond. 2018, 28, 5200306. [Google Scholar] [CrossRef]
  16. Dong-liang, L.; Aqiang, L.; Wei, L.; Jian, W. Rotor optimization of permanent magnet-assisted synchronous reluctance motor for electric vehicles. Electr. Mach. Control 2022, 26, 119–129. [Google Scholar] [CrossRef]
  17. Yingqian, L.; Yi, S.; Yunchong, W.; Jianxin, S. A Hybrid PM-Assisted SynRM with Ferrite and Rare-Earth Magnets. Trans. China Electrotech. Soc. 2022, 37, 1145–1157. [Google Scholar] [CrossRef]
  18. Yi, S.; Shun, C.; Yingqian, L.; Yunchong, W.; Jianxin, S. Top-Level Design Pattern of PM-Assisted Synchronous Reluctance Machines. Trans. China Electrotech. Soc. 2022, 37, 2306–2318. [Google Scholar] [CrossRef]
  19. Korman, O.; Nardo, M.D.; Degano, M.; Gerada, C. A Novel Flux Barrier Parametrization for Synchronous Reluctance Machines. IEEE Trans. Energy Convers. 2022, 37, 675–684. [Google Scholar] [CrossRef]
  20. Credo, A.; Fabri, G.; Villani, M.; Popescu, M. Adopting the Topology Optimization in the Design of High-Speed Synchronous Reluctance Motors for Electric Vehicles. IEEE Trans. Ind. Appl. 2020, 56, 5429–5438. [Google Scholar] [CrossRef]
  21. Mohammadi, A.; Mirimani, S.M. Design of a Novel PM-Assisted Synchronous Reluctance Motor Topology Using V-Shape Permanent Magnets for Improvement of Torque Characteristic. IEEE Trans. Energy Convers. 2022, 37, 424–432. [Google Scholar] [CrossRef]
Figure 1. Torque trajectories of three types of motors: (a) torque trajectory of SynRM; (b) torque trajectory of PMaSynRM; (c) torque trajectory of PMaSynRM when power factor = 1.
Actuators 13 00198 g001
Figure 2. Variation of current phase angle under MTPA: (a) surface plot of current phase angle; (b) contour map of current phase angle.
Actuators 13 00198 g002
Figure 3. Variation of power angle under MTPA: (a) surface plot of power angle. (b) contour map of power angle.
Actuators 13 00198 g003
Figure 4. Variation of power factor under MTPA: (a) surface plot of power factor; (b) contour map of power factor.
Actuators 13 00198 g004
Figure 5. Variation in d-axis current under MTPA: (a) surface plot of d-axis current; (b) contour map of d-axis current.
Actuators 13 00198 g005
Figure 6. Variation in q-axis current under MTPA: (a) surface plot of q-axis current; (b) contour map of q-axis current.
Actuators 13 00198 g006
Figure 7. Changes in stator current under MTPA: (a) surface plot of stator current; (b) contour map of stator current.
Actuators 13 00198 g007
Figure 8. Changes in d-axis voltage under MTPA: (a) surface plot of d-axis voltage; (b) contour map of d-axis voltage.
Actuators 13 00198 g008
Figure 9. Variation of q-axis voltage under MTPA: (a) surface plot of q-axis voltage; (b) contour map of q-axis voltage.
Actuators 13 00198 g009
Figure 10. Variation of stator voltage under MTPA: (a) surface plot of stator voltage; (b) contour map of stator voltage.
Actuators 13 00198 g010
Figure 11. MTPA voltage–current curves under different saliency ratios.
Actuators 13 00198 g011
Figure 12. Minimum voltage curve under MTPA.
Actuators 13 00198 g012
Figure 13. Voltage and current contours under MTPA: (a) voltage contour under MTPA; (b) current contour under MTPA.
Actuators 13 00198 g013
Figure 14. Variation in stator current under MTPV: (a) surface plot of stator current; (b) contour plot of stator current.
Actuators 13 00198 g014
Figure 15. Variation in stator voltage under MTPV: (a) surface plot of stator voltage; (b) contour plot of stator voltage.
Actuators 13 00198 g015
Figure 16. MTPV voltage–current curve.
Actuators 13 00198 g016
Figure 17. Motor operating state diagram.
Actuators 13 00198 g017
Figure 18. Variation of MTPV stator voltage: (a) power angle curve; (b) current angle curve; (c) direct axis current curve; (d) quadrature axis current curve; (e) direct axis voltage curve; (f) quadrature axis voltage curve.
Actuators 13 00198 g018
Figure 19. Optimal parameter matching curve.
Actuators 13 00198 g019
Figure 20. Sketch of the designed PMaSynRM.
Actuators 13 00198 g020
Figure 21. Characteristics of the designed prototype: (a) no-load air-gap flux density waveform by finite element simulation; (b) motor inductance curves.
Actuators 13 00198 g021
Figure 22. Manufactured prototype: (a) rotor core; (b) prototype assembly.
Actuators 13 00198 g022
Figure 23. Experimental setup.
Actuators 13 00198 g023
Figure 24. Efficiency and power factor curves at 1500 rpm.
Actuators 13 00198 g024
Figure 25. Efficiency and power factor curves at 1200 rpm.
Actuators 13 00198 g025
Figure 26. Efficiency and power factor curves at 1800 rpm.
Actuators 13 00198 g026
Table 1. Comparison of stator current under different parameter matching.
ParameterStator Current/A
E 0 / U  = 0.9, ρ  = 2.5575.07
E 0 / U  = 0.68, ρ  = 574.75
E 0 / U  = 0.59, ρ  = 674.98
E 0 / U  = 0.51, ρ  = 775.16
E 0 / U  = 0.47, ρ  = 874.72
E 0 / U  = 0.42, ρ  = 974.76
E 0 / U  = 0.38, ρ  = 1074.57
Table 2. Main parameters of the prototype.
ParameterValue
Power45 kW
Speed1500 rpm
Number of poles4
Stator inner/outer diameter368 mm/245 mm
Number of stator slots48
Disclaimer/Publisher’s Note: The statements, opinions and data contained in all publications are solely those of the individual author(s) and contributor(s) and not of MDPI and/or the editor(s). MDPI and/or the editor(s) disclaim responsibility for any injury to people or property resulting from any ideas, methods, instructions or products referred to in the content.

