1. Introduction
With the rise of consumer-grade virtual reality (VR) systems, VR has become an increasingly popular tool not only for gaming and other leisure activities, but also for more serious applications such as training simulations, architectural planning, and healthcare [
1].
Regarding healthcare, VR can be used by both medical staff and patients. For example, students can use VR training games as an inexpensive low-risk learning procedure since no real patients are needed. VR can also be used to diagnose and visualise health problems, allowing medical staff to get a better perception of the shape of tumors, infections, and implants and visualize how these would fit into a patient [
2].
For patients, VR can be used to solve and diagnose psychological and physiological problems. When it comes to psychological problems such as schizophrenia, VR can create immersive environments that help patients with spatial navigation, facial recognition, memory problems, and socializing problems [
3]. Physiological VR uses consist of games for motivating patients with rehabilitation of either the upper limbs or lower limbs. These games can be assisted, having robotic arms and exoskeletons helping the patient to move their limbs, or unassisted games that can be performed anywhere, usually at home, without direct assistance of a robot or a therapist. These games usually record data on the patient’s performance so that the therapists can determine how well the rehabilitation is going [
4].
VR systems such as the Oculus Quest 1 and 2 and the HTC Vive make it possible to implement these types of games and experiences through tracking users’ head and hand movements and displaying virtual graphical content to them via a head-mounted display.
VR is typically used for serious games when a deep level of immersion is desired. Because these games are developed to be played in a variety of environments, such as in a clinic or unsupervised at home, it is important to make sure these systems are capable of precisely tracking the user’s movements in a variety of different conditions. It is also important to understand how clinical data gathered during gameplay might be affected by the tracking systems’ error levels.
The main objective of this work is to know how precise these systems are, as more precise systems allow not only for better quality data, and therefore a better diagnosis, but also for a more immersive environment.
To know what the best method of measuring this precision is, research was performed on the methods used for this kind of testing. This paper is organized into six sections.
Section 2 presents a description of some relevant studies in the area. In
Section 3, a testing system is developed and tested, with the results being presented in
Section 4.
Section 5 discusses the results obtained and, finally,
Section 6 shows the relevant conclusions and future work developments as well as the study limitations.
2. State of the Art
Research was carried out on the methods used for precision and accuracy measurement of various VR systems. Most of the works found tested the HTC Vive [
5,
6,
7,
8,
9] with the objective of validating this system for scientific research and medical purposes [
7,
8], but some also tested the Oculus headsets [
7,
10,
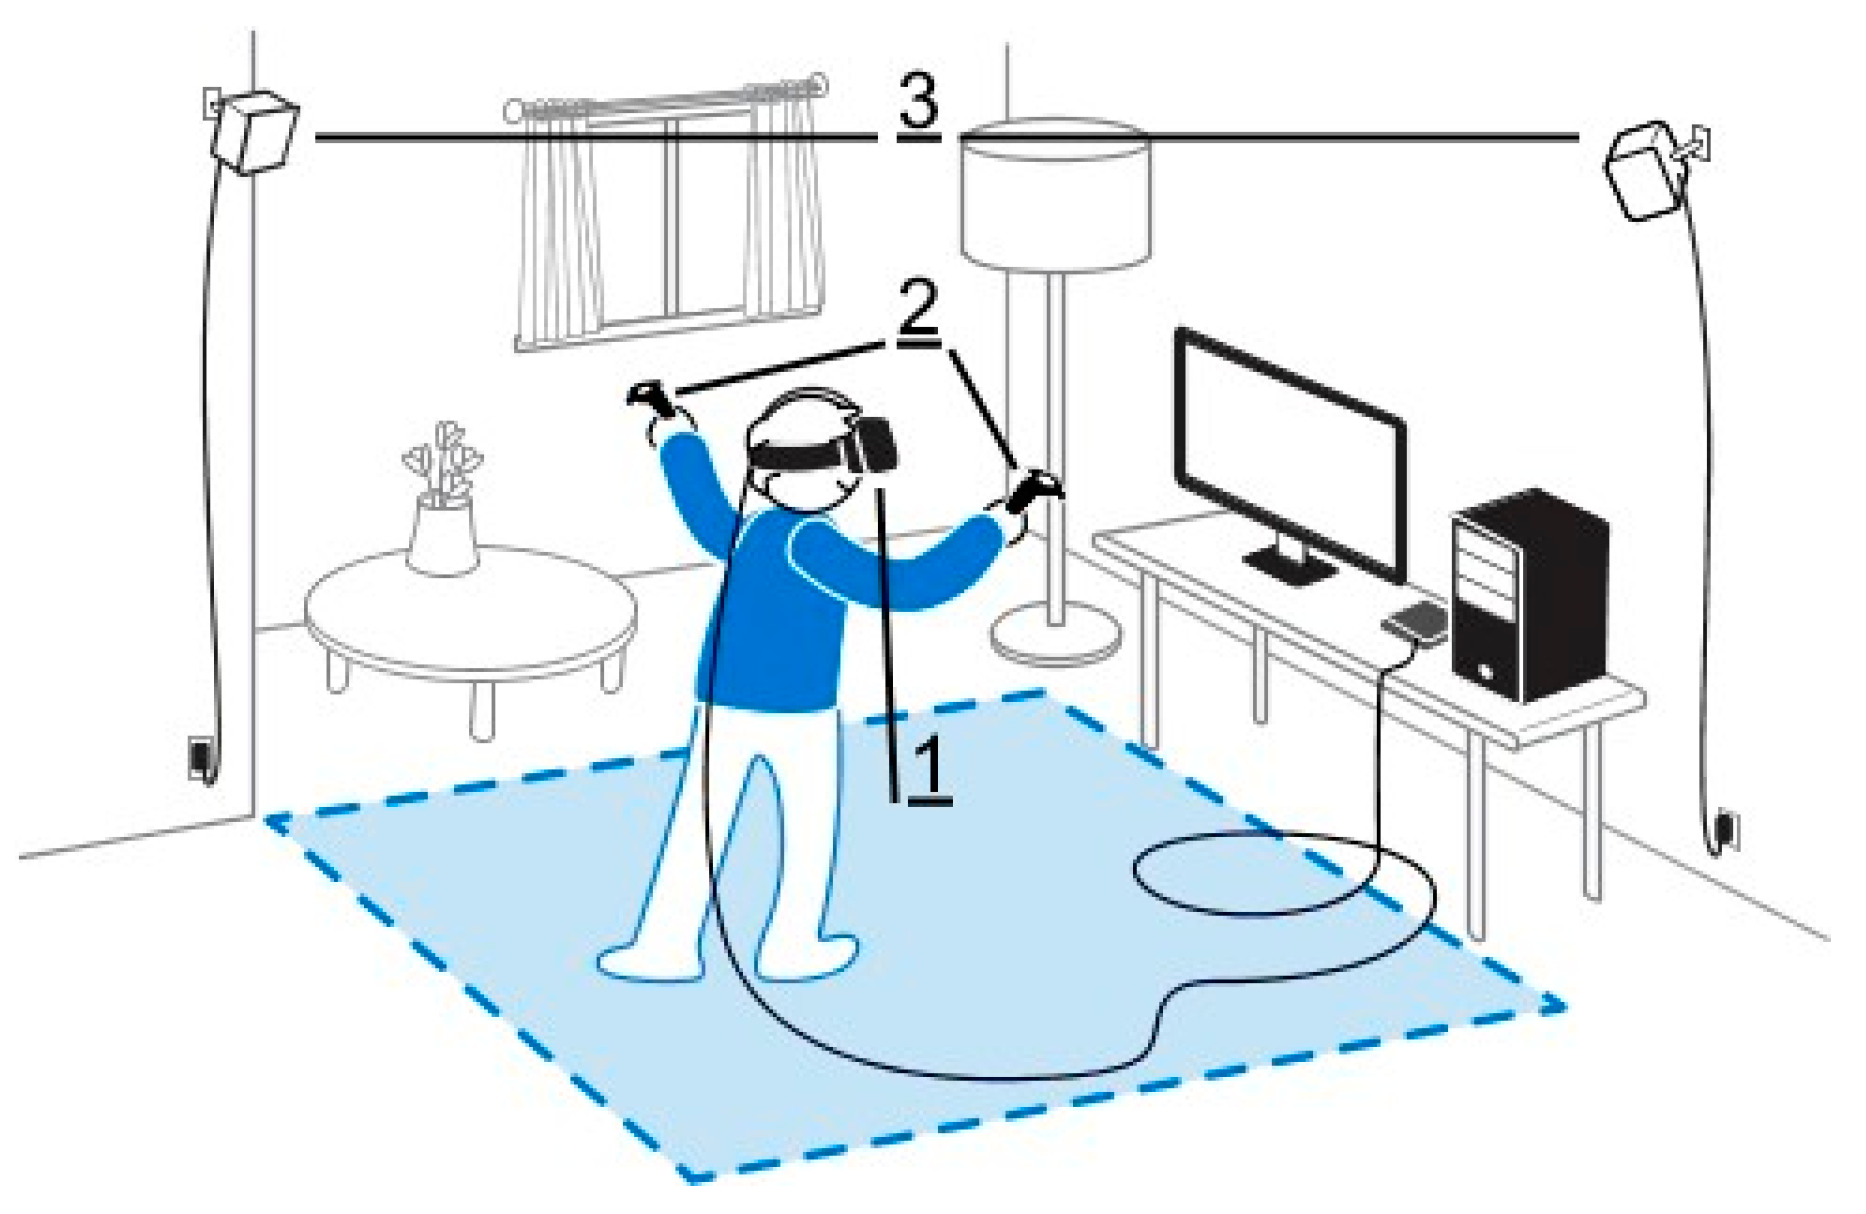
11]. The HTC Vive has three main components: a headset, trackers, and towers. The towers are usually placed in the corners of the room, and the trackers can either take the shape of a controller or a disk that can be attached to objects.
Figure 1 shows how the HTC Vive is set up in a regular room. The Oculus Quest system has only two components: a headset and two controllers.
Even though there are differences between each VR system, our literature review found that the precision-measuring procedures base themselves, essentially, in two methods of moving the headsets for data recording, either manually [
7,
8,
9,
11] or with robots [
5,
6,
10].
2.1. Manual Data Recording
In [
8], measurements were taken through drawing an 8 m × 4 m Cartesian grid on the leveled floor of an artificially lit room, with the grid lines each spaced 1 m apart. The towers were placed outside this grid, and their positions were changed for each test. The center of the grid was then calibrated through placing the headset in four different positions equally distant from the center. The headset was then mounted on a tripod and moved around this grid, being placed on all the grid points, recording its position on each of them and then comparing it to the position of the grid point. This test was then repeated but with the headset tilted 37.5° downwards to measure the rotation accuracy. It was found that HTC Vive uses a reference plane that is tilted away from true ground, causing incorrect measurements. The root mean square error of each grid point remained below 0.02 cm and 0.02°.
In [
3], the accuracy and precision of two tracking systems, HTC Vive’s SteamVR Tracking and Oculus Quest 2′s Oculus Insight, were compared. A 1 m spaced 5 m × 5 m grid was set up in a well-lit room. The HTC Vive trackers were placed on the corners of this grid. The Quest 2 and the HTC Vive trackers were mounted on a carriage. A Unity scene was created to record the data from both devices. The carriage was then moved from grid point to grid point, pausing 20 s at each one and collecting around 1000 measurements for each. The data gathered revealed that the Y coordinate position tracking of Oculus Quest 2 is superior to the SteamVR, with the mean squared height error for the HTC Vive being 0.007 m, while for the Quest 2, it was 0.001 m.
In [
9], the accuracy of the HTC Vive’s controller was compared to the Polhemus Liberty magnetic tracking system (an industry gold standard motion tracking system). The Vive sensor and the Liberty magnetic sensor were mounted on a board opposing one another; this plank was then mounted on a ball-and-socket fixture. This rig was stationed in the center of Vive’s tracking system and was rotated by increments ranging from 0° to 50°. The study does not mention any robots, so it is presumed this was done manually. The translational error between the systems was then calculated using the mean position of both systems in a 10 s interval. The rotational error was calculated using the helical angle of each system because these were not aligned. The mean rotational errors were below 0.4° and mean translational errors were below 3 mm.
Oculus Quest 2 had its translational and rotational accuracy evaluated by [
11]. Two structures capable of holding the controller were created; the first one allowed the controller to be placed on 12 fixed points along three axes, while the second allowed the controller to rotate around a point. The Qualisys OMC was used as a reference in the measurements. The translational accuracy was measured through placing the controller on each of the points and recording its position seven times for each point with the headset 200 mm away from the controller. The rotational accuracy was measured through rotating the controller in an interval ranging from 0° to 180°. 14 points were measured with the headset placed 700 mm away from the controller. To obtain the translational and rotational errors, the results were compared with the data obtained with Qualisys OMC. The translational errors ranged from 13.52 mm to 1.38 mm in the X axis, 9.74 mm to 0.55 mm in the Y axis, and 7.60 mm to 0.81 mm in the Z axis. The rotational errors ranged from 0.63° to 0.07° in the X axis, 0.50° to 0.08° in the Y axis, and 1.11° to 0.09° in the Z axis.
2.2. Robotized Data Recording
In [
10], the tracking capabilities of the Oculus Rift S were tested through mounting the device on a Universal Robots UR5 robotic arm, which has a precision of ±0.1 mm. Reflective markers were placed on the robot in order to track the headset’s rotation on the real world, with optoelectronic motion capture system cameras tracking their movements. A game made with Unity was then developed; this game saved the headset’s position and rotation data. The robot was then moved around at different speeds in each of the robot’s coordinate directions (X, Y, Z), and the results obtained from both tracking methods were compared, calculating the absolute distance between them. This was done not only for the headset, but the controller as well. It was concluded that Oculus Rift S is a good choice for assessing the rehabilitation progress of patients, since the system has good tracking and mobility, allowing for easy creation of virtual environments in different spaces. The mean translational error was 4.36 ± 2.91 mm for the controller and 1.66 ± 0.74 mm for the headset. The rotational error was 1.13 ± 1.23° for the controller and 0.34 ± 0.38° for the headset.
In [
6], the main objective was to use the HTC Vive to obtain the ground truth of an Astrobee flying robot. A custom tracking algorithm was developed for the HTC Vive to try to increase its tracking accuracy; these were then compared to one another. For each dataset, two setups were used to compare the tracking capabilities of each algorithm; in each of them, the tower placement was changed. First, the algorithms were tested on static positions, placing the headset 1–2 m away from the lighthouses and measuring their standard pose deviation. Then, they were tested again using the Astrobee robot, which floats on a flat surface, following a path generated on a plane. The tests performed have shown that the accuracy of Vive’s trackers range from millimetric to metric. It was also found that using the HTC Vive outside might prove to be challenging, as the sun’s radiation affects synchronization between lighthouses not using a cable. The standard deviation for the custom algorithm in static was 3.42 mm and 8.60 mm deviation for the tests performed with the robot. The outside experiments yielded 13.5 mm standard deviation for the position.
The accuracy and precision of Swept Angle Laser Tracking (SALT) and OptiTrack System were tested in [
5]. These were tested in a 12.00 m by 4.74 m room with closed shutters to simulate an operating suite. The cameras of the OptiTrack Flex 3 and Steam VR were placed in the room’s corners and shorter edges, respectively. A UR5 robot arm capable of precise movements and rotations was used to SALT’s and OptiTrack’s sensors as reference. Measurements were taken while the robot was in a resting position, with 200 samples taken at each measuring point. For measuring the accuracy of translation, the tool attached to the robot’ flange was moved 100 mm in each axis and then moved back to its original position. As for the accuracy of rotation, the tool attached to the robot’ flange was rotated 30° from its starting pose on each axis, while remaining on the same position; for the Z axis, it was rotated an additional 90°. The rotational mean square error for the rotation accuracy was below 1°, and for the translational accuracy, it was below 1 mm. Even though some manually tested exercises had a huge amount of data recorded, the data recording exercise was not repeated many times. Because of this, using robots seems to be the best way to test the accuracy of headsets, as they allow not only the repetition of exercises with high precision but function as the reference for comparing the data gathered.
3. Materials and Methods
In this section, we measure the rotation and position precision of the Oculus Quest 2 at different levels of illumination. This section details the equipment used in the measurements and how it was set up and calibrated.
3.1. Equipment
Developed by Facebook, the Oculus Quest 2 is a VR system comprised of a headpiece and two controllers. It is capable of running VR applications, whether or not it is connected to a computer, through using an internal android system [
13]. Quest 2 has three methods for obtaining data: inertial measurement units (IMUs), Oculus Insight, and infrared LEDs. An IMU can be found inside the headpiece and each controller, allowing the measurement of linear acceleration and rotational velocity of these devices. The Oculus Insight operates using 4 cameras to generate a 3D map of the room in real time and track the position of the controllers and hands. Each controller has infrared LEDs that allow the system to calculate the controller drift and adjust its position accordingly [
14].
None of the articles studied in the state of the art measure how different light intensities would influence the Oculus’ tracking system, and because Quest 2 uses LEDs for tracking the controllers, it is important to analyze this. The LT300 light meter from Extech Instruments was used to measure the illuminance (Lux) of the room at the start of each experiment.
The LBR iiwa 7 r800 is a robotic arm manufactured by KUKA and it is capable of rotating along 7 axes, has a reach of 800 mm, a rated payload of 7 kg, and can be mounted in any direction and has a repeatability of ±1 mm (measured using ISO 9283). This robot was chosen to obtain the ground truth of the conducted experiments because of its high degree of precision. It was also used to perform the movements of each testing exercise.
3.2. System Setup
A Unity project was developed with the objective of recording the controller’s position and rotation, robot’s flange position and rotation, as well as automatically moving the controller around according to the experimental procedure’s specifications and saving the data obtained.
The experimental procedure was performed in a 4.9 m × 4.4 m room.
To attach the controller to the robot flange, a special coupler was designed and 3D printed; it attaches to the ringlike structure of the controller and to the bottom of the flange. Small holes were placed all over the coupler, in the places where this would lock the controller’s LEDs.
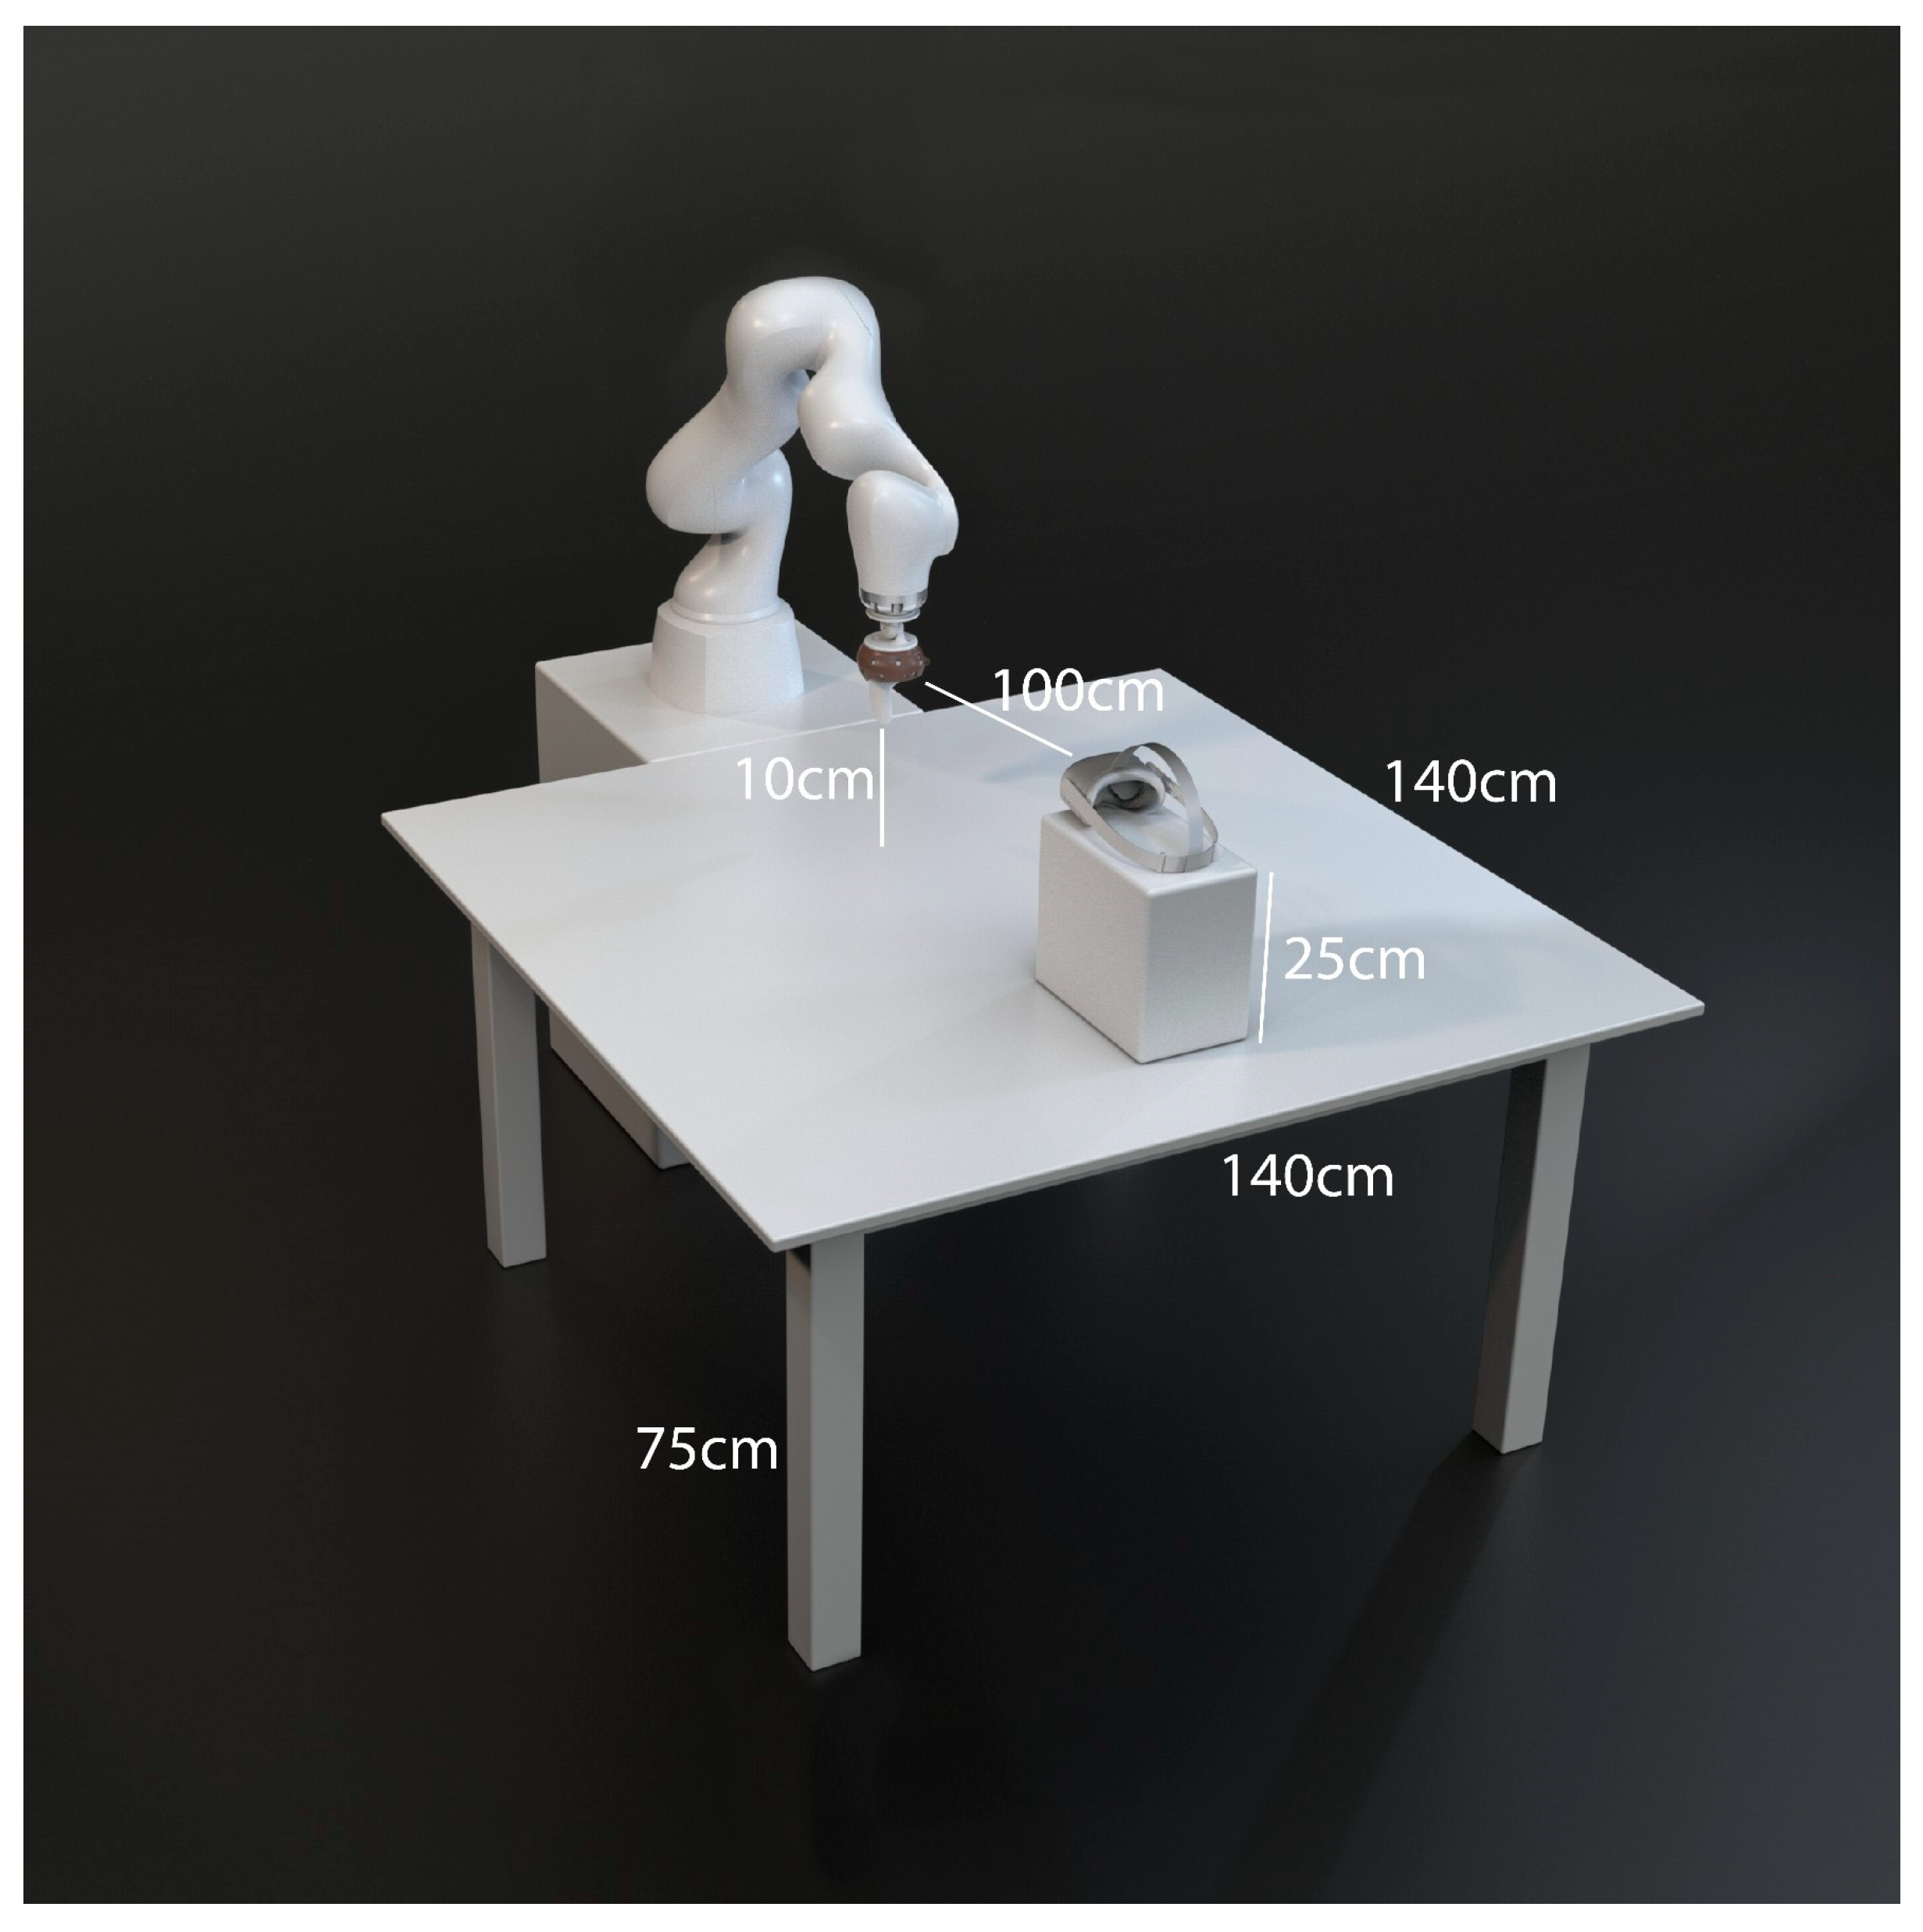
Two different setups were used. In the first, the robotic arm was mounted on a table with its base facing up and its arm bent over the table, with the flange facing downwards, parallel to the base. The headset was placed facing the controller, 1 m away from it and on its level. The LT300 light-meter was placed just below the headset.
Figure 2 shows this setup.
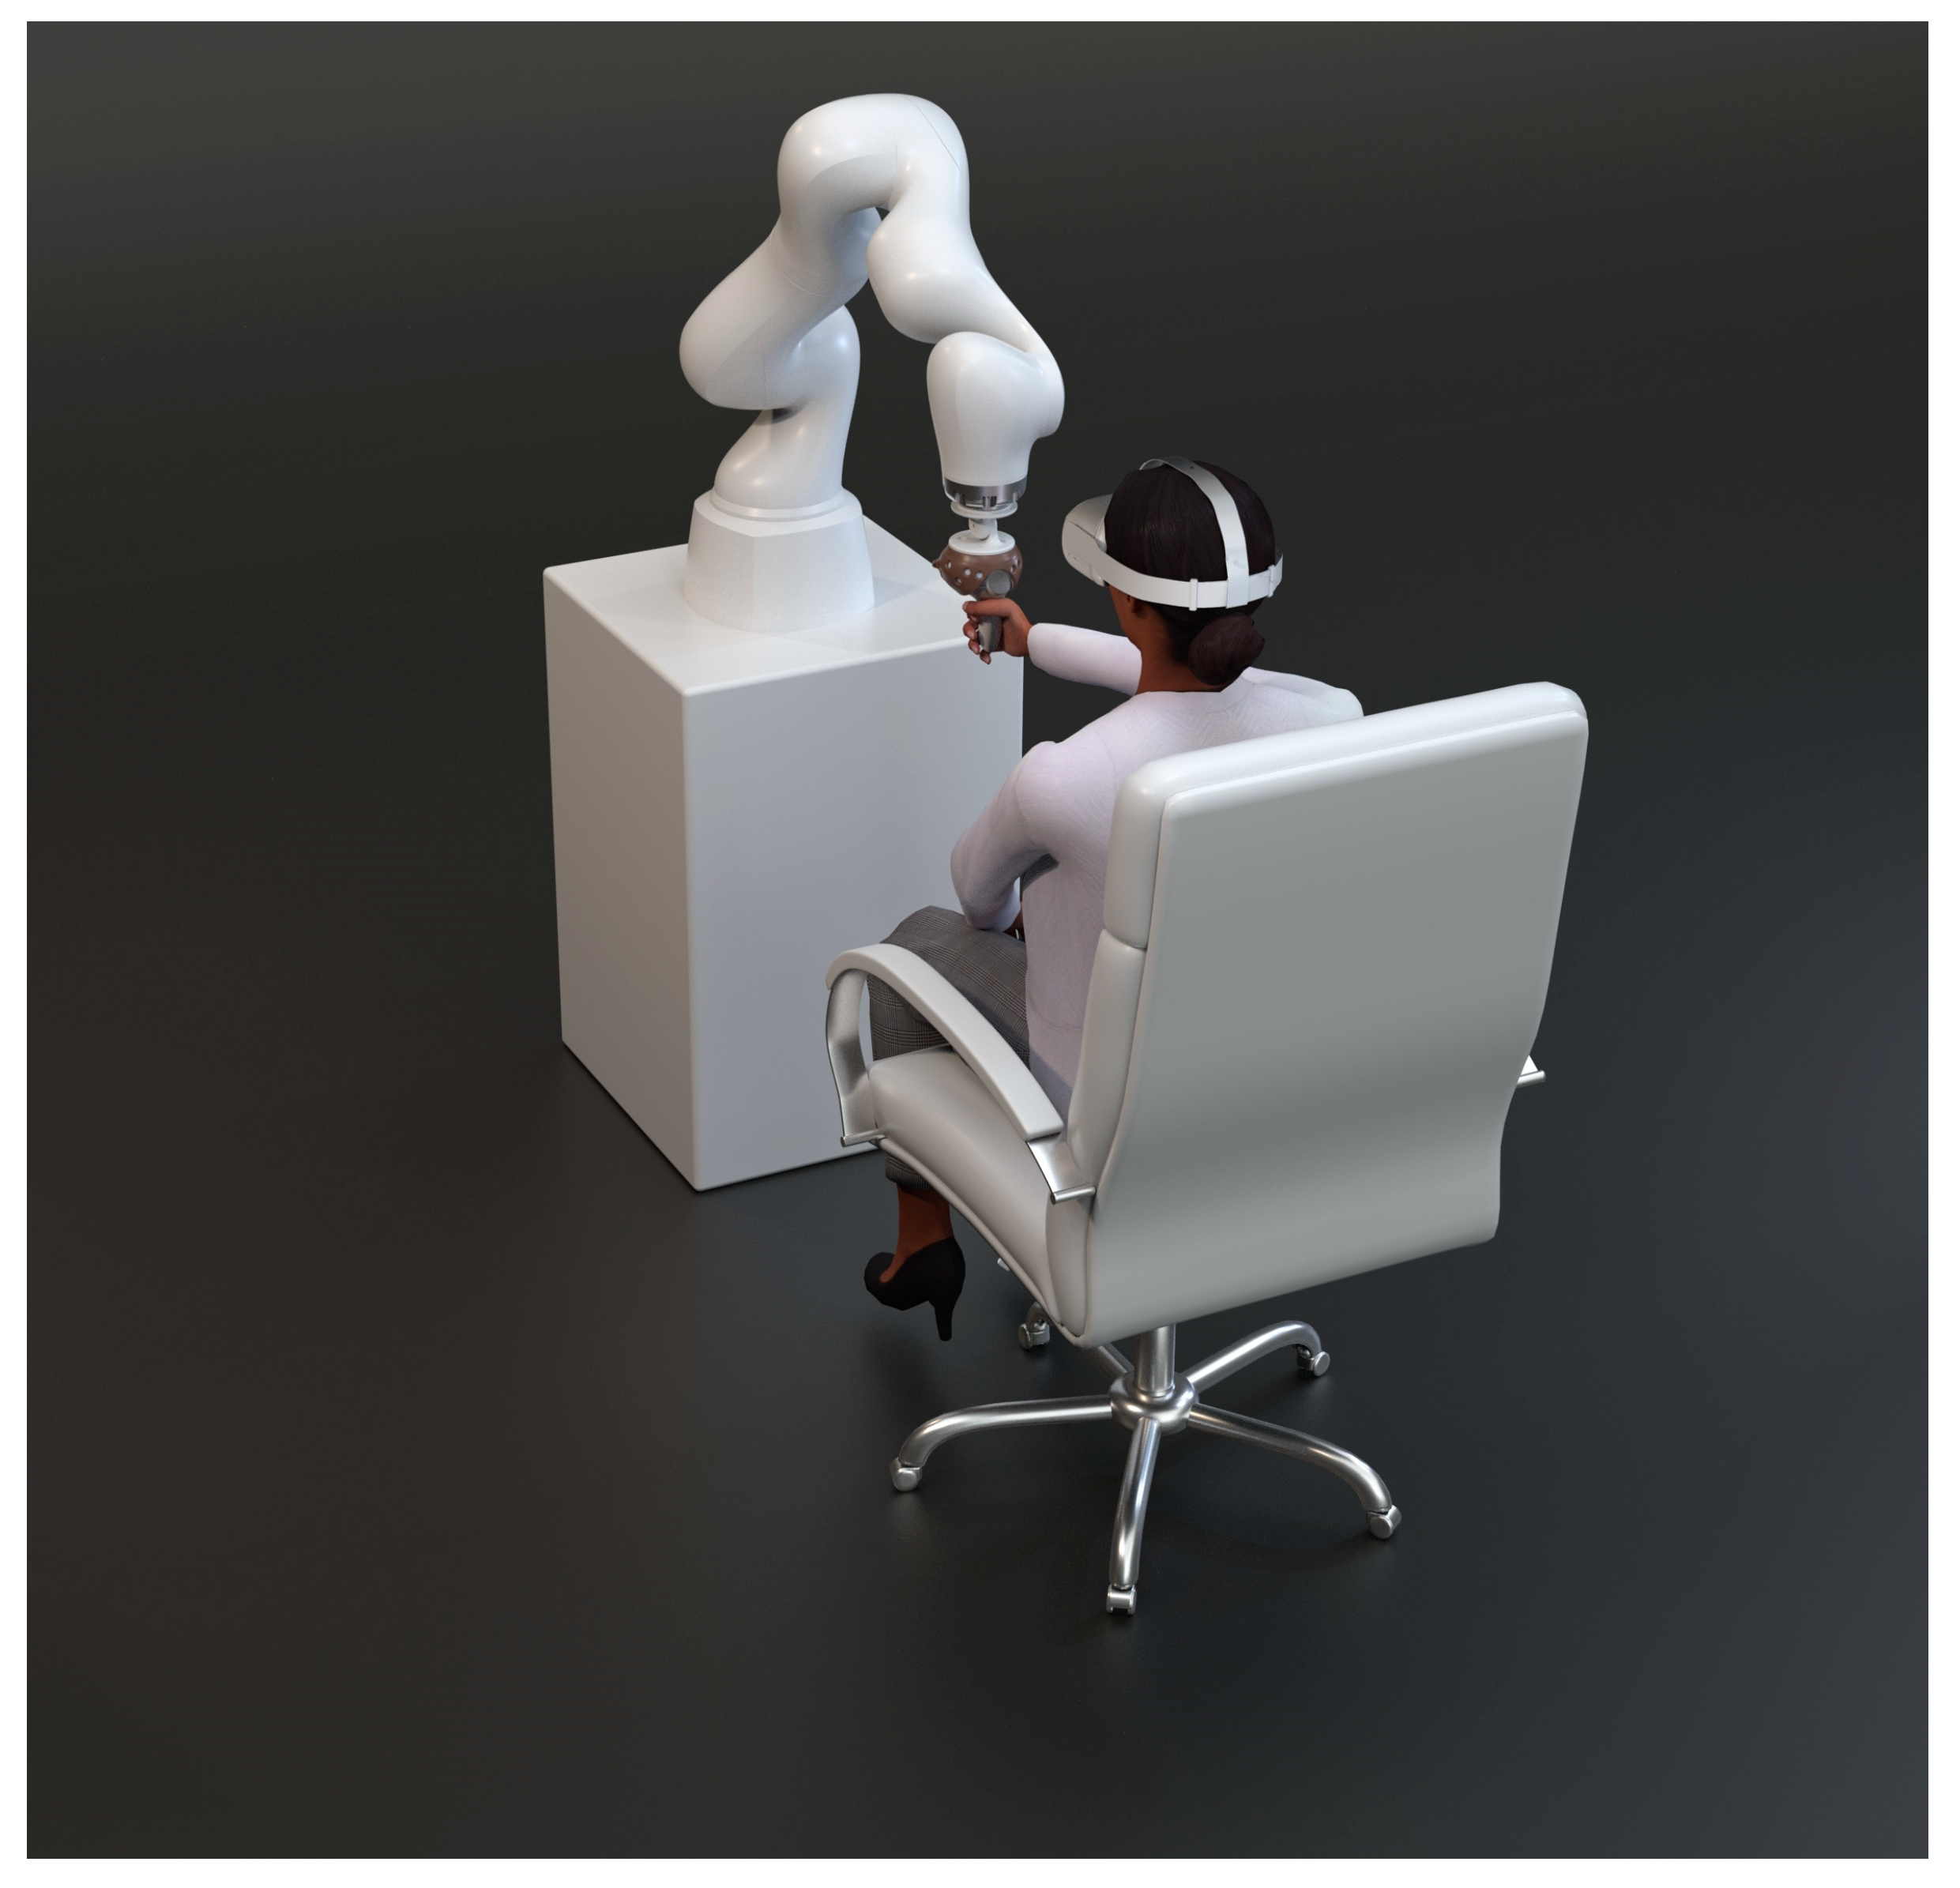
The second setup had a participant wearing the headset while holding the controller attached to the robot. The participant was sat in front of the robot, facing it, at a distance of about 3/4 of their arm length from the robot’s flange, as shown in
Figure 3. The light-meter was placed on a nearby desk facing upwards, 1 m away from the participant. All 30 participants were in their twenties and had varied heights.
3.3. Calibration
The KUKA robot is capable of rotating and moving its flange around itself or around an offset. It was set to move around an offset called “tool” as to compensate for the controller’s pivot point not being aligned with the flanges pivot point. To do so, this offset had to be setup in KUKA’s options. However, there was a major problem aligning said points—Oculus does not provide any data on where the pivot point is located in the controller, so a calibration procedure had to be developed to figure this out. This calibration procedure consisted of placing a “proxy” (small 3D object) on the controller’s center of rotation in Unity and rotating the flange around the default tool offset for each coordinate axis (X, Y, Z). Small adjustments would then be made to the offset and this process would be repeated using the new offset, making small adjustments each time. The adjustments would be made based on how much the proxy would move. The closer the proxy was to the center of rotation, the less it would move. This was repeated until the proxy’s movements were under 1 mm.
To compare the data gathered, we decided to align the robot’s world with Unity’s world so we could compare it in real time. The coordinate systems of programs running on Quest 2 change whenever the application is launched, so a calibration procedure had to be developed that would be run at the start of every use of the equipment. The first step was to create the object “World” in Unity and define its position, designated using w, using the controller’s position when the flange is placed in the desired point to use as Origin. This World will serve as a reference point for the Quest’s controller and KUKA’s flange once the offset rotation between Unity and KUKA’s coordinate systems is set up. The first step to finding this rotation is to move the flange to two different positions: let be the forward vector obtained through moving the flange to Origin + (1, 0, 0) and subtracting the position in Unity with w, and let u be the forward vector obtained through moving the flange to Origin + (0, 0, 1) and subtracting the position in Unity with w.
The corresponding normalized vectors will be denoted using and
, respectively.
To obtain the offset rotation, let ⟨▪,▪⟩ denote the dot product between two vectors, (0, 0, 1) ×
and let
φ be the angle between (0, 0, 1) and
. Finally, let
p and
q be the quaternions given using:
Obtaining thus a vector
v orthogonal to
. Let
be the normalization of
v, let
be the normalization of
×
and let
θ be the angle between
and
. Let also
be the normalization.
Finally, the quaternion pq, i.e., the product of the quaternions p and q, correspond to the composition of the two rotations; this is the offset rotation that will be used to align both worlds.
3.4. Experimental Procedure
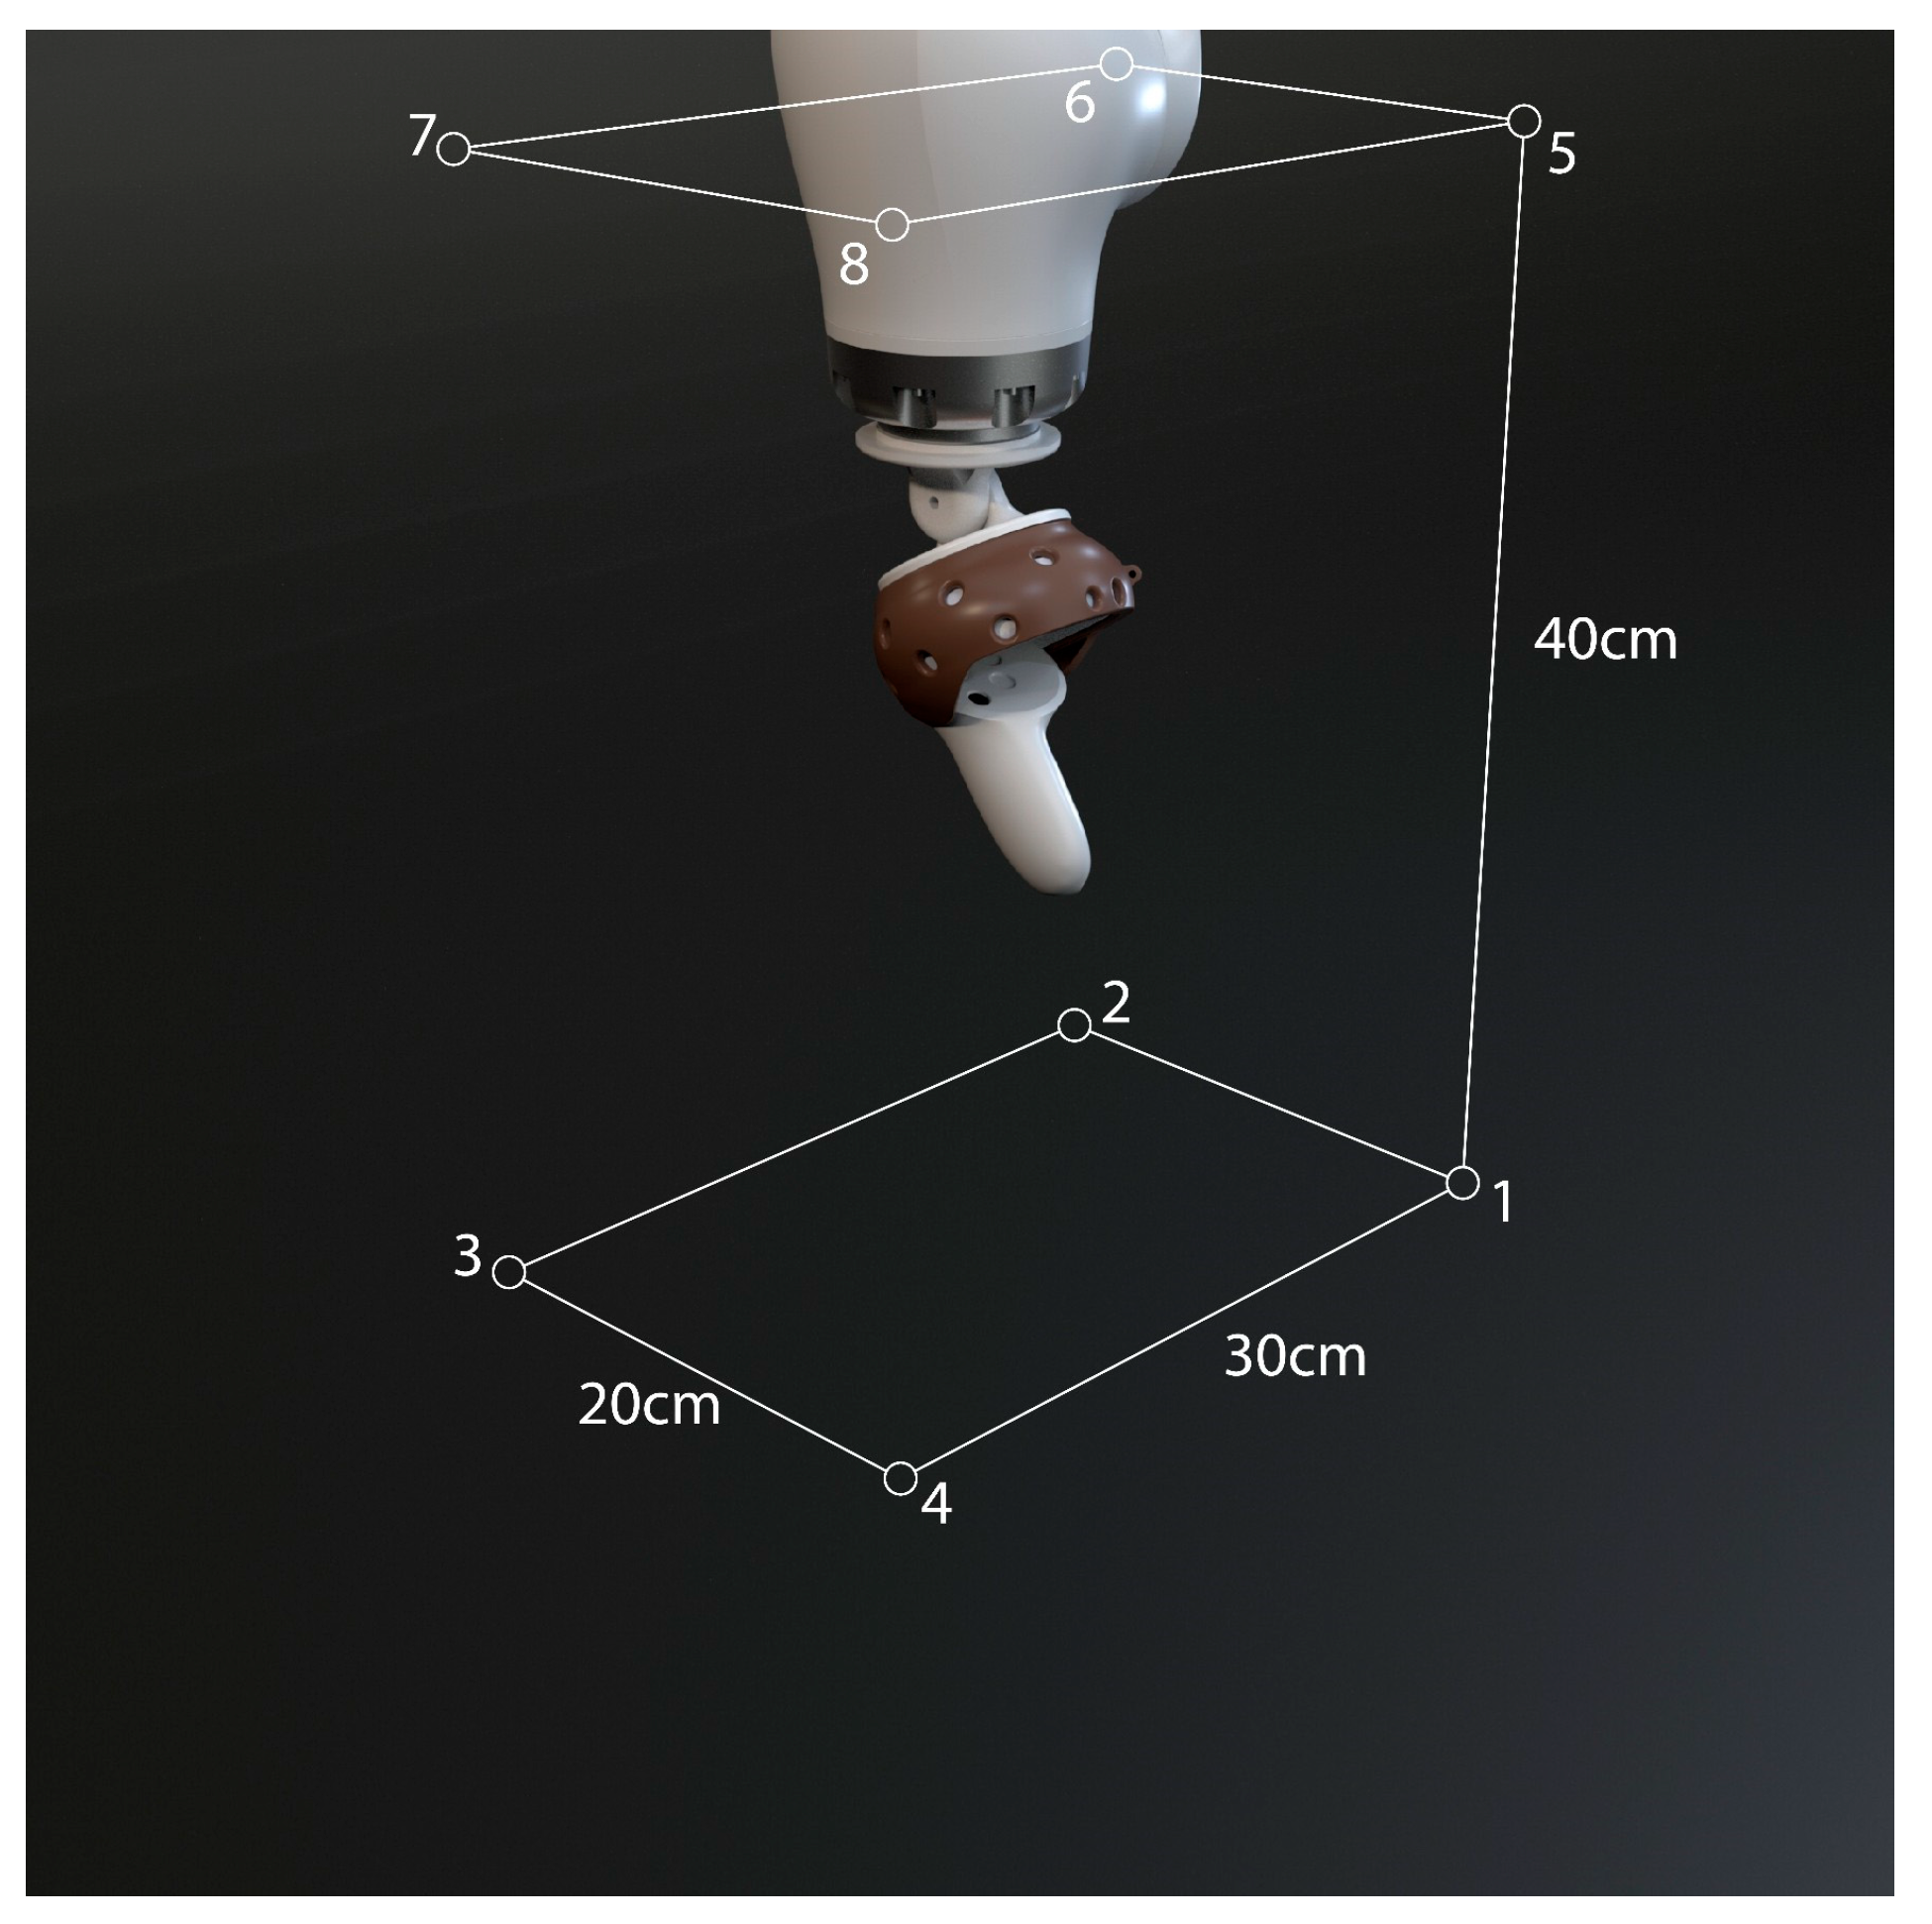
Five different exercises were performed by the robot; these were named: Point, Point Continuous, Angle, Angle Continuous, and Spline. Point consisted of moving the flange from corner to corner of a 0.30 m × 0.40 m × 0.20 m cuboid as shown in
Figure 4. The same cuboid was used for the Angle exercise, but the flange rotated 25° from point to point. A cuboid was chosen for these exercises, as it allows for easy exercise repetition and for the data to be gathered for each axis separately. Spline consisted of moving and rotating the flange along a five-point spline contained inside the previously mentioned cuboid, this exercise was created to get results from moving the flange in all the axes at once. The Continuous exercises and Spline exercise differed in the method of data recording; the non-continuous only recorded data in each vertex while the Continuous exercises repeatedly recorded along the path with a delay of 100 ms.
Each of these exercises was performed in 3 different sequences with different light conditions: Dark, Artificial, and Natural. Each sequence used a different light intensity. The Dark sequence had the rooms’ lights turned off and curtains closed, with only a small amount of light coming from them. The Artificial sequence had the lights turned on and curtains closed, and the Natural sequence had the lights on and curtains opened, letting in the daylight of a sunny summer day. Gathering the data from each experiment consisted of placing the headset on either the test subjects’ head or the support platform, measuring the room’s illuminance using Extech LT3 Light Meter, starting up Unity, and then running the calibration method. Finally, the desired exercise would be selected and executed. Point exercises were executed for 5 min, while Continuous were run for 2 min.
4. Results
A total of 45 trials were performed; 15 were performed using the KUKA robot with the headset resting on a support, while 30 were performed with the help of 30 participants.
Table 1 summarizes the details of the data collection method. The data gathered from these trials contained information on flange position in Unity, flange position in KUKA’s world, flange rotation in Unity, flange rotation in KUKA’s world, and illuminance. The position and rotation data were then compared to each other. The values in Unity were taken from the object representing the controller virtually, and the values from KUKA were sent over to the Unity project via Ethernet connection.
During the Dark exercises, the illuminance averaged at 15 Lux, with a minimum of 12 Lux and a maximum of 22. The Artificial exercises had a minimum of 68, average of 92, and maximum of 272 Lux. The Natural exercises had a minimum of 1110, average of 2200, and maximum of 13,500 Lux.
Recording of the data with participants was split into three sessions; even though natural light was used for each of them, the weather and time of day varied between them, so in each session the illuminance was measured. The first session had a minimum of 266, average of 831, and maximum of 1115 Lux. In the second session, a minimum of 241, average of 986, and maximum of 6530 Lux were recorded. As for the last session, it had a minimum of 161, average of 214, and maximum of 359 Lux.
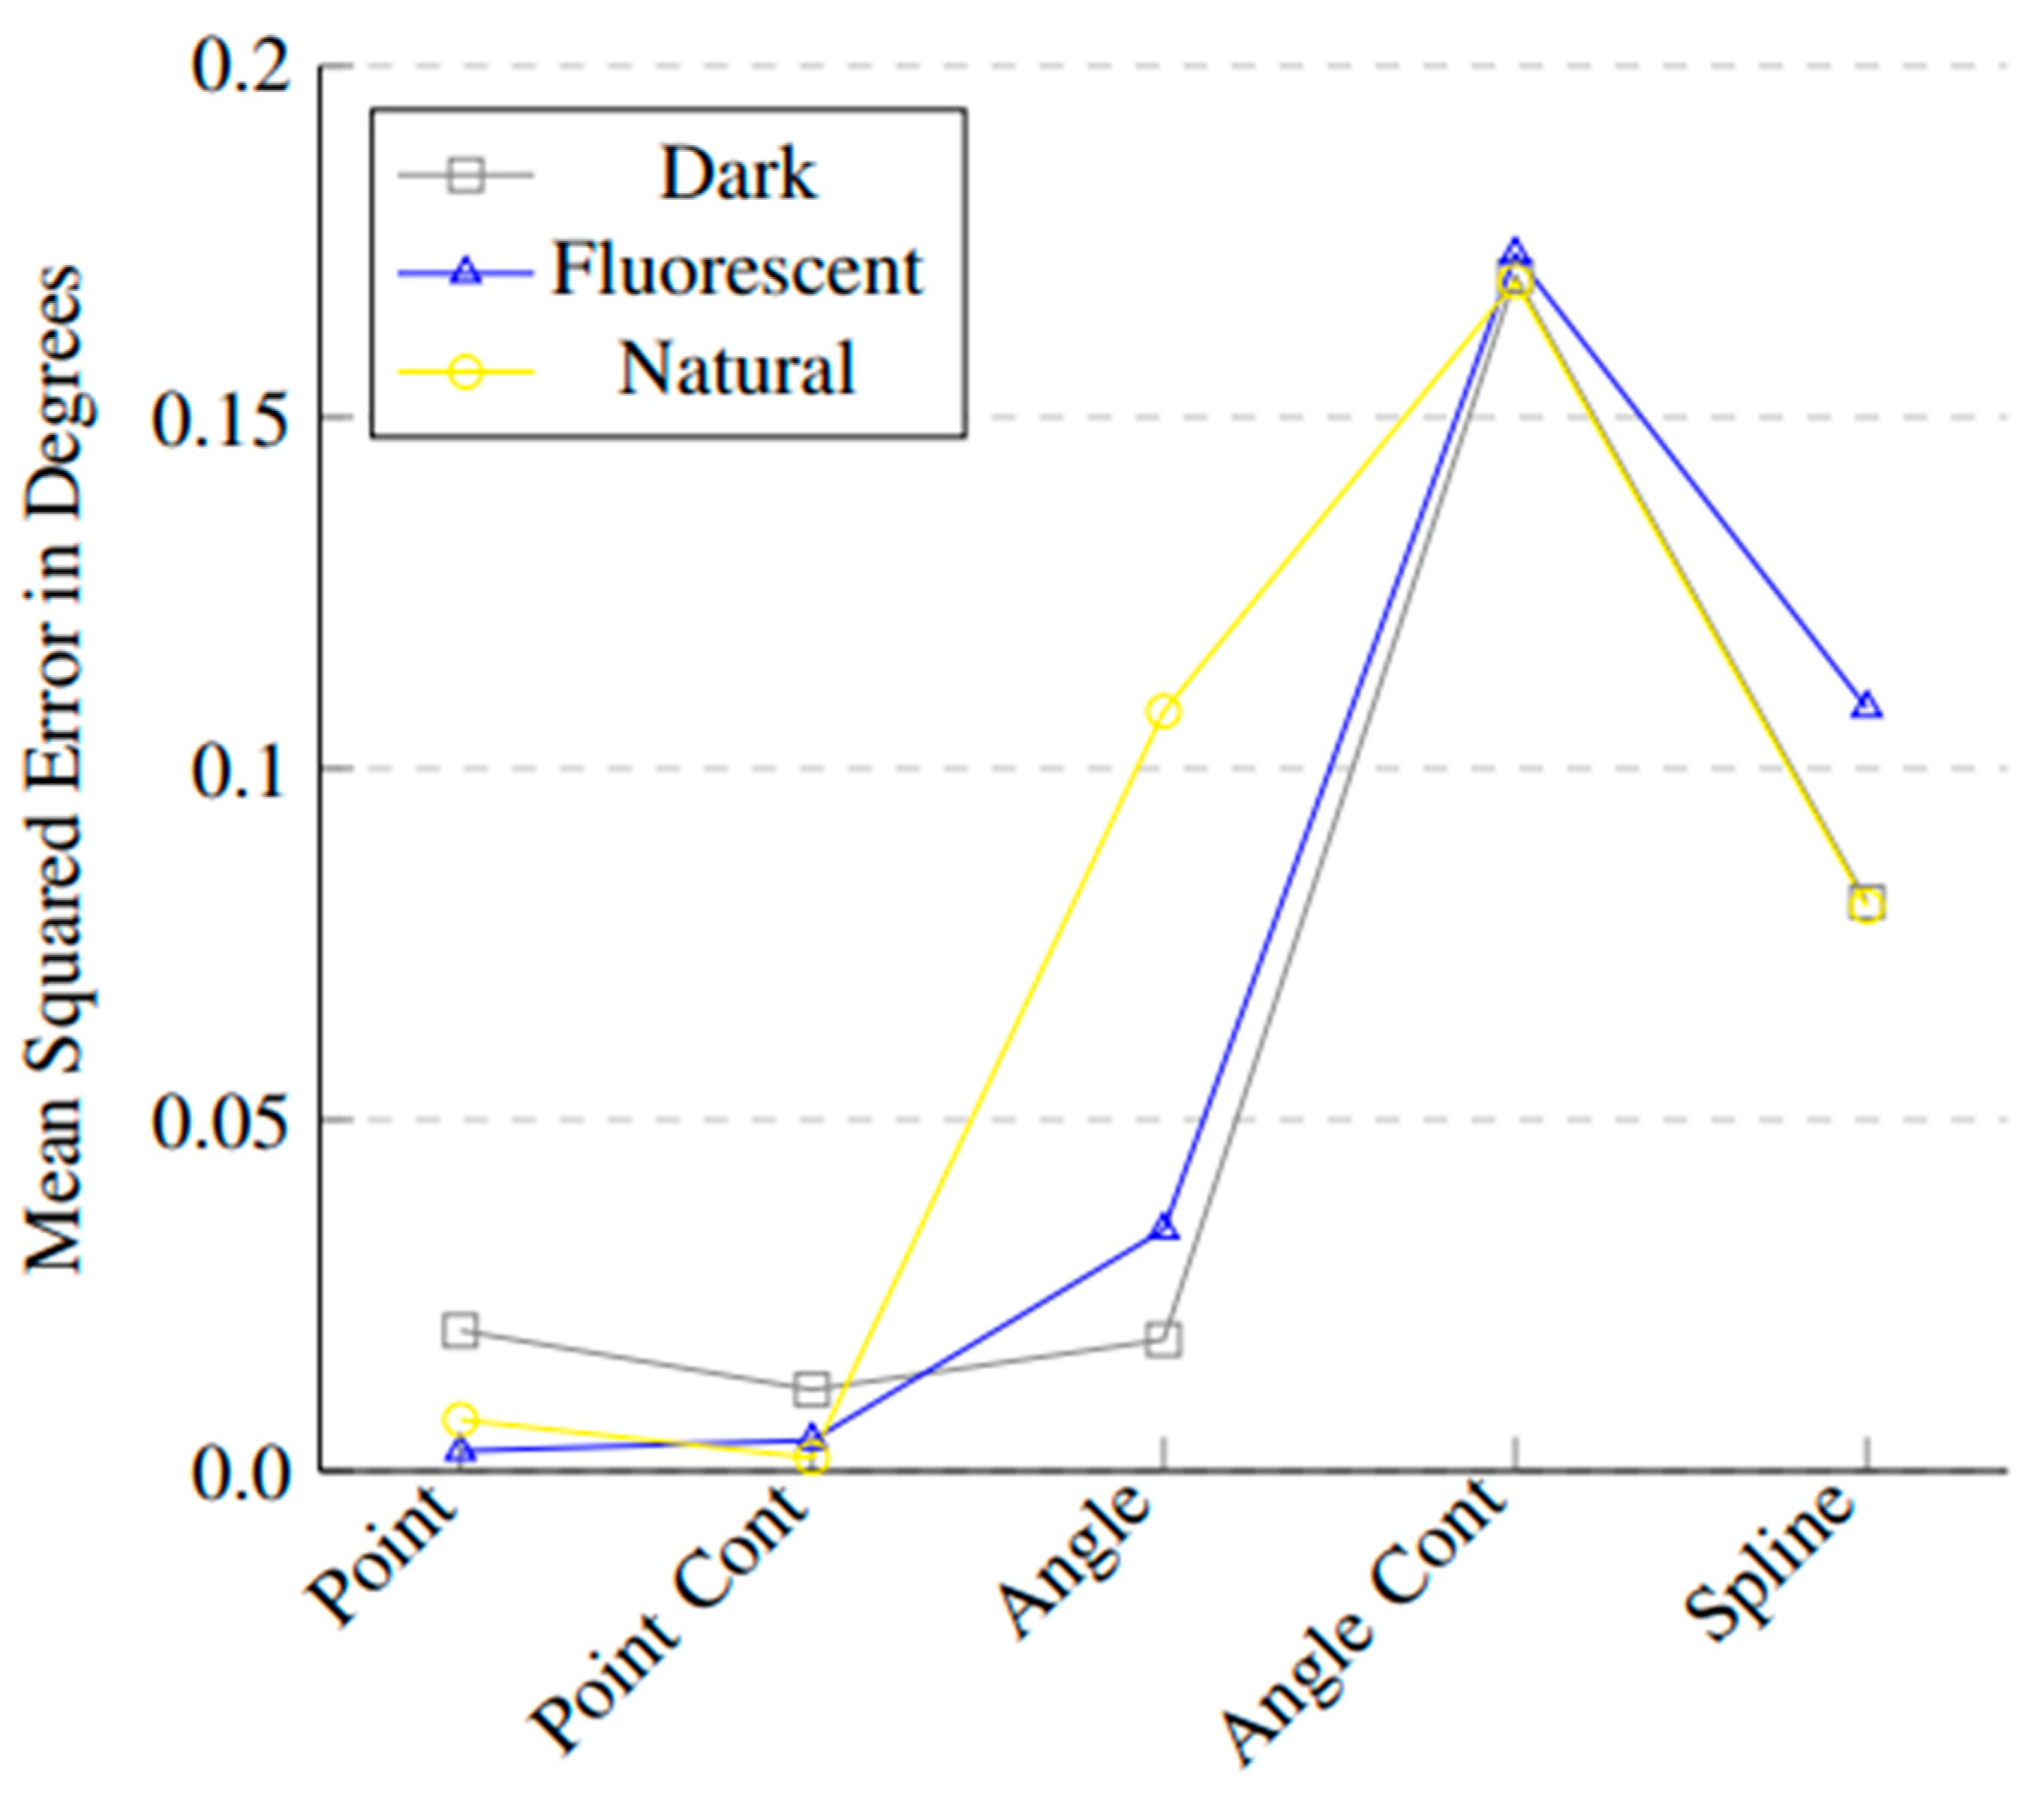
Figure A1 shows the rotation mean squared error for each exercise and illuminance.
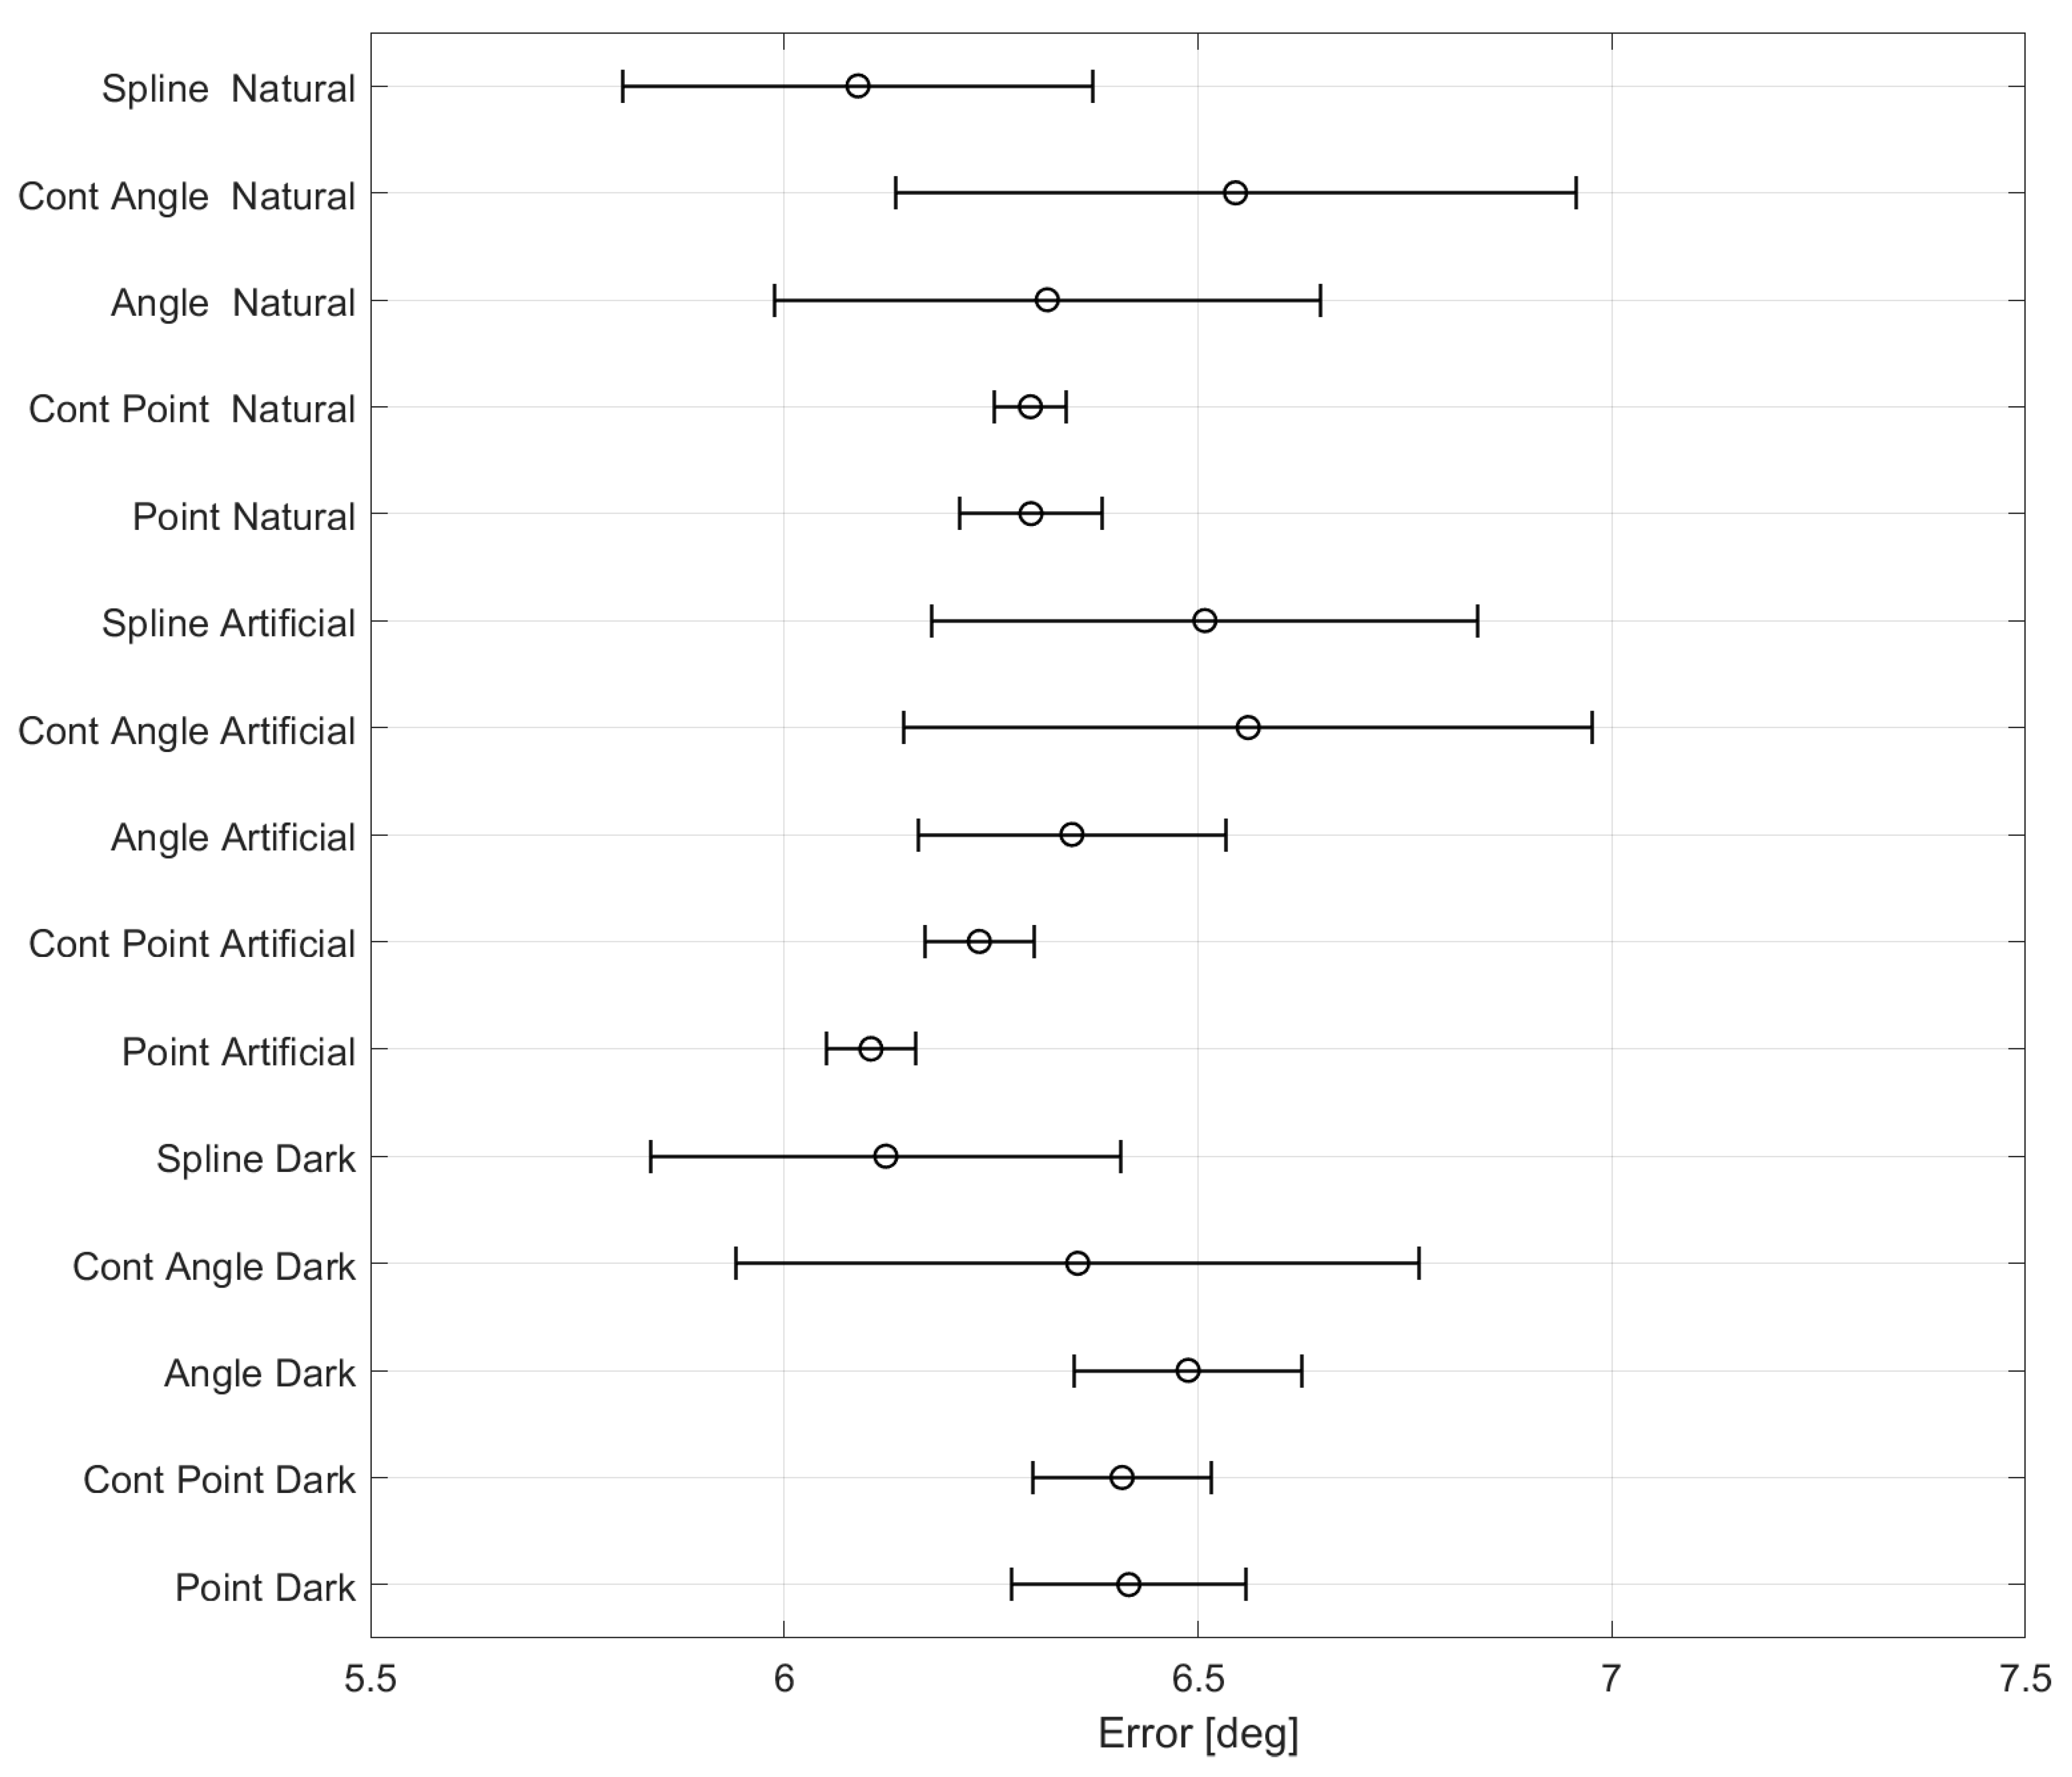
Figure A5 shows the average and standard deviation for the rotation error of each exercise performed with the assistance of KUKA’s robotic arm.
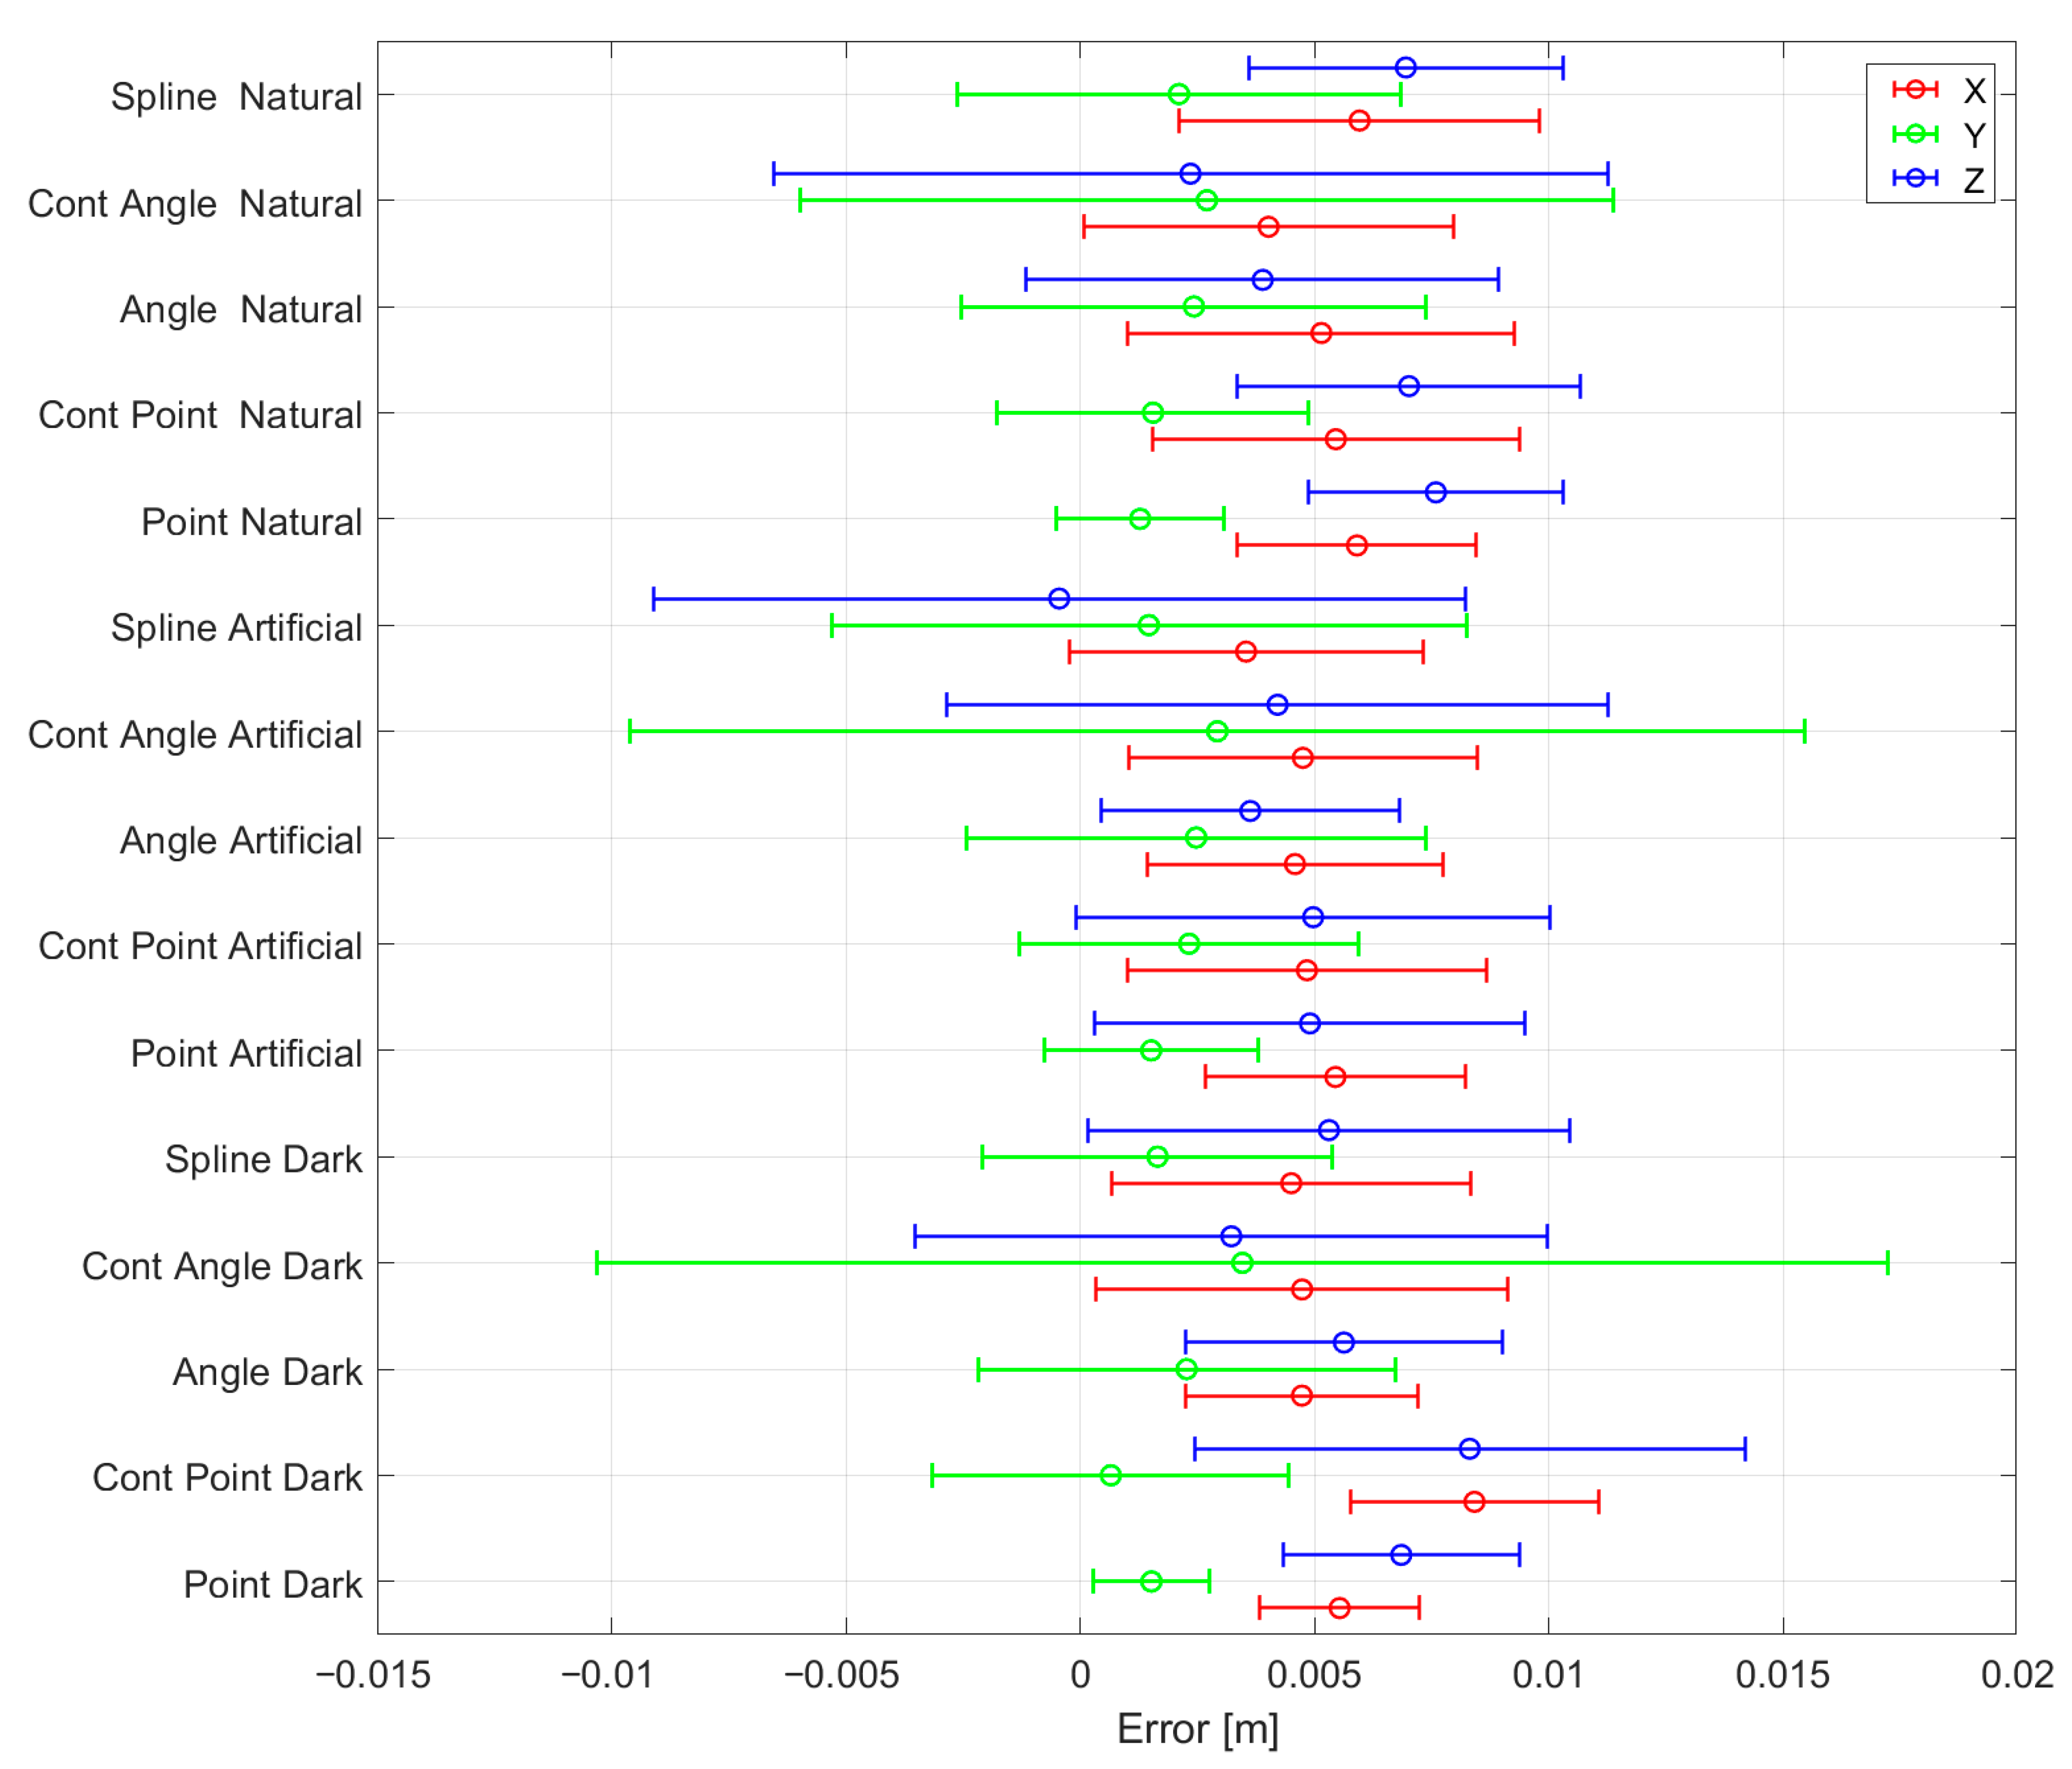
Figure A6 shows the average and standard deviation for each axis of the position error of each exercise performed with the assistance of KUKA’s robotic arm.
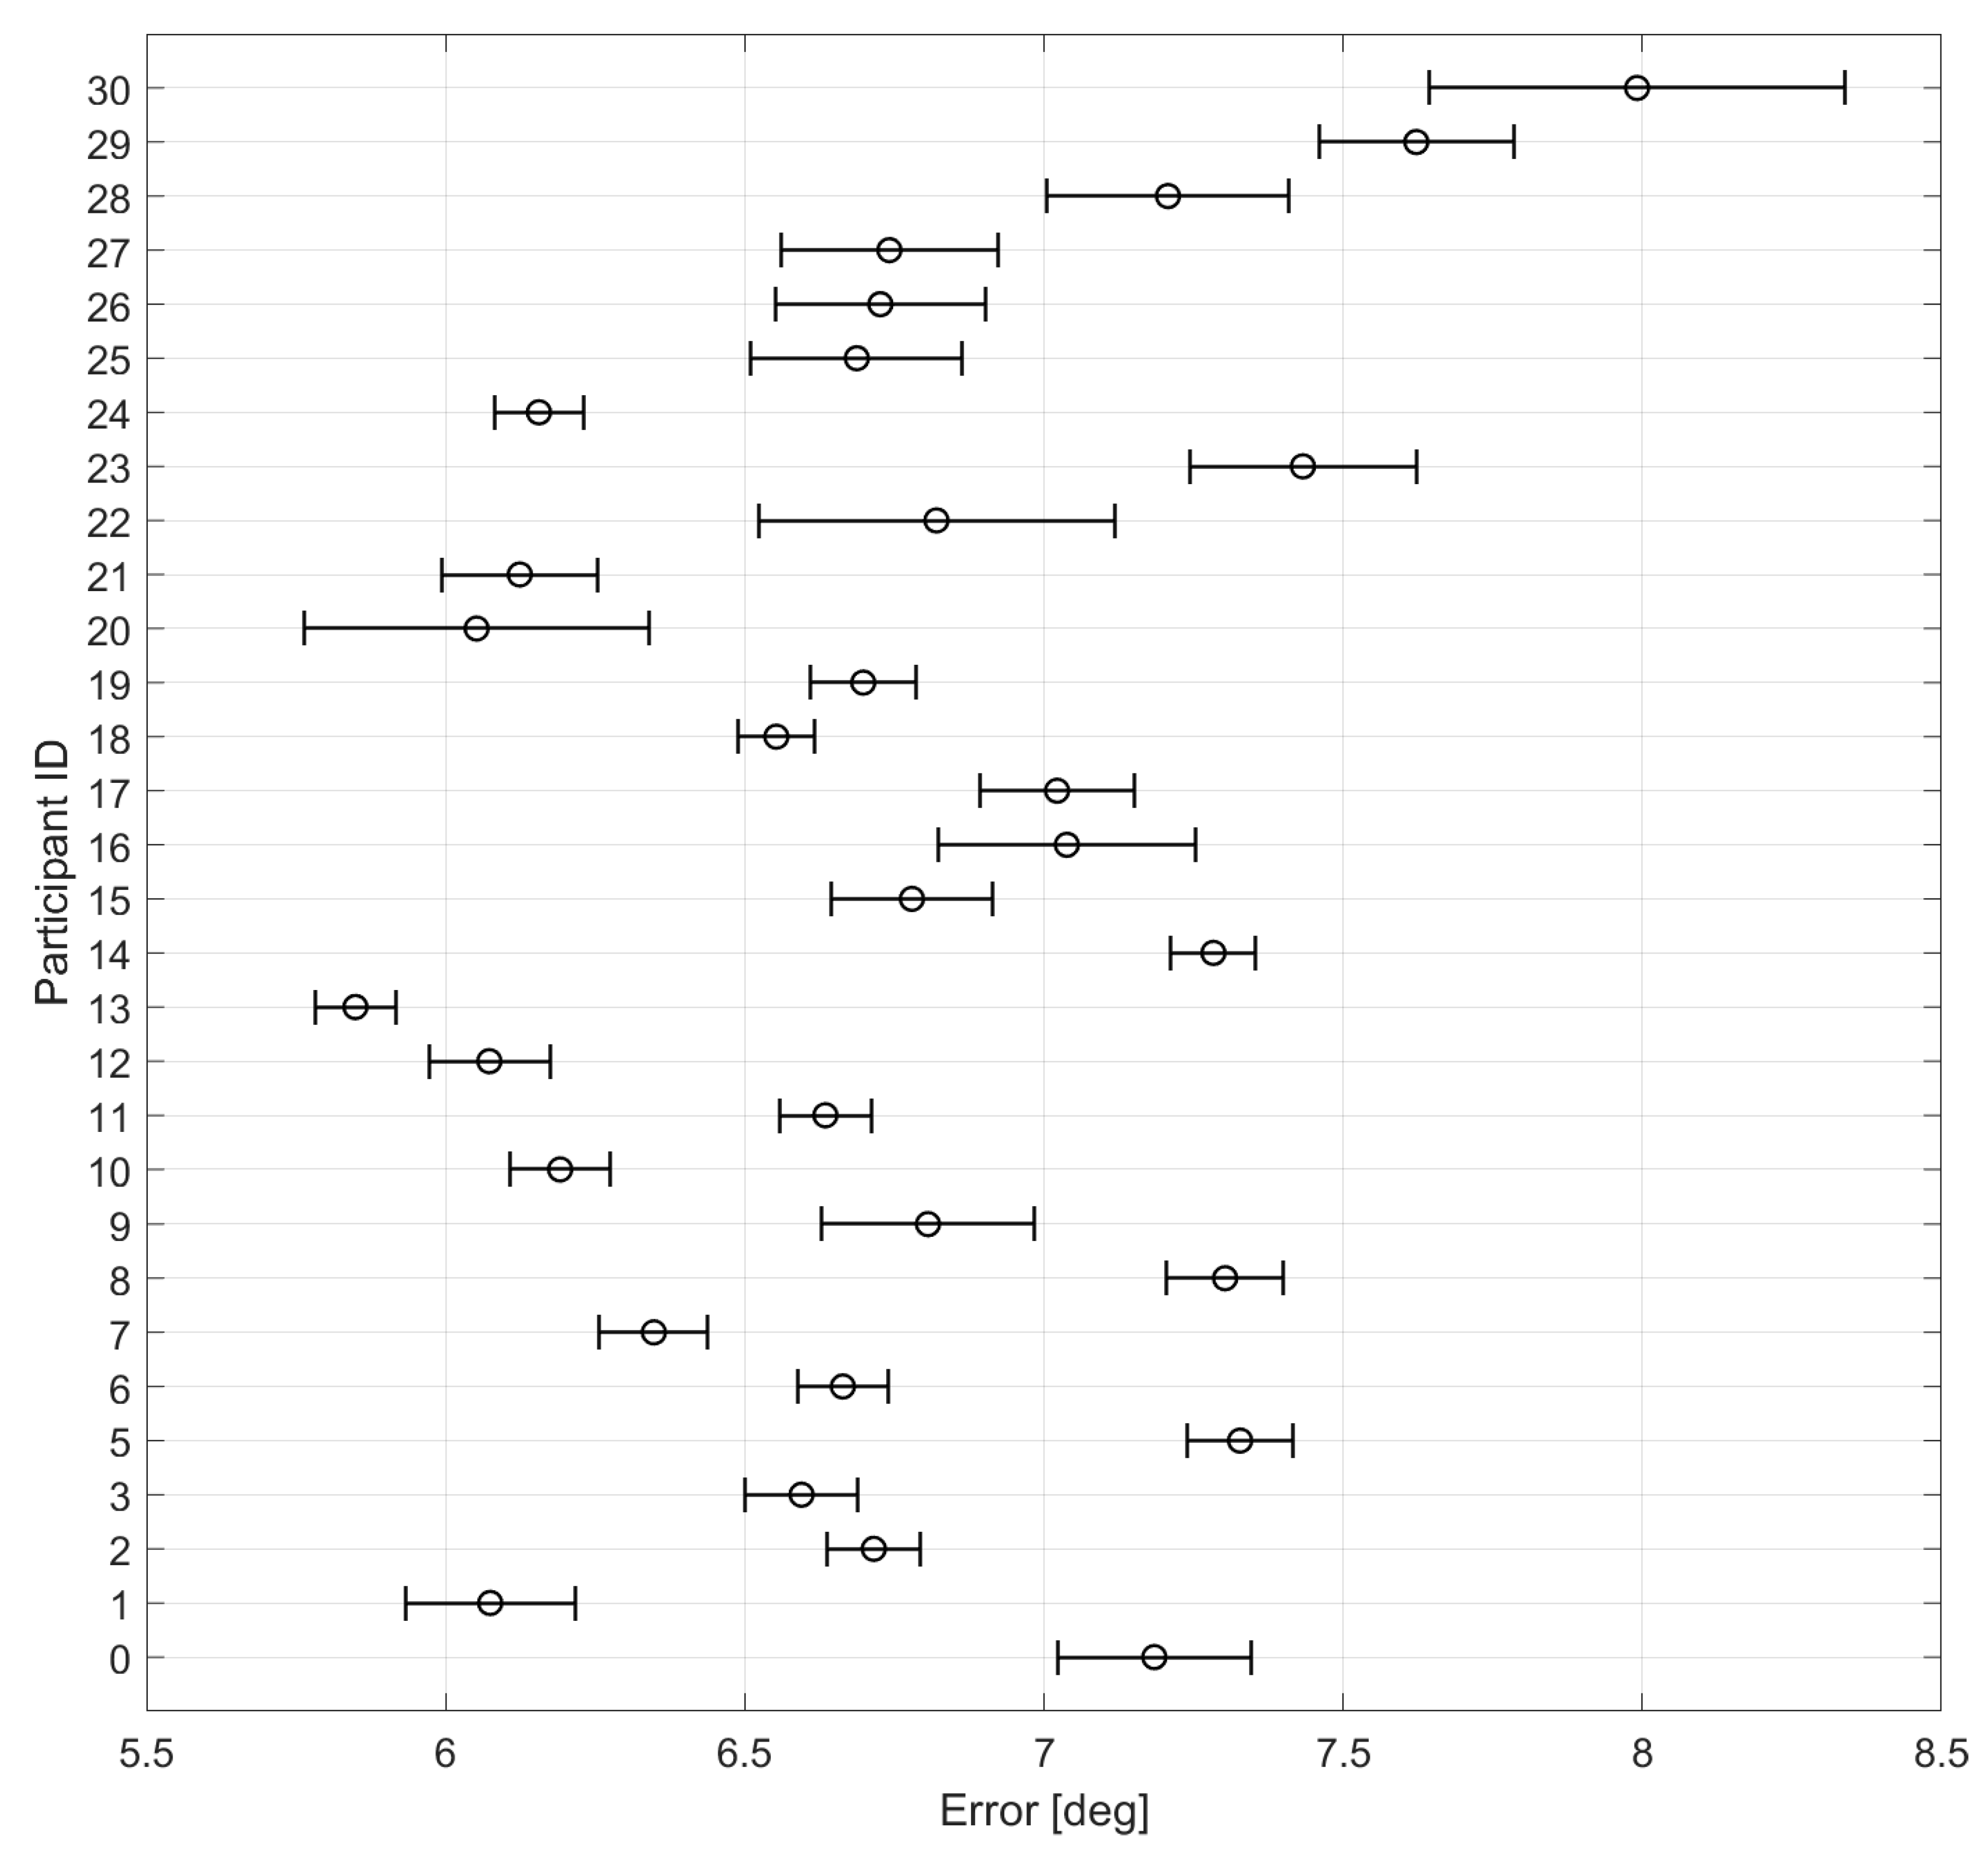
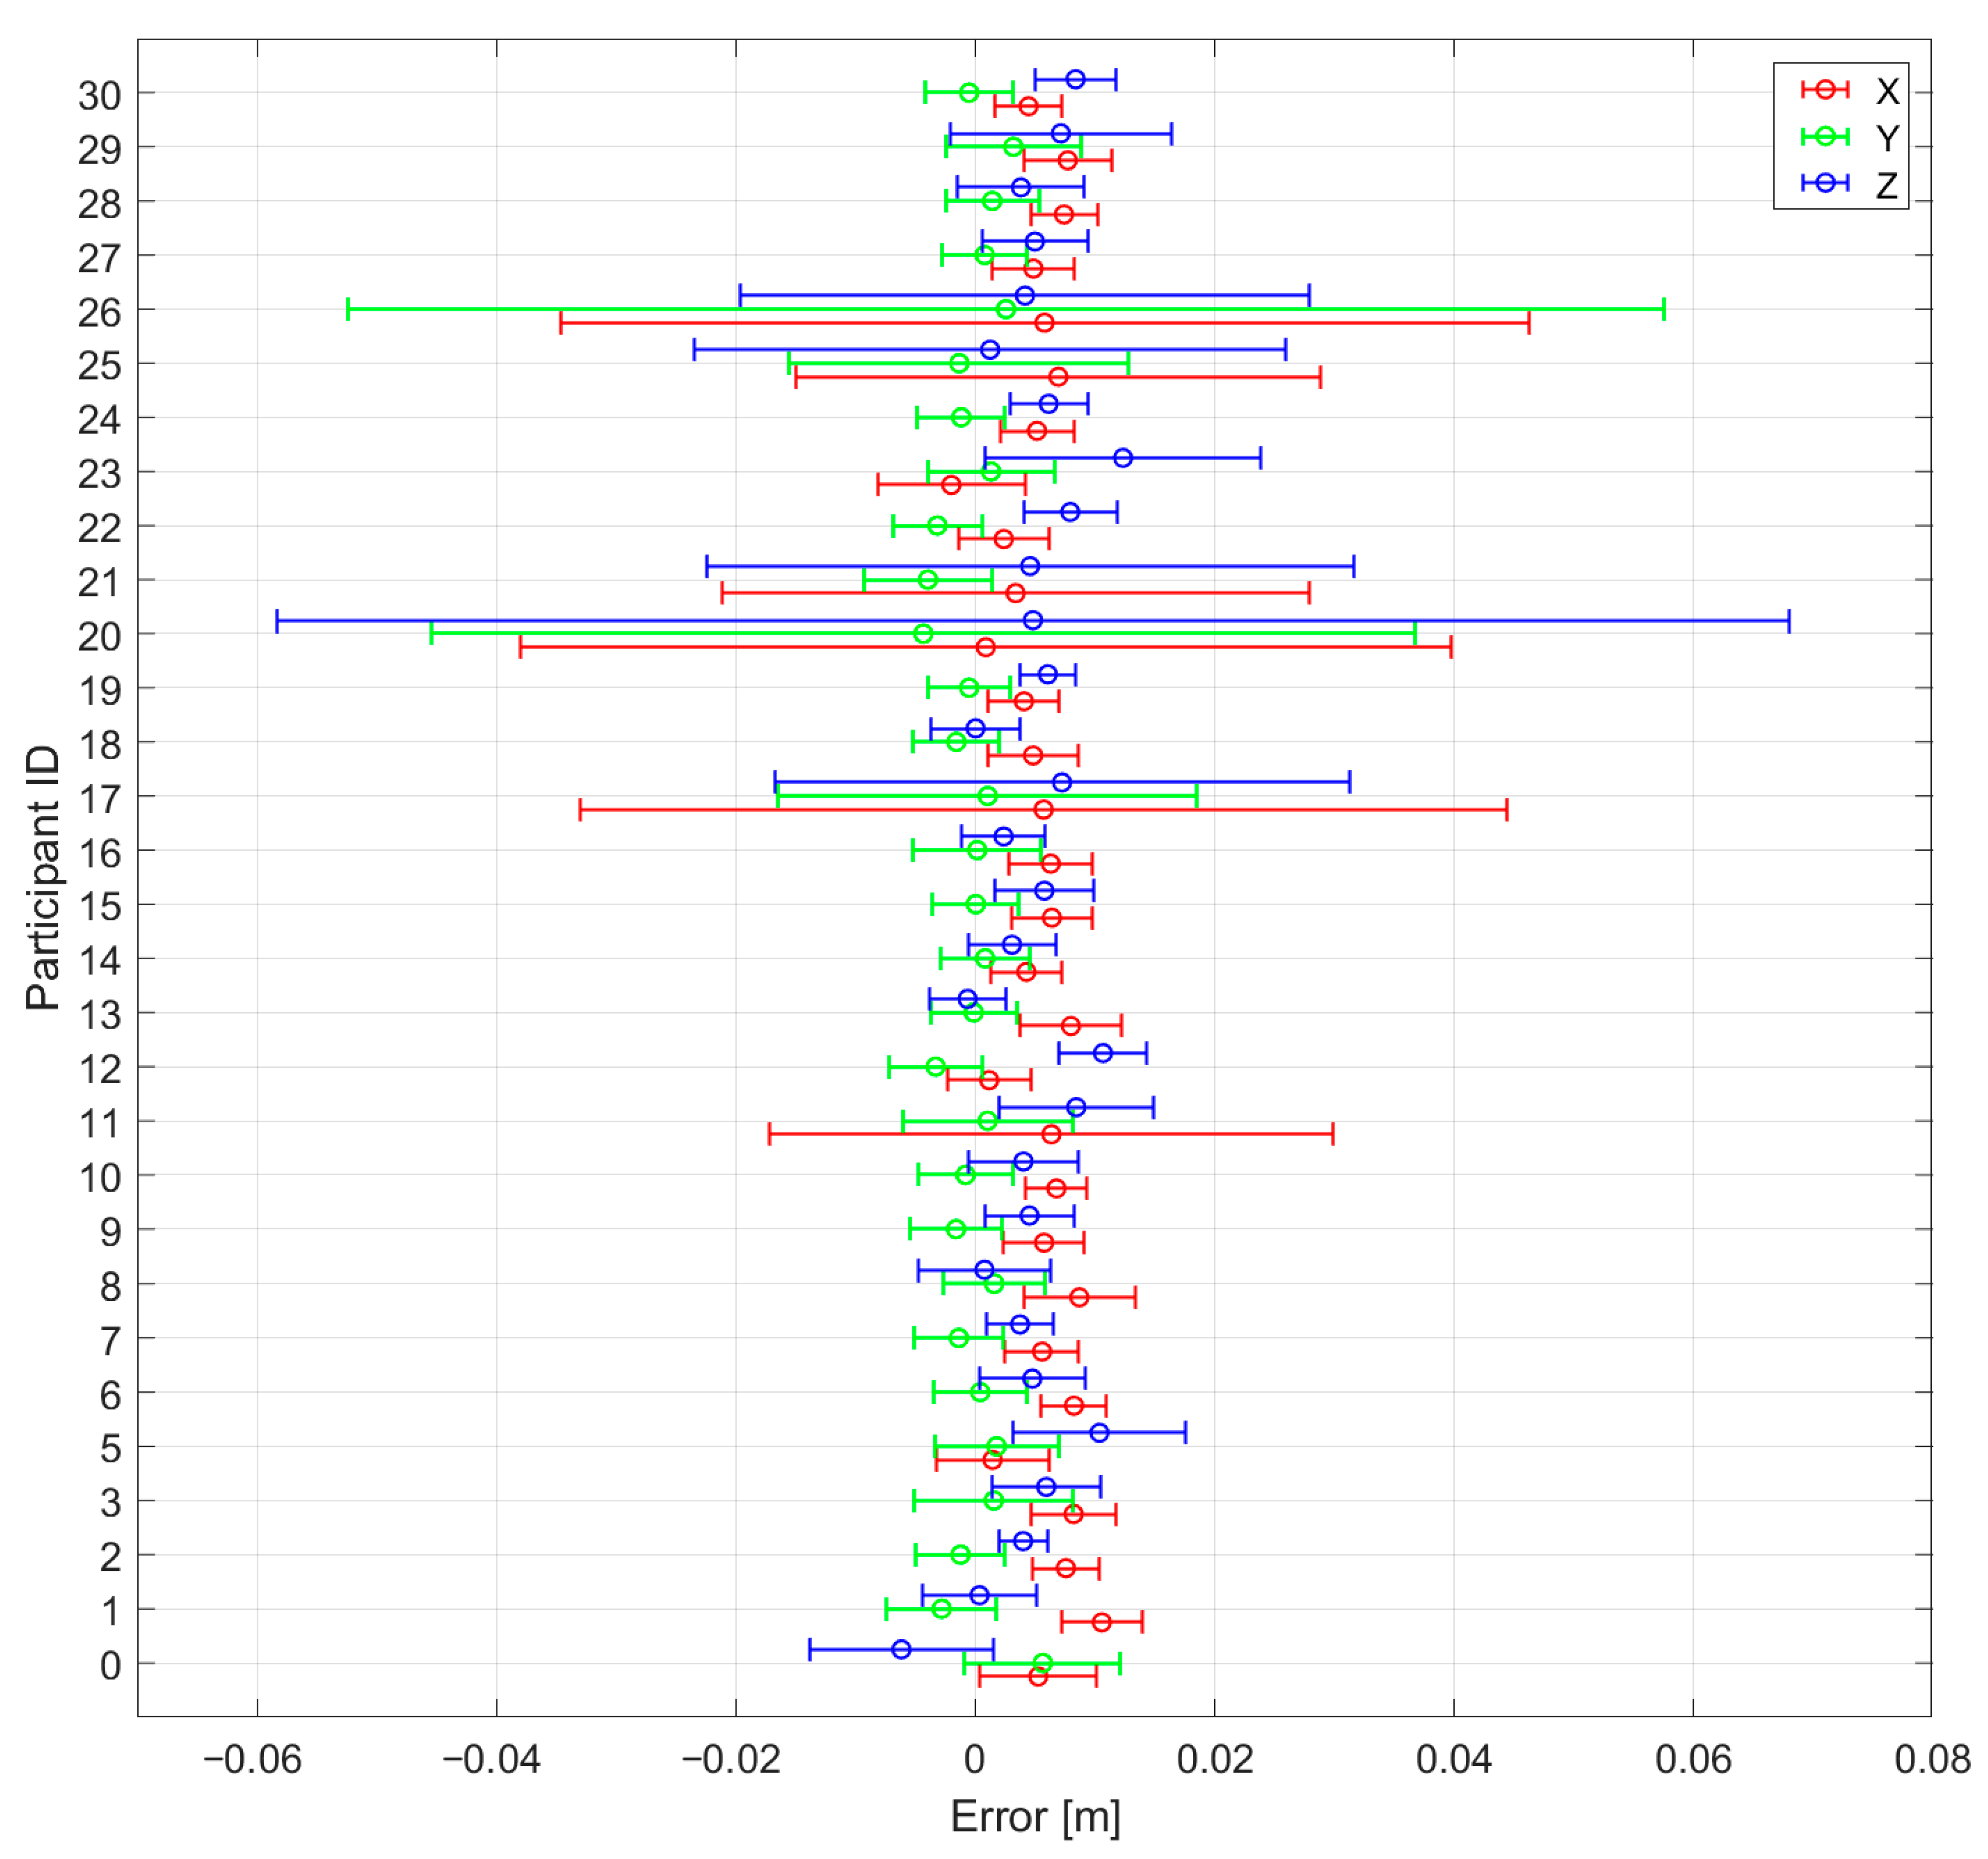
Figure A7 and
Figure A8 show the average and standard deviation for the rotation error and position error, respectively, for the exercises tested with participants.
5. Discussion
As can be seen in
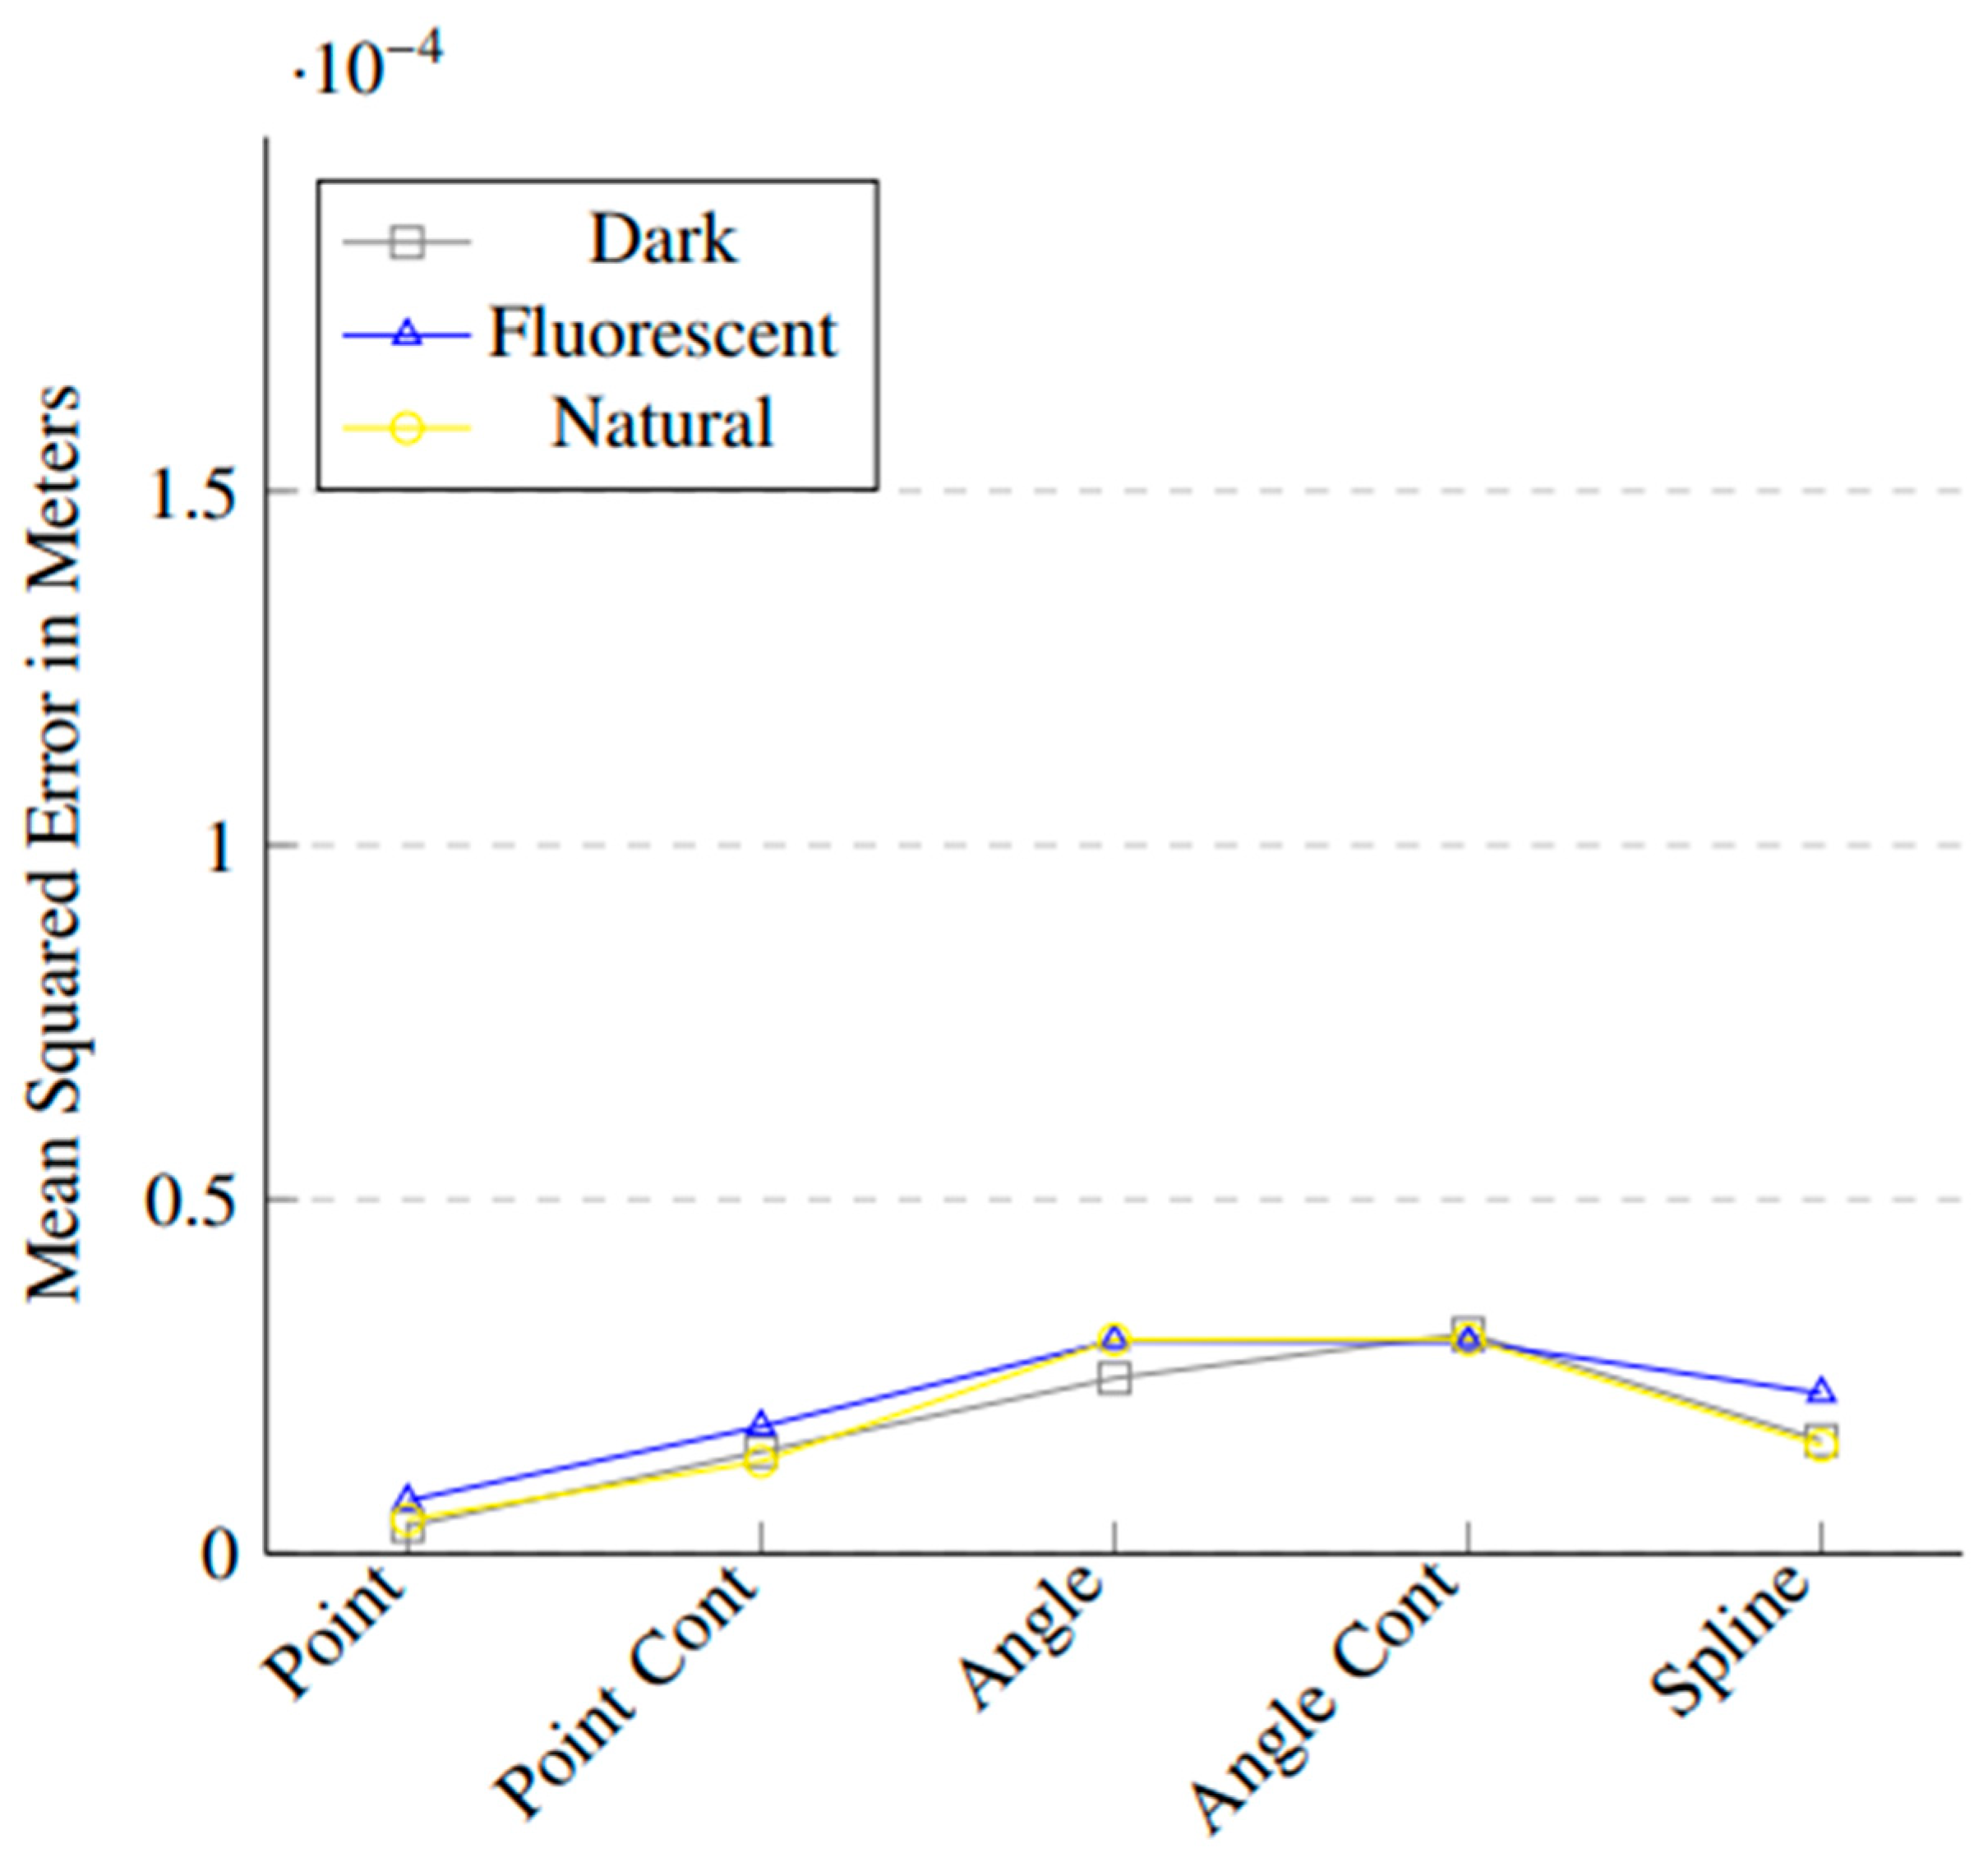
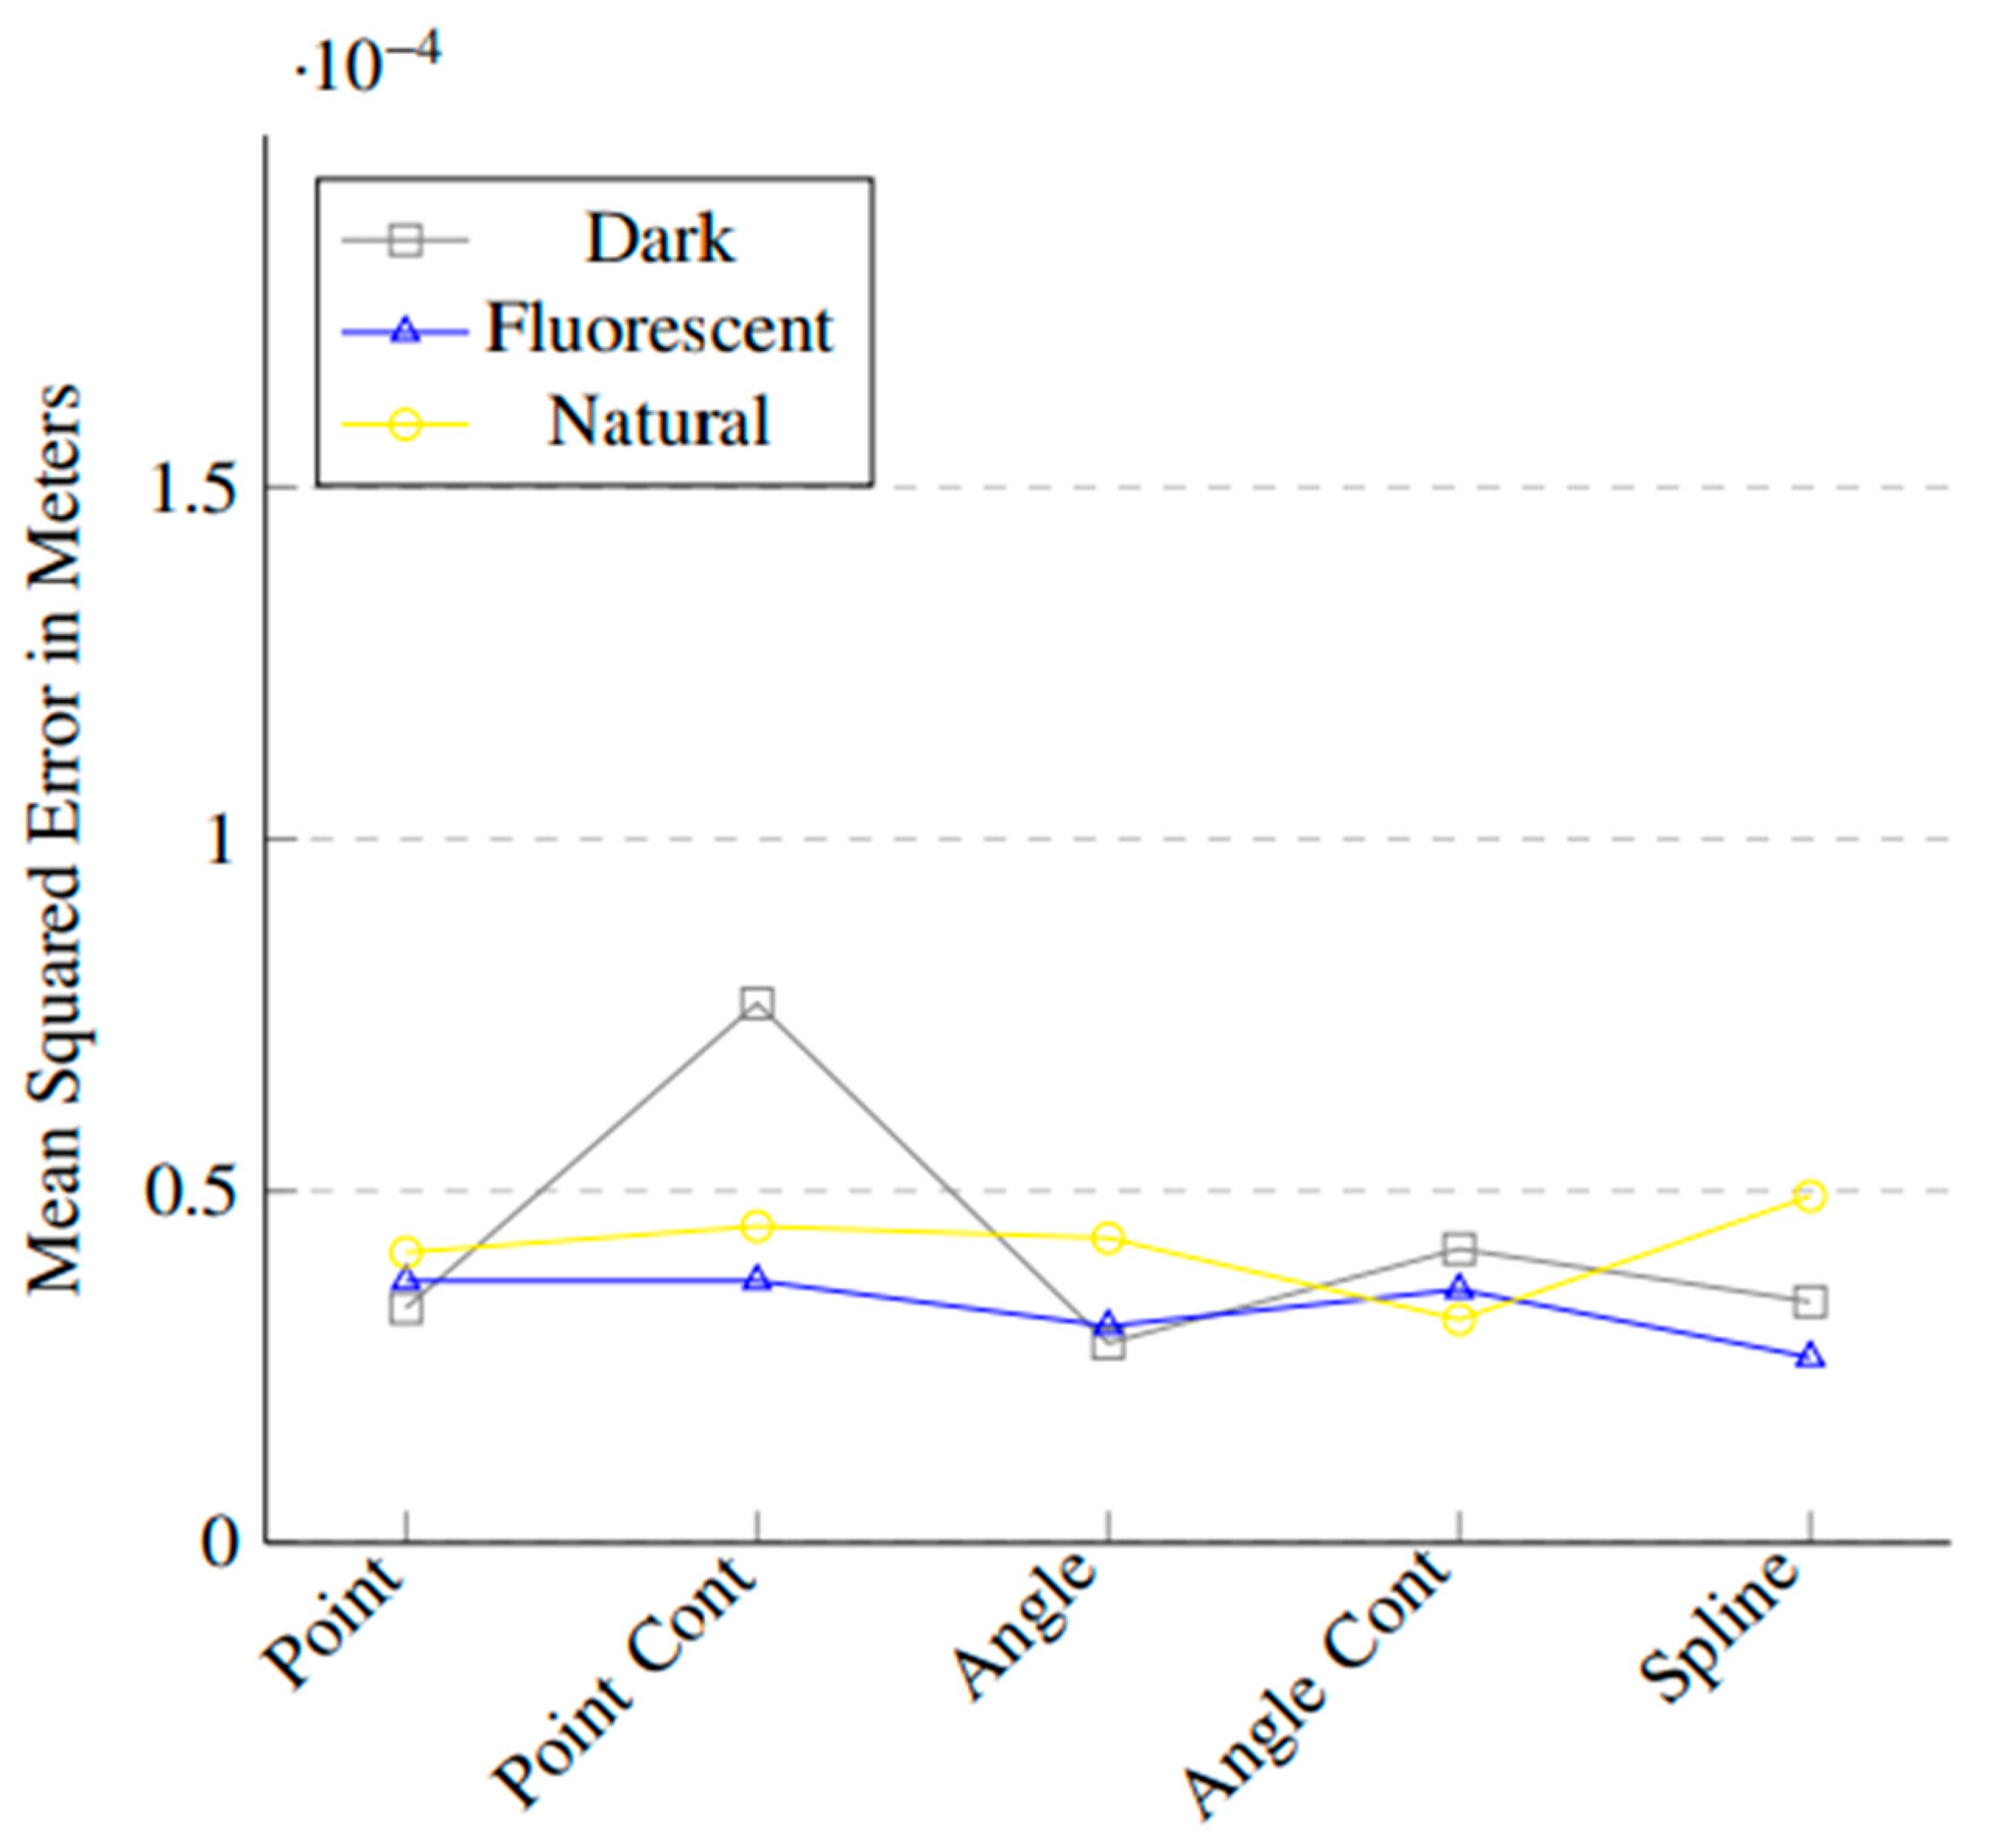
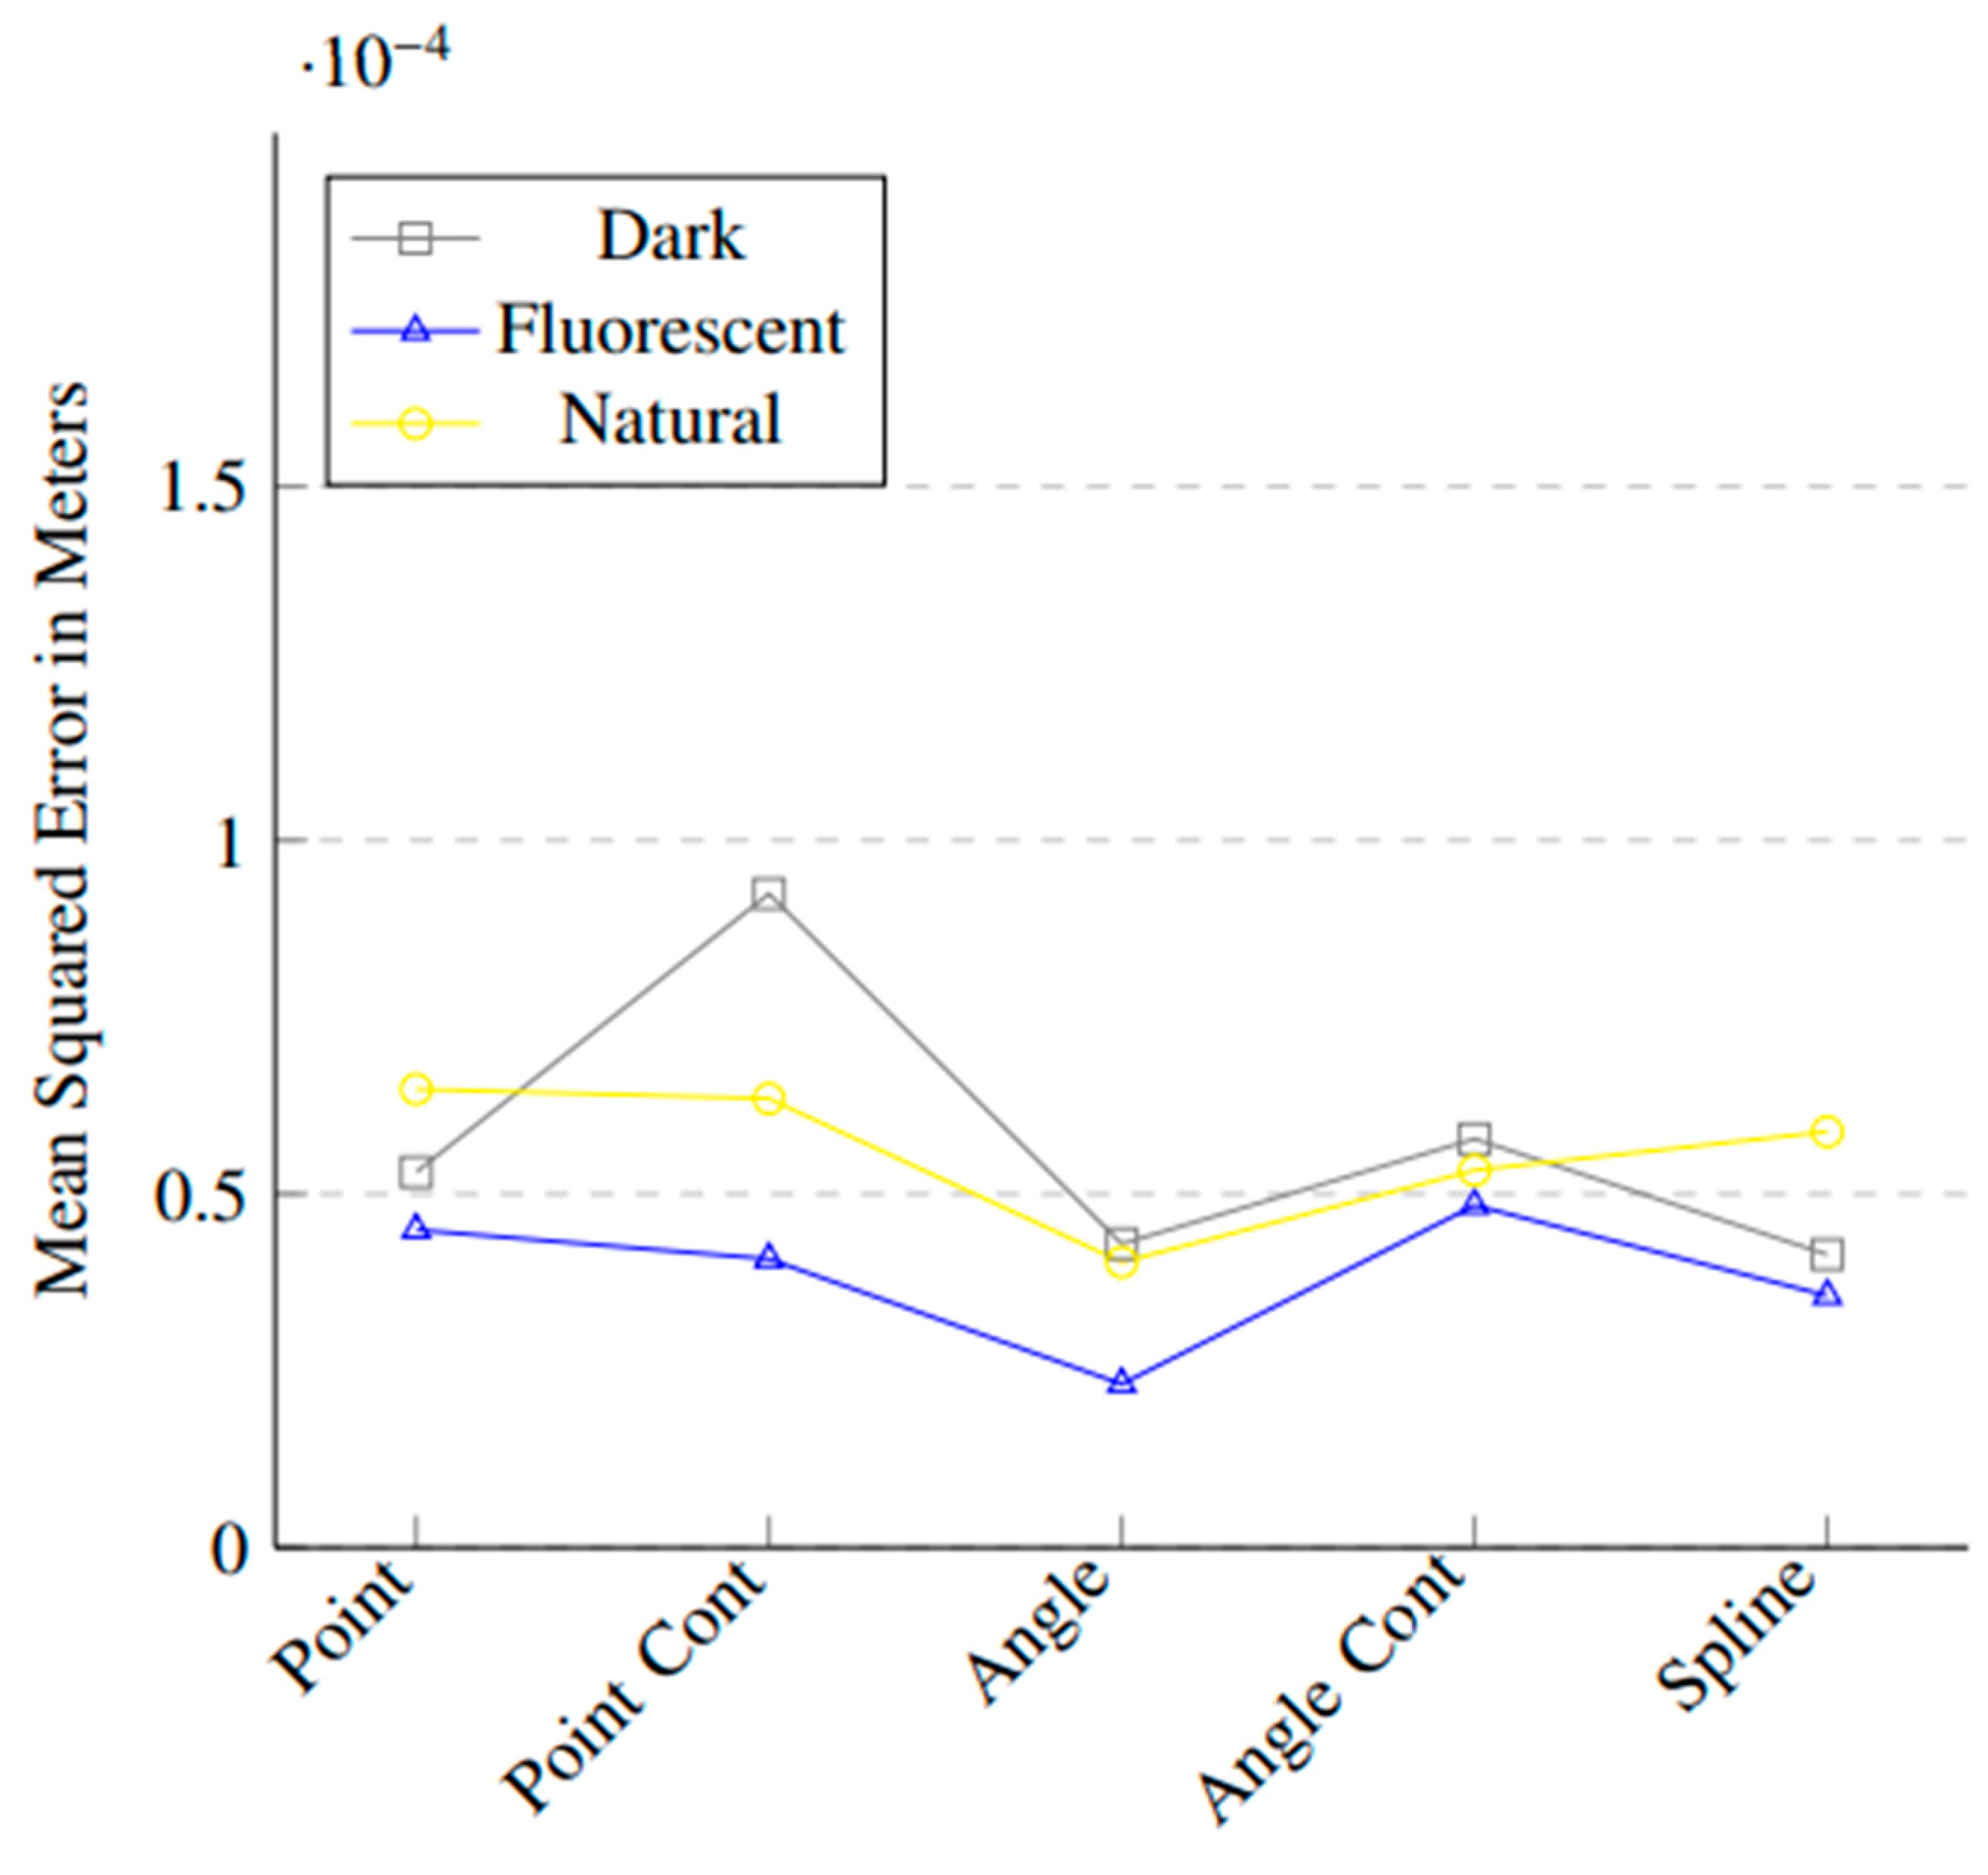
Figure A1, the rotational error increased when performing exercises that rotated the flange, but that was not the case for the position data (
Figure A2,
Figure A3 and
Figure A4), which might indicate that the rotational offset might not have been aligned as well as the translational offset. The same can be observed in
Figure A5.
In
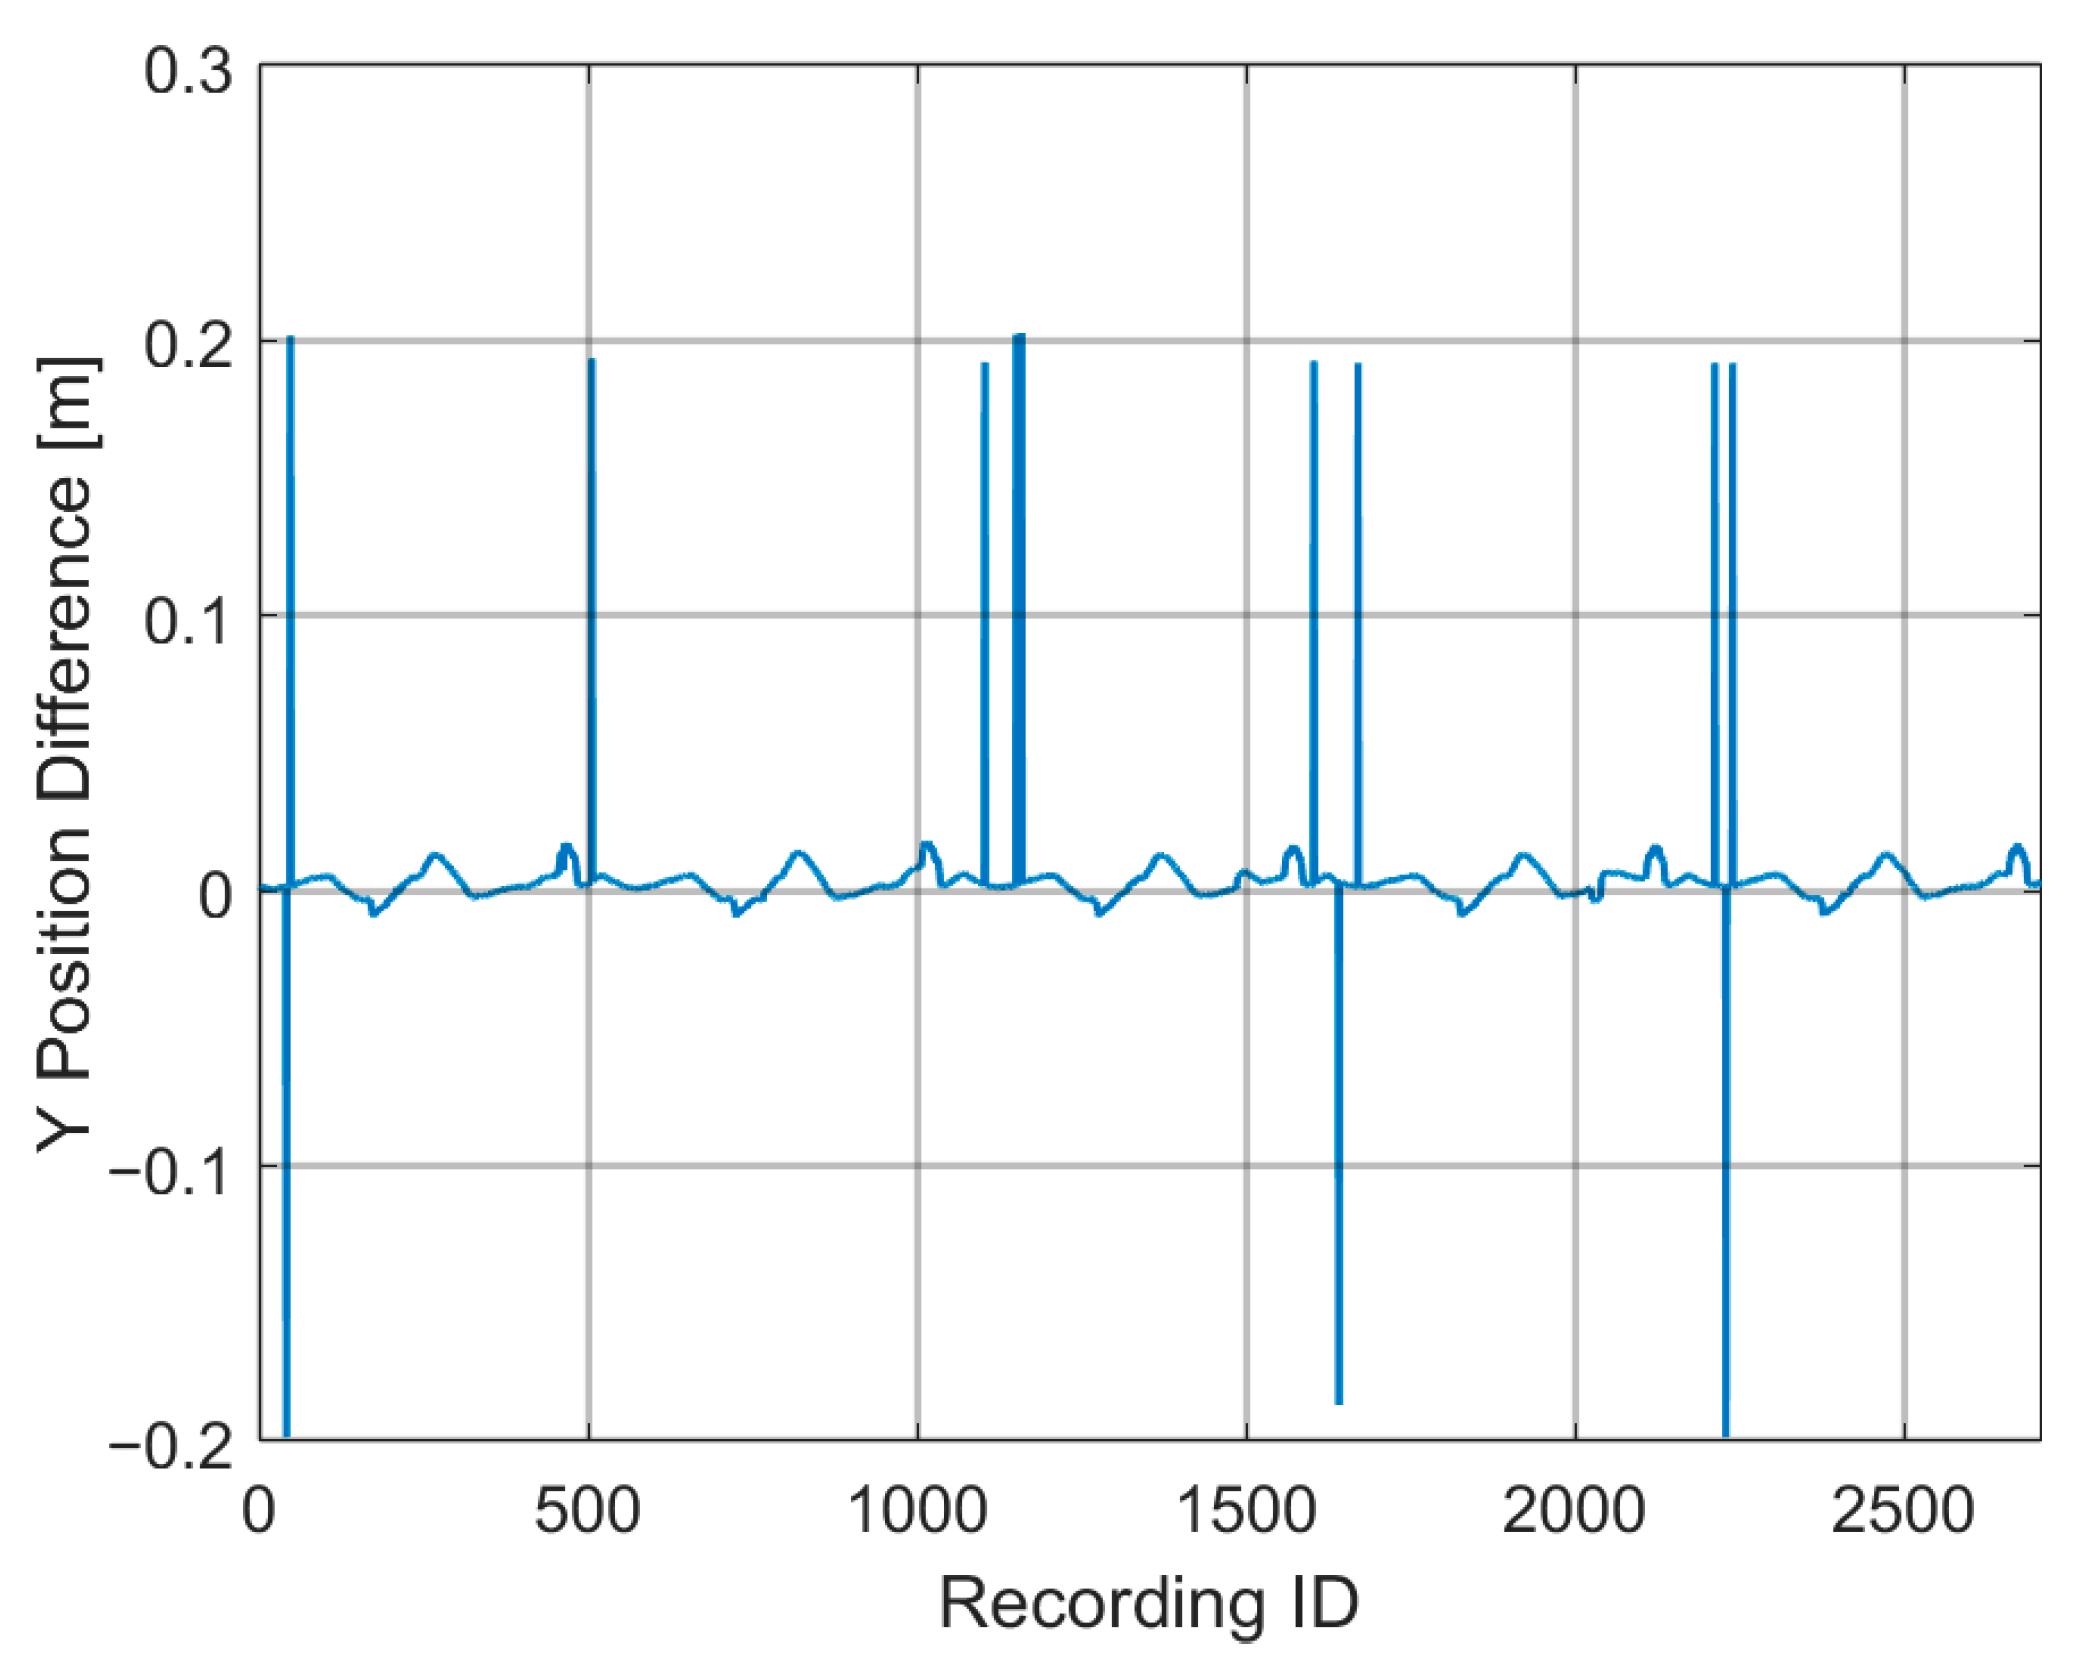
Figure A6, the values of Continuous Angle exercises are higher than the other exercises; this might be caused by Quest 2′s limited line of sight for detecting the controller’s position in the transitioning positions from point to point. An example of this can be seen in
Figure A10, where there are some points where Quest 2 loses track of the controller’s position, thus making the error larger.
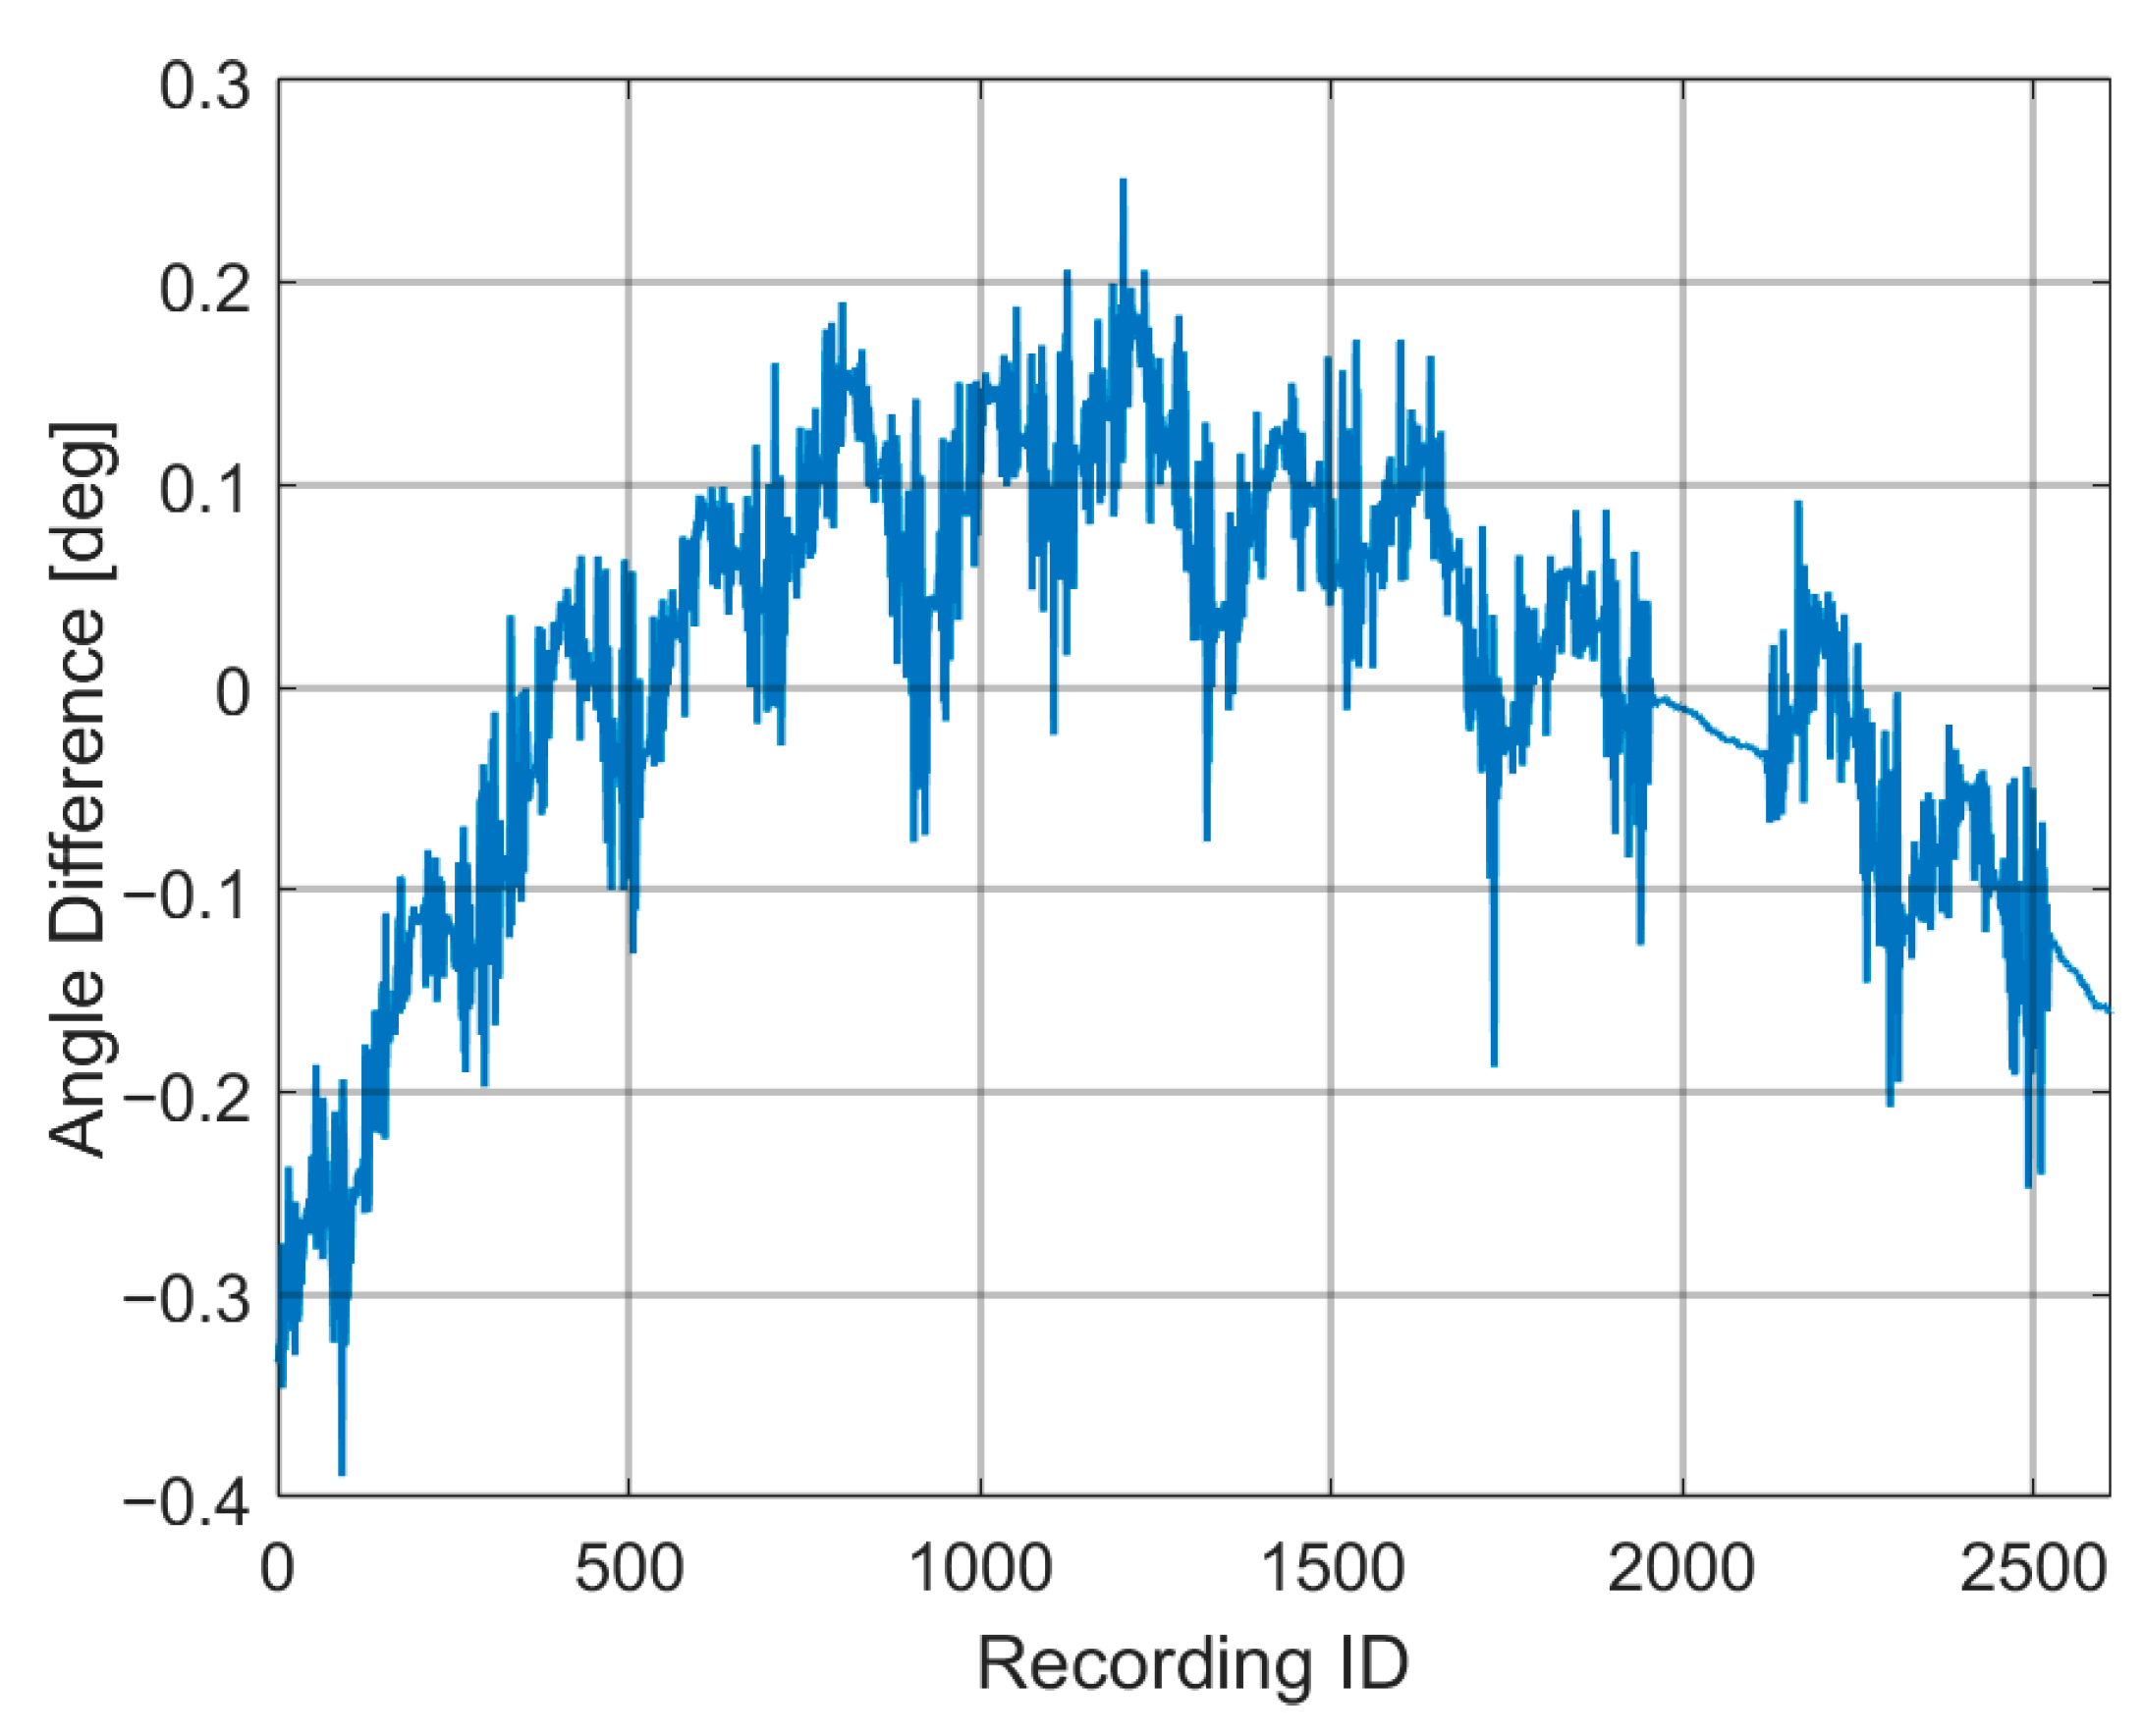
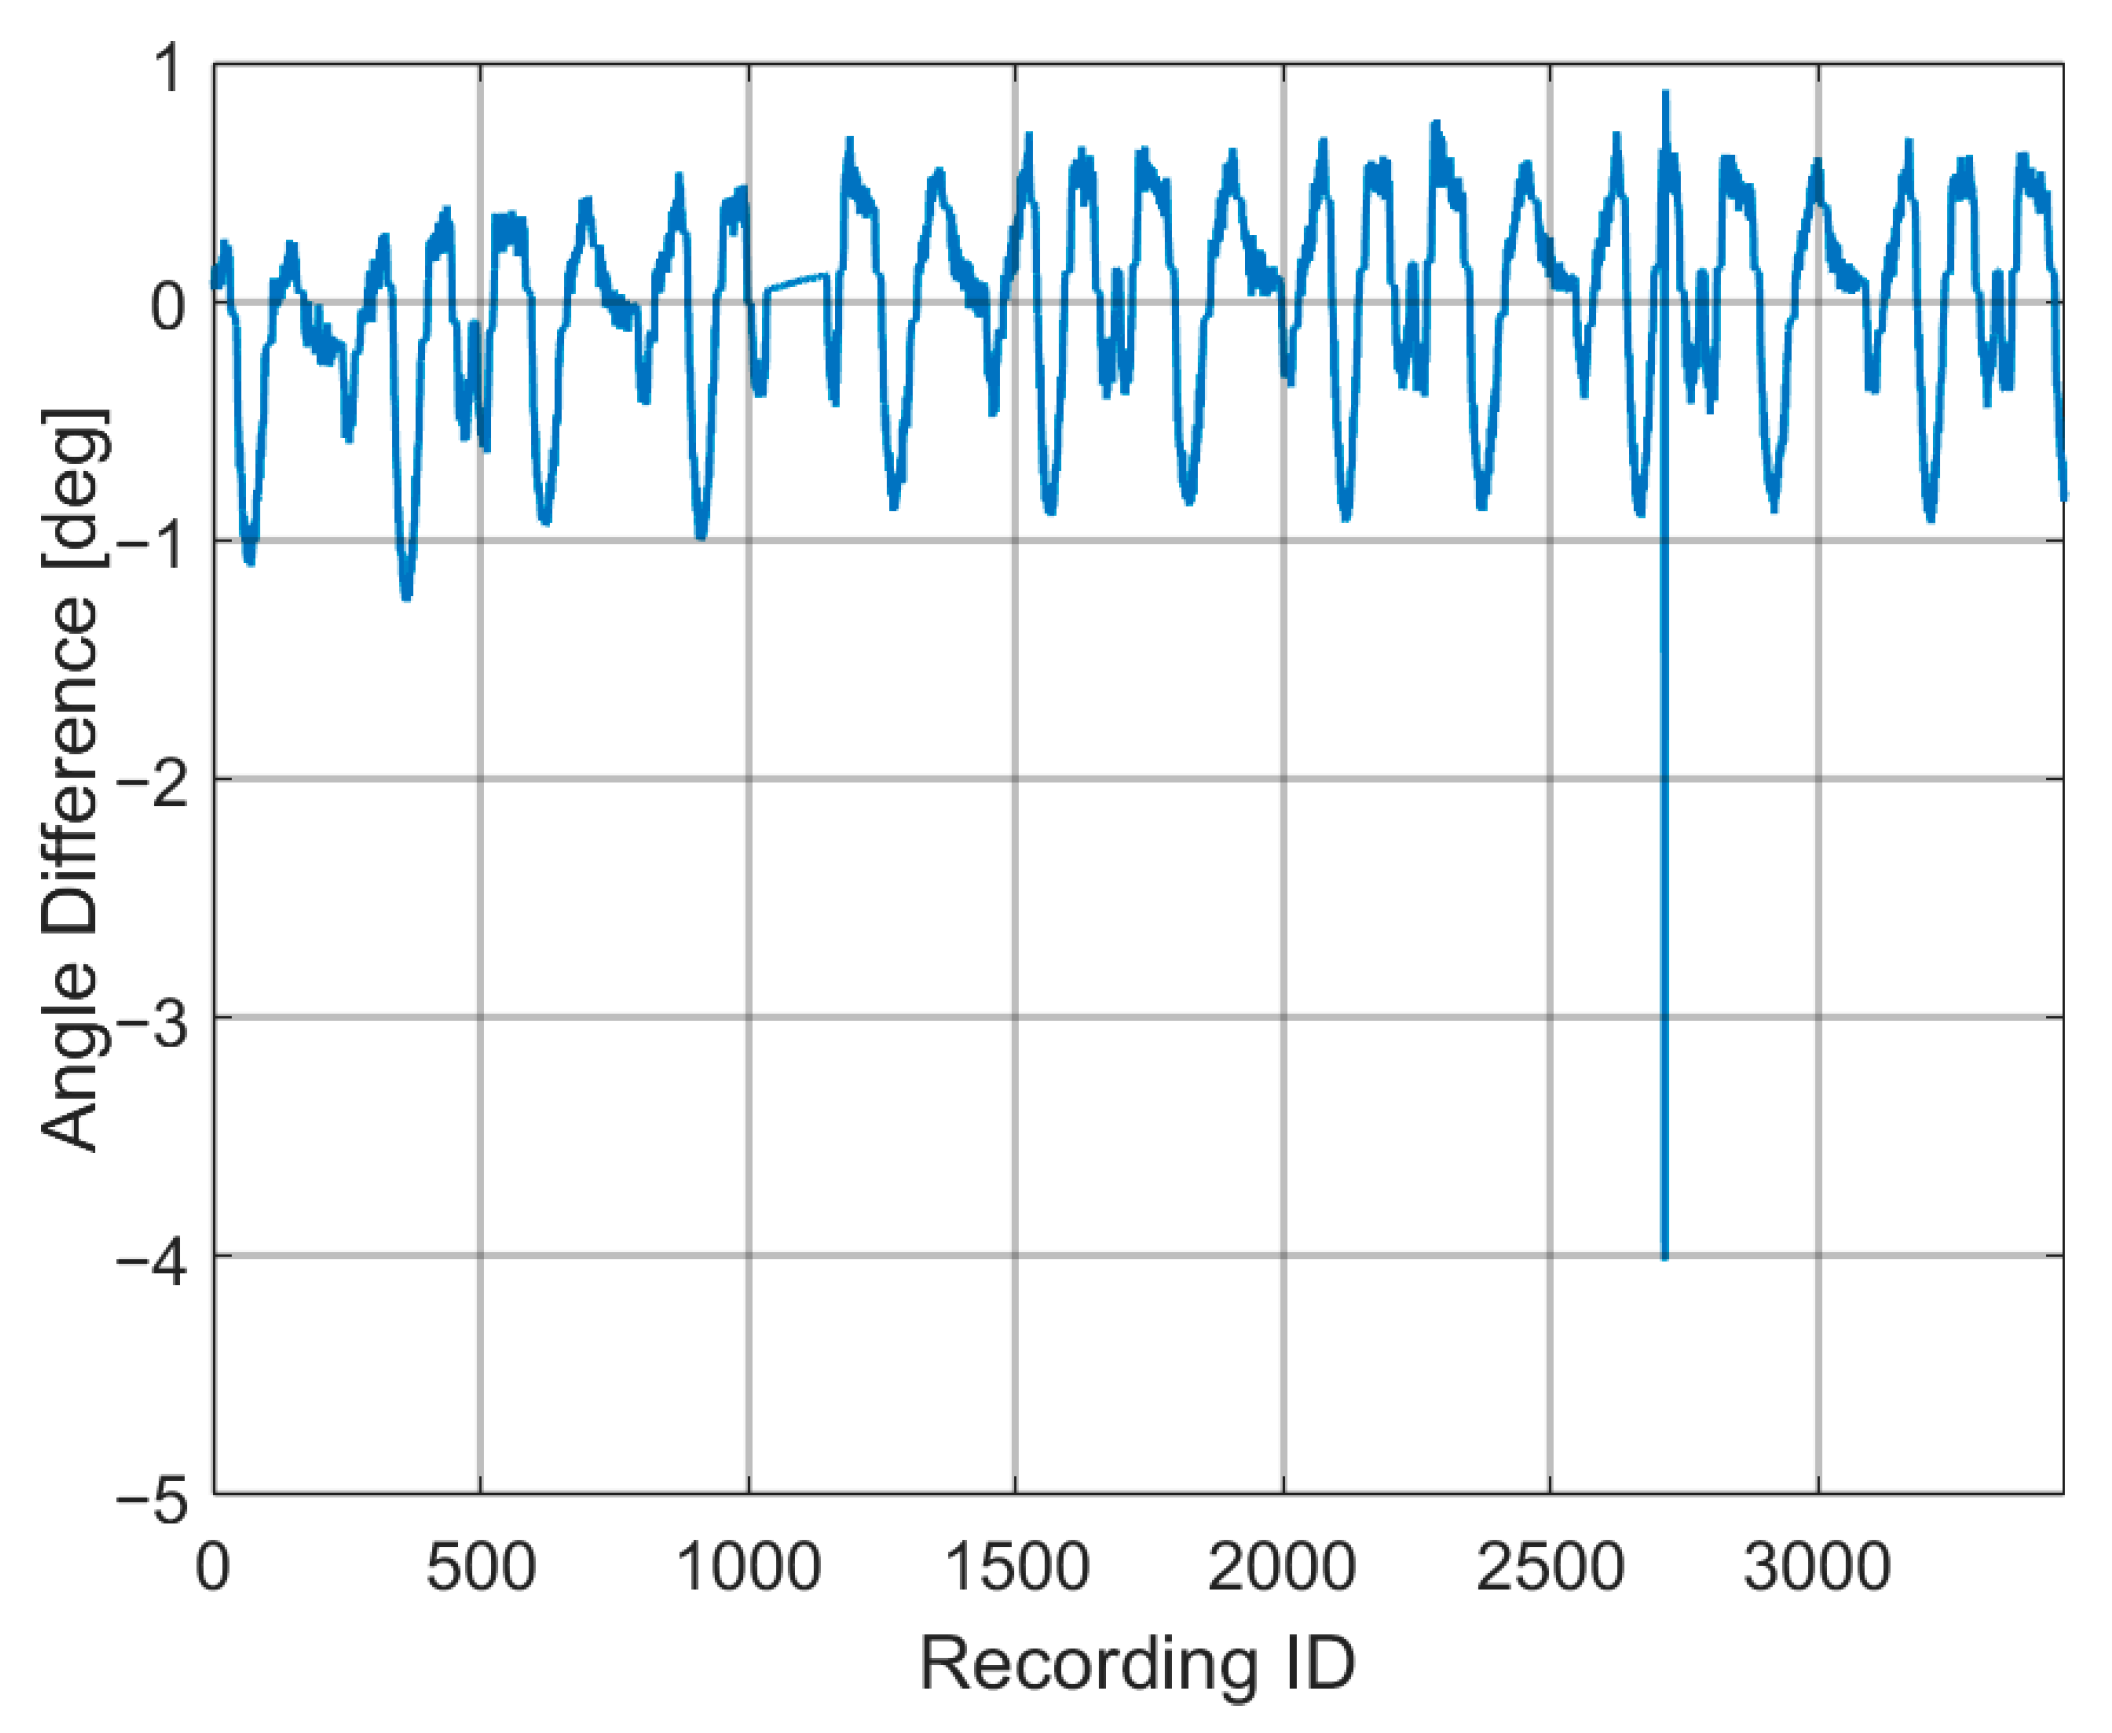
Figure A9 shows the flange’s angle difference between Unity and KUKA for the Point Continuous Dark exercise. As can be seen, the average value rises and falls along the recording; this is unexpected because this type of exercise does not rotate the controller, so the difference should follow a pattern, staying at around the same values. Around Recording ID 2000, the values seem to form a straight line; this happened whenever the robot stopped for a couple of seconds due to the exercise needing to be restarted. We can see that in this downtime, the angle difference changes even though the controller is stopped in place. Even though the Quest 2 seems to have trouble keeping track of the rotation of the controller while it is not rotating, the same is not true for while it is rotating, only having lost track once during the experiments, as can be seen in
Figure A12.
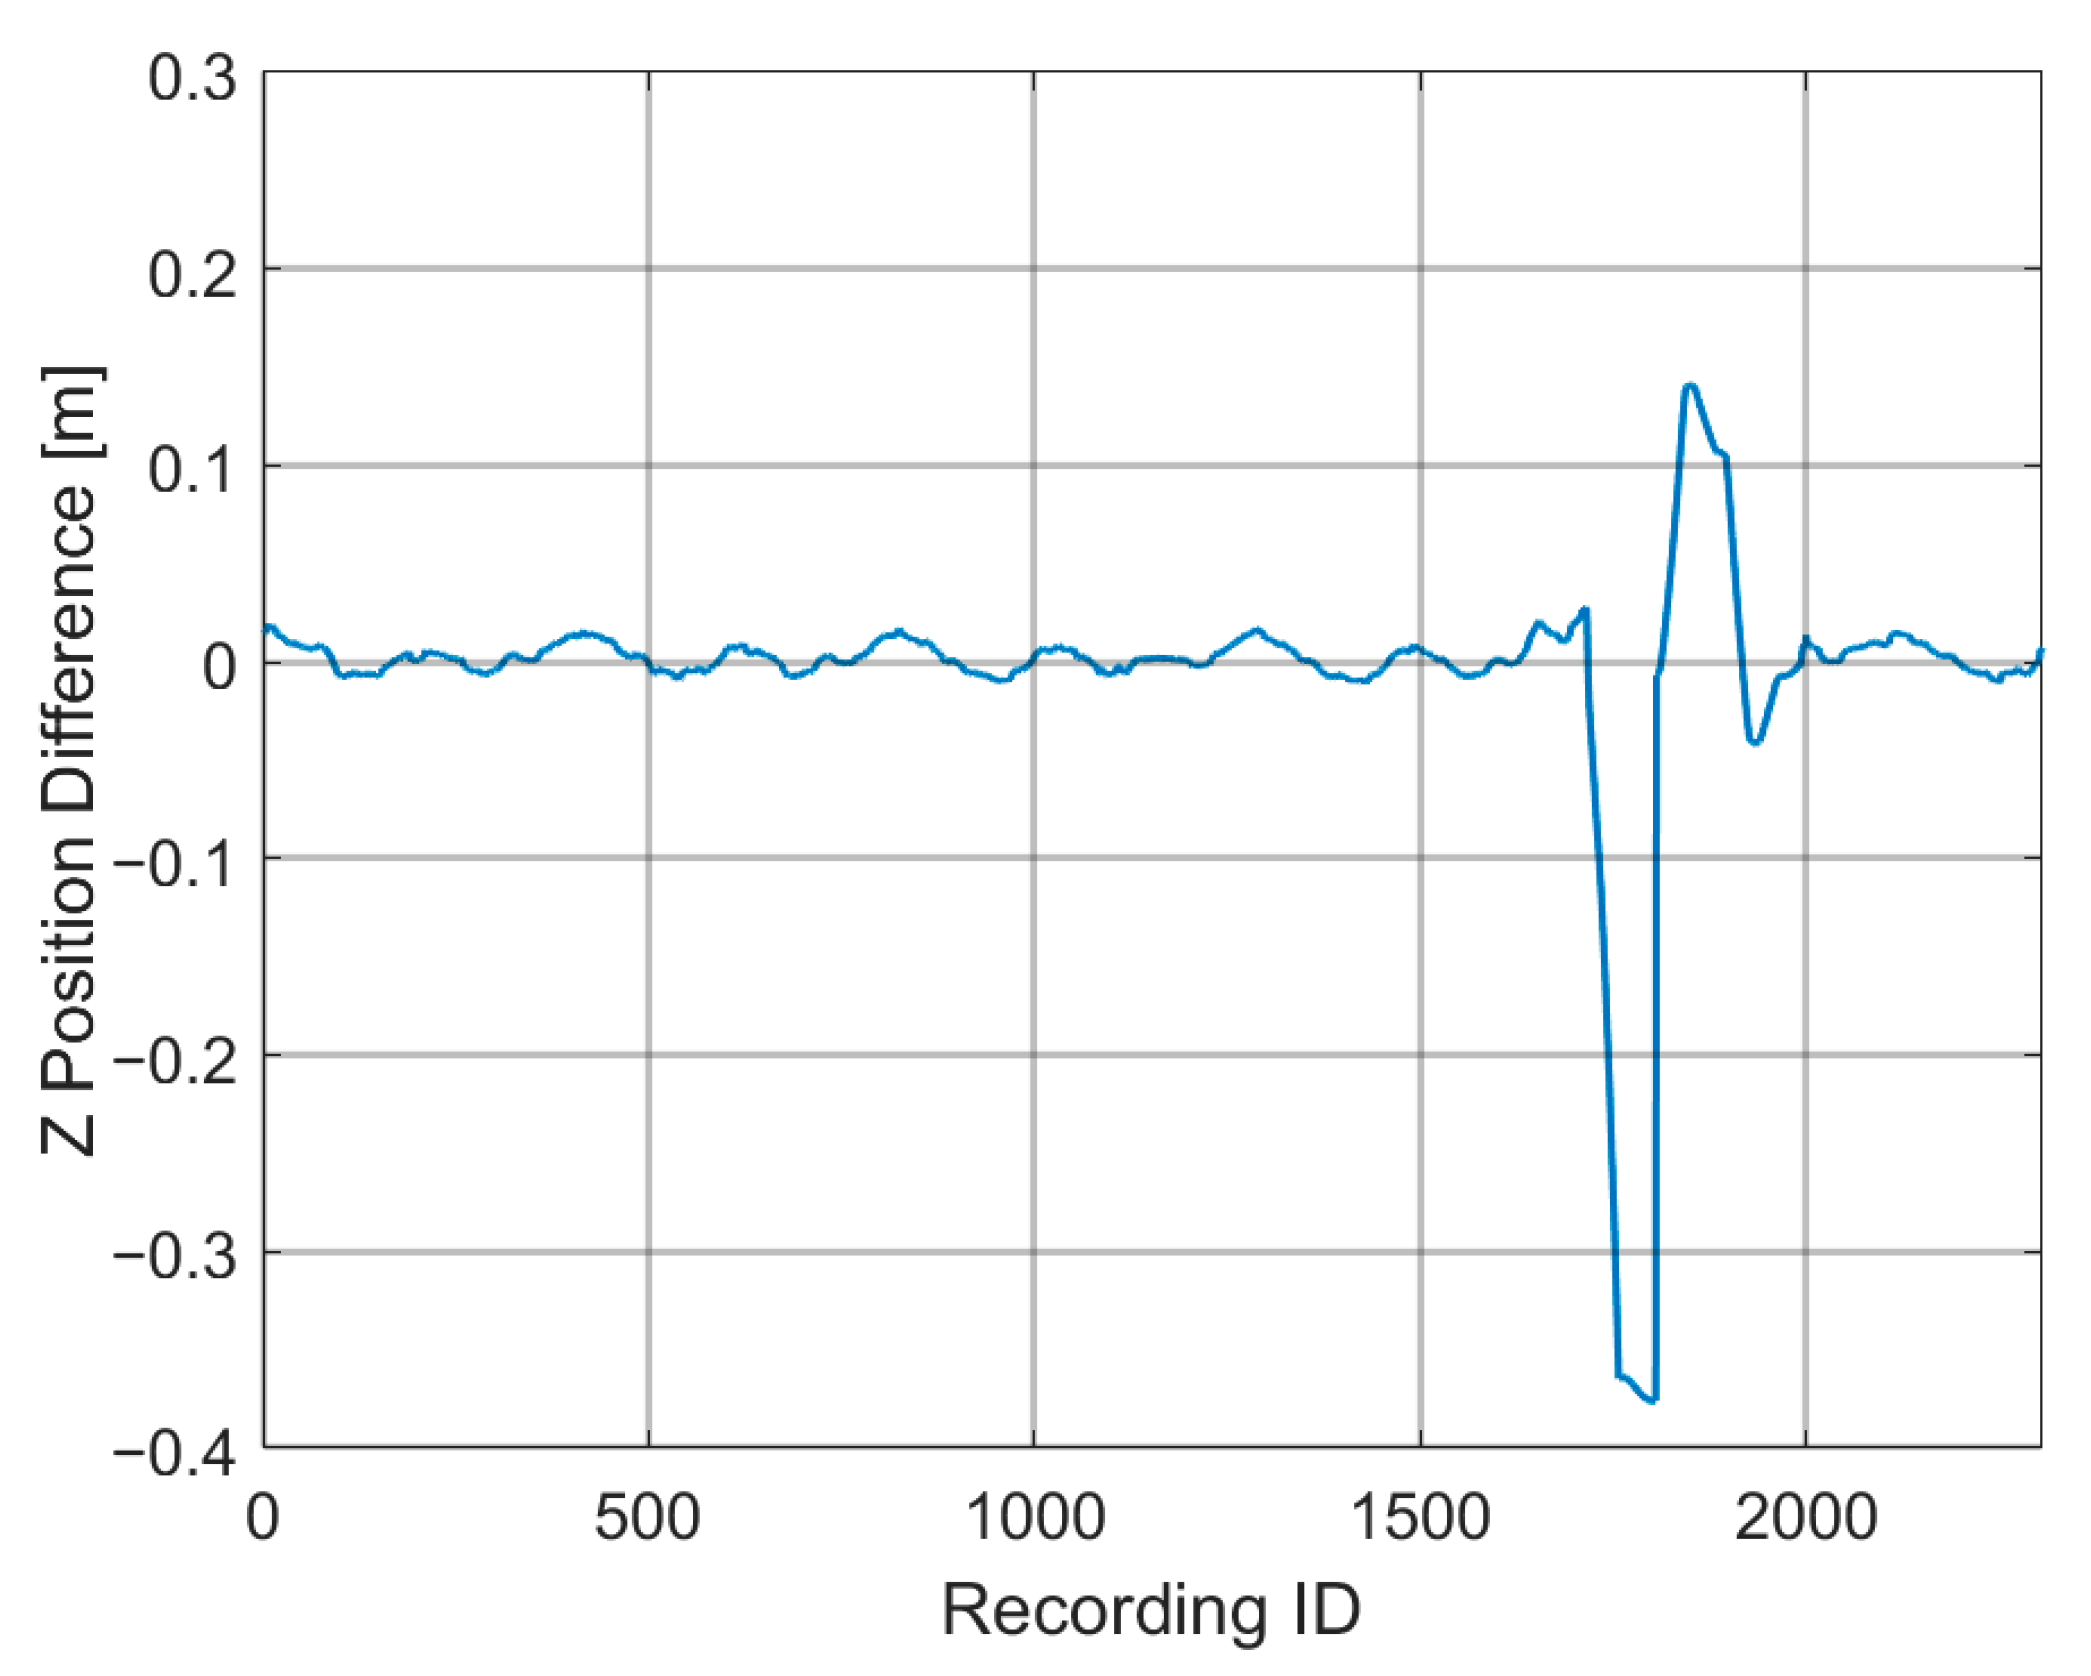
The position error was more inconsistent with exercises tested with patients, such as in
Figure A8; this might have been caused by patients who moved their head, and thus the headset’s field of view, away from the controllers, as the headset needs to see the controllers to track their position. However, rotation of the controllers is still detected even if the controller is not visible, leading to consistent rotation standard deviations, as show in
Figure A7. An example of this can be found in
Figure A11, which shows the difference between the flange’s position in the z axis between Unity and KUKA for one of the participants; there is a large deviation in this difference when compared to the rest of the data. Overall, the results obtained show a high tracking accuracy for the rotation and position of the controllers, being consistent with the results from the articles that studied the Oculus Quest 2.
Furthermore, these results were also consistent with all types of illumination levels, demonstrating that the Quest 2 is precise in all indoor light conditions.
6. Conclusions
From the conducted study, it was possible to verify that the Oculus Quest 2 is a robust system, capable of operating accurately in different lighting conditions and constantly recording movements with an accuracy of millimeters, allowing more precise results and thus detecting small improvements that might otherwise be imperceptible to the naked eye. This precision level, combined with the acquisition and recording of the movements made by patients, will make it possible to use these data to feed artificial intelligence algorithms and perform a “fine” analysis, allowing a more accurate and reliable tracking of the patient’s progress and their response to the exercises. The data obtained from this experiment goes along with what was tested in the articles that also studied the Quest 2 [
7,
11], with our robot-tested translational standard deviation ranging from 4.38 mm to 1.69 mm for the X axis, 13.75 mm to 1.24 mm for the Y axis, and 8.89 mm to 2.52 mm for the Z axis. As for the rotation, the standard deviation ranged from 0.34° to 0.06°.
As future work, a serious game will be developed, using virtual reality and the KUKA’s robotic arm, for rehabilitation therapy and motor re-education of the upper limbs, personalized for each patient by the therapist. Information of the exercise will be stored and later used by the therapists to adapt each exercise further as well as to facilitate the continuous recording of the patient’s clinical evolution.
Study Limitations
The lack of gathered participant data (height and gender, among others) is a limitation of this study that, due to practical constraints and time limitations, we were unable to collect.
Author Contributions
Conceptualization, J.L.V., D.D. and V.C.; methodology, J.L.V. and D.D.; software, D.P. and V.O.; validation, D.P., D.D. and V.C.; formal analysis, D.P. and D.D.; investigation, D.P. and V.O.; resources, J.L.V., D.D. and V.C.; data curation, D.P.; writing—original draft preparation, D.P.; writing—review and editing, J.L.V., D.D. and V.C.; visualization, D.P.; supervision, J.L.V., D.D. and V.C.; project administration, J.L.V., D.D. and V.C.; funding acquisition, J.L.V., D.D. and V.C. All authors have read and agreed to the published version of the manuscript.
Funding
This work was funded by the projects “NORTE-01-0145-FEDER-000045” and “NORTE-01-0145-FEDER-000059”, supported by Northern Portugal Regional Operational Programme (NORTE 2020), under the Portugal 2020 Partnership Agreement, through the European Regional Development Fund (FEDER). It was also funded by national funds, through the FCT (Fundação para a Ciência e a Tecnologia) and FCT/MCTES in the scope of the project UIDB/05549/2020, UIDP/05549/2020, CEECINST/00039/2021 and LASI-LA/P/0104/2020. This project was also funded by the Innovation Pact HfFP—Health From Portugal, co-funded from the “Mobilizing Agendas for Business Innovation” of the “Next Generation EU” program of Component 5 of the Recovery and Resilience Plan (RRP), concerning “Capitalization and Business Innovation”, under the Regulation of the Incentive System “Agendas for Business Innovation”.
Data Availability Statement
The data presented in this study are available on request from the corresponding authors. The data are not publicly available due to the project being ongoing.
Conflicts of Interest
The authors declare no conflict of interest.
Appendix A. Robot-Tested Mean Squared Error
Figure A1.
Rotation mean squared error.
Figure A1.
Rotation mean squared error.
Figure A2.
Position X coordinate mean squared error.
Figure A2.
Position X coordinate mean squared error.
Figure A3.
Position Y coordinate mean squared error.
Figure A3.
Position Y coordinate mean squared error.
Figure A4.
Position Z coordinate mean squared error.
Figure A4.
Position Z coordinate mean squared error.
Appendix B. Robot-Tested Deviation Data
Figure A5.
Robot-tested rotation error: average and standard deviation.
Figure A5.
Robot-tested rotation error: average and standard deviation.
Figure A6.
Robot-tested position error: average and standard deviation for the X, Y, and Z axes.
Figure A6.
Robot-tested position error: average and standard deviation for the X, Y, and Z axes.
Appendix C. Participant-Tested Deviation Data
Figure A7.
Participant-tested rotation error: average and standard deviation.
Figure A7.
Participant-tested rotation error: average and standard deviation.
Figure A8.
Participant-tested position error: average and standard deviation for the X, Y, and Z axes.
Figure A8.
Participant-tested position error: average and standard deviation for the X, Y, and Z axes.
Appendix D. Data Examples
Figure A9.
Difference of the flanges’ angle between Unity and KUKA during the Continuous Point Dark exercise.
Figure A9.
Difference of the flanges’ angle between Unity and KUKA during the Continuous Point Dark exercise.
Figure A10.
Difference of the flanges’ position in the Y axis between Unity and KUKA during the Continuous Angle Dark exercise.
Figure A10.
Difference of the flanges’ position in the Y axis between Unity and KUKA during the Continuous Angle Dark exercise.
Figure A11.
Difference of the flanges’ position in the Z axis between Unity and KUKA for Participant 20.
Figure A11.
Difference of the flanges’ position in the Z axis between Unity and KUKA for Participant 20.
Figure A12.
Difference of the flanges’ angle between Unity and KUKA during the Continuous Angle Artificial exercise.
Figure A12.
Difference of the flanges’ angle between Unity and KUKA during the Continuous Angle Artificial exercise.
References
- Berntsen, K.; Palacios, R.C.; Herranz, E. Virtual reality and its uses: A systematic literature review. In Proceedings of the Fourth International Conference on Technological Ecosystems for Enhancing Multiculturality, Salamanca, Spain, 2–4 November 2016; pp. 435–439. [Google Scholar]
- Lányi, C.S. Virtual reality in healthcare. In Intelligent Paradigms for Assistive and Preventive Healthcare; Springer: Berlin/Heidelberg, Germany, 2006; pp. 87–116. [Google Scholar]
- Rus-Calafell, M.; Garety, P.; Sason, E.; Craig, T.J.; Valmaggia, L.R. Virtual reality in the assessment and treatment of psychosis: A systematic review of its utility, acceptability and effectiveness. Psychol. Med. 2018, 48, 362–391. [Google Scholar] [CrossRef] [PubMed]
- Pereira, D.; Duque, D.; Carvalho, V. A systematic review of the use of virtual reality games in post-stroke rehabilitation. In Proceedings of the 2021 IEEE 9th International Conference on Serious Games and Applications for Health (SeGAH), Dubai, United Arab Emirates, 4–6 August 2021; pp. 1–5. [Google Scholar]
- Ameler, T.; Blohme, K.; Brandt, L.; Brüngel, R.; Hensel, A.; Huber, L.; Kuper, F.; Swoboda, J.; Warnecke, M.; Warzecha, M.; et al. A comparative evaluation of steamvr tracking and the optitrack system for medical device tracking. In Proceedings of the 2019 41st annual international conference of the IEEE engineering in medicine and biology society (EMBC), Berlin, Germany, 23–27 July 2019; pp. 1465–1470. [Google Scholar]
- Borges, M.; Symington, A.; Coltin, B.; Smith, T.; Ventura, R. Htc vive: Analysis and accuracy improvement. In Proceedings of the 2018 IEEE/RSJ International Conference on Intelligent Robots and Systems (IROS), Madrid, Spain, 1–5 October 2018; pp. 2610–2615. [Google Scholar]
- Holzwarth, V.; Gisler, J.; Hirt, C.; Kunz, A. Comparing the accuracy and precision of steamvr tracking 2.0 and oculus quest 2 in a room scale setup. In Proceedings of the 2021 the 5th International Conference on Virtual and Augmented Reality Simulations, Melbourne, Australia, 20–22 March 2021; pp. 42–46. [Google Scholar]
- Niehorster, D.C.; Li, L.; Lappe, M. The accuracy and precision of position and orientation tracking in the htc vive virtual reality system for scientific research. i-Perception 2017, 8, 2041669517708205. [Google Scholar] [CrossRef] [PubMed]
- Spitzley, K.A.; Karduna, A.R. Feasibility of using a fully immersive virtual reality system for kinematic data collection. J. Biomech. 2019, 87, 172–176. [Google Scholar] [CrossRef]
- Jost, T.A.; Nelson, B.; Rylander, J. Quantitative analysis of the oculus rift in controlled movement. Disabil. Rehabil. Assist. Technol. 2021, 16, 632–636. [Google Scholar] [CrossRef]
- Carnevale, A.; Mannocchi, I.; Sassi, M.S.H.; Carli, M.; De Luca, G.; Longo, U.G.; Denaro, V.; Schena, E. Virtual reality for shoulder rehabilitation: Accuracy evaluation of oculus quest 2. Sensors 2022, 22, 5511. [Google Scholar] [CrossRef] [PubMed]
- VIVE. Verifying Your Setup. Available online: https://www.vive.com/uk/support/vive/category_howto/verifying-your-setup.html (accessed on 10 January 2023).
- Meta. Meta Quest 2 Tech Specs. 2023. Available online: https://www.meta.com/quest/products/quest-2/tech-specs/ (accessed on 10 January 2023).
- Hesch, J.; Kozminski, A.; Linde, O. Powered by Ai: Oculus Insight. 2019. Available online: https://ai.facebook.com/blog/powered-by-ai-oculus-insight/ (accessed on 2 February 2023).
| Disclaimer/Publisher’s Note: The statements, opinions and data contained in all publications are solely those of the individual author(s) and contributor(s) and not of MDPI and/or the editor(s). MDPI and/or the editor(s) disclaim responsibility for any injury to people or property resulting from any ideas, methods, instructions or products referred to in the content. |
© 2023 by the authors. Licensee MDPI, Basel, Switzerland. This article is an open access article distributed under the terms and conditions of the Creative Commons Attribution (CC BY) license (https://creativecommons.org/licenses/by/4.0/).


 ,
, 


