
A New Approach to Study the Effect of Complexity on an External Gear Pump Model to Generate Data Source for AI-Based Condition Monitoring Application †


Abstract
:1. Introduction
- (1)
- A new approach, which relies on a detailed geometric model for simulating the EGP, is proposed.
- (2)
- The approach is assessed by comparing two models that were previously examined, with each model being validated against experimental data from the study case of an electrified reach truck.
- (3)
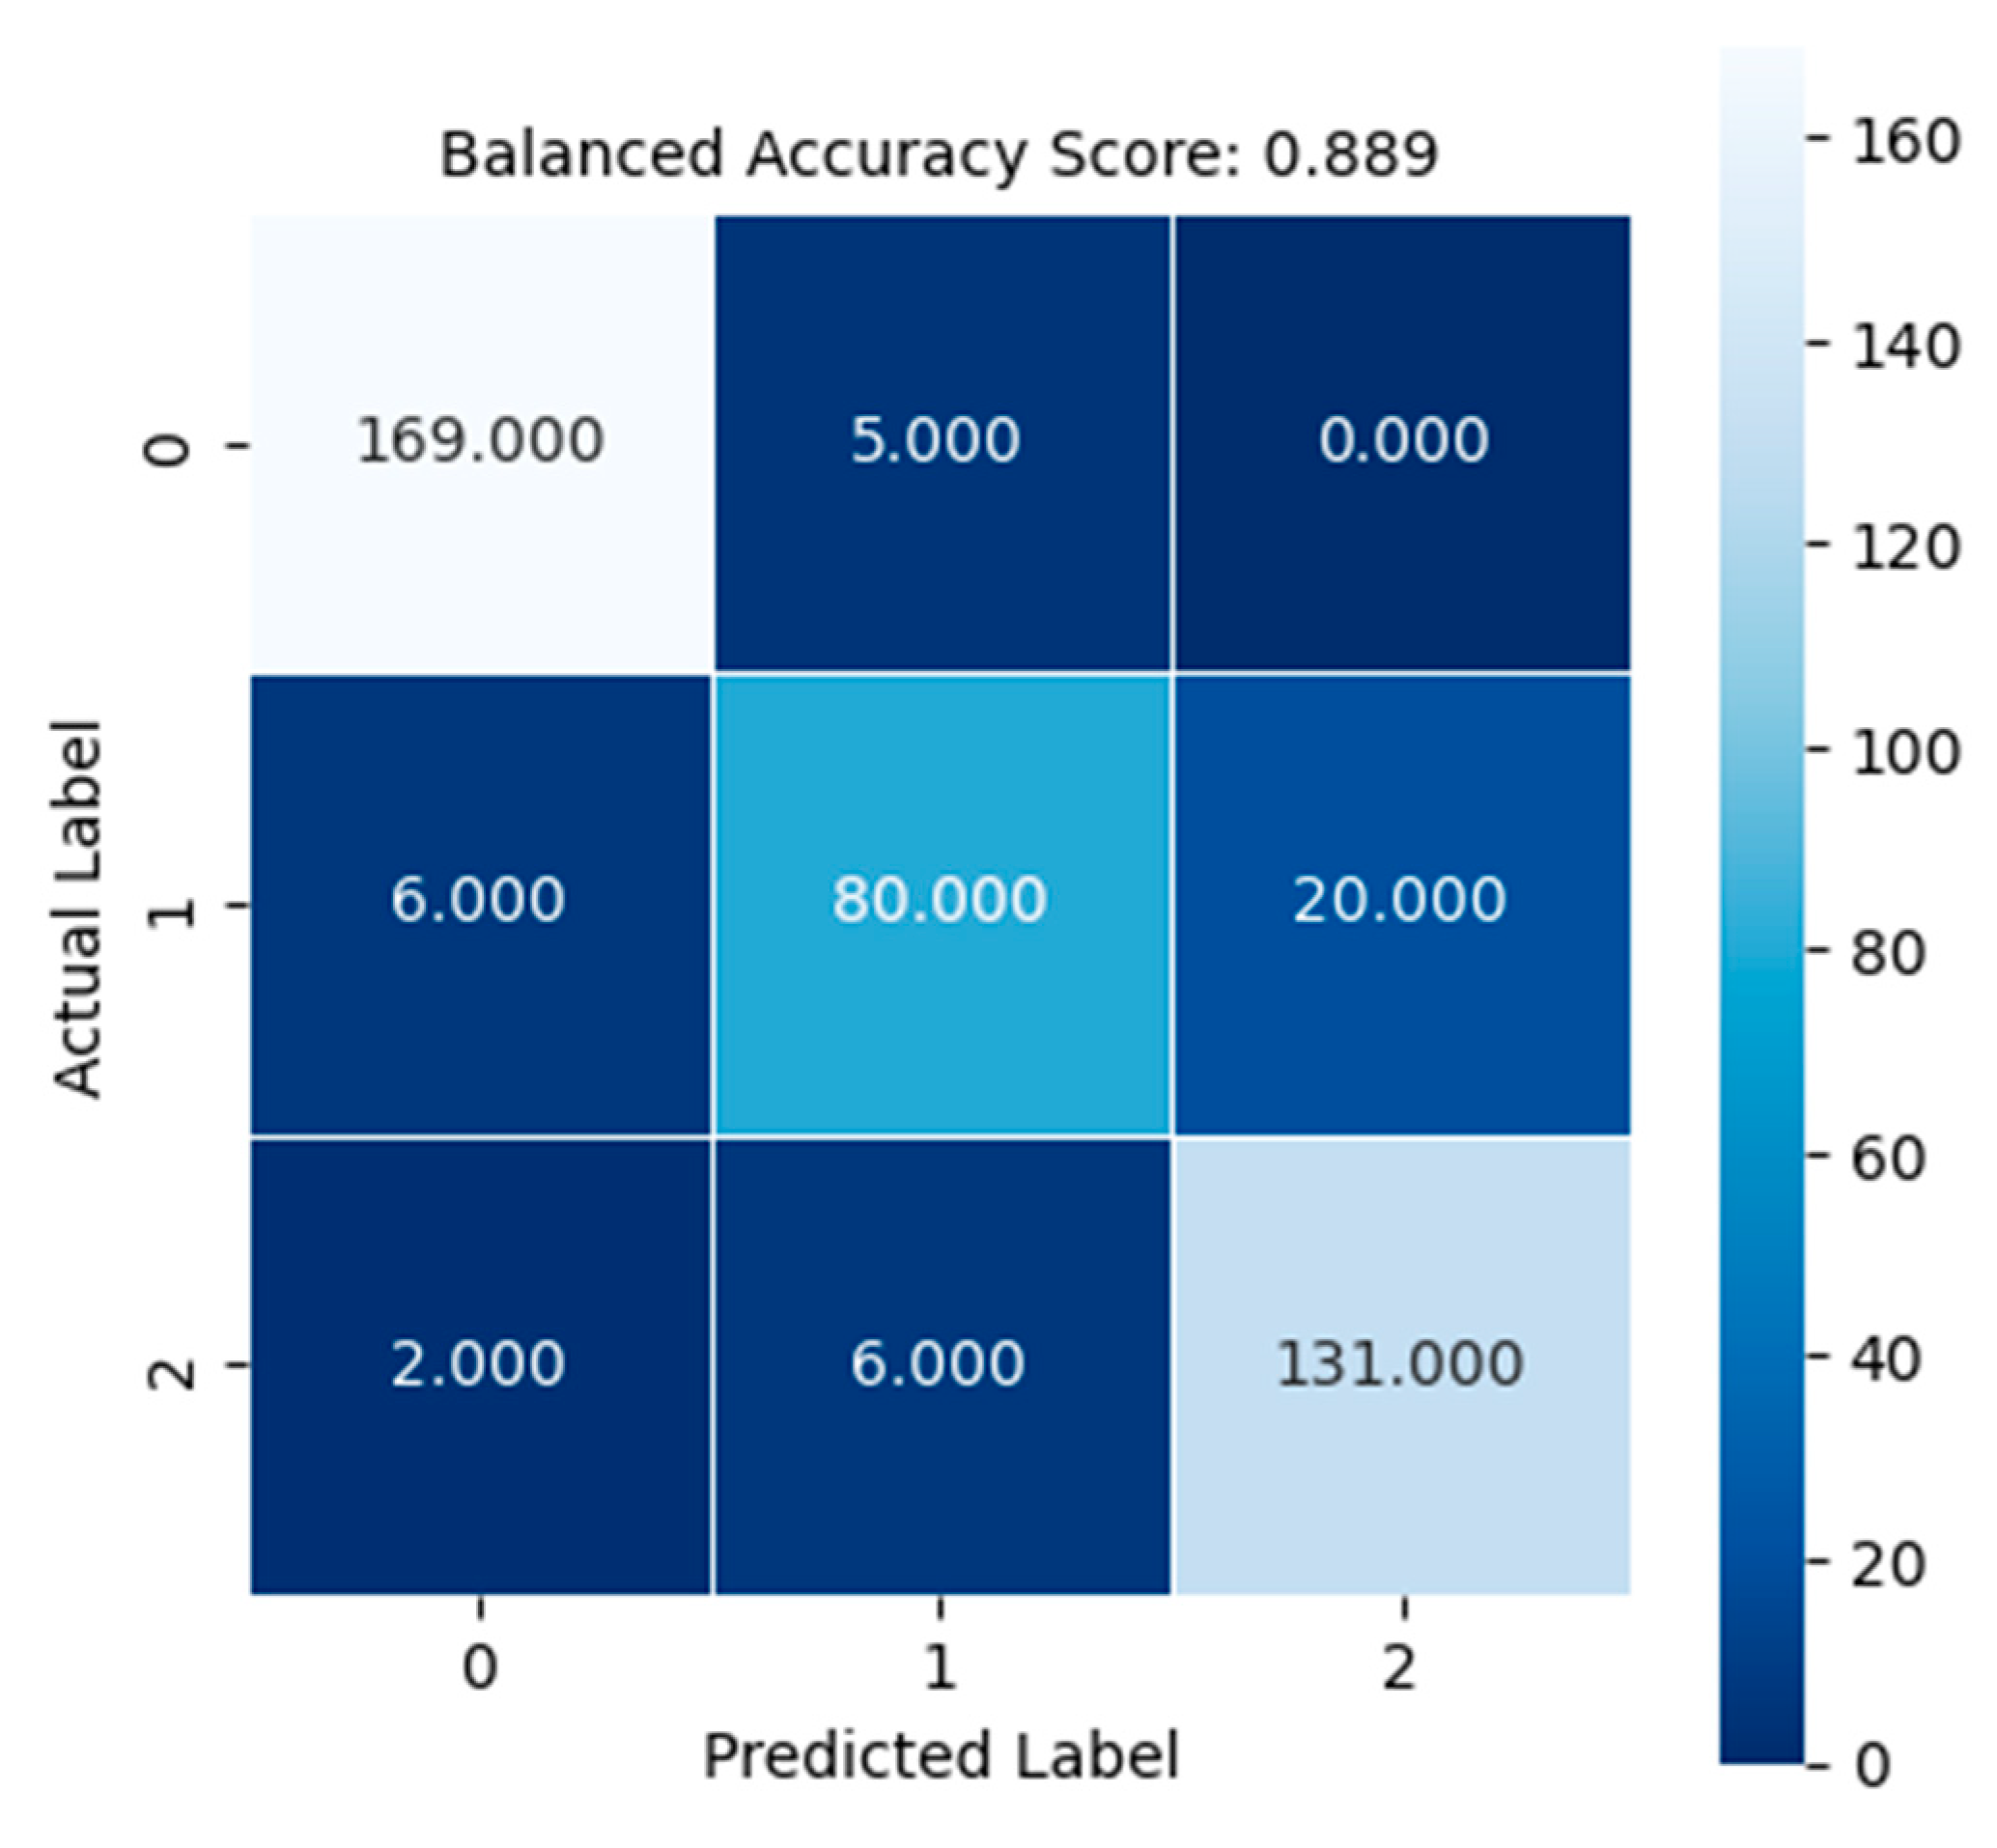
- A test classifier is developed to assess the data reliability from the top-performing model for automated condition monitoring of EGP.
2. Methods
2.1. External Gear Pump Models
2.2. Case
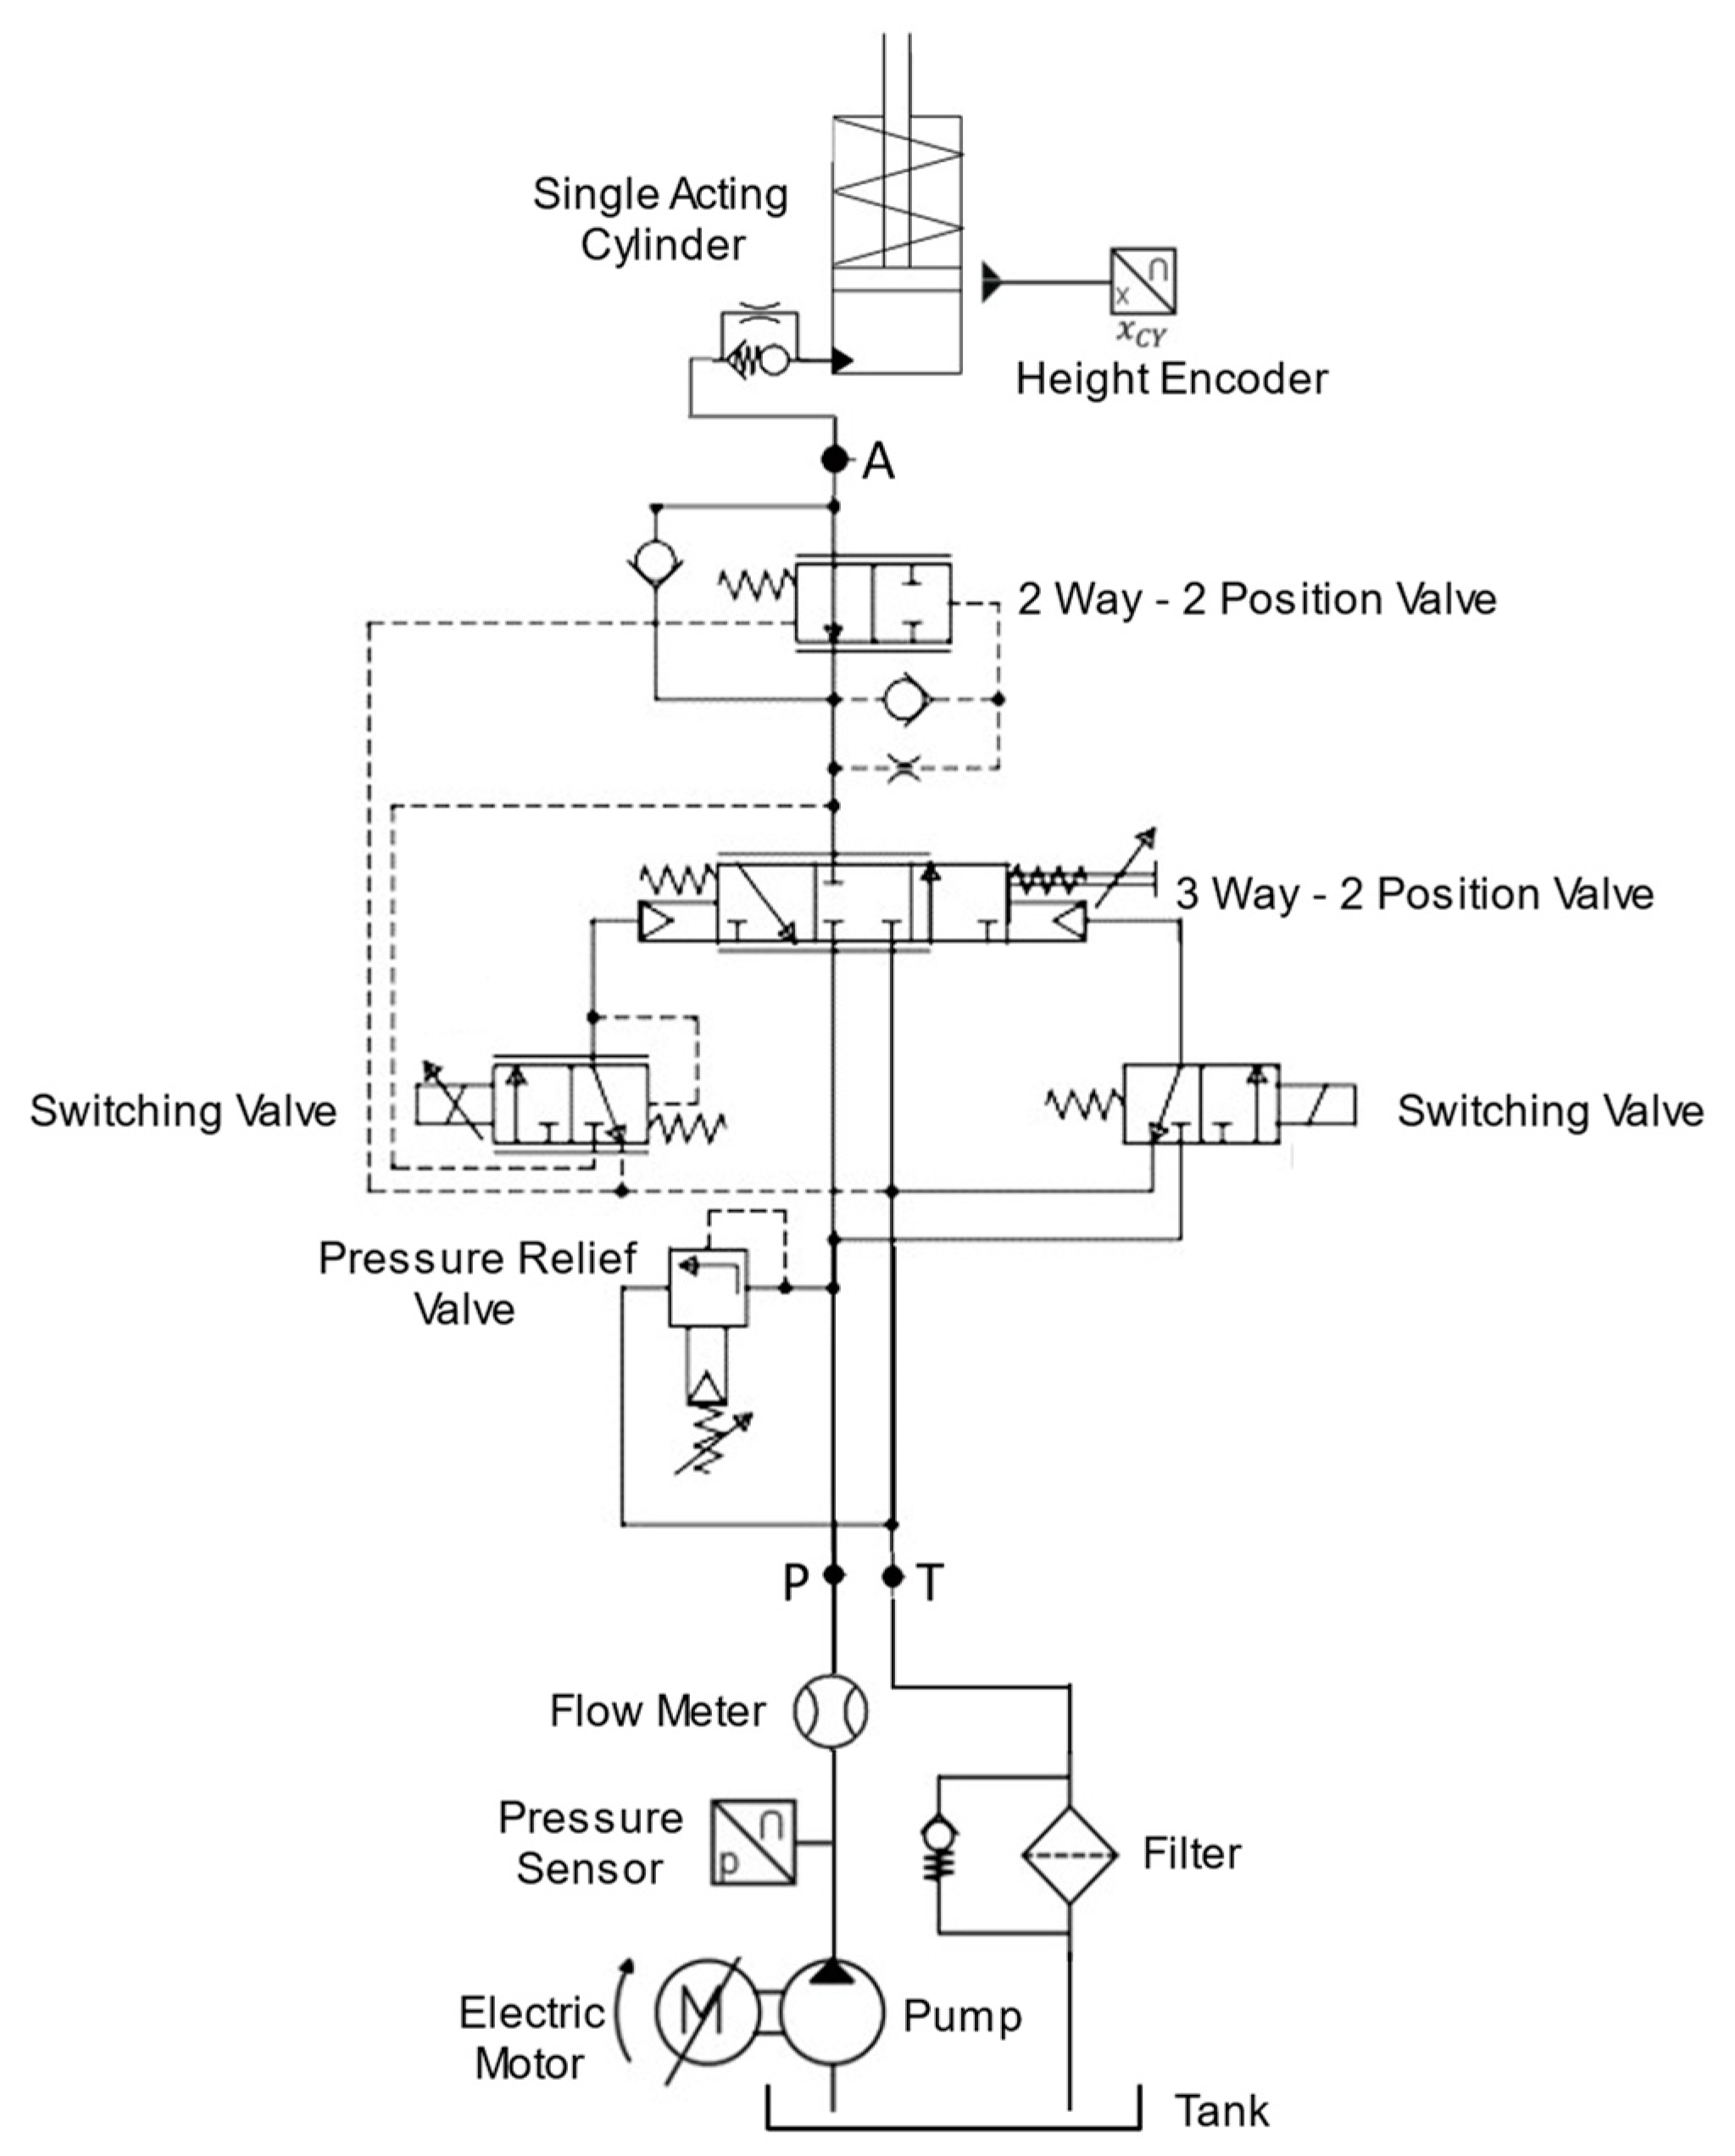
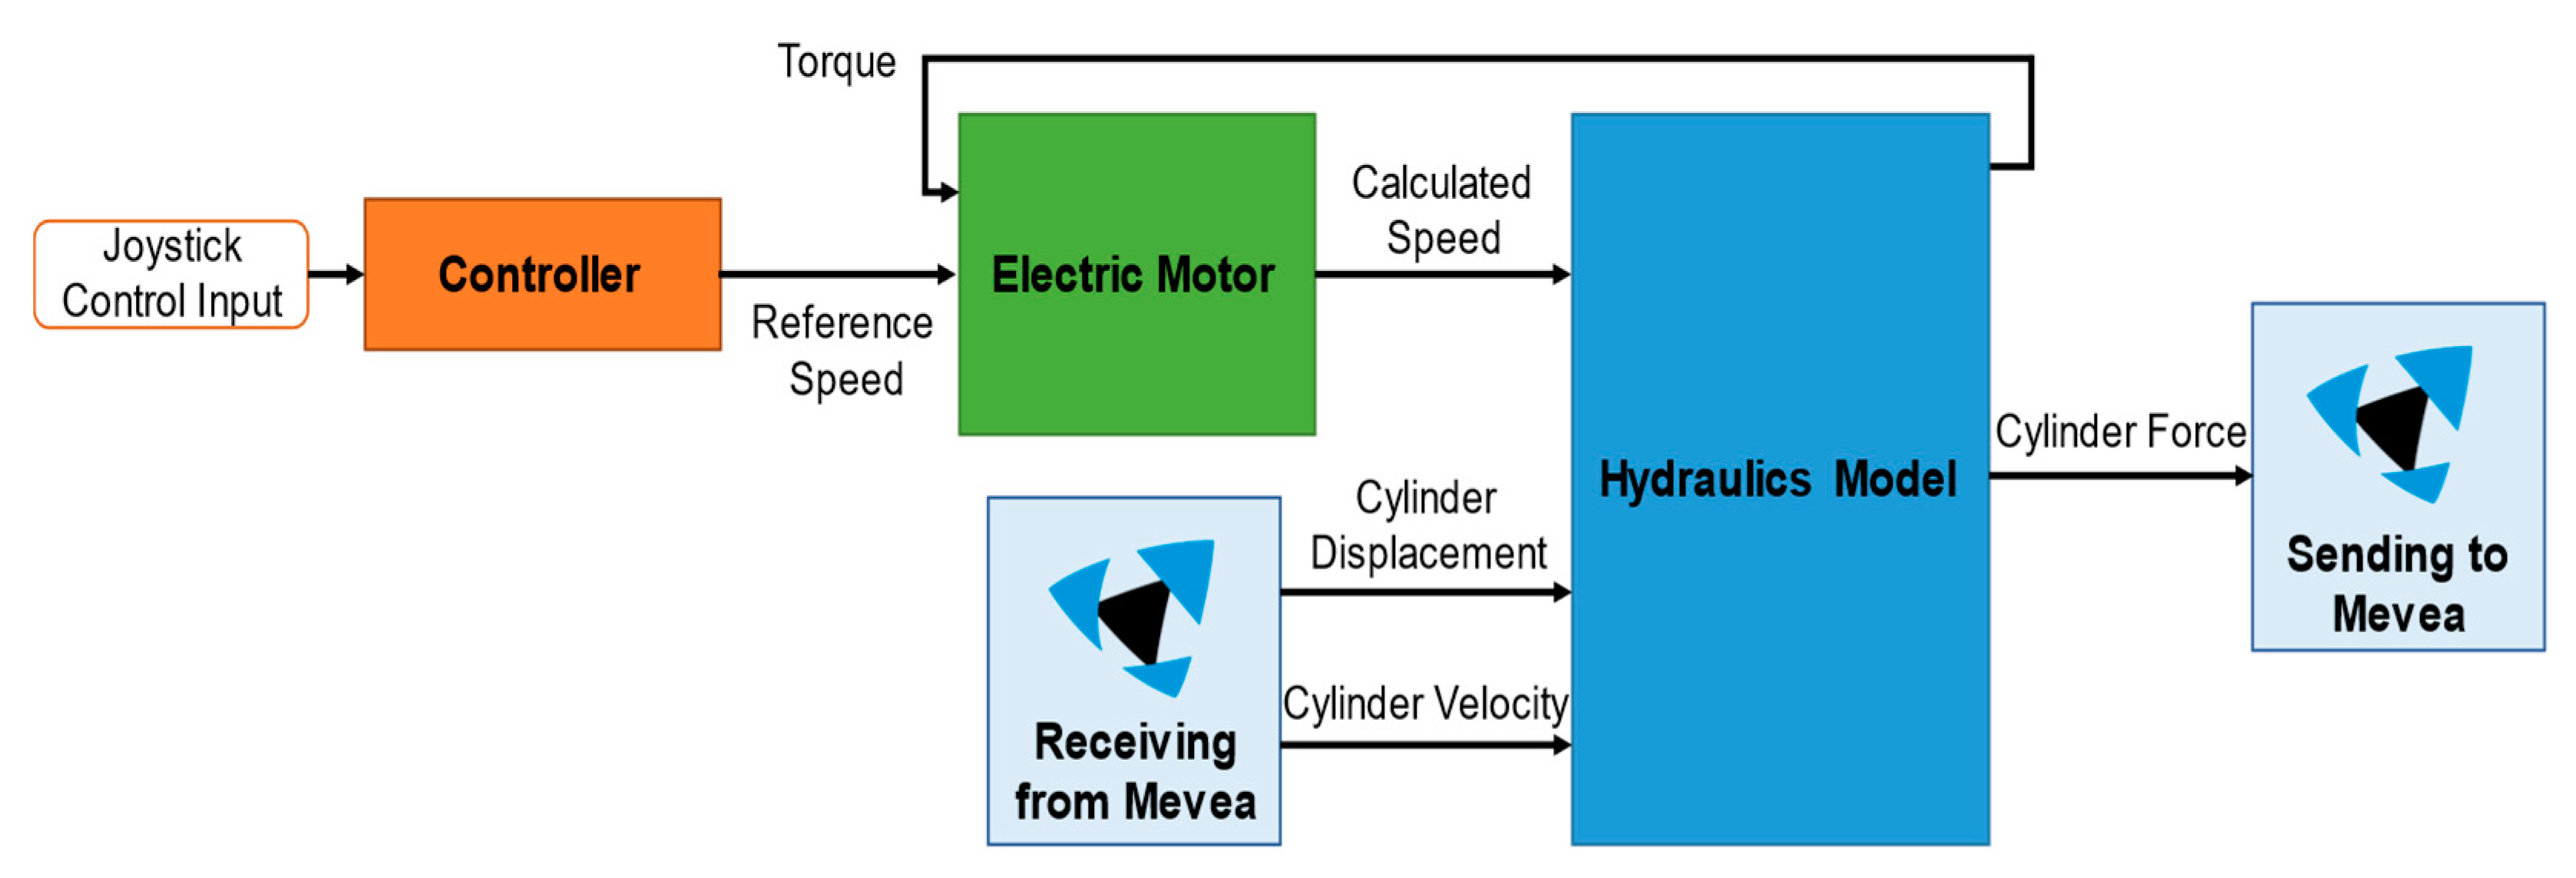
2.3. Experimental Setup
3. Results and Discussion
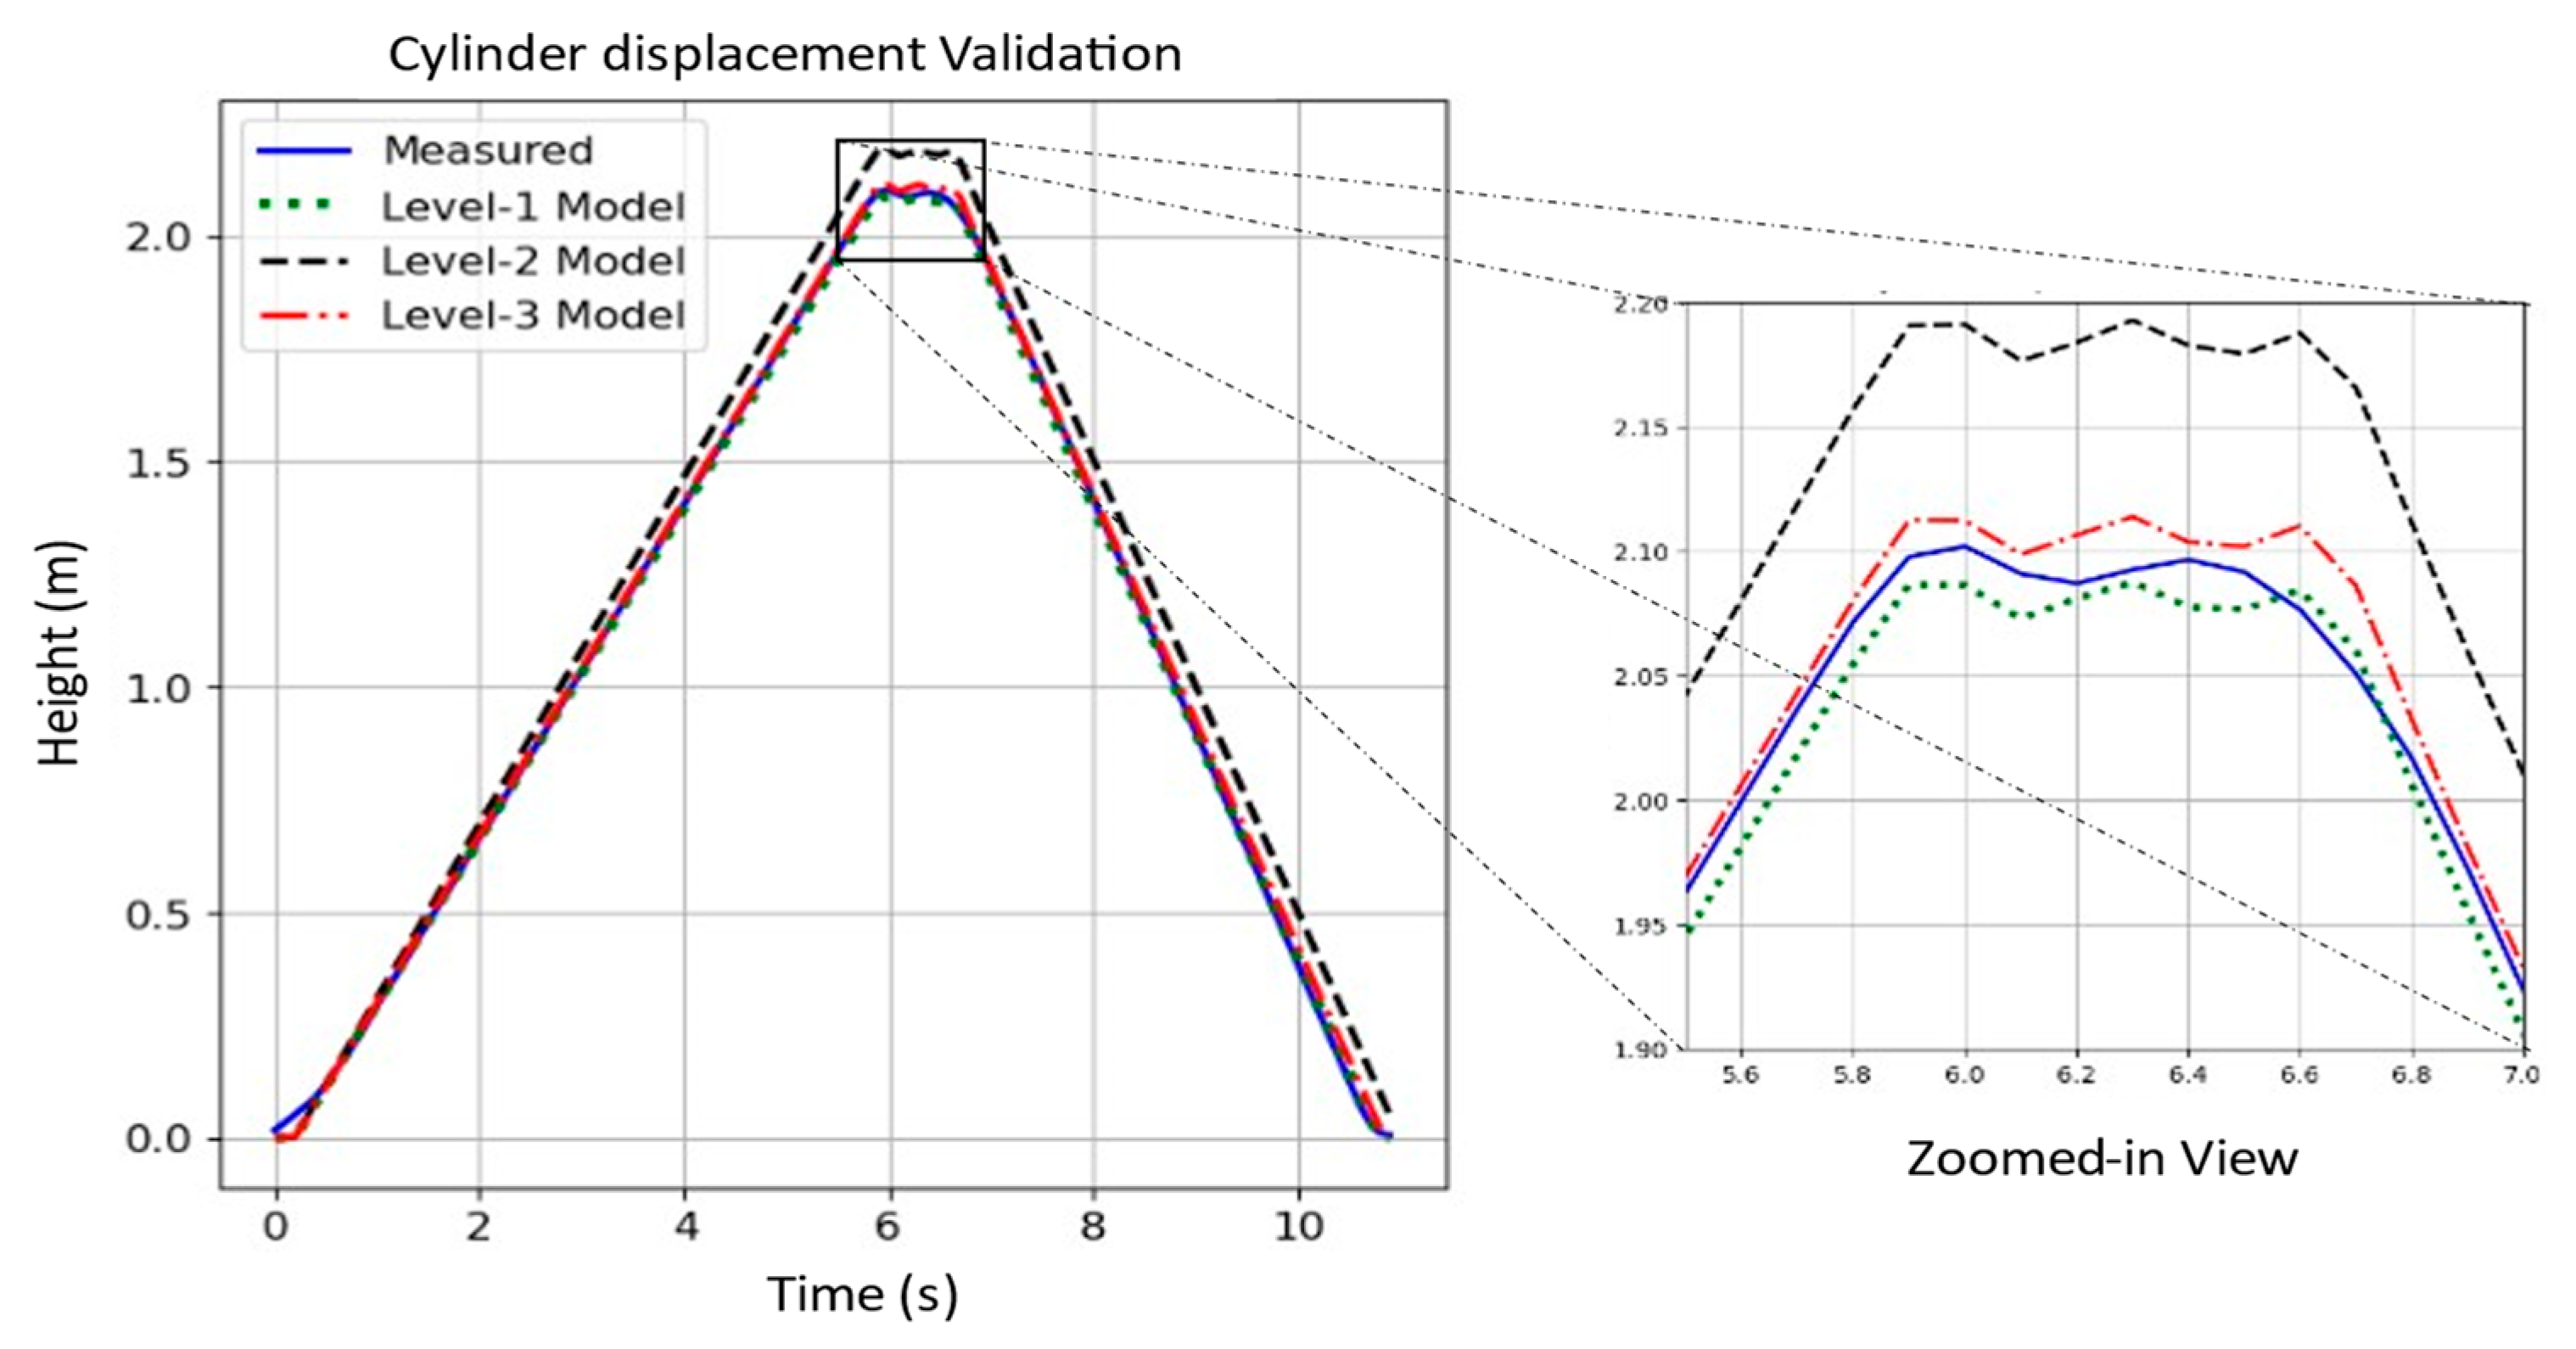
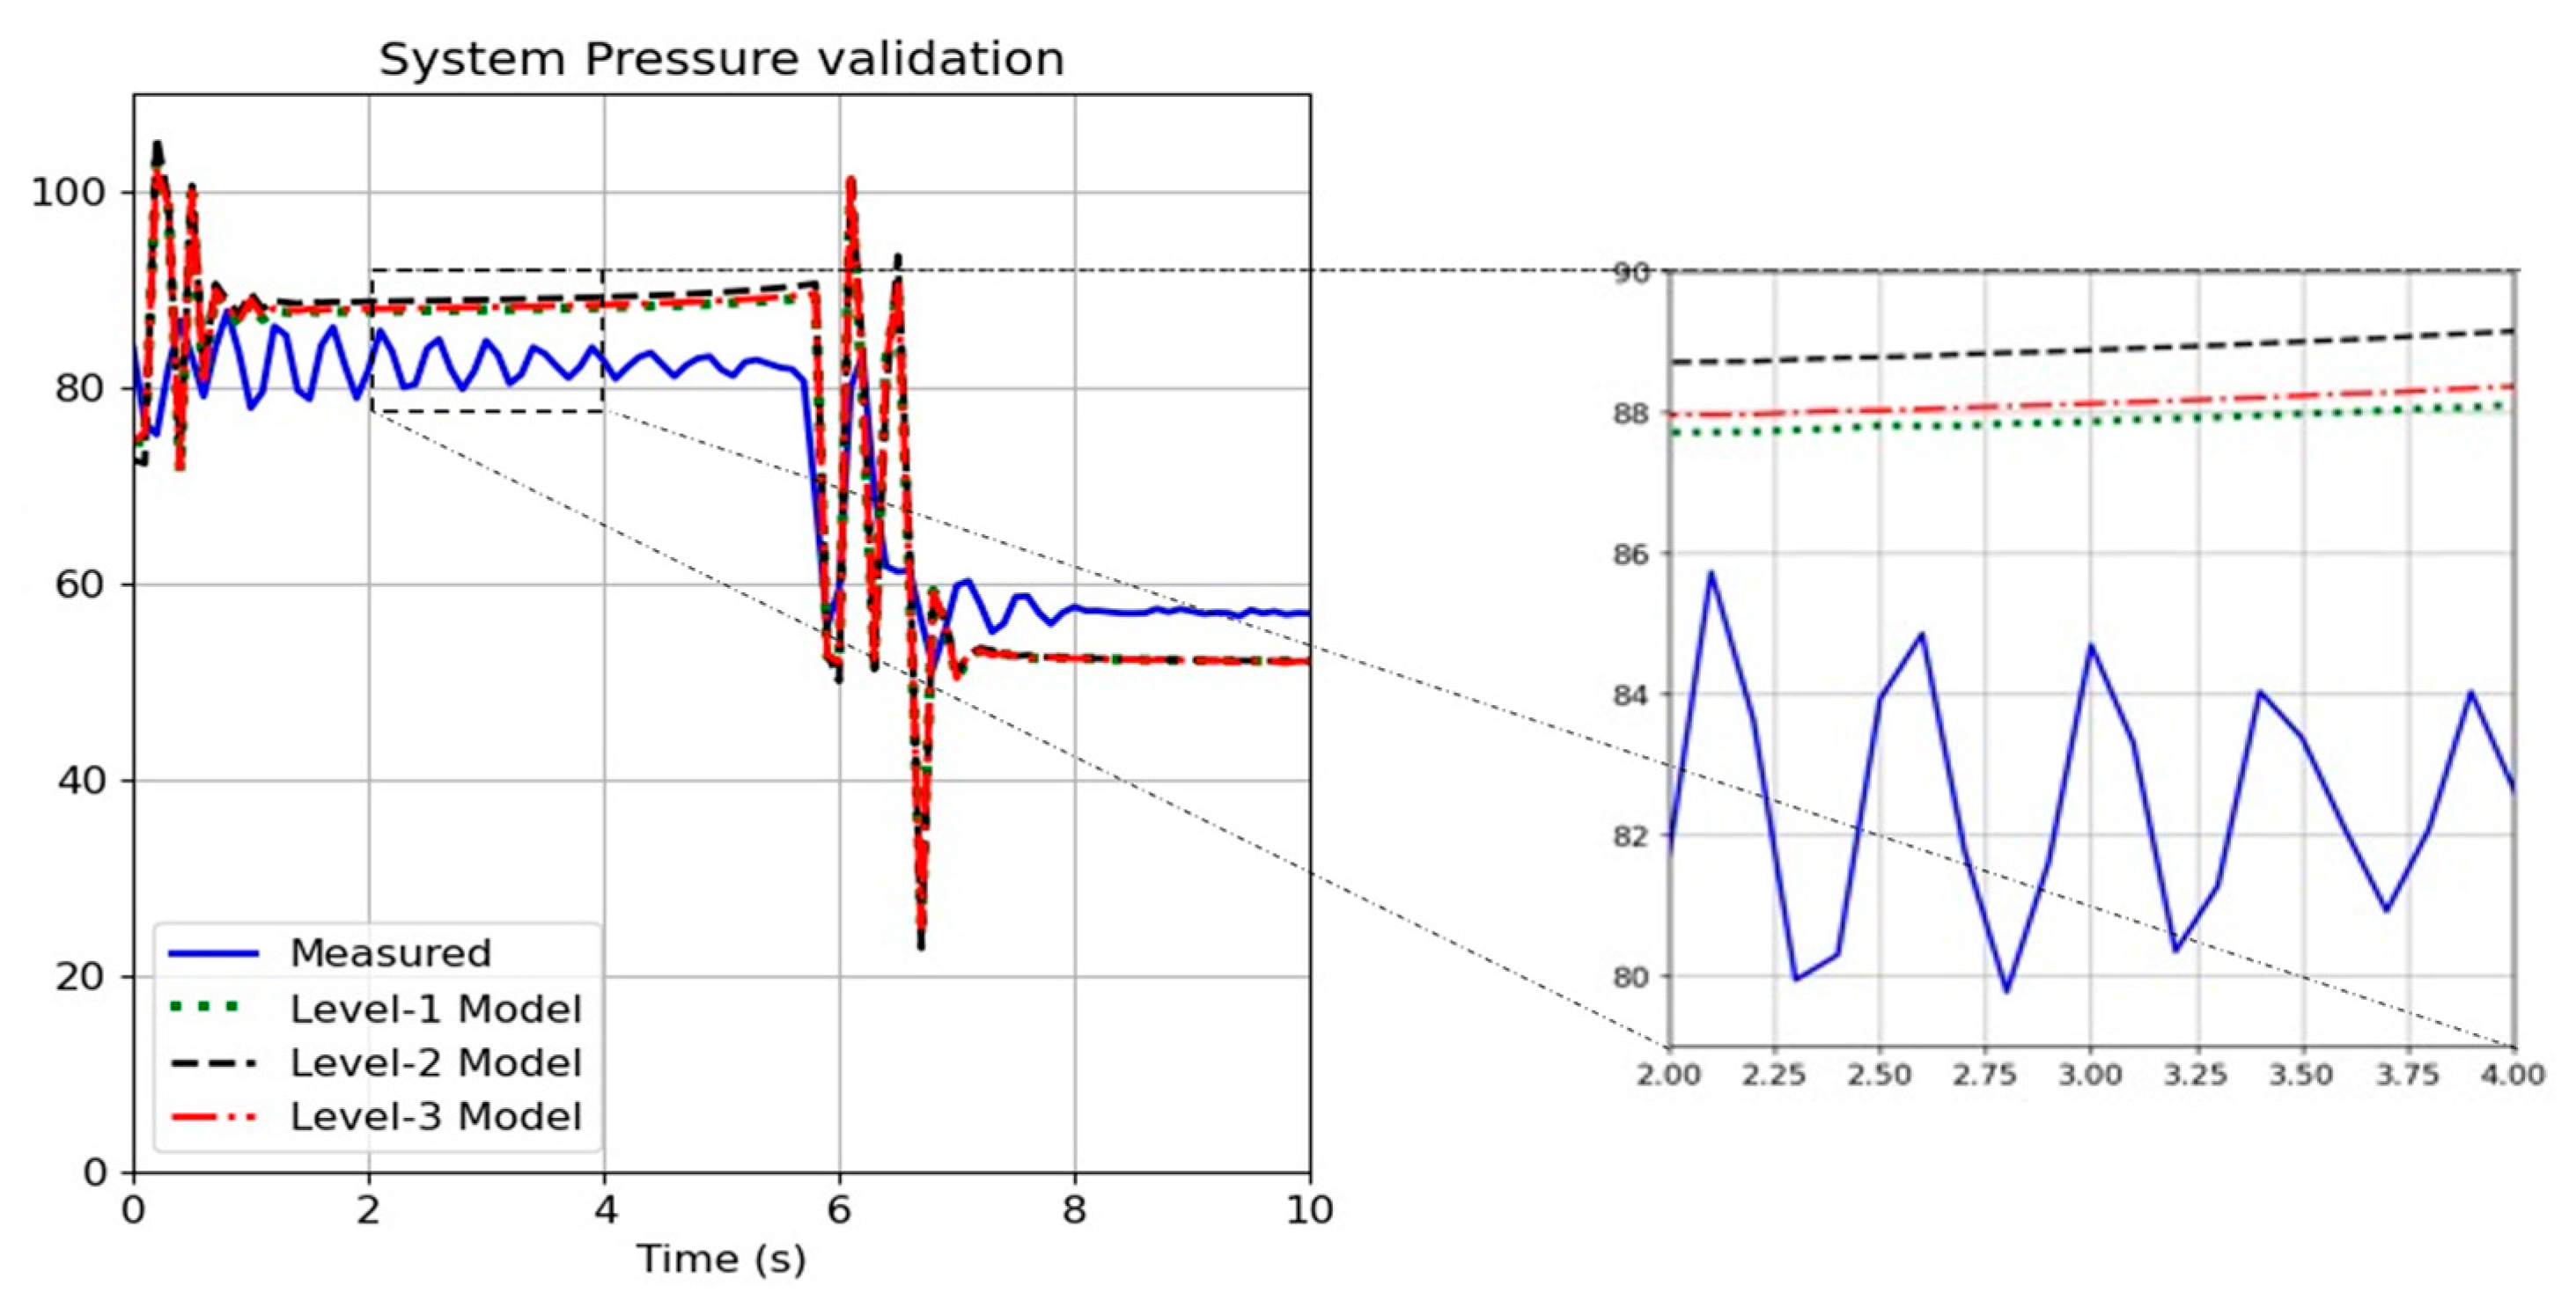
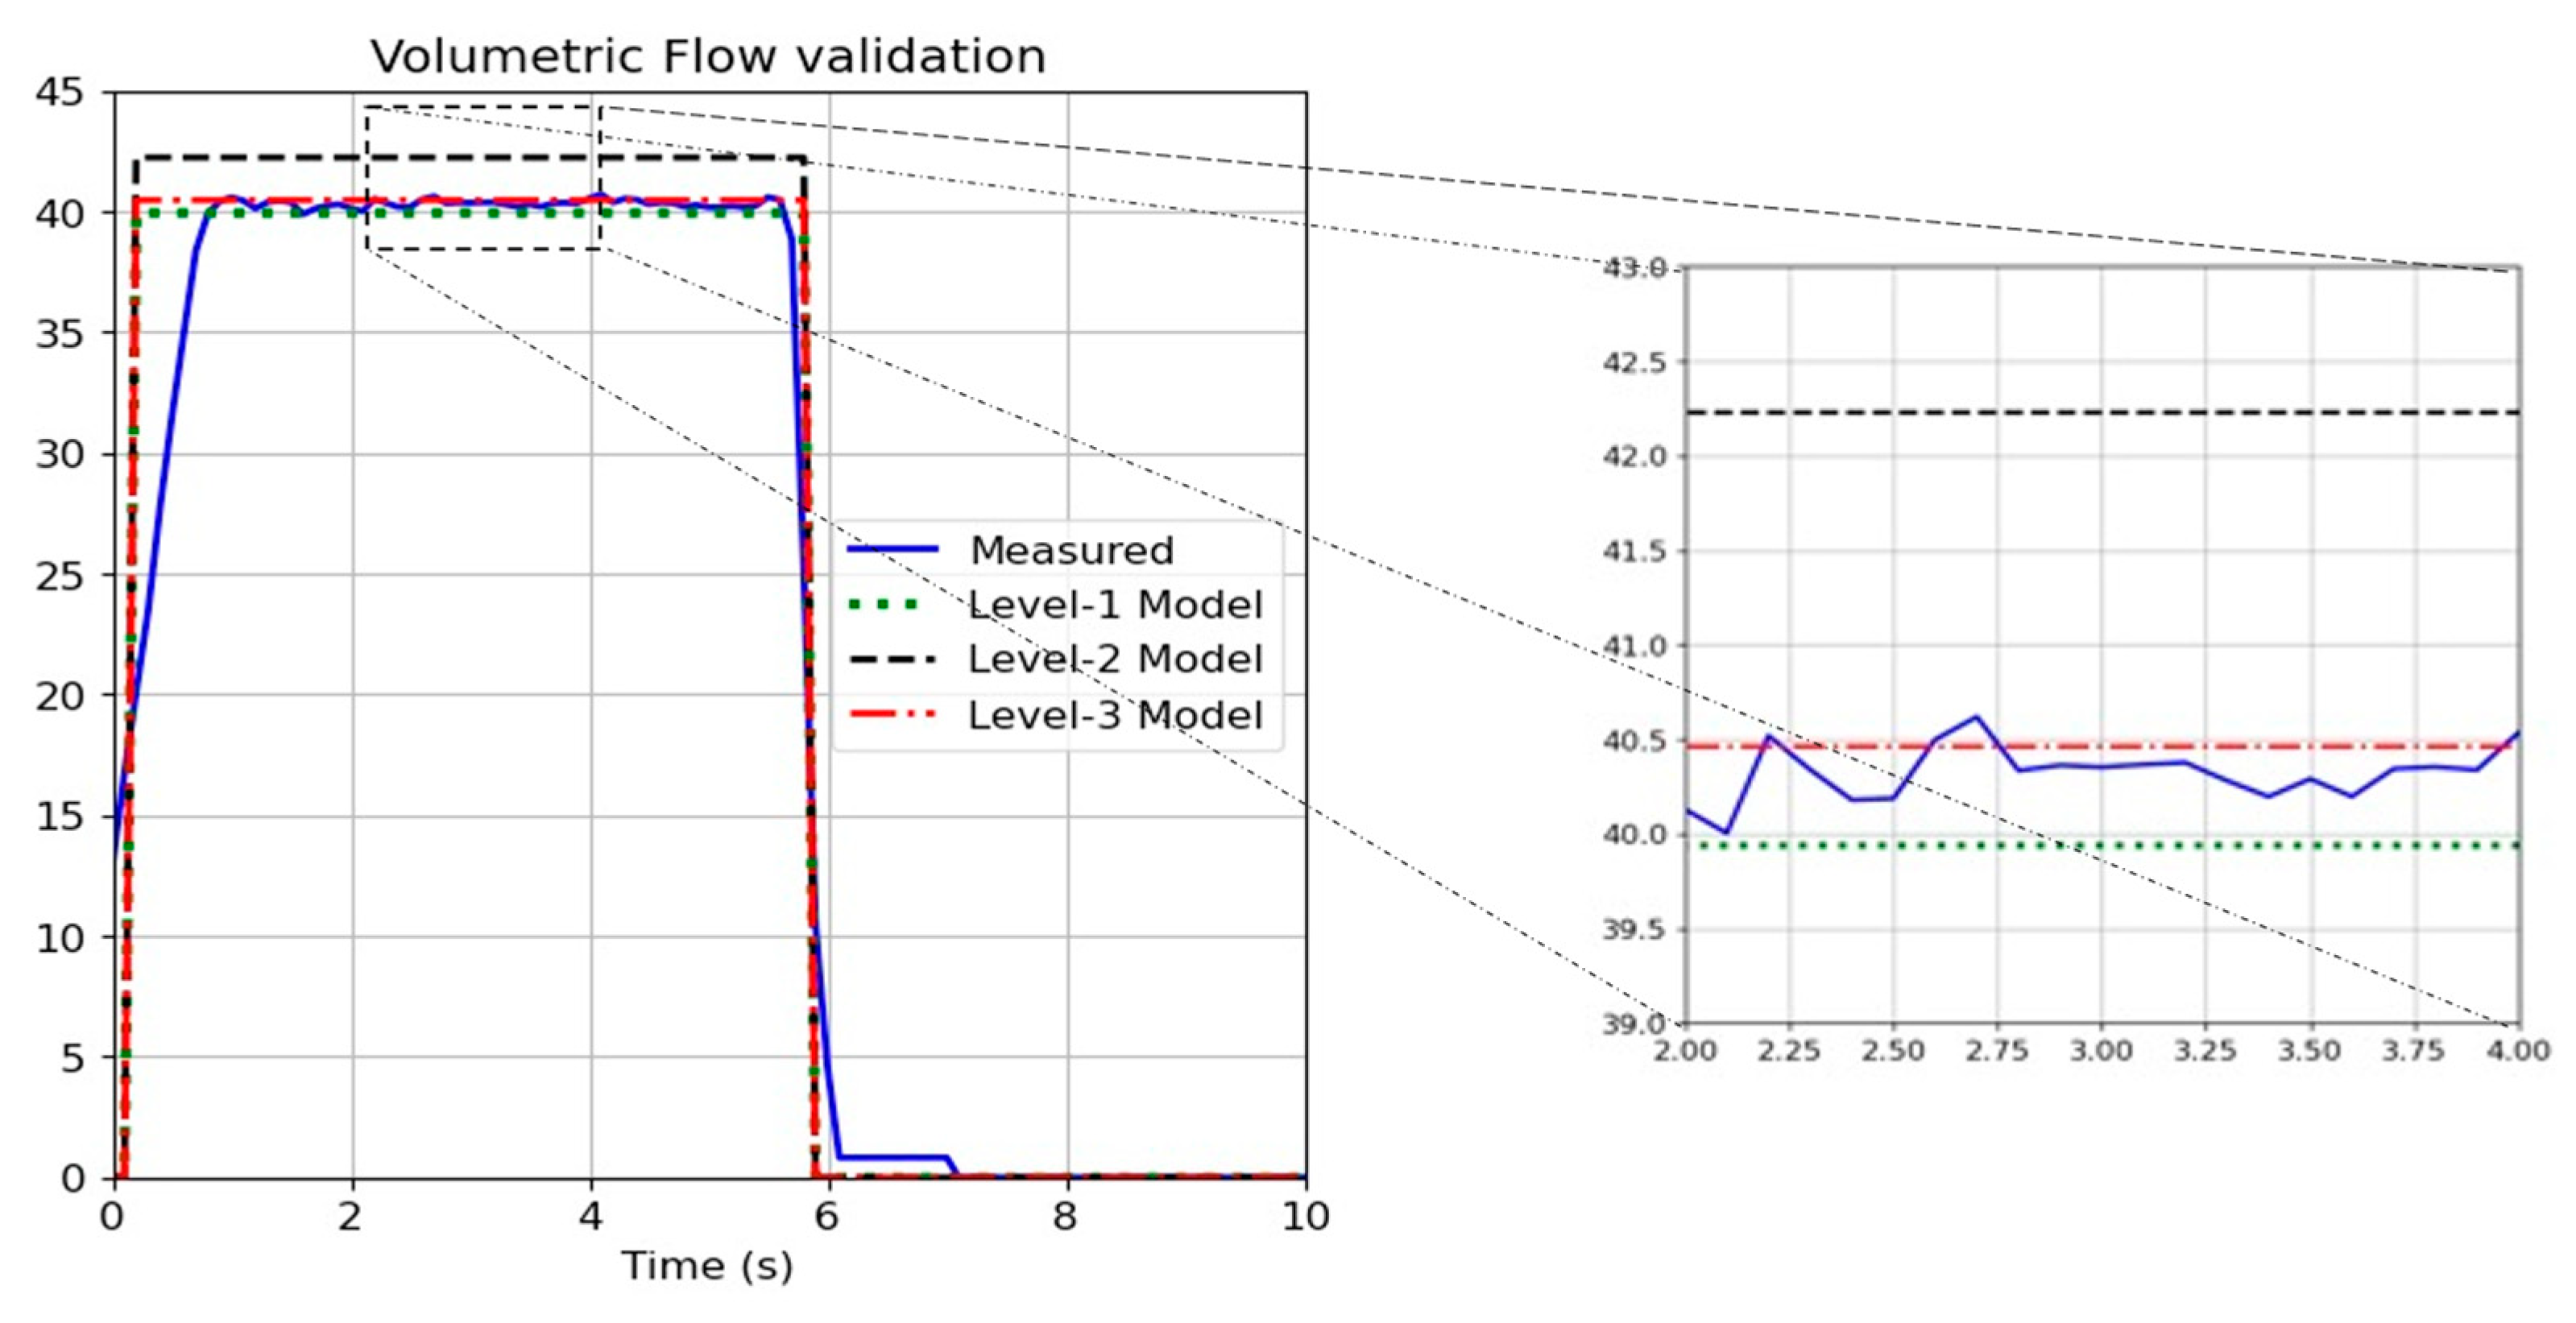
3.1. Model Validation
3.2. Test Classifier
4. Conclusions
Author Contributions
Funding
Data Availability Statement
Conflicts of Interest
Abbreviations
| AI | Artificial Intelligence |
| CAD | Computer Aided Drafting |
| DT | Decision Tree |
| EGP | External Gear Pump |
| FMI | Functional Mockup Interface |
| FPGA | Functional Programmable Gateway Arrays |
| KNN | K-Nearest Neighbor |
| LDA | Linear Discriminant Analysis |
| MLP | Multi-Layer Perceptron |
| MSE | Mean Squared Error |
| RF | Random Forest |
| RMSE | Root Mean Squared Error |
Nomenclature
| Symbol | Description | Unit |
| 𝑏 | Gear Width | [m] |
| bl bl | Root arc length | [m] |
| 𝐶𝑠 | Laminar Slip Coefficient | |
| 𝐶𝑠𝑡 | Turbulent Slip Coefficient | |
| e | Eccentricity | |
| h h | Tooth tip gap clearance | [m] |
| havg | Mean value of Tooth tip gap clearance | [m] |
| hr hr | Radial gap clearance | [m] |
| k1 k1 | Rotational Inlet fraction | |
| k2 k2 | Sealing zone rotational factor | |
| Ll ll | Lateral orifice length | [m] |
| lr | Radial orifice length | [m] |
| lt | Tooth Tip orifice length | [m] |
| 𝑛 | Rotational Speed | [rad/s] |
| 𝑟1 | Pitch Diameter of Gear 1 | [m] |
| 𝑟2 | Pitch Diameter of Gear 2 | [m] |
| 𝑟ℎ | Outside Diameter of Gear | [m] |
| 𝑟ℎ1 | Outside Diameter of Gear 1 | [m] |
| 𝑟ℎ2 | Outside Diameter of Gear 2 | [m] |
| R | Housing Diameter | [m] |
| 𝑄 | Volumetric Flow | [m3/s] |
| 𝑃 | Pressure | [Pa] |
| 𝑡0 | Base Pitch | [m] |
| ut | Tangential speed | [m/s] |
| 𝑉 | Volumetric Displacement | [m3/rev] |
| 𝑉𝑔 | Geometric Displacement Volume | [m3/rev] |
| 𝑉𝑔𝑖 | Geometric Displacement Volume of tooth pair | [m3/rev] |
| w | Housing Wear parameter | [m] |
| z | Number of Teeth | |
| Greek letter | Description | Unit |
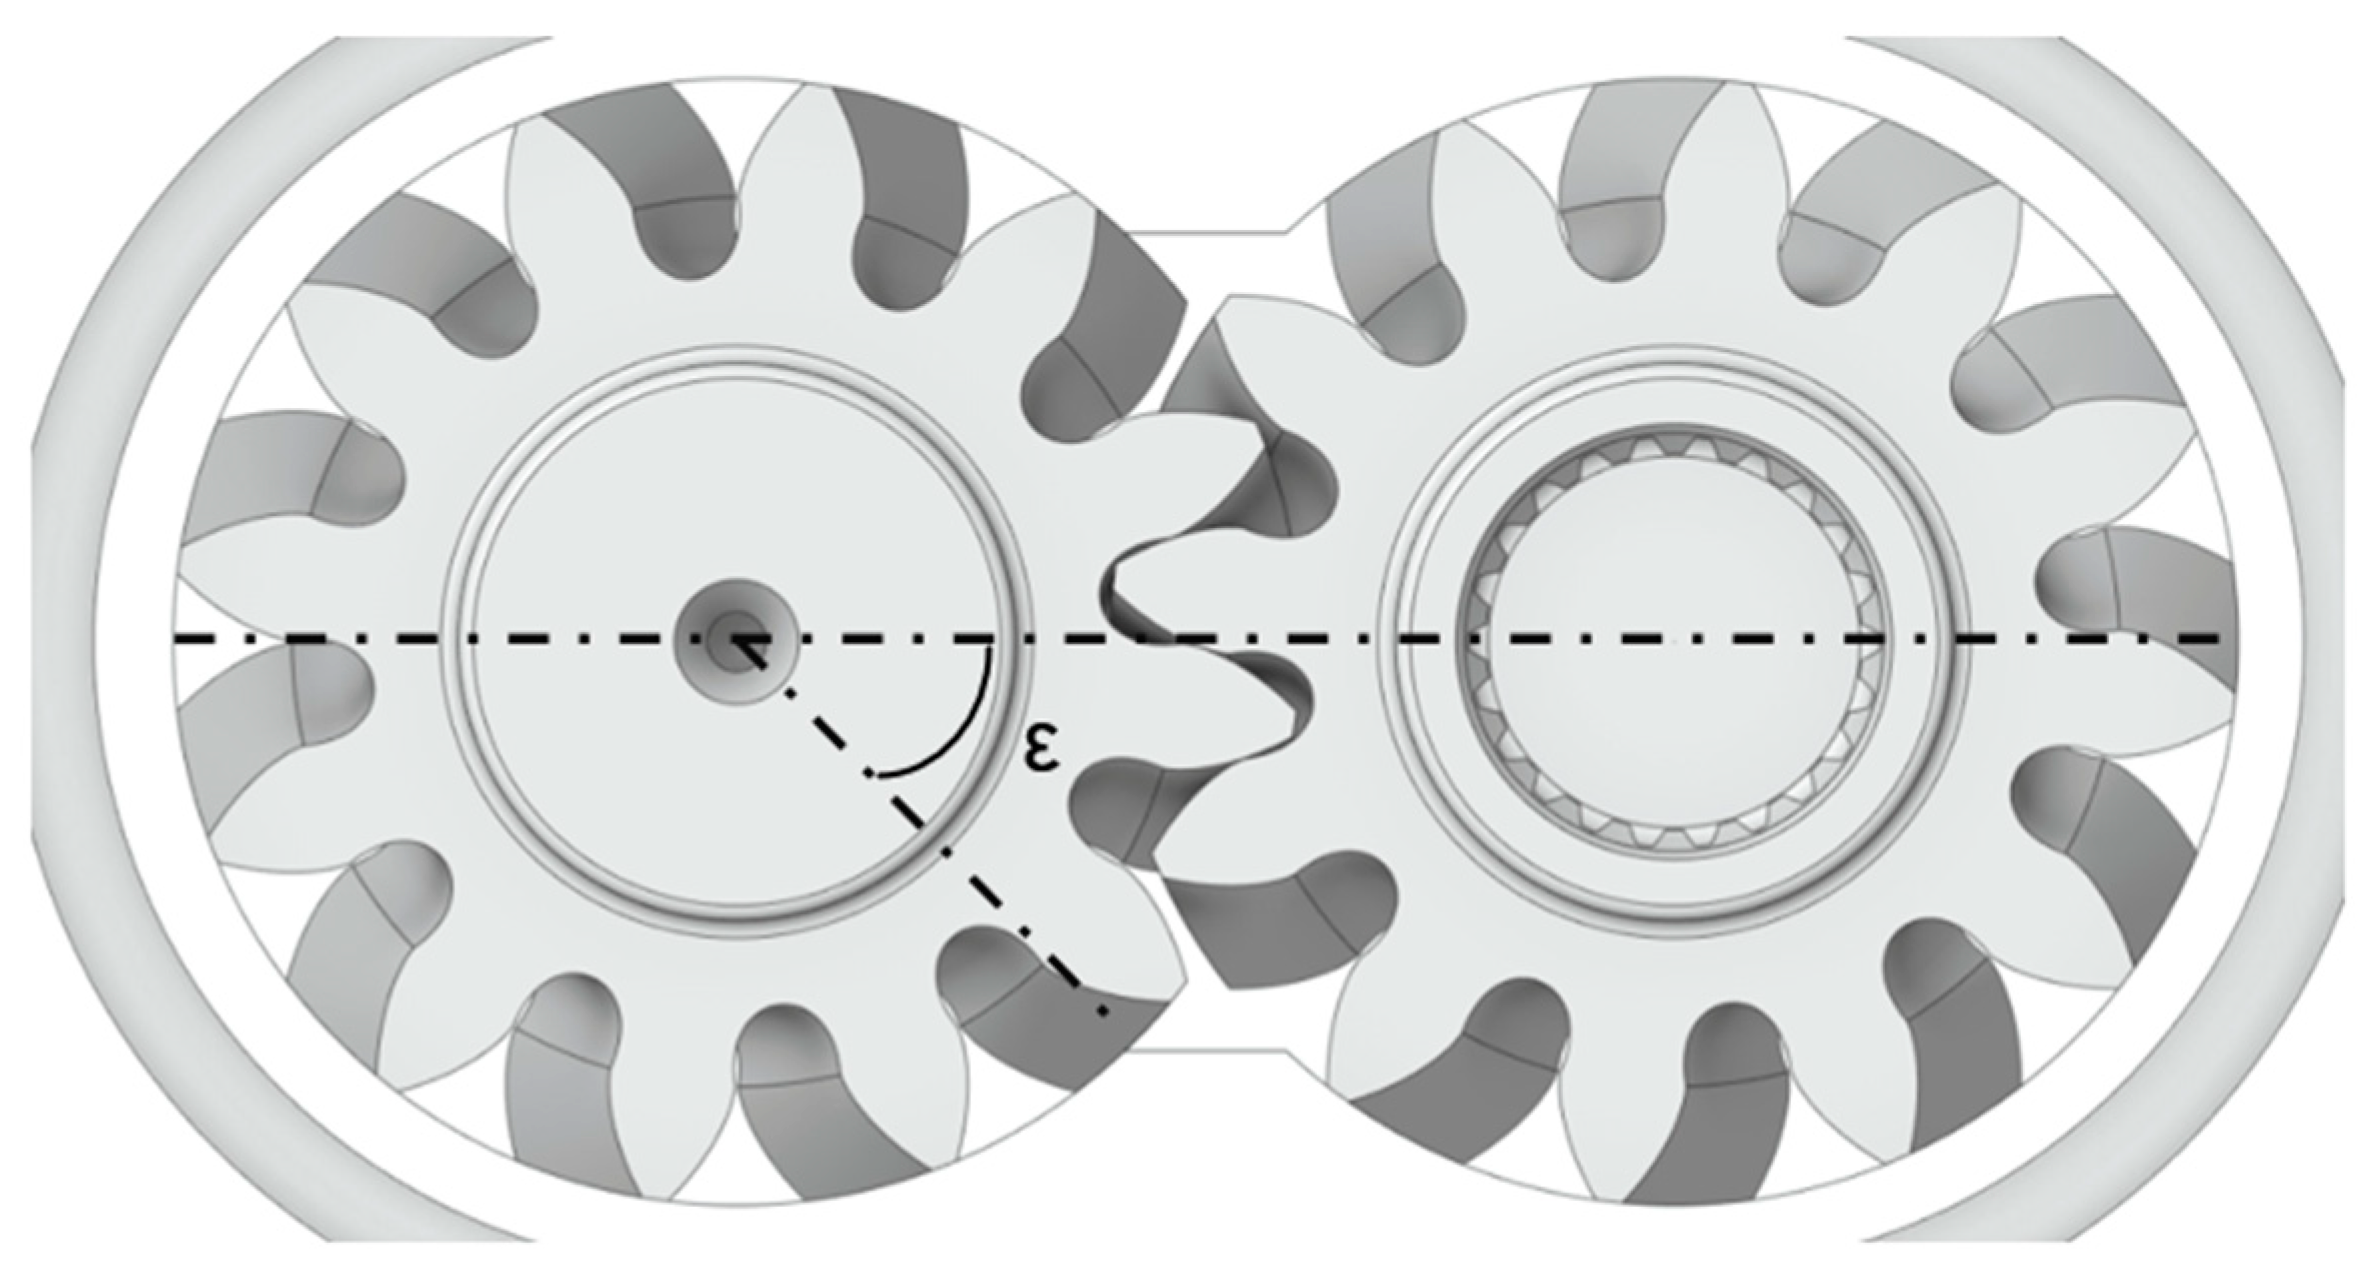
| ε | Suction angle | [rad] |
| φ | Rotational angle | [rad] |
| 𝜇 | Dynamic Viscosity | [Kg/ms] |
| 𝜂𝑣 | Volumetric Efficiency | |
| 𝜌 | Density | [Kg/m3] |
References
- Kun, W.; Mingwei, W. Servo Model of Internal Leakage and Volume Efficiency Simulation for External Gear Pumps or Motors. J. Mech. Transm. 2023, 47, 69–73. [Google Scholar]
- Sedri, F.; Riasi, A. Investigation of leakage within an external gear pump with new decompression slots: Numerical and experimental study. J. Braz. Soc. Mech. Sci. Eng. 2019, 41, 224. [Google Scholar] [CrossRef]
- Hao, X.; Zhou, X.; Liu, X.; Sang, X. Pressure ripple of gear pumps affected by air content on trapped volume. J. Vibroeng. 2016, 18, 4033–4041. [Google Scholar] [CrossRef]
- Borghi, M.; Zardin, B.; Specchia, E. External Gear Pump Volumetric Efficiency: Numerical and Experimental Analysis; SAE Technical Papers; SAE: Warrendale, PA, USA, 2009. [Google Scholar]
- del Campo, D.; Castilla, R.; Raush, G.; Montero, P.J.G.; Codina, E. Numerical Analysis of External Gear Pumps Including Cavitation. J. Fluids Eng. 2012, 134, 81105–81112. [Google Scholar] [CrossRef]
- Guo, R.; Li, Y.; Shi, Y.; Li, H.; Zhao, J.; Gao, D. Research on identification method of wear degradation of external gear pump based on flow field analysis. Sensors 2020, 20, 4058. [Google Scholar] [CrossRef] [PubMed]
- Webster, R.L.; Evans, D.J.; Rawson, P.M. A method for the identification and quantitation of hydraulic fluid contamination of turbine engine oils by gas chromatography-chemical ionisation mass spectrometry. Lubr. Sci. 2012, 24, 373–381. [Google Scholar] [CrossRef]
- Ahmed, H.; Nandi, A.K. Condition Monitoring with Vibration Signals: Compressive Sampling and Learning Algorithms for Rotating Machines; John Wiley & Sons Inc.: Hoboken, NJ, USA, 2020. [Google Scholar]
- Zhang, J.; Li, N.; Chen, Y.; Zhai, J.; Han, Q.; Hou, Z. A method of in-situ monitoring multiple parameters and blade condition of turbomachinery by using a single acoustic pressure sensor. Mech. Syst. Signal Process. 2022, 173, 109051. [Google Scholar] [CrossRef]
- Liu, M.; Kim, G.; Bauckhage, K.; Geimer, M. Data-Driven Virtual Flow Rate Sensor Development for Leakage Monitoring at the Cradle Bearing in an Axial Piston Pump. Energies 2022, 15, 6115. [Google Scholar] [CrossRef]
- Li, H.; Xu, G.; Gui, X.; Liang, L. A Double FBGs Temperature Self-Compensating Displacement Sensor and Its Application in Subway Monitoring. Materials 2022, 15, 6831. [Google Scholar] [CrossRef] [PubMed]
- Keller, N.; Sciancalepore, A.; Vacca, A. Demonstrating a Condition Monitoring Process for Axial Piston Pumps with Damaged Valve Plates. Int. J. Fluid Power 2022, 23, 205–236. [Google Scholar] [CrossRef]
- Phan, V.D.; Ahn, K.K. Fault-tolerant control for an electro-hydraulic servo system with sensor fault compensation and disturbance rejection. Nonlinear Dyn. 2023, 111, 10131–10146. [Google Scholar] [CrossRef]
- Robinson, S. Exploring the relationship between simulation model accuracy and complexity. J. Oper. Res. Soc. 2022, 74, 1992–2011. [Google Scholar] [CrossRef]
- Azeez, A.A.; Minav, T. The effect of model complexity on an external gear pump for AI-based condition monitoring applications. In Proceedings of the Scandinavian International Conference on Fluid Power, Tampere, Finland, 30 May–1 June 2023. [Google Scholar]
- Azeez, A.A.; Vuorinen, E.; Minav, T.; Casoli, P. AI-based condition monitoring of a variable displacement axial piston pump. In Proceedings of the 13th International Fluid Power Conference, Aachen, Germany, 13–15 June 2022. [Google Scholar]
- Azeez, A.A.; Han, X.; Zakharov, V.; Minav, T. AI-based condition monitoring of hydraulic valves in zonal hydraulics using simulated electric motor signals. In Proceedings of the ASME/BATH 2021 Symposium on Fluid Power and Motion Control, Online, 19–21 October 2021. [Google Scholar]
- Makansi, F.; Schmitz, K. Fault Detection and Diagnosis for a Hydraulic Press by Use of a Mixed Domain Database. In Proceedings of the BATH/ASME 2022 Symposium on Fluid Power and Motion Control, Bath, UK, 14–16 September 2022. [Google Scholar]
- Sobie, C.; Freitas, C.; Nicolai, M. Simulation-driven machine learning: Bearing fault classification. Mech. Syst. Signal Process. 2018, 99, 403–419. [Google Scholar] [CrossRef]
- Chen, Y.; Zuo, M.J. A sparse multivariate time series model-based fault detection method for gearboxes under variable speed condition. Mech. Syst. Signal Process. 2022, 167, 108539–108558. [Google Scholar] [CrossRef]
- Gordon, C.A.K.; Pistikopoulos, E.N. Data-driven prescriptive maintenance toward fault-tolerant multiparametric control. AIChE J. 2022, 68, e17489. [Google Scholar] [CrossRef]
- Torrent, M.; Gamez-Montero, P.J.; Codina, E. Parameterization, Modeling, and Validation in Real Conditions of an External Gear Pump. Sustainability 2021, 13, 3089. [Google Scholar] [CrossRef]
- Ivantysyn, J. Hydrostatic Pumps and Motors: Principles, Design, Performance, Modelling, Analysis, Control and Testing, 1st ed.; Akademia Books International: New Delhi, India, 2001. [Google Scholar]
- Siemens Industry Software, Inc. Simcenter Amesim Reference Manual; Siemens Digital Industries Software: Plano, TX, USA, 2020. [Google Scholar]
- Mazzei, P.; Frosina, E.; Senatore, A. Helical Gear Pump: A Comparison between a Lumped Parameter and a Computational Fluid Dynamics-Based Approaches. Fluids 2023, 8, 193. [Google Scholar] [CrossRef]
- Marinaro, G.; Frosina, E.; Senatore, A. A numerical analysis of an innovative flow ripple reduction method for External Gear Pumps. Energies 2021, 14, 471. [Google Scholar] [CrossRef]
- Azeez, A.A.; Zakharov, V.; Orifjonov, A.; Niemela, J.; Minav, T. Multi-physics Co-simulation of an Electric Reach Truck. In Proceedings of the 13th International Fluid Power Conference, Aachen, Germany, 13–15 June 2022. [Google Scholar]


| Model | Displacement | Volumetric Flow | System Pressure | |||
|---|---|---|---|---|---|---|
| MSE | RMSE | MSE | RMSE | MSE | RMSE | |
| Level 1 | 0.00018 | 0.01342 | 16.0788 | 4.0098 | 127.8042 | 11.3051 |
| Level 2 | 0.00645 | 0.08031 | 22.1156 | 4.7027 | 110.3343 | 10.504 |
| Level 3 | 0.00037 | 0.01923 | 16.1718 | 4.0214 | 97.3894 | 9.4847 |
| Classifier | Balanced Accuracy Score (%) |
|---|---|
| LDA | 63.43 |
| DT | 85.55 |
| RF | 88.95 |
| KNN | 66.46 |
| MLP | 71.68 |
Disclaimer/Publisher’s Note: The statements, opinions and data contained in all publications are solely those of the individual author(s) and contributor(s) and not of MDPI and/or the editor(s). MDPI and/or the editor(s) disclaim responsibility for any injury to people or property resulting from any ideas, methods, instructions or products referred to in the content. |
© 2023 by the authors. Licensee MDPI, Basel, Switzerland. This article is an open access article distributed under the terms and conditions of the Creative Commons Attribution (CC BY) license (https://creativecommons.org/licenses/by/4.0/).
Share and Cite
Azeez, A.A.; Mazzei, P.; Minav, T.; Frosina, E.; Senatore, A. A New Approach to Study the Effect of Complexity on an External Gear Pump Model to Generate Data Source for AI-Based Condition Monitoring Application. Actuators 2023, 12, 401. https://doi.org/10.3390/act12110401
Azeez AA, Mazzei P, Minav T, Frosina E, Senatore A. A New Approach to Study the Effect of Complexity on an External Gear Pump Model to Generate Data Source for AI-Based Condition Monitoring Application. Actuators. 2023; 12(11):401. https://doi.org/10.3390/act12110401
Chicago/Turabian StyleAzeez, Abid Abdul, Pietro Mazzei, Tatiana Minav, Emma Frosina, and Adolfo Senatore. 2023. "A New Approach to Study the Effect of Complexity on an External Gear Pump Model to Generate Data Source for AI-Based Condition Monitoring Application" Actuators 12, no. 11: 401. https://doi.org/10.3390/act12110401
APA StyleAzeez, A. A., Mazzei, P., Minav, T., Frosina, E., & Senatore, A. (2023). A New Approach to Study the Effect of Complexity on an External Gear Pump Model to Generate Data Source for AI-Based Condition Monitoring Application. Actuators, 12(11), 401. https://doi.org/10.3390/act12110401