Abstract
Plastic micro-drive systems are used in an increasing number of applications in manufacturing industries. The operational status of the plastic micro-drive system directly affects the performance of the host system. However, the fault diagnosis of the plastic micro-drive system remains a challenge due to its miniaturization. In this paper, a fault-detection study using the electrical-parameter analysis method is proposed for the grille controller, which provides a basis for typical plastic micro-drive systems. The structure and working principle of grille controllers are analyzed, and typical faults are summarized. Then, the fault-mechanism analysis of typical faults is presented, and the identification indicators of faults are developed. A strategy of fault-feature frequency extraction based on the improved reconstruction method of empirical-mode decomposition (EMD) is proposed. Finally, the experimental results reveal that the proposed indicators and method demonstrate high accuracy for the grille-controller fault detection.
1. Introduction
A transmission system is often used as the main device for decelerating and increasing the torque of the drive motor in mechanical equipment [1,2]. Owing to the characteristics of their light-weight nature and low-vibration running, plastic micro-drive systems are extensively used in various industrial-manufacturing, scenarios including motor-vehicle engines [3,4], electromechanical-actuator gearboxes [5], hydraulic-drive system gerotor pumps [6], tobacco machinery [7], and wind-power gearboxes [8]. A typical plastic micro-drive system is usually composed of a micro motor and a group of plastic gears. The micro motor not only supplies the power output but also needs to perform the function of auto and exact control. The plastic gears are deployed for stable power transmission. The reliability of the transmission system is highly dependent on the operating condition of the two functional components [9]. As a result, monitoring the working status of the plastic micro-drive system plays an important role in the operation and maintenance of the entire system.
Electrical-parameter analysis [10,11,12,13,14,15], vibration analysis [16,17,18], and acoustic analysis [19,20,21] are commonly used methods for transmission-system-state monitoring. The vibration of the plastic micro-drive system mainly comes from the micro motor because of the lightweight nature and low-speed working condition of plastic gears. Nevertheless, vibration sensors are not always applicable in real industrial scenarios due to the miniaturization and embedded installation of the transmission system. For a plastic micro-drive system, the result of acoustic analysis is inevitably contaminated by environmental noise and suffers from time-varying transmission paths [22]. As a consequence, the methods established on vibration analysis and acoustic analysis would lead to challenges in accurate fault detection and state monitoring. Fortunately, the electrical-parameter analysis provides a promising way to achieve real-time condition monitoring and fault diagnosis because of convenient signal acquisition. Electrical-parameter analysis is a non-invasive method and no extra sensors are needed. Data acquisition and analysis can be implemented by the additional circuits embedded in the motor controller. More importantly, working-current signals contain rich information about motor- and gear-group health conditions. In addition, the measured working-current signal is free from the effect of time-varying transmission paths and is highly sensitive to changes in state [23]. Therefore, electrical-parameter analysis is more suitable and practical for plastic micro-drive system-fault diagnosis, because the working state of the transmission system can be directly reflected by monitoring the changes in electrical parameters of the system.
A general fault-diagnosis approach includes four aspects: detection of the presence of the fault [24], isolation of the fault [25], identification of the amplitude of the fault [26], and the evolution of the fault (prognosis) [27]. For the fault detection of plastic micro-drive systems, research now needs to focus on fault mechanism and types that are part of detecting the presence of faults. A great number of studies has been reported in recent decades regarding fault detection of motors, steel gear-transmission systems, and actuators. In 1987, a method of monitoring motor-state parameters was proposed by Tavner et al. [28]. Parameters of a motor in a working state were detected to analyze the abnormal parts. The fault location can be determined by extracting the working-state features of the motor in real time. A modified motor-current signature analysis was proposed by Arellano-Padilla et al. [29] for performing integral condition monitoring in a drive containing a gearbox. Drive-rectifier input currents were applied instead of machine currents. The experimental results demonstrated that the feasibility of the scheme to detect a faulty gearbox could be achieved. Chen et al. [30] analyzed the stator-current signals of an induction motor, and a model of planetary-gearbox faults under time-varying speed conditions was established. The fault characteristics of time-varying planetary gearboxes were summarized. An adaptive iterative generalized demodulation method was adopted to solve the problem of extracting weak time-varying fault features from motor stator-current signals. In [31], Gao et al. pointed out that the stator-current signal could be easily obtained, which was applied to planetary-gearbox-fault detection. A model of amplitude- and frequency-modulated current signal was established. Based on three complementary analysis results of the Fourier spectrum, amplitude-demodulation spectrum, and frequency-demodulation spectrum, the local fault of ring gears in the planetary gearbox was determined. Song et al. [32] summarized the fault characteristics of the transmission gear of radar antenna. The modulation component corresponding to the change in angular velocity caused by gear fault was obtained. The symmetrical-frequency characteristics on both sides of the fundamental frequency of the motor-stator spectrum could be used to determine whether gear fault occurred. Marzebali et al. [33] concluded that the major fault-frequency components related to the gearbox were disturbed by noise in the stator current of the wound-rotor-induction generator. In [34], the resonance residual method was proposed to extract the amplified planetary-gearbox-fault signatures in the frequency domain. In [35], Ottewill et al. built a parameter model for a motor-gearbox system and successfully extracted gearbox-fault features through synchronous-signal averaging. Kia et al. [36] proposed a frequency-modulation-current model for gearbox-fault diagnosis and extracted the fault characteristics from the phase-demodulated spectrum. In [37], a simplified and fast software-based fault-detection and -localization (FDL) approach was proposed for a grid-connected modular multilevel converter (MMC), which has similar failures to those of plastic micro-drive systems. The open-circuit fault could be determined by comparing the measured current-state-variable errors with threshold values. In [38], a method based on actuator-attitude signals that can provide fault features reflecting spatial relationships was proposed. With the aid of a multiscale convolutional-capsule network (MCCN), the failure of actuators could be correctly detected. Moreover, the data-driven approaches [39,40] and policy-learning methods using observational data [41] could be conducted for the fault detection of a transmission system. These methods are applied when sufficient historical failure data are available to compute the distribution and location of failure. However, with the help of non-invasive electrical-parameter analysis, the fault diagnosis of plastic micro-drive systems can be implemented in real time. It is more important to focus on the working condition and failure mode of plastic micro-drive systems. Using a simple and less-time-consuming method is clearly a much better choice, and there is no necessity to collect historical failure data. In summary, these studies have enriched the literature on motors, gearboxes, and actuators through electrical-parameter analysis, and good application prospects have been shown in past studies.
Despite the fact that a lot of studies have been carried out on motors and steel gear-transmission systems, the existing methods may obtain poor fault-detection results for plastic micro-drive systems because there are significant differences between the two kinds of actuators. Some of the failure-related indicators would be invalid due to the plastic-material-based gears in the micro-drive system. Moreover, the characteristic of failure may be much weaker than in steel gears and usually submerged in a significant amount of undesired noise. So far, to the authors; best knowledge, few studies have focused on the fault diagnosis of plastic micro-drive systems.
Based on the above review and analysis, a fault-detection strategy for a plastic micro-drive system is proposed in this paper. Comparing with the existing studies, the contributions of this article lie in the following aspects.
- The structure and working principle of a typical grille controller were studied to obtain a typical fault so that the failure mode of the grille controller could be determined.
- Based on the signal analysis of time domain and spectrum, the indicators of those faults for the typical grille controller were presented.
- To enhance the fault-detection accuracy, a fault-feature-frequency extraction method based on the improved reconstruction was established.
The rest of this article is organized as follows. Section 2 introduces the structure and working principle of the typical grille controller. Section 3 analyzes the typical faults. The indicators and a fault-feature-frequency extraction method is presented in Section 4. The effectiveness of the proposed indicators and fault-feature-extraction method is verified by the experimental results in Section 5. Finally, Section 6 concludes the paper.
2. Analysis of Structure and Working Principle of Grille Controllers
2.1. The Structure of Typical Grille Controllers
Figure 1 shows the structure of a typical grille controller. A micro brushless motor and control circuit provide the power output for the grille controller. The direct-current (DC) power supply cannot drive the grille controller directly. The motor-control circuit needs to carry out the modulation processing to the input signal. If is the modulated-signal frequency and is the carrier-signal frequency, the double-side-band frequency of the modulated signal based on the first order can be expressed as [42]
where A represents the carrier-signal amplitude, is the angular frequency of the carrier signal, and represents the angular frequency of the modulated signal. The modulation would suppress the carrier-signal amplitude to 0 and decompose it into modulation signals on both sides of the carrier-signal frequency, as well as at multiplier frequencies.

Figure 1.
The structure of the grille controller.
The plastic gear group of a typical grille controller is composed of 10 gears and 6 rotating shafts. z1 is connected to the motor and z10 is connected to the load. Every two gears of the rest gears are connected to a rotating shaft sequentially, and the rotation frequency of the gear on each shaft is the same. The meshing frequency of each gear pair (e.g., z1 and z2, z3 and z4) is the same. Table 1 shows the number of teeth of each gear and the rotation frequency without a fault.

Table 1.
The number of teeth and rotation frequency of each gear.
2.2. Working Principle of Grille Controllers
The working-current signal of the normal grille controller was collected through the circuit, and the time domain of the signal is shown in Figure 2. According to Figure 2, the working process of a normal grille controller can be divided into three parts. About 3 s after sampling is the preparatory start phase. The stable working phase lasts about 11 s, falling between 3 and 14 s. After 14 s, the termination phase is obtained. In the preparatory-start phase, the grille controller is driven by the power supply. The motor rotor and reduction gear start to rotate from the rest phase. A large motor current is required to satisfy the starting torque at this stage. When the final output gear starts to rotate, the required torque is reduced due to the inertia of the plastic gear group. The amplitude of the current is significantly smaller than in the preparatory start stage. While the final output gear reaches the predetermined position, the control task of the grille controller is over. At the termination phase, the circuit current is still maintained and the amplitude of current is consistent with the preparatory-start stage.
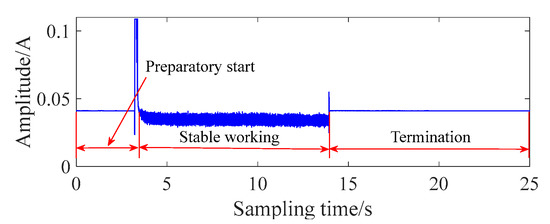
Figure 2.
The working-current signal of the normal grille controller.
Figure 3 displays the spectrum of the working-current signal of the normal grille controller. The spectrum includes the modulation-signal frequency (15.2 Hz), the multiplier frequencies of the motor-rotation frequency (30.9 Hz), and the suppressed carrier double-band-modulation frequency at 100 Hz. In addition, the motor circuit modulates the fault frequency, and both sides of the fault-frequency side band of frequency could be observed. By searching the appearance of the side band, one can intuitively determine whether a fault has occurred.
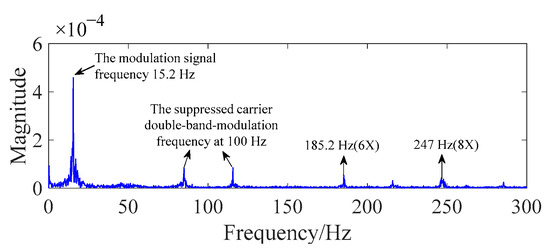
Figure 3.
The spectrum of the normal grille controller.
3. Typical Fault Analysis
According to the structure and working principle of the typical grille controller, the fault mainly occurs in the motor and plastic gear group. Therefore, the typical defects can be roughly divided into motor and circuit faults and plastic gear-group faults. It should be indicated that the following typical faults are all derived from the statistical results of the experiments.
3.1. Motor and Circuit Faults
Based on the structure analysis of the grille controller, an available motor-drive pulse signal is obtained by modulating the input-power signal through the motor circuit. Thus, the motor rotor rotates and the speed of motor rotor is controlled by sinusoidal pulse-width modulation. It can be seen that the working current signal of the grille controller collected by the circuit is the signal modulated by the motor circuit. As a result, the typical faults of motor and circuit are modulation-signal timeout and modulation-signal anomaly.
Modulation-signal timeout would lead to timeout for motor starting. The motor circuit fails to supply the drive-pulse signal in time to meet the motor-start condition. The start-timeout fault only causes a delayed start of the grille controller. The stable operation stage is highly similar to that of a normal grille controller. Due to the wider modulated drive-pulse signal, the anomaly-modulation signal would cause abnormally increased motor speed and shorter motor-working time. The modulation frequency of the signal is reduced, resulting in a large duty cycle. The current of the next phase has already entered even though the current of the previous phase has not yet completely passed. This leads to an increase in motor-rotor speed, which allows the grille controller to complete the predetermined control task in advance. The overcurrent protector is triggered to protect the load. Then, the input current is cut off and eventually the motor is stopped. Therefore, the features of overload-current fault are a larger amplitude of output current, a larger motor-rotation frequency, and a smaller modulating-signal frequency than normal.
3.2. Plastic Gear-Group Faults
As can be seen from Table 1, z1 is connected to the motor rotor and z10 is connected to the load. All the faults of the gear or shaft could lead to abnormal changes in the working state of the grille controller. The abnormal vibration caused by the fault would lead to a change in the motor air gap through the shaft.
In the actual gear-meshing process, two or more gears simultaneously participate in meshing to transmit torque. If the torque remains within the range of the gear pressure, the tooth-breaking(wear) gear could still complete the gear-meshing task even though the service life of the fault gear would be greatly reduced. Therefore, the grille controller could still work normally as long as the fault gear is not completely broken, whether a tooth-breaking(wear) gear fault occurs. The stable working stage is undistinguished from a normal grille controller.
Gear-scuffing failure is caused by the adhesion of plastic gears under high-pressure condition. Larger frictional moments must be overcome in the case of gear transmission. As a result, the gear-scuffing fault needs a higher motor working current. In the spectrum of fault signal, the rotational frequency of the fault gear and its higher-order harmonics would occur.
The fault of trash in a gear would significantly affect the meshing of gears. A larger torque is required to drive the fault-gear rotating while the gear meshes. The meshing stiffness of the gear changes, resulting in periodic fluctuations in load torque. This periodicity is related to the rotation speed of the fault gear. Large trash may even lead to extra load torque required by the gear over the original motor-load rating, causing the motor to start overtime.
Improper-gear-assembly failure would lead to overly tight meshing between some gears or shafts of the gear-transmission group. Therefore, a larger starting current is required to overcome the load torque. With the continuous working of the grille controller, the stress distribution of the plastic gear changes. The dynamic friction torque that needs to be overcome during the gear transmission gradually decreases until it is slightly higher than the initial static-friction torque.
4. Fault Indicators and Fault-Feature-Extraction Method
4.1. Fault Characteristics in the Time Domain
- 1.
- Start-timeout fault
Figure 4 shows the signal of the start-timeout fault. It indicates that the timeout start fault would cause the grille controller to start up at about 9.5 s. The stable working stage is extremely similar to that of a normal grille controller. This is consistent with the fault features of the theoretical analysis. Therefore, the time corresponding to the maximum value in the time domain could be extracted as the index of the start-timeout fault, which could quickly and accurately identify the start-timeout fault.
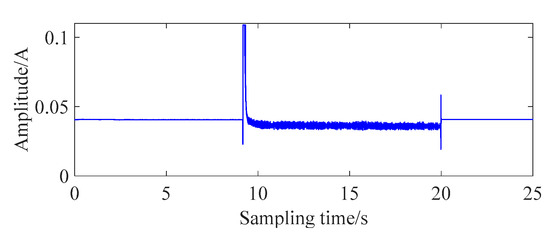
Figure 4.
Signal of start-timeout fault.
- 2.
- Overload-current fault
The working-current signal of the overload-current fault is shown in Figure 5. It can be seen that it has a higher current in the stable working phase and a current of 0 is observed in the termination phase.
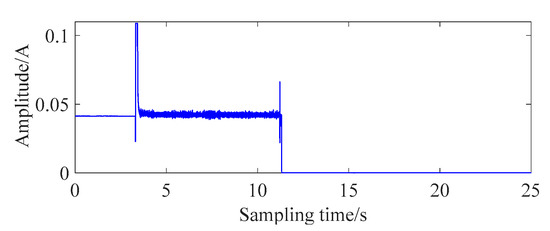
Figure 5.
Signal of overload current.
- 3.
- Gear tooth-breaking(wear) fault
Figure 6 displays the signal of gear tooth-breaking(wear) fault. The result shows that the gear tooth-breaking(wear) fault of the selected sample does not affect the gear meshing. The stable working stage is consistent with the normal grille controller. Therefore, when the condition of gear wearing is light, the gear tooth-breaking(wear) fault is not required to be identified.
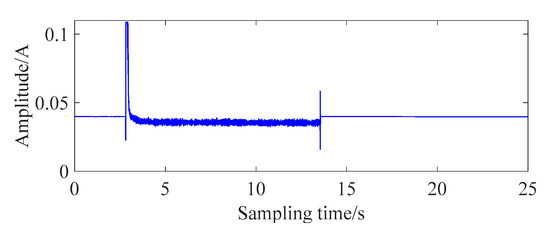
Figure 6.
Signal of gear tooth-breaking(wear) fault.
- 4.
- Gear-scuffing fault
As can be seen from the theoretical analysis, the typical feature of gear-scuffing fault is that the current value fluctuates greatly in the stable working stage, as shown in Figure 7. According to the definition of margin index, the margin of the grille controller with gear-scuffing fault would be greater than the normal value.
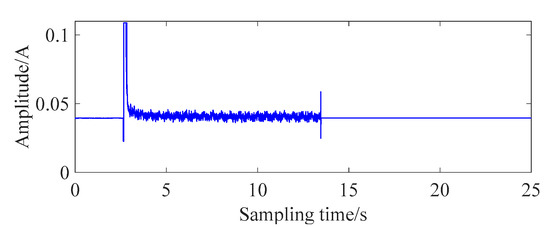
Figure 7.
Signal of gear-scuffing fault.
- 5.
- Trash-in-gear fault
The trash-in-gear fault demonstrates a strong periodic impact in the time domain, as shown in Figure 8. According to the definition of the kurtosis index, the kurtosis value of the trash-in-gear fault would be much higher than the normal value. To reduce the influence of noise impact on the kurtosis index [43], weighted kurtosis KC is defined as the fault feature-screening indicator:
where K represents the kurtosis of the signal, and |C| is the correlation coefficient.
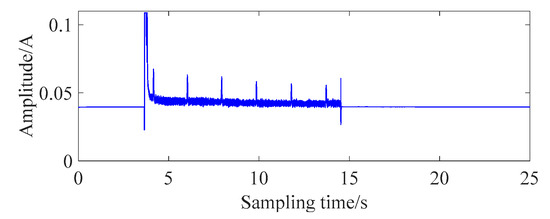
Figure 8.
Signal of trash-in-gear fault.
The kurtosis of the grille controller without the trash-in-gear fault is approximately 2~3. The correlation coefficients between intrinsic mode functions (IMFs) and the original signal are usually less than 0.6. Therefore, the threshold value of KC is set as 2 to screen the interference components in the decomposition signal. By reconstructing the signal, the kurtosis can be used as the index for the trash-in-gear fault.
- 6.
- Improper-gear-assembly fault
Figure 9 shows the signal of improper-gear-assembly fault. In the stable working stage, the current is significantly greater than the normal value and gradually decreases. The autocorrelation and EMD operation is performed on this signal. The root mean square (RMS) and variance of each order of IMF were calculated. The statistical results show that the RMS and variance of the last order IMF are much larger than those of other IMF components. Comparing the calculated results for other types of grille controller, as shown in Table 2, the RMS and variance of the last order IMF can be used as an indicator of improper-gear-assembly fault.
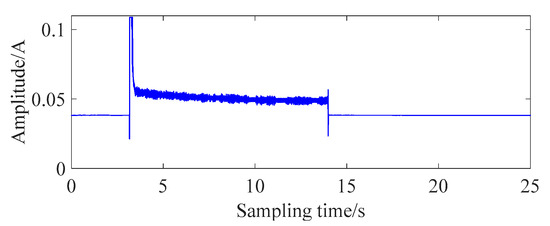
Figure 9.
Signal of improper-gear-assembly fault.

Table 2.
Statistical results of time-domain parameters.
4.2. Fault Characteristics of Frequency Domain and Fault-Feature-Extraction Method
4.2.1. Fault Characteristics in Frequency Domain
- 1.
- Overload-current fault
Based on the theoretical analysis results, the abnormal modulated-signal frequency could be obtained by the overload-current fault in the spectrum. The fault-modulated frequency (13.4 Hz), which is less than that of the normal grille controller, is observed in the spectrum, as shown in Figure 10.
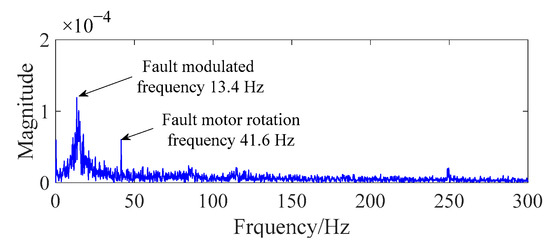
Figure 10.
The spectrum of overload-current signal.
- 2.
- Gear-scuffing fault
As shown in Figure 11, the rotational frequency of fault gear z4 (2.2 Hz) and its higher-order harmonics occur in the spectrum. The rotational-frequency fault is slightly greater than the normal value compared with Table 1. As a result, the rotational frequency of the fault gear could be an index for gear-scuffing fault in the frequency domain.
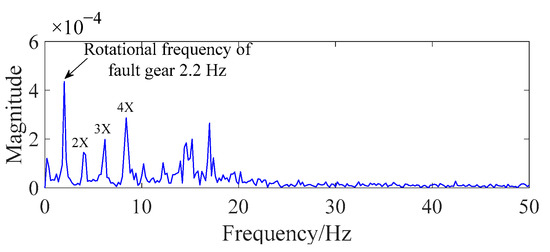
Figure 11.
The local spectrum of gear-scuffing fault.
4.2.2. Fault-Feature-Extraction Method
Empirical mode decomposition (EMD) [44] was proposed by Huang et al. in 1998. The complex non-stationary signal is broken down into the sum of IMFs, which are the data sequences with different feature scales. The IMF obtained by EMD contains components of the original signal in different frequency bands from high to low. The process of EMD is only related to the original signal, which has better adaptivity. In addition, EMD can be used to identify the fault information in the signal with some specific parameters, thus achieving a better effect of fault-feature extraction.
However, each IMF obtained by EMD is not strictly distributed in order of frequency from largest to smallest. Therefore, a frequency crossover at each order of IMF occurs, which inevitably leads to a large number of frequency components due to over-decomposition. These frequency components cannot be obtained in the original signal spectrum. Only some of the IMF components can reflect the fault-feature information in the original signal, whereas the rest are spurious IMF components and noise-interference components unrelated to the original signal. It is necessary to identify and eliminate these spurious IMF components and noise interference before reconstructing to retain the fault-feature information in the original signal.
Let f(ti) be the working-current signal of the grille controller, where i = 0, 1,… N − 1, and N is the total number of sampling points. Then, let fj(ti) be the n-order IMF components of f(ti) obtained by EMD, where j = 1, 2,… n. Each IMF has a different energy and correlation with the original signal. The IMFs that are sensitive to the original signal-fault-feature information should dominate the energy, whereas the spurious IMF components have smaller energy. Therefore, the correlation coefficient and energy ratios are used as the basis for spurious IMF-component screening. In addition, the fault grille controller contains more impact components. Thus, the kurtosis index is also required as a basis for IMF reconstruction. The process of the improved reconstruction method of EMD is as follows:
- Calculate the cross-correlation coefficient between f(ti) and each IMF fj(ti):
- Set T1 = 0.2 × max{} and retain the IMFs that are larger than T1;
- Let fq(ti) be the retained IMFs after the first screening, where q = 1, 2,…, k and k is the order of the retained IMFs. Calculate the square value of RMS of the retained IMFs:
- Normalize EGq and obtain the energy ratio of each retained IMF as follows:
- Set T2 = 0.3 × max{Pq} and retain the IMFs that are larger than T2;
- Let fp(ti) be the updated retained IMFs after the second screening, where p = 1, 2,…, m, and m is the order of updated retained IMFs. Reconstruct the updated retained IMFs in free combinations and calculate the kurtosis for each combination:where e = 1, 2,…, w; w represents the reconstruction number; Ce(ti) is the reconstructed IMF; Ma is the mean value of Ce(ti); and R is the standard deviation of Ce(ti). If f1(ti), f2(ti), and f3(ti) are the updated retained IMFs, Ce(ti) should be f1(ti), f2(ti), f3(ti), f1(ti) + f2(ti), f1(ti) + f3(ti), f2(ti) + f3(ti), and f1(ti) + f2(ti) + f3(ti), and w = 7 can be obtained;
- The final reconstructed signal fa(ti) could be obtained by the selected combination IMF, which has .
Figure 12 displays the main steps of the proposed fault-feature-extraction method. In general, the difference between the correlation of each IMF and the original signal is used to initially eliminate the spurious IMF components with little correlation. Then, the spurious IMF components and noise disturbances are eliminated using the energy ratio, and the IMF that dominates the energy is retained as much as possible. Finally, the optimal reconstruction signal of combination IMF is obtained using the kurtosis index.
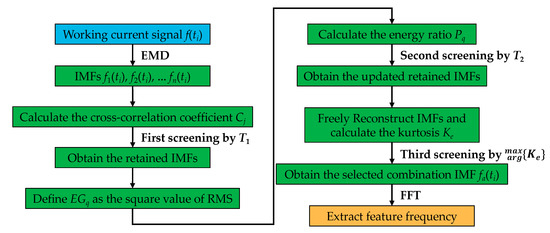
Figure 12.
The fault-feature-extraction method.
4.3. Summary of Fault-Identification Indicators and the Fault-Detection Framework
In this section, the characteristics of each typical fault of the grille controller obtained from the experimental data statistics are analyzed. The fault-identification indicators of the time domain and frequency domain are summarized, as shown in Table 3. In the experimental section, these indicators are verified to be effective. In this paper, a new fault-detection framework is proposed for typical plastic micro-drive systems. Table 4 outlines the main steps, including data acquisition, indicator calculation, feature-frequency extraction, and fault identification.

Table 3.
Summary of indicators.

Table 4.
The fault-detection framework.
5. Experimental Verification
To illustrate the effectiveness of the proposed method, the acquired signals of the grille controller from the experimental platform shown in Figure 13 were analyzed. The experimental equipment comprises a DC power supply, a circuit, a data-acquisition device (NI9234), a computer, and a grille controller. The grille controller was inserted into a tool to simulate the embedded installation. The circuit consists of a series-connected push-button switch and a resistive voltage-divider circuit. The resistive voltage-divider circuit is the key to carrying out the non-invasive detection method. It is connected in series with a 47 resistor, and the working current of the grille controller is calculated by acquiring the voltage from the resistor-divider circuit. In this paper, the experiments were conducted on seven types of grille controllers, and the data were labeled as shown in Table 5. The sampling rate was 25,600 Hz, and the sampling time was 25 s.
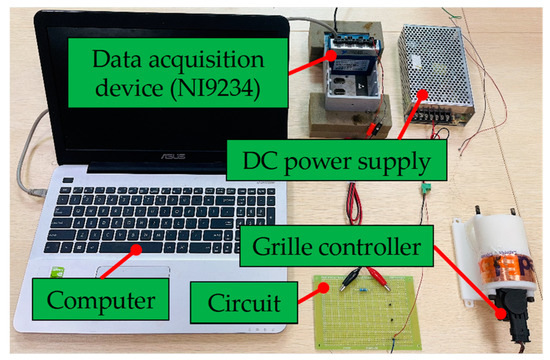
Figure 13.
The experimental platform of the grille controller.

Table 5.
Signal-dataset classification of the grille controller.
Fifty working-current signals were collected for each type of grille controller. To improve visualization of the validity of the indicators, the statistics in the following tables are the average of the calculated results for 50 signals of the same fault type. Table 6 displays the time-domain-index statistical average results of each type of grille controller. The results demonstrate that these indicators were effective in identifying the corresponding faults. Table 7 shows the statistical results of other time-domain parameters. The values of these parameters had little distinction among the kind of fault. The results indicate that these parameters failed to identify specific faults very well. To further measure the stability of the proposed indexes, the variability index of the 50 calculated results for each index was conducted for validation. The variability index was defined as follows:
where is the standard-deviation value and M represents the mean value. The variability index describes the stability of the proposed indicators. The stable indicators can be obtained by a smaller variability-index value. As shown in Table 8, the variability index of all indicators maintained a lower value. It should be pointed out that the variability index of improper-gear-assembly fault was relatively large due to the large fault dispersion and poor index design. However, the variance of the last-order IMF index still had better performance compared with the other parameters, and it could be combined with the RMS of the last-order IMF index to obtain higher detection accuracy. Therefore, the results indicate that the proposed indexes provided considerable stability, which is important for improving fault-identification accuracy.

Table 6.
The average value of the indicators.

Table 7.
The statistical results of the other parameters.

Table 8.
The variability index of the indicators.
The abnormal-modulation-signal frequency and fault-gear-rotation frequency were required to be extracted for the identification of the overload-current fault and gear-scuffing fault. The proposed improved reconstruction method of EMD was performed on data C and E. As shown in Figure 14 and Figure 15, the results indicated that the fault-modulated frequency (13.4 Hz) and the fault rotational frequency (2.2 Hz) with its higher-order harmonics could be easily extracted. Comparing the results of fast Fourier transform (FFT) (Figure 10 and Figure 11) and the traditional EMD method (Figure 16 and Figure 17), wrong feature frequency resulting from spurious IMF and noise interference were observed, which seriously affected the extraction of the feature frequency. This reveals that the proposed method can effectively retain fault-feature information and improve the accuracy and reliability of fault identification.
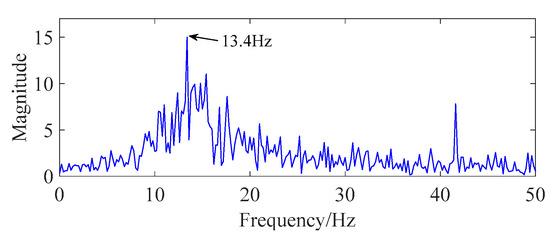
Figure 14.
Feature-frequency extraction of overload-current fault.
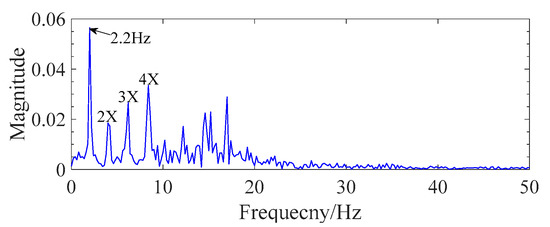
Figure 15.
Feature-frequency extraction of gear-scuffing fault.
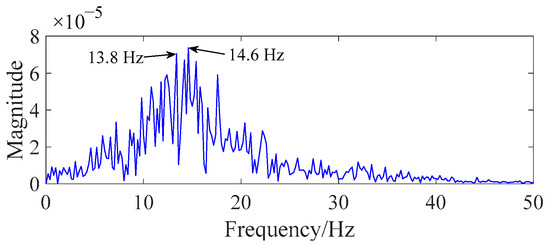
Figure 16.
Overload-current fault result extracted by EMD.
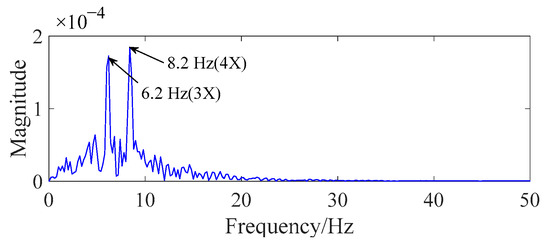
Figure 17.
Gear-scuffing fault result extracted by EMD.
The experimental results demonstrate that the proposed indicators and the fault-feature-extraction method maintained high accuracy. In particular, the gear-breaking(wear)-fault detection was not conducted. A gear with severe wear would be detected as a trash-in-gear fault, whereas a gear with slight wear was directly classified into the normal grille controller. It is obvious that the detection of the gear-scuffing fault and improper-gear-assembly fault were more reliable due to the composite indicators.
6. Conclusions
In this paper, research on fault mechanism, fault-signal features, fault-identification indicators, and fault-feature-extraction methods is conducted on a grille controller. The structure and working principle of the grille controller is studied, and the fault mechanism is analyzed. Typical faults indexes are proposed by the fault signal features. A fault-feature-extraction method based on the improved reconstruction of EMD is established. The experimental results demonstrate that the proposed indicators and feature-extraction method could achieve typical fault detection and have high accuracy. This study provides a new solution for fault-detection research on plastic micro-drive systems.
Author Contributions
Conceptualization, Q.H. and B.Z.; methodology, J.L. (Jiufei Luo) and Z.Z.; software, X.L.; validation, Q.H., J.L. (Jiufei Luo) and J.L. (Jing Li); formal analysis, Q.H. and B.Z.; investigation, J.L. (Jing Li) and Z.Z.; resources, J.L. (Jiufei Luo) and X.L.; data curation, X.L.; writing—original draft preparation, Q.H.; writing—review and editing, J.L. (Jing Li); visualization, Q.H. and B.Z.; supervision, B.Z.; project administration, Q.H. All authors have read and agreed to the published version of the manuscript.
Funding
This research was funded by the Youth Project of Science and Technology Research Program of Chongqing Education Commission of China, grant number KJQN202200604; the China National Innovation and Entrepreneurship Training Program for College Students, grant number 202110617015 and 202010617002; and the Graduate Research Innovation Project of Chongqing Municipal Education Commission, grant number CYS21318.
Institutional Review Board Statement
Not applicable.
Informed Consent Statement
Not applicable.
Data Availability Statement
Data sharing is not applicable to this article.
Conflicts of Interest
The authors declare that they have no conflict of interest. The manuscript was written with contributions from all authors. All authors have given approval to the final version of the manuscript.
References
- Xiang, X.; Chen, J.; Lin, Z.; Qiao, Y.; Chen, X.; Zhang, Y.; Xu, Y.; Li, Y. Optimization design for the planetary gear train of an electric vehicle under uncertainties. Actuators 2022, 11, 49. [Google Scholar]
- Prikhodko, A. Dynamic analysis of intermittent-motion conveyor actuator. Actuators 2021, 10, 174. [Google Scholar] [CrossRef]
- He, D.; Liao, B.; Yang, Y.; Quan, P. Effect of AGS based on CFD-Kuli coupling method on vehicle aerodynamic resistance and heat dissipation. J. Chongqing Univ. Technol. (Nat. Sci.) 2017, 31, 53–57. [Google Scholar]
- Dang, Y.; Qin, P.; Yan, S. Numerical study on influence of active shutter vane angle on vehicle front-end airflow. Chin. J. Automot. Eng. 2021, 11, 442–446. [Google Scholar]
- Berri, P.C.; Vedova, M.D.L.; Maggiore, P.; Riva, G. Design and development of a planetary gearbox for electromechanical actuator test bench through additive manufacturing. Actuators 2020, 9, 35. [Google Scholar] [CrossRef]
- Biernacki, K.; Stryczek, J. Analysis of stress and deformation in plastic gears used in gerotor pumps. J. Strain Anal. Eng. Des. 2010, 45, 465–479. [Google Scholar] [CrossRef]
- Wang, X.; Lu, J.; Xu, Z.; Zhang, J. Early fault monitoring and optimization of plastic gears of tobacco machinery based on BP neural network algorithm. Plast. Sci. Technol. 2021, 2, 91–94. [Google Scholar]
- Liu, S.; Li, F.; Peng, G. Multi objective optimization of process parameters of wind power plastic gearbox die based on neural network. Plast. Sci. Technol. 2021, 1, 113–116. [Google Scholar]
- Chen, G. Discussion on condition monitoring and fault diagnosis of transmission system. Mod. Ind. Ecol. Inform. 2021, 11, 78–79. [Google Scholar]
- Benbouzid, M.E.H. A review of induction motors signature analysis as a medium for faults detection. IEEE Trans. Ind. Electron. 2000, 47, 984–993. [Google Scholar] [CrossRef]
- Chai, N.; Yang, M.; Ni, Q.; Xu, D. Gear fault diagnosis based on dual parameter optimized resonance-based sparse signal decomposition of motor current. IEEE Trans. Ind. Appl. 2018, 54, 3782–3792. [Google Scholar] [CrossRef]
- Marzebali, M.H.; Faiz, Z.; Capolino, G.-A.; Kia, S.H.; Henao, H. Planetary gear fault detection based on mechanical torque and stator current signatures of a wound rotor induction generator. IEEE Trans. Energy Convers. 2018, 33, 1072–1085. [Google Scholar] [CrossRef]
- Lu, D.; Qiao, W.; Gong, X. Current-based gear fault detection for wind turbine gearboxes. IEEE Trans. Sustain. Energy 2017, 8, 1453–1462. [Google Scholar] [CrossRef]
- Feng, Z.; Ming, L.; Yi, Z.; Hou, S. Fault diagnosis for wind turbine planetary gearboxes via demodulation analysis based on ensemble empirical mode decomposition and energy separation. Renew. Energy 2012, 47, 112–126. [Google Scholar] [CrossRef]
- Chen, X.; Feng, Z. Iterative generalized time-frequency reassignment for planetary gearbox fault diagnosis under nonstationary conditions. Mech. Syst. Signal Process. 2016, 80, 429–444. [Google Scholar] [CrossRef]
- Tiwari, P.; Upadhyay, S.H. Novel self-adaptive vibration signal analysis: Concealed component decomposition and its application in bearing fault diagnosis. J. Sound Vib. 2021, 502, 116079. [Google Scholar] [CrossRef]
- Lei, Y.; Lin, J.; Zuo, M.; He, Z. Condition monitoring and fault diagnosis of planetary gearboxes: A review. Measurement 2014, 48, 292–305. [Google Scholar] [CrossRef]
- Reichard, K.M. Calculation of residual signal features for gear fault detection: Physics and signal processing. J. Acoust. Soc. Am. 2001, 109, 2410. [Google Scholar] [CrossRef]
- Adaileh, W.M. Engine fault diagnosis using acoustic signals. Appl. Mech. Mater. 2013, 295, 2013–2020. [Google Scholar] [CrossRef]
- Tan, C.K.; Mba, D. Limitation of acoustic emission for identifying seeded defects in gearboxes. J. Nondestruct. Eval. 2005, 24, 11–28. [Google Scholar] [CrossRef]
- Cirrincione, G.; Kumar, R.R.; Mohammadi, A.; Kia, S.H.; Barbiero, P.; Ferretti, J. Shallow versus deep neural networks in gear fault diagnosis. IEEE Trans. Energy Convers. 2020, 35, 1338–1347. [Google Scholar] [CrossRef]
- Henriquez, P.; Alonso, J.B.; Ferrer, M.A.; Travieso, C.M. Review of automatic fault diagnosis systems using audio and vibration signals. IEEE Trans. Syst. Man Cybern. Syst. 2014, 44, 642–652. [Google Scholar] [CrossRef]
- Mohanty, A.R.; Kar, C. Fault detection in a multistage gearbox by demodulation of motor current wave-form. IEEE Trans. Ind. Electron. 2006, 53, 1285–1297. [Google Scholar] [CrossRef]
- Niemann, H.; Poulsen, N. Fault detection in closed-loop systems using a double residual generator. In Proceedings of the 2022 11th IFAC Symposium on Fault Detection, Supervision and Safety for Technical Processes SAFEPROCESS, Pafos, Cyprus, 8–10 June 2022. [Google Scholar]
- Zhu, C.C.; Li, L.; Ding, S.X. Multiplicative fault detection and isolation in dynamic systems using data-driven k-Gap metric based kNN Algorithm. In Proceedings of the 2022 11th IFAC Symposium on Fault Detection, Supervision and Safety for Technical Processes SAFEPROCESS, Pafos, Cyprus, 8–10 June 2022. [Google Scholar]
- Samada, S.E.; Puig, V.; Nejjari, F. Robust fault detection using zonotopic parameter estimation. In Proceedings of the 2022 11th IFAC Symposium on Fault Detection, Supervision and Safety for Technical Processes SAFEPROCESS, Pafos, Cyprus, 8–10 June 2022. [Google Scholar]
- Benmousssa, S.; Djeziri, M.A. Experimental Application on a Mechanical Transmission System of Integrated Fault Diagnosis and Fault Prognosis method. In Proceedings of the 2018 10th IFAC Symposium on Fault Detection, Supervision and Safety for Technical Processes SAFEPROCESS, Warsaw, Poland, 29–31 August 2018. [Google Scholar]
- Tavner, P.J.; Penman, J. Condition Monitoring of Electrical Machines, 1st ed.; Research Studies Press Ltd.: New York, NY, USA, 1987; pp. 30–32. [Google Scholar]
- Arellano-Padilla, J.; Summer, M.; Gerada, C.; Li, J. A novel approach to gearbox condition monitoring by using drive rectifier input currents. In Proceedings of the 2009 13th European Conference on Power Electronics and Applications, Barcelona, Spain, 8–10 September 2009. [Google Scholar]
- Chen, X.; Feng, Z. Induction motor stator current analysis for planetary gearbox fault diagnosis under time-varying speed conditions. Mech. Syst. Signal Process. 2020, 140, 106691. [Google Scholar] [CrossRef]
- Gao, A.; Feng, Z.; Liang, M. Permanent magnet synchronous generator stator current AM-FM model and joint signature analysis for planetary gearbox fault diagnosis. Mech. Syst. Signal Process. 2021, 149, 107331. [Google Scholar] [CrossRef]
- Song, Y.; Hua, L.; Yan, K.; Han, W.; Zhu, P.; Ye, Z. Research on fault diagnosis method of radar antenna transmission gear based on motor current characteristics. J. Phys. Conf. Ser. 2022, 2296, 012003. [Google Scholar] [CrossRef]
- Marzebali, M.H.; Kia, S.H.; Henao, H.; Capolino, G.-A.; Faiz, Z. Planetary gearbox torsional vibration effects on wound-rotor induction generator electrical signatures. IEEE Trans. Ind. Appl. 2016, 52, 4770–4780. [Google Scholar] [CrossRef]
- Zhang, J.; Dhupia, J.; Gajanayake, C. Stator current analysis from electrical machines using resonance residual technique to detect faults in planetary gearboxes. IEEE Trans. Ind. Electron. 2015, 62, 5709–5721. [Google Scholar] [CrossRef]
- Ottewill, J.R.; Ruszczyk, A.; Broda, D. Monitoring tooth profile faults in epicyclic gearboxes using synchronously averaged motor currents: Mathematical modeling and experimental validation. Mech. Syst. Signal Process. 2017, 84, 78–99. [Google Scholar] [CrossRef]
- Kia, S.H.; Henao, H.; Capolino, G.-A. Gear tooth surface damage fault detection using induction machine stator current space vector analysis. In Proceedings of the 2013 9th IEEE International Symposium on Diagnostics for Electric Machines, Power Electronics and Drives (SDEMPED), Valencia, Spain, 27–30 August 2013. [Google Scholar]
- Jin, Y.; Jia, H.; Ji, Y.; Dragicevic, T.; Teodorescu, R.; Blaabjerg, F. A novel detection and localization approach of open-circuit switch fault for the grid-connected modular multilevel converter. IEEE Trans. Ind. Electron. 2022, 70, 112–124. [Google Scholar] [CrossRef]
- Long, J.; Qin, Y.; Yang, Z.; Huang, Y.; Li, C. Discriminative feature learning using a multiscale convolutional capsule network from attitude data for fault diagnosis of industrial robots. Mech. Syst. Signal Process. 2022, 182, 109569. [Google Scholar] [CrossRef]
- Jiang, Y.; Yin, S.; Kaynak, O. Optimized design of parity relation-based residual generator for fault detection: Data-driven approaches. IEEE Trans. Ind. Inform. 2021, 17, 1449–1458. [Google Scholar] [CrossRef]
- Zhao, F.; Tian, Z.; Liang, X.; Xie, M. An integrated prognostics method for failure time prediction of gears subject to the surface wear failure mode. IEEE Trans. Reliab. 2018, 67, 316–327. [Google Scholar] [CrossRef]
- Zhou, Z.; Athey, S.; Wager, S. Offline multi-action policy learning: Generalization and optimization. Oper. Res. 2022. [Google Scholar] [CrossRef]
- Nikas, T.; Bogris, A.; Syvridis, D. Double sideband suppressed carrier modulation for stable fiber delivery of radio frequency standards. Opt. Commun. 2017, 382, 182–185. [Google Scholar] [CrossRef]
- Zhang, X.; Miao, Q.; Zhang, H.; Wang, L. A parameter-adaptive VMD method based on grasshopper optimization algorithm to analyze vibration signals from rotating machinery. Mech. Syst. Signal Process. 2018, 108, 58–72. [Google Scholar] [CrossRef]
- Huang, E.H.; Shen, Z.; Long, S.R.; Wu, M.C.; Shih, H.H.; Zheng, Q.; Yen, N.C.; Tung, C.C.; Liu, H.H. The empirical mode decomposition and the Hilbert spectrum for nonlinear and non-stationary time series analysis. Proc. R. Soc. Lond. Ser. A 1998, 454, 903–995. [Google Scholar] [CrossRef]
Publisher’s Note: MDPI stays neutral with regard to jurisdictional claims in published maps and institutional affiliations. |
© 2022 by the authors. Licensee MDPI, Basel, Switzerland. This article is an open access article distributed under the terms and conditions of the Creative Commons Attribution (CC BY) license (https://creativecommons.org/licenses/by/4.0/).