Article

Design and Experimental Analysis of Charge Recovery for Piezoelectric Fan

1
School of Automation, Northwestern Polytechnical University, Xi’an 710129, China
2
School of Computer and Information, Dongguan City College, Dongguan 523419, China
3
Shanghai Electro-Mechanical Engineering Institute, Shanghai 201109, China
*
Author to whom correspondence should be addressed.
Actuators 2022, 11(1), 20; https://doi.org/10.3390/act11010020
Submission received: 25 November 2021 / Revised: 26 December 2021 / Accepted: 6 January 2022 / Published: 10 January 2022
(This article belongs to the Section Control Systems)

Abstract

:
The piezoelectric (PE) fan is widely adopted in the field of microelectronics cooling due to its advantages of high reliability and good heat dissipation characteristics. However, PE fans driven by conventional circuits suffer from plenty of energy loss. To save energy, we propose an inductor-based charge recovery method and apply it to the driving circuit for the PE fan. Two inductor-based driving circuits, a single inductor-based driving (SID) circuit and a double inductor-based driving (DID) circuit are compared. The SID circuit has a simple structure and a slightly higher energy-saving rate, while the DID circuit introduces no additional oscillations and is more stable. The experimental results show that when the supply voltage changes, both circuits have a relatively stable energy-saving rate, which is about 30% for the SID circuit and 28% for the DID circuit. Moreover, the proposed circuits enjoy the same driving capacity as the conventional circuit, and the driven fan has the same cooling performance.

1. Introduction

Electronic products are getting compact and powerful with the development of manufacturing technology [1]. Thus, thermal management has become a key issue in avoiding inefficiency or damage to critical equipment. Active strategies of heat transfer enhancement have been pursued such as mechanical aids [2], electrostatic fields [3], and fluid vibration [4]. Among them, the PE fan becomes a feasible solution for electronic cooling applications due to its low power consumption, simple structure, high reliability, and low noise emission [5,6,7,8,9].
In general, the cooling effect of PE fans is localized, making it difficult to completely replace rotary fans. Therefore, PE fans can be used as supplementary components to improve the cooling effects of fan-assisted cooling systems. Extensive research devotes to revealing the structural and dynamic characteristics of PE fans. To improve the PE fan’s performance, various factors (shape of vibrating mode [10,11,12,13], vibrating phase difference [14], fan thickness [15], fan array [16,17,18,19], and fan orientation [20,21,22], etc.) have been intensively investigated. Açikalin et al. [23] found that the frequency offset from the optimal operating frequency is the most significant parameter. Even a small frequency offset of 5% can decrease the cooling capacity of the fan by more than 10 °C. The amplitude of the PE fans, the length of the PE fans, and the distance between the heat source and PE fan are three other important factors. Scholars have made many attempts to promote the practical application of PE fans. Chen et al. [24] experimentally investigated the flapping dynamics of a PE fan in channel flow and the resultant wall heat-removal performance enhancement. Li et al. [14] carried out theoretical and numerical studies on the flow and heat transfer characteristics of single and multi-vibrating PE fans for cooling heated semi-cylindrical concave surfaces and provided a good reference for the design and optimization of multi PE fans. Tiwari and Yeom [25] studied the impact of the PE fan on the convection heat transfer of the heated surface by varying the displacement and relative location of the PE fan at various channel flow velocities. Recently, PE fans also gained much attention for flow control [26] and energy harvesting [27].
However, to the best of our knowledge, little attention has been paid to the driving circuit. Conventional driving circuits typically require an oscillator, a high-voltage power supply, and an HV-amplifier, making driving circuits inexpensive but large [28]. To miniaturize electronic devices, Yong and Fleming [29] proposed an integrated driver circuit with dimensions of 7–12 mm2. The H-bridge circuit is used in the driving circuit, which is composed of class B amplifiers and a step-up power supply. By employing two amplifiers as Bridges, the voltage across the load can be doubled, with an efficiency of over 90%.
The energy in the previous PE fan was wasted due to the lack of charge recovery in the driving circuit. Chao, C. S et al. [30] proposed an improved driving circuit for a piezoelectric micropump using energy storage capacitors to achieve charge recovery. However, capacitive charge recovery is inefficient and its efficiency declines with the increase of power supply voltage. Campolo et al. [31] developed an inductor-based charge recovery circuit. With the help of electromagnetic oscillations, the stored energy in the piezoelectric actuator can be recovered. The charge recovery strategy can theoretically recover all the energy of the piezoelectric element and greatly improve the energy recovery efficiency of the circuit. Biancuzzi [32,33] proposed not only an inductor-based circuit capable of voltage inversion across the actuator without additional negative voltage sources, but also a direct switch alternative concept using small chip inductors. Xu et al. [34] designed and implemented a miniaturized, lightweight circuit topology with an efficiency of 84.6%, indicating that the circuit can be applied to micro mobile robots driven by piezoelectric actuators.
Drawing on the above charge recovery techniques and based on our previous work [35], this paper proposes two efficient switching driving circuits with inductor-based charge recovery techniques for the PE fan. In our paper, two inductor-based driving circuits, a single inductor-based driving (SID) circuit and a double inductor-based driving (DID) circuit, are detailed. An inductor is used in the SID circuit for charge recovery, but a long-time attenuation oscillation is introduced during charging. The DID circuit employs two inductors, which increase the size of the circuit, but it is more stable than the previous circuit. We also compared the charge recovery efficiency of the presented two driving circuits at various supply voltages, which fluctuate slightly around 28%, indicating that the supply voltage has little effect on the energy-saving rate.
The rest of the paper is arranged as follows. In Section 2, the structure and modeling of the PE fan are introduced briefly. Driving circuit and power consumption analysis are proposed in Section 3, and the inductor-based charge recovery strategy has higher energy recovery efficiency. In Section 4, two driving circuits with inductor-based charge recovery for the PE fan are expounded. Section 5 presents the experimental arrangement and discussion of the results. Finally, in Section 6, the conclusions of the paper are stated.

2. Structure and Modelling

The PE fan consists of a thin, flexible metal beam, a clamp, and a pair of piezoelectric patches which are symmetrically attached near the clamping end of the blade, as shown in Figure 1. When an AC voltage with the resonant frequency of the PE fan is applied, the piezoelectric layers act as actuators, due to the inverse piezoelectric effect, driving the PE fan to flap periodically. The PE fan vibrates as its resonant frequency provides maximum amplitude while minimizing power consumption. The spring-mass model of the PE fan was developed to optimize the frequency response [36], and the mechanical equation of the PE fan is expressed as
m e q X ¨ + c e q X ˙ + k e q X k v V = 0
where m e q , c e q , and k e q are equivalent mass, damping, and the stiffness of the fan, X is the displacement of the free end of the beam, and V is the voltage applied to the PZT. Equation (1) indicates the effect of the PZT on the structure of the PE fan. The resonant frequency of the fan is given as
ω = k e q m e q = E b h 3 4 L 3 m e q
where E, b, h, L are the effective Young’s modulus, width, thickness, and length of the beam. The resonant frequency of the PE fan depends on the width, thickness, and length of the beam, and the PE fan with a higher operating frequency generated a better cooling performance than the one with a lower operating frequency [25].

3. Driving Circuit and Power Consumption Analysis

3.1. Conventional Driving Circuit Power Consumption

We theoretically analyzed the energy transfer in electromechanical systems, and evaluated the power consumption of switching control. Generally, the power consumed by PZT actuators is attributed to the mechanical load and consists of two parts: the energy dissipated by the PZT actuators due to internal damping, and the energy consumed by the drive system to suppress structural vibration. The sum of these two parts is calculated by the admittance of the electromechanical system (1/Z(ω)).
In addition to mechanical load, the power consumption caused by periodic charging and discharging of capacitive loads is also an important problem in our switching framework. Considering the mechanical load, the PZT actuator in Figure 2 can be expressed equivalently as a mechanical load (Z(ω)) in parallel with a capacitor [31]. In Figure 3, the waveform of the piezoelectric voltage in the pulse is a series of quasi-square waves. First, the voltage rises to a high level (±VCC) after charging. Capacitance dissipates power during very short switching times, while mechanical impedance responds slowly and consumes little power. Then, for most of the time when the switch is ‘On’, the voltage remains constant to transfer power to the mechanical load. At last, the charge stored in Cp is lost in the grounded circuit without being transferred back to the power supply.
Figure 4 shows the charging process. As we know, the total energy required to charge the initial capacitor Cp through the constant voltage source VCC is exactly twice the energy stored in the capacitor [31]. The energy stored in the capacitor is E C p = 0.5 C p V C C 2 , while an equal amount of energy is consumed in the switching resistor Rswitch. Thus, the average power consumption on Cp is
P C P = C p V C C 2 f switch
where fswitch is the frequency of the switching signal.
The unused charge can be temporarily stored through energy recovery techniques [31] and then transferred to the mechanical load or the power source. Charge recovery of PZT is one of the most effective measures to improve efficiency. C.S. Chao et al. [30] designed a charging recovery circuit to reverse the polarity of the pre-charged PZT by adding an external capacitor to the driving circuit. As PZT extends, energy can be stored in an electric field using the capacity effect of PZT, which can be recovered by storing capacitance when it shrinks.

3.2. Inductor-Based Charge Recovery

Inductor-based charge recovery can theoretically recover the energy of the piezoelectric capacitance completely, due to the resonance between the piezoelectric capacitor and the inductor. Therefore, inductance is considered to be an effective energy storage device.
Figure 5a is the simplified inductor-based charge recovery circuit. Assume that in the initial state, switch S is off, the capacitor voltage is VCC, and no current flows through the circuit. At time zero, the switch conducts, and the current i flows out of the capacitor in the direction of the arrow. Current i causes a magnetic field in the inductor, which increases until the capacitor discharges to zero, at which point the current i reaches a maximum value of Imax. The current in the inductor then drops as the magnetic field of the inductor collapses. In this process, the energy of the magnetic field is transferred back to the capacitor, and when the magnetic field completely dissipates, the capacitor is eventually charged to −Vcc. Due to the unidirectional conductivity of the diode, the capacitor voltage will remain at −Vcc, thus completing the entire energy transfer process. Figure 5b shows the complete process of energy conversion between the inductor and capacitor.
Usually, the resistance in an inductor is negligible, that is R ≈ 0. When ω t = π i = 0 the entire period of current is given by
T / 2 = 1 2 f = π L C
According to Kirchhoff’s voltage law, the voltage across PZT can be depicted as
L C p d 2 V p t d t 2 + R C p d V p t d t + V p t = 0
The solution to Equation (5) is
V p t = C 1 + C 2 e ξ 1 Ω 1 t cos ( Ω 1 1 - ξ 1 2 t θ 1 )
where Ω 1 = 1 / L C p , ξ 1 = R 2 C p L . C1, C2, and θ1 are constants to be determined by the initial conditions. The initial conditions of V p t can be defined as
V p ( 0 ) = V c c , d V p t d t | t = 0 = 0
Combining Equations (5) and (7), we can obtain
d 2 V p t d t 2 | t = 0 = V c c L C p
Thus, with the initial conditions shown in Equations (7) and (8), Equation (6) can be rewritten as
V p t = V c c 1 - ξ 1 2 e ξ 1 Ω 1 t cos ( Ω 1 1 - ξ 1 2 t θ 1 )
where θ 1 = tan - 1 ( ξ 1 / 1 ξ 1 2 ) .
The duration of the switch action is half of the LC oscillation cycle due to the characteristics of the LC circuit. Thus, substituting t i = π / Ω 1 1 - ξ 1 2 into Equation (9), the PZT voltage after switch action can be expressed as
V p ( t i ) = V c c 1 - ξ 1 2 e π ξ 1 / 1 - ξ 1 2 cos ( π θ 1 ) = V c c e π ξ 1 / 1 - ξ 1 2 γ = γ V c c

4. Proposed Driving Circuit with Charge Recovery for the PE Fan

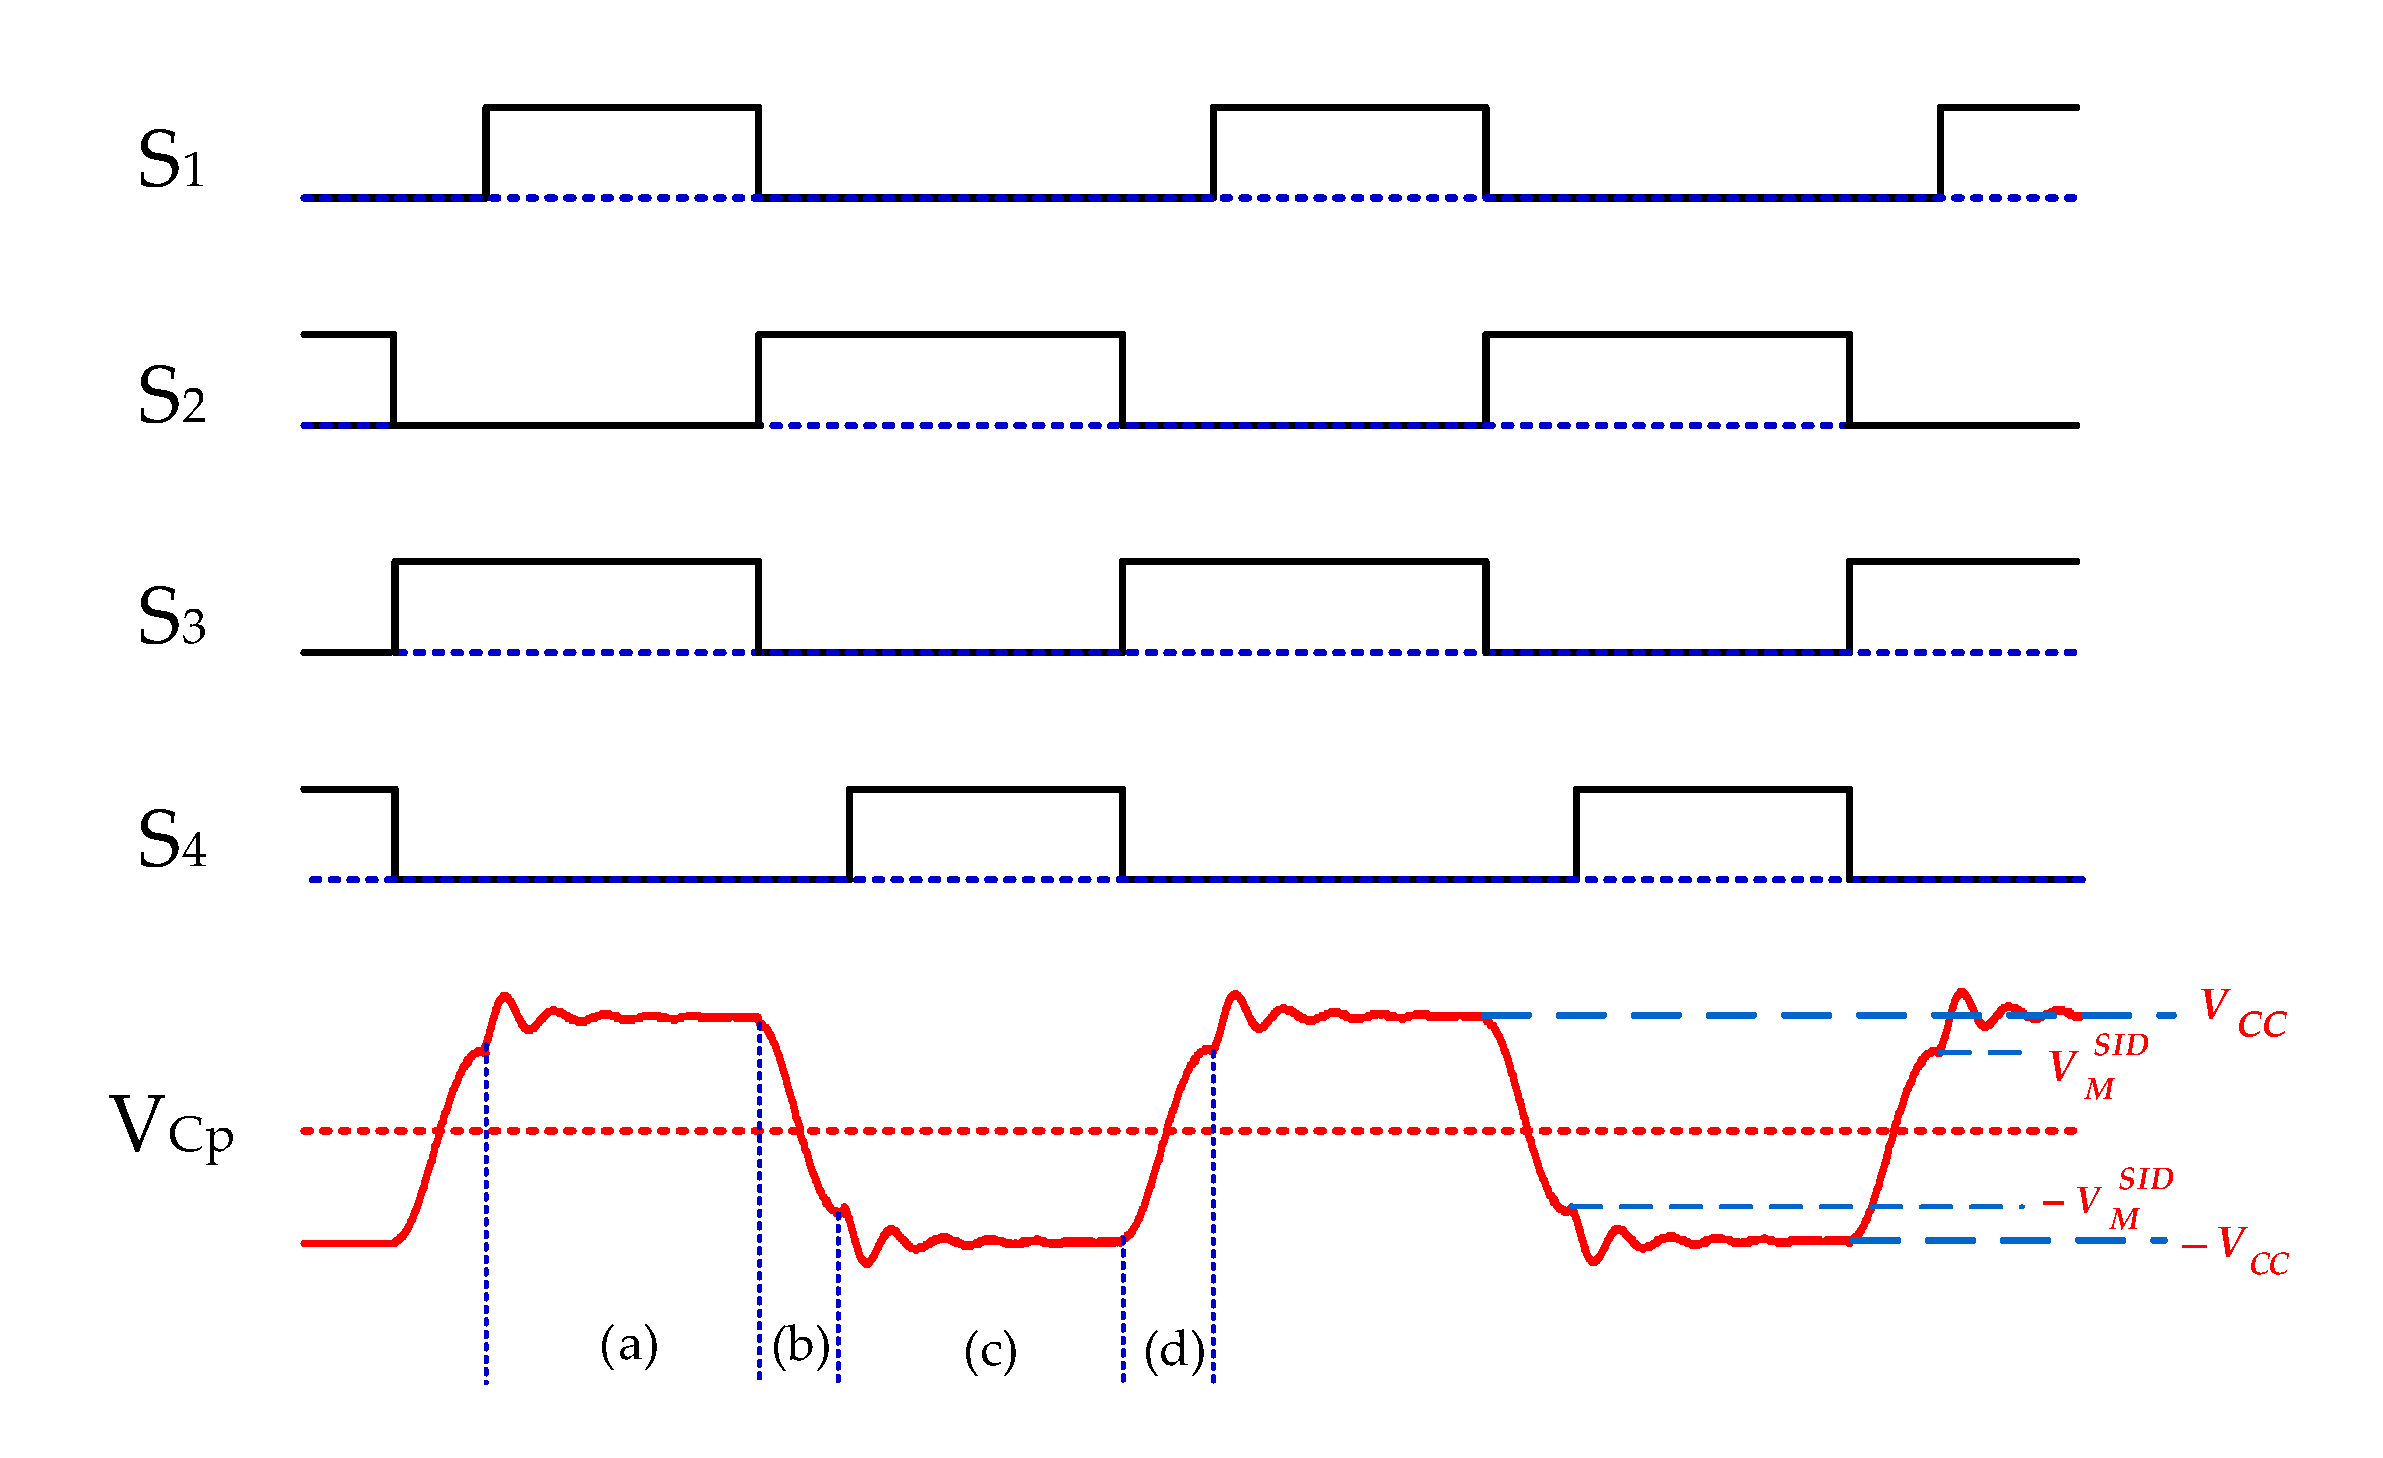
4.1. Single Inductor Based Driving (SID) Circuit

To realize energy recycling, a single inductor-based driving (SID) circuit is proposed. As shown in Figure 6, an inductor is connected in series on the branch of the piezoelectric actuator based on the conventional driving circuit. In every charging process of a piezoelectric element, the current always passes through both the piezoelectric actuator and the inductor at the same time. Therefore, to ensure that the energy in piezoelectric devices can be fully utilized, it is necessary to reserve a certain amount of charge recovery time before the voltage reversal of each PZT. The body diode of the MOS tube served as the reverse blocking diode on the SID circuit, preventing recovered charge from flowing, to maximize the reuse charge stored in the PZT.
Switching waveforms of the SID circuit are shown in Figure 7, four sets of switch signals are generated by a microcontroller to drive the piezoelectric actuator. Due to the close distance between PZT and the inductor, each charging of the piezoelectric element is accompanied by electromagnetic attenuation oscillation.
Figure 8 shows the driving process of the SID circuit, where a cycle consists of four stages, corresponding to (a–d) in the Vcp waveform in Figure 7 and starting with all switches turned off.
As shown in Figure 8a, the microcontroller outputs high-level signals to Q5 and Q4, resulting in the turn-on of Q5, Q1, and Q4. The current flows along with Vcc, Q1, L, PZT, and Q4, causing PZT to charge positively. In Figure 8b, only S2 outputs a high level to Q2 to turn Q2 on, so PZT, L, Q2, and the body diode inside Q4 form a reverse charging loop shown by the green circle. In this stage, the inductor charges the PZT. Similarly, in Figure 8c, the PZT is charged in the reverse direction and then charged in the forward direction by the inductor as shown in Figure 8d.
In Figure 8a, the voltage of the PZT in the SID circuit can be depicted as
L C p d 2 V p t d t 2 + R C p d V p t d t + V p t = V c c
Equation (11) can be rewritten as
d 2 V p t d t 2 + 2 β d V p t d t + ω 0 2 V p t = ω 0 2 V c c
Under the underdamped oscillation condition, the solution of the above equation is
V p t = V c c V P 0 S I D e β t ( cos ω d t + β ω d sin ω d t ) = V c c V P 0 S I D e ξ 1 Ω 1 t 1 - ξ 1 2 cos ( Ω 1 1 - ξ 1 2 t θ 1 )
The piezoelectric voltage inversion in the SID circuit from V M S I D to Vcc can be described by Equation (7) with an initial condition V P 0 S I D = V M S I D ,
V m S I D = V M S I D 1 - ξ 1 2 e ξ 1 Ω 1 t cos ( Ω 1 1 - ξ 1 2 t i S I D θ 1 )
where t i S I D is the time duration of the switch action. It is worth noting that the voltage of PZT peaks at half the oscillation period of the LC. Thus, substituting t i S I D = π / Ω 1 1 - ξ 1 2 into Equation (14), the PZT maximum voltage after switch action can be expressed as:
V p S I D = V c c + V m S I D = V M S I D 1 - ξ 1 2 e π ξ 1 / 1 - ξ 1 2 cos ( π θ 1 ) = V c c + V M S I D e π ξ 1 / 1 - ξ 1 2 γ = V c c + γ V M S I D
Although this circuit has few electrical components and a simple structure, every time the power supply charges the piezoelectric actuator there will be an attenuation oscillation phenomenon, which can be explained by Equation (13). It can be seen from Equation (15) that the peak voltage in the attenuation oscillation caused by the inductor is greater than the supply voltage, which may affect the normal on-off of MOS transistors and tremendously spoil its service life. In addition, during the charging process of the piezoelectric actuator, the inductor consumes energy due to its internal resistance. Further, the high-frequency signal generated by oscillation causes the PE fan to vibrate at a specific model frequency, ultimately crippling the vibration force of the blade.
To eliminate the shocking phenomenon of the piezoelectric actuator during charging, further design and improvement of the circuit will be discussed in Section 4.2.

4.2. Double Inductor-Based Driving (DID) Circuit

An integrated double inductor-based driving (DID) circuit is shown in Figure 9. In this circuit, the optocouplers (O1 and O2) are used as switches to activate the charge recovery and completely isolate the switch from the ground end of the control signal. The introduction of optocoupler switches requires two additional control signals. The switching waveforms of the DID circuit are shown in Figure 10.
Figure 11 shows the process of current flow in the DID circuit. The current flow of this circuit is similar to that of the SID circuit except for the second and fourth stages. Since the inductor is independent, charge recovery does not affect the charging process of the PZT. The forward charging process in the first stage is the same as that of the previous circuit.
In Figure 11b, when switch O1 is turned on, the inductor current i c p is increased. According to Equations (11)–(15), its voltage can be expressed as
V p D I D t = V c c 1 - ξ 1 2 e ξ 1 Ω 1 t cos ( Ω 1 1 - ξ 1 2 t θ 1 )
The final reversed voltage of PZT is
V M D I D = V c c e π ξ 1 / 1 - ξ 1 2 γ = γ V c c
If the parameter γ is equal to 1, the capacitive energy would be completely recovered.
The process of Figure 11c is almost the same as Figure 8c. In this stage, PZT is charged by the source and we can get
V P D I D = V M D I D + ( V c c + V M D I D ) 1 e 1 R D C p t
As shown in Figure 11d, the current i c p in mode (d) has the opposite direction to the current during mode (b). So the voltage of PZT in mode (d) is
V p D I D t = V c c 1 - ξ 1 2 e ξ 1 Ω 1 t cos ( Ω 1 1 - ξ 1 2 t θ 1 )
Due to the existence of diode D2, the voltage of the PZT is stable at
V M D I D = V c c e π ξ 1 / 1 - ξ 1 2 γ = γ V c c
After fulfilling charge reversal, the voltage of PZT in the mode (a) of Figure 11 is
V P D I D = V M D I D + ( V c c - V M D I D ) 1 e 1 R D C p t

4.3. Energy Efficiency Analysis

In this paper, piezoelectric actuators act as a capacitor, and the equivalent capacitance of the fan attracts most of the electric energy in the high voltage driving process. Therefore, the power consumption of capacitors can be used to evaluate the power consumption of piezoelectric devices. The initial voltage of the piezoelectric actuator (Vinitial) in each cycle is zero, so the energy saved by the driving circuit (Esave) and the total energy (Etotal) in a cycle are
E s a v e = 2 ( C 2 ( V i n v e r s e 2 V i n i t i a l 2 ) ) = C V i n v e r s e 2
E t o t a l = 2 ( C 2 ( V f i n a l 2 V i n i t i a l 2 ) ) = C V f i n a l 2
where C is the value of the piezoelectric capacitor, Vinverse is the inversed voltage, and V final is the voltage of piezoelectric actuators at the end of a cycle.
The energy-saving rate η is defined as the ratio of the energy saved through recycling to the total energy [35] and can be obtained by
η = V i n v e r s e 2 V f i n a l 2
Therefore, the energy-saving rate η can be easily calculated without knowing the capacitance value of the PZT, when calculating the efficiency, and the equivalent capacitance cannot be accurately measured.
According to Equation (3), the power consumption is estimated using the static equivalent capacitance of the piezoelectric patches:
P s a v e = E s a v e f
P t o t a l = E t o t a l f
P a c t u a l = P t o t a l P s a v e
where P s a v e is the power saved by the charge recovery function, P t o t a l is the total power consumed by the conventional driving circuit, and P a c t u a l is the actual power consumed by the proposed circuit.

5. Experimental Results and Discussion

5.1. Experimental Setup

Figure 12 shows the experimental setup. The piezoelectric patches are attached on both sides of the beam, forming the fundamental structure of the PE fan, and the other end of the beam is fixed by the base. The silicone heating plate is glued to the insulation board to avoid the interference of heat conduction. We use an LK-G85 laser displacement sensor to measure the displacement of the tip of the beam, a K-thermocouple to measure the temperature of the surface of the silicone heating plate, a DC power supply, and a TDS2024B oscilloscope (Tektronix, Beaverton, OR, USA). The parameters of the proposed circuit are listed in Table 1, and the geometric and material parameters of the beam and piezoelectric patch are listed in Table 2.

5.2. Experimental Results

5.2.1. Validity of the Proposed Quasi-Square Wave Inductor-Based Driving Circuit

Two quasi-square wave inductor-based driving circuits and conventional driving circuits without charge recovery are compared under the same experimental conditions. In Figure 13, the blue curve, the green curve, and the red curve stand for the voltage of the PZT of the conventional circuit, SID, and DID circuit respectively.
As shown in Figure 13, the conventional circuit needs to be charged from scratch by a power source at each variable polarity excitation, whereas in the SID circuit and DID circuit, the charge stored in the PZT actuator is reversed by the charge recovery module. The voltage of the piezoelectric actuator rises rapidly to about 8.2 V (−8.2 V) and then continues to charge positively (negatively) from 8 V (−8 V), so the circuit only needs to be partially replenished, greatly reducing power consumption. However, attenuated oscillations appear in the charging process of the SID circuit. The reverse voltage values between two inductor-based driving circuits show that they both have an excellent energy recovery capacity, while the DID circuit has a better charging performance without oscillation.

5.2.2. Energy Efficiency Calculation

Table 3 and Table 4 show the power and energy-saving rate of two inductor-based driving circuits at different voltages, and Figure 14 shows the energy-saving rate curves of two inductor-based driving circuits at different voltages. As the supply voltage increases, the energy-saving rate of the SID circuit is always slightly greater than that of DID circuit. In terms of the changing trend, the energy-saving rate of the two circuits reaches a maximum of around 30 V, but the overall fluctuation range is limited. The efficiency of the SID circuit is around 30%, and that of DID circuit is around 28%. It can be considered that the energy-saving rate hardly changes with the supply voltage, which is consistent with the theoretical explanation in Section 3.2 that the flipped voltage is only related to the value of γ. Therefore, with constant circuit parameters, it can be assumed that the efficiency of the circuit is almost unaffected by the supply voltage. Figure 15 shows the power consumption of the DID circuit at different frequencies when the supply voltage is 30 V. As the frequency increases, both the power consumed and the power saved increase, indicating the importance of the charge recovery function. Meanwhile, zero-voltage-switching (ZVS) on half-bridge topology can be introduced to further improve the overall efficiency.

5.2.3. Vibration Displacement and Cooling Effect of the PE Fan

In our experiment, the piezoelectric constant is stationary, so the displacement of the PE fan depends on the magnitude of the applied electric field. Both circuits generated a quasi-square wave voltage of 30 V. Since PE fans have a better cooling effect and consume less power at the first resonant mode than at the higher resonant mode [37], it operates at the first resonant frequency of 24.2 Hz. As shown in Figure 16, the vibration displacement of the PE fan driven by the conventional circuit, DID circuit, and SID circuit is almost the same, about 9 mm. Therefore, the driving performance of the proposed inductor-based circuit is comparable to that of the conventional circuit while saving energy.
Figure 17 shows the surface temperature curves of the heating plate under three different conditions. The ambient temperature is 18 °C, and the heating plate is heated to 58 °C for 1 min using a 220 V, 2A DC power supply. After 170 s of natural cooling, the temperature of the heating plate drops to 33 °C. Under the same conditions, when the PE fan is driven by the conventional driving circuit, SID circuit, and DID circuit, the temperature curve of the heating plate is almost the same, and the temperature drops to 21 °C, 12 °C lower than natural cooling. Therefore, the cooling effect of PE fans driven by a conventional circuit, SID circuit, and DID circuit is the same.

6. Conclusions

In this paper, two inductor-based driving circuits are experimentally explored. Through the results of this study, key findings are summarized as follows:
(1)
The proposed quasi-square wave inductor-based driving circuits reuse the energy stored in the piezoelectric patches without using the driving chip of the conventional driving circuit, which improves the efficiency and reduces the cost.
(2)
The SID circuit has the advantages of simple structure, fewer electrical components, and higher energy-saving rate, but accompanied by oscillation during the driving process, while the DID circuit has a more complicated structure and slightly lower energy-saving rate, but is stable without oscillation.
(3)
The energy-saving rate of both circuits fluctuates little with the supply voltage. The energy-saving rate of the SID circuit is around 30%, and that of DID circuit is around 28%.
(4)
When the piezoelectric fan is driven by the conventional driving circuit, SID circuit, and DID circuit respectively, the vibration displacement is the same, and there is no difference in cooling performance under the same conditions.
The current study was performed to analyze the energy-saving effect of the driving circuit. Further work will include deriving a Mason mode to fit electric and mechanical characteristics to the half-bridge topology, and the introduction of soft switching technology to further reduce circuit losses.

Author Contributions

Conceptualization and methodology, Z.C. and W.T.; writing—original draft preparation and validation, Z.C. and Z.L.; data curation and editing, J.L.; resources, supervision, and project administration, W.T. All authors have read and agreed to the published version of the manuscript.

Funding

This study was co-supported by the National Natural Science Foundation of China (No. 61573289), Natural Science Basic Research Plan in Shaanxi Province of China (No. 2019JM-042), and Advanced Jet Propulsion Creativity Center, AEAC (Project ID. HKCX2020-02-019).

Institutional Review Board Statement

Not applicable.

Informed Consent Statement

Not applicable.

Conflicts of Interest

The authors declare no conflict of interest.

References

  1. Xie, H.; Zamkotsian, F. Editorial for the Special Issue on Optical MEMS. Micromachines 2019, 10, 458. [Google Scholar] [CrossRef] [PubMed] [Green Version]
  2. Crespí-Llorens, D.; Vicente, P.; Viedma, A. Flow Pattern of Non-Newtonian Fluids in Reciprocating Scraped Surface Heat Exchangers. Exp. Therm. Fluid Sci. 2016, 76, 306–323. [Google Scholar] [CrossRef]
  3. Quan, X.; Gao, M.; Cheng, P.; Li, J. An Experimental Investigation of Pool Boiling Heat Transfer on Smooth/Rib Surfaces under an Electric Field. Int. J. Heat Mass Transf. 2015, 85, 595–608. [Google Scholar] [CrossRef]
  4. Legay, M.; Gondrexon, N.; Le Person, S.; Boldo, P.; Bontemps, A. Enhancement of Heat Transfer by Ultrasound: Review and Recent Advances. Int. J. Chem. Eng. 2011, 2011, e670108. [Google Scholar] [CrossRef]
  5. Gugulothu, S.K.; Chamkha, A.J. Thermal Intensification of Heat Transfer Characteristics on the Plate-Fin Heat Sink with Piezoelectric Fan. Heat Transfer—Asian Res. 2019, 48, 2629–2638. [Google Scholar] [CrossRef]
  6. Krishan, G.; Aw, K.C.; Sharma, R.N. Synthetic Jet Impingement Heat Transfer Enhancement—A Review. Appl. Therm. Eng. 2019, 149, 1305–1323. [Google Scholar] [CrossRef]
  7. Sufian, S.F.; Abdullah, M.Z. Heat Transfer Enhancement of LEDs with a Combination of Piezoelectric Fans and a Heat Sink. Microelectron. Reliab. 2017, 68, 39–50. [Google Scholar] [CrossRef]
  8. Jeng, T.-M.; Tzeng, S.-C.; Wang, C.-X.; Peng, H.-Y. Flow Visualization and Thermal Resistance Measurement of the LED Heat Sinks with a Built-in Piezoelectric Fan and Various Flow-Runner Opens. Smart Sci. 2016, 4, 62–70. [Google Scholar] [CrossRef]
  9. Hales, A.; Jiang, X. A Review of Piezoelectric Fans for Low Energy Cooling of Power Electronics. Appl. Energy 2018, 215, 321–337. [Google Scholar] [CrossRef]
  10. Abdullah, M.K.; Ismail, N.C.; Abdullah, M.Z.; Mujeebu, M.A.; Ahmad, K.A.; Ripin, Z.M. Effects of Tip Gap and Amplitude of Piezoelectric Fans on the Performance of Heat Sinks in Microelectronic Cooling. Heat Mass Transf. 2012, 48, 893–901. [Google Scholar] [CrossRef]
  11. Sufian, S.F.; Abdullah, M.Z.; Abdullah, M.K.; Mohamed, J.J. Effect of Side and Tip Gaps of a Piezoelectric Fan on Microelectronic Cooling. IEEE Trans. Compon. Packag. Manuf. Technol. 2013, 3, 1545–1553. [Google Scholar] [CrossRef]
  12. Wait, S.M.; Basak, S.; Garimella, S.V.; Raman, A. Piezoelectric Fans Using Higher Flexural Modes for Electronics Cooling Applications. IEEE Trans. Compon. Packag. Technol. 2007, 30, 119–128. [Google Scholar] [CrossRef] [Green Version]
  13. Fairuz, Z.M.; Sufian, S.F.; Abdullah, M.Z.; Zubair, M.; Abdul Aziz, M.S. Effect of Piezoelectric Fan Mode Shape on the Heat Transfer Characteristics. Int. Commun. Heat Mass Transf. 2014, 52, 140–151. [Google Scholar] [CrossRef]
  14. Li, X.; Chen, W.; Lu, S. Characterization of the Thermal Performance of Multi Piezoelectric Fans for Cooling a Semi-Cylindrical Concave Surface. Int. J. Mech. Sci. 2021, 208, 106672. [Google Scholar] [CrossRef]
  15. Conway, C.; Jeffers, N.; Agarwal, A.; Punch, J. Influence of Thickness on the Flow Field Generated by an Oscillating Cantilever Beam. Exp. Fluids 2020, 61, 167. [Google Scholar] [CrossRef]
  16. Huang, C.-H.; Fan, G.-Y. Determination of Relative Positions and Phase Angle of Dual Piezoelectric Fans for Maximum Heat Dissipation of Fin Surface. Int. J. Heat Mass Transf. 2016, 92, 523–538. [Google Scholar] [CrossRef]
  17. Kim, Y.-H.; Wereley, S.T.; Chun, C.-H. Phase-Resolved Flow Field Produced by a Vibrating Cantilever Plate between Two Endplates. Phys. Fluids 2004, 16, 145–162. [Google Scholar] [CrossRef]
  18. Shyu, J.-C.; Syu, J.-Z. Plate-Fin Array Cooling Using a Finger-like Piezoelectric Fan. Appl. Therm. Eng. 2014, 62, 573–580. [Google Scholar] [CrossRef]
  19. Kimber, M.; Lonergan, R.; Garimella, S.V. Experimental Study of Aerodynamic Damping in Arrays of Vibrating Cantilevers. J. Fluids Struct. 2009, 25, 1334–1347. [Google Scholar] [CrossRef] [Green Version]
  20. Liu, S.-F.; Huang, R.-T.; Sheu, W.-J.; Wang, C.-C. Heat Transfer by a Piezoelectric Fan on a Flat Surface Subject to the Influence of Horizontal/Vertical Arrangement. Int. J. Heat Mass Transf. 2009, 52, 2565–2570. [Google Scholar] [CrossRef]
  21. Abdullah, M.K.; Ismail, N.C.; Abdul Mujeebu, M.; Abdullah, M.Z.; Ahmad, K.A.; Husaini, M.; Hamid, M.N.A. Optimum Tip Gap and Orientation of Multi-Piezofan for Heat Transfer Enhancement of Finned Heat Sink in Microelectronic Cooling. Int. J. Heat Mass Transf. 2012, 55, 5514–5525. [Google Scholar] [CrossRef]
  22. Jeng, T.-M.; Tzeng, S.-C.; Huang, Y.-C. The Orientation Effect of Driven Air Flow on Cooling Performance of the Cylindrical Heat Sink with a Built-in Horizontally-Placed Fan. Int. Commun. Heat Mass Transf. 2017, 81, 190–200. [Google Scholar] [CrossRef]
  23. Açıkalın, T.; Garimella, S.V.; Raman, A.; Petroski, J. Characterization and Optimization of the Thermal Performance of Miniature Piezoelectric Fans. Int. J. Heat Fluid Flow 2007, 28, 806–820. [Google Scholar] [CrossRef] [Green Version]
  24. Chen, Y.; Peng, D.; Liu, Y. Heat Transfer Enhancement of Turbulent Channel Flow Using a Piezoelectric Fan. Int. J. Heat Mass Transf. 2020, 147, 118964. [Google Scholar] [CrossRef]
  25. Tiwari, J.; Yeom, T. Enhancement of Channel-Flow Convection Heat Transfer Using Piezoelectric Fans. Appl. Therm. Eng. 2021, 191, 116917. [Google Scholar] [CrossRef]
  26. Dehdari Ebrahimi, N.; Eldredge, J.D.; Ju, Y.S. Three-Dimensional Characteristics of the Jet Flows Induced by a Pitching Plate in a Quiescent Fluid. J. Fluid Mech. 2020, 887, A25. [Google Scholar] [CrossRef]
  27. Liang, Z.; Xu, C.; Ren, B.; Di, W.; Li, L.; Luo, H.; Chen, Z.; Su, J. Optimization of Cantilevered Piezoelectric Energy Harvester with a Fixed Resonance Frequency. Sci. China Technol. Sci. 2014, 57, 1093–1100. [Google Scholar] [CrossRef]
  28. Maaspuro, M. Piezoelectric Oscillating Cantilever Fan for Thermal Management of Electronics and LEDs—A Review. Microelectron. Reliab. 2016, 63, 342–353. [Google Scholar] [CrossRef]
  29. Yong, Y.K.; Fleming, A.J. Piezoelectric Actuators With Integrated High-Voltage Power Electronics. IEEEASME Trans. Mechatron. 2015, 20, 611–617. [Google Scholar] [CrossRef]
  30. Chao, C.-S.; Huang, P.-C.; Chen, M.-K.; Jang, L.-S. Design and Analysis of Charge-Recovery Driving Circuits for Portable Peristaltic Micropumps with Piezoelectric Actuators. Sens. Actuators Phys. 2011, 168, 313–319. [Google Scholar] [CrossRef]
  31. Campolo, D.; Sitti, M.; Fearing, R.S. Efficient Charge Recovery Method for Driving Piezoelectric Actuators with Quasi-Square Waves. IEEE Trans. Ultrason. Ferroelectr. Freq. Control 2003, 50, 237–244. [Google Scholar] [CrossRef] [Green Version]
  32. Biancuzzi, G.; Lemke, T.; Woias, P.; Ruthmann, O.; Schrag, H.J.; Vodermayer, B.; Schmid, T.; Goldschmidtboeing, F. Performance of Piezoelectric Micropumps Actuated by Charge Recovery. Procedia Chem. 2009, 1, 698–701. [Google Scholar] [CrossRef] [Green Version]
  33. Biancuzzi, G.; Lemke, T.; Woias, P.; Ruthmann, O.; Schrag, H.J.; Vodermayer, B.; Schmid, T.; Goldschmidtboeing, F. Design and Simulation of Advanced Charge Recovery Piezoactuator Drivers. J. Micromech. Microeng. 2010, 20, 105022. [Google Scholar] [CrossRef]
  34. Xu, Z.; Wang, Y.; Chen, C. Micro Converter with a High Step-up Ratio to Drive a Piezoelectric Bimorph Actuator Applied in Mobile Robots. Int. J. Adv. Robot. Syst. 2018, 15, 172988141876345. [Google Scholar] [CrossRef] [Green Version]
  35. Ren, Y.; Tang, W.; Wang, Y.; Wang, L.; Cui, M.; Li, Z. Switch Controlled Charge Recovery Technique for Piezoelectric Fan. In Proceedings of the 2019 31st Chinese Control and Decision Conference (CCDC 2019), Nanchang, China, 3–5 June 2019; IEEE: New York, NY, USA, 2019; pp. 2259–2264. [Google Scholar]
  36. Tang, W.; Wang, L.; Ren, Y.; Bao, B.; Cao, J. Design and Experimental Analysis of Self-Sensing SSDNC Technique for Semi-Active Vibration Control. Smart Mater. Struct. 2018, 27, 085028. [Google Scholar] [CrossRef]
  37. Lei, T.; Jing-zhou, Z.; Xiao-ming, T. Numerical Investigation of Convective Heat Transfer on a Vertical Surface Due to Resonating Cantilever Beam. Int. J. Therm. Sci. 2014, 80, 93–107. [Google Scholar] [CrossRef]
Figure 1. (a) Schematic of PE fan. (b) spring-mass model of PE fan.
Actuators 11 00020 g001
Figure 2. Equivalent circuit of H bridge.
Actuators 11 00020 g002
Figure 3. The quasi-square wave of Vp.
Actuators 11 00020 g003
Figure 4. Equivalent RC circuit for charging.
Actuators 11 00020 g004
Figure 5. Inductor-based charge recovery strategy. (a) Equivalent inductor-based charge recovery circuit; (b) Energy conversion between inductor and capacitor.
Actuators 11 00020 g005
Figure 6. Single inductor-based driving (SID) circuit.
Actuators 11 00020 g006
Figure 7. Switching waveforms of the SID circuit.
Actuators 11 00020 g007
Figure 8. Driving process of the SID circuit, including four stages (ad) in a cycle.
Actuators 11 00020 g008
Figure 9. Double inductor-based driving (DID) circuit.
Actuators 11 00020 g009
Figure 10. Switching waveforms of the DID circuit.
Actuators 11 00020 g010
Figure 11. Driving process of the DID circuit, including four stages (ad) in a cycle.
Actuators 11 00020 g011
Figure 12. The experimental setup.
Actuators 11 00020 g012
Figure 13. Voltages of PZT driven by three circuits.
Actuators 11 00020 g013
Figure 14. Energy-saving rate curves at different voltages of (a) SID circuit (b) DID circuit.
Actuators 11 00020 g014
Figure 15. Power consumption at different frequencies.
Actuators 11 00020 g015
Figure 16. Vibration displacement of the PE fan.
Actuators 11 00020 g016
Figure 17. Surface temperature of rubber heating plate.
Actuators 11 00020 g017
Table 1. Parameters of the proposed circuit.
ParameterSymbolValue
ResistorR1,R3500 KΩ
ResistorR2,R42 MΩ
PMOSQ1,Q3IRF4905
NMOSQ2,Q4,Q5,Q6IRF740
InductanceL,L1,L23H
OptocouplerO1,O2TLP521
DiodeD1,D2IN4148
Table 2. Geometric and material parameters of the beam and PZT.
ParameterSymbolValue
Young’s modulus of the beamES70 GPa
Length of the beamLS150 mm
Width of the beamwS26 mm
Thickness of the beamhS0.6 mm
Density of the beam ρ S 2700 kg/m3
1st bending mode f r 24.2 Hz
Young’s modulus of the PZTEP67 GPa
Length of the PZTlP50.8 mm
Width of the PZTwP25.4 mm
Thickness of the PZThP0.3 mm
Density of the PZT ρ P 7800 kg/m3
Capacitance of the PZTCp101.8 nF
Internal Resistance of the PZTRp4 MΩ
Piezoelectric constantd31−190 pm/V
Constant strain permittivity ε 33 s 15.9 nF/m
Table 3. Power and energy-saving rate at different voltages of SID circuit.
Supply Voltage (V)Inversed Voltage (V) P s a v e   ( mW ) Energy-Saving Rate of SID η1
105.60.07731.36%
158.40.17431.36%
2011.40.32032.49%
2515.20.56936.97%
3017.60.76334.42%
35200.98532.65%
4022.41.23631.36%
4524.81.51530.37%
5027.21.82329.59%
5529.62.15828.96%
60322.52328.44%
Table 4. Power and energy-saving rate at different voltages of DID circuit.
Supply Voltage (V)Inversed Voltage (V) P s a v e   ( mW ) Energy-Saving Rate of DID η2
1050.06225.00%
1580.15828.44%
2011.20.30931.36%
2512.80.40426.21%
3016.80.69531.36%
3518.40.83427.64%
4021.61.14929.16%
45241.41928.44%
5025.61.61526.21%
5528.82.04327.42%
6031.22.39827.04%
Publisher’s Note: MDPI stays neutral with regard to jurisdictional claims in published maps and institutional affiliations.

