Article

Evaluation of Dynamic Load Reduction for a Tractor Semi-Trailer Using the Air Suspension System at all Axles of the Semi-Trailer

1
Department of Automotive Mechanical Engineering, Faculty of Mechanical Engineering, University of Transport and Communications, Hanoi 100000, Vietnam
2
Vietnam Register, 18 Pham Hung Street, My Dinh 2 Ward, Nam Tu Liem District, Hanoi 100000, Vietnam
3
University Grenoble Alpes, CNRS, Grenoble INP, GIPSA-Lab, 38000 Grenoble, France
*
Author to whom correspondence should be addressed.
Actuators 2022, 11(1), 12; https://doi.org/10.3390/act11010012
Submission received: 16 November 2021 / Revised: 9 December 2021 / Accepted: 10 December 2021 / Published: 5 January 2022
(This article belongs to the Special Issue Vehicle Modeling and Control)

Abstract

:
The air suspension system has become more and more popular in heavy vehicles and buses to improve ride comfort and road holding. This paper focuses on the evaluation of the dynamic load reduction at all axles of a semi-trailer with an air suspension system, in comparison with the one using a leaf spring suspension system on variable speed and road types. First, a full vertical dynamic model is proposed for a tractor semi-trailer (full model) with two types of suspension systems (leaf spring and air spring) for three axles at the semi-trailer, while the tractor’s axles use leaf spring suspension systems. The air suspension systems are built based on the GENSYS model; meanwhile, the remaining structural parameters are considered equally. The full model has been validated by experimental results, and closely follows the dynamical characteristics of the real tractor semi-trailer, with the percent error of the highest value being 6.23% and Pearson correlation coefficient being higher than 0.8, corresponding to different speeds. The survey results showed that the semi-trailer with the air suspension system can reduce the dynamic load of the entire field of speed from 20 to 100 km/h, given random road types from A to F according to the ISO 8608:2016 standard. The dynamic load coefficient (DLC) with the semi-trailer using the air spring suspension system can be reduced on average from 14.8% to 29.3%, in comparison with the semi-trailer using the leaf spring suspension system.

1. Introduction

1.1. Background

Tractor semi-trailers are an important means of freight transport worldwide. In the US, about 11 billion tons of commodities are transported every year by this mode, valued at USD 700.4 billion, creating jobs for approximately 10 million people. According to statistics, there were about 5.6 million tractor semi-trailers [1] in the US in 2014. The number of tractor semi-trailers in various European countries as of 2012 was as follows: approximately 310,000 vehicles in France, nearly 290,000 in Germany, more than 270,000 in Poland, more than 250,000 in Spain, more than 200,000 in Turkey, more than 130,000 in The Netherlands, approximately 100,000 in Italy, close to 80,000 in Romania, and approximately 50,000 in The Czech Republic [2]. Tractor semi-trailers have made remarkable contributions to the socio-economic growth and transportation sector development, yet due to the nature of the heavy load of these vehicles, roads need protecting in a serious manner. The key factor to road damages is the road surface pressure on roads in contact with these vehicles. There are two fundamental solutions to reduce the vertical dynamic tire forces on roads, i.e., (1) to increase the contact surface area of vehicle wheels and/or (2) to reduce the vertical dynamic tire forces in contact with the road (including static load and dynamic load). The static load of vehicles is subject to each national regulation, and hence the desired load reduction for vehicle wheels during operation will target the reduction of dynamic load. A study by Cebon [3] has introduced solutions for reduced pressure on roads, including: (1) use of balanced vehicle axles; (2) double tires; (3) static load sharing, and (4) reduction of dynamic load. Solutions of balanced vehicle axles, double tires, and static load sharing are used for increasing the road contact surface. Heavy vehicles have all applied these solutions. Hence, besides the above-mentioned solutions, it is also necessary to reduce the dynamic load of tractor semi-trailers, which can be realized by the two most commonly considered options, specifically: controlled suspension systems and non-linear elastic element suspension systems, such as air springs. The controlled suspension system is not cost-effective for this means of transport because of the high production costs and high energy consumption of the control system. An optimal, feasible option of the air suspension system can be substituted for the conventional leaf spring suspension system. In order to form the basis for evaluating the extent of dynamic load reduction in the air suspension system against the leaf spring suspension systems, it is important to establish a full vertical dynamic model of tractor semi-trailers using both of the suspension systems mentioned above, to identify the characteristics of the elastic element, given that the other structural parameters of a vehicle remain constant. A common criteria used to compare the dynamic tire force is the dynamic load coefficient (DLC). Dynamic load is impacted by two key drivers, movement velocity and road types, according to each static load of vehicles.

1.2. Related Works

1.2.1. Air Suspension Model

What makes the air suspension system different from the leaf spring suspension systems is the air spring. The air spring was first successfully manufactured in the 1950s when flexible rubber fiber came into being. In the early days, the air spring was used in buses in the US and in Europe. After that, manufacturers started to design air springs for heavy vehicles with leveling valves for pressure adjustment. This application was then introduced in cars in the later years. The air spring in heavy vehicles, in the US, gradually replaced the conventional leaf spring due to the benefits that the air suspension system brought about. Until 1996, the air suspension system accounted for 36% of heavy vehicles’ suspension systems, and then 75% in 2008 [4]. Then, specialized studies looked further into the air suspension system with a focus on the following issues: (1) creating and developing the models of the air suspension system, and (2) integrating such models of the air suspension system to vehicle models for dynamic vehicle studies.
In terms of structure, the air suspension system is made of the following key parts: the air spring, reservoir, pipe, and leveling valve. In order to establish the model of the air suspension system, the literature shows the modeling of thermodynamic processes in the system, corrections of structural parameters, and descriptions of loss in the system. Currently, popular models of the air suspension system include: Nishimura, Vampire, Simpac, GENSYS, Quaglia, and Cebo, and relevant studies have tackled the modeling of the air suspension system, as detailed below.

Development of the Model of the Air Suspension System

Wang [5] developed the model of the air suspension system using Quaglia’s methodology [6] considering thermal exchange, based on the conservation of energy principle, the identification of dynamic stiffness of the air spring via experiments, and the development of the characteristics of the leveling valve with the correction coefficient identified via experiments. The research was implemented based on a quarter car model. Similar to the air suspension system model based on the Quaglia method, Chen [7] established a model of the air suspension system with a full description of the following compartments: the air spring, reservoir, pipe, leveling valve, and the connector, and the model considers thermal exchange and system loss. The research resulted in the identification of two important input parameters, i.e., effective area (as a function of displacement) and the characteristic of leveling valves. The work was performed with a quarter vehicle model. The authors integrated the air suspension system model to the tractors to study the balance of the suspension system, along with validation experiments. However, the research did not look into the dynamic load. Zhu et al. [8] established the dynamic model of the air spring according to the Quaglia model, which considered friction and viscosity. The research focused on 6 input parameters of the model, including effective area and the volume of the air spring as the spare root function of displacement, friction, and viscosity, via experiments. The research was carried out on a quarter model with the air suspension system to improve the accuracy of the system.
Nieto et al. [9] established an analytical model of the air suspension system based on experimental descriptions. The non-linear model described three components: the air spring, reservoir, and pipe, without a description of the leveling valves. The research resulted in the identification of effective area and volume of the air spring according to the displacement of the air spring. However, the research only established a quarter model, with a focus on the convoluted bellow. Chang and Lu [10] introduced a dynamic model of the air spring with consideration of the thermal transmission process. The model itself is a complex of three blocks: the “geometry block”, describing the effective area and the volume of the air spring according to the displacement of the air spring, the “thermodynamics block”, describing the state of thermodynamics in the system, and the “calculate spring force block”, identifying the forces of the air spring, as calculated. The survey results from a quarter model with the sine excitation function were compared between the classical model and the new model. The research also performed validation experiments in a quarter model and integrated the model of the air suspension system in the vehicle, using co-simulation. However, the air suspension system model integrated on passenger vehicles was limited to automotive models, without further surveys. Chen et al. [11] established a non-linear model for a semi-trailer with multiple axles, combined with the longitudinal connected air suspension, for the purpose of evaluating the dynamic load sharing using the DLC and the dynamic load sharing coefficient (DLSC). The research mainly focused on evaluating the impacts of the structural factors (pressure, pipe diameters, connector diameters) on DLC and DLSC. However, this research did not evaluate the impacts of velocity and road types. White [12] developed a model of the air suspension system and looked into the impacts of different structures of the leveling valve on the rollover stability of heavy vehicles. The research results are related to leveling valves and their correlation with rollover limits. Nakajima et al. [13] developed a model of the air suspension system, which described the air mass flow rate as a function of the valve opening angle. The valve opening angle is dependent on the displacement of the rotating control arm, as a result of the relative movements between the vehicle frame and the axle. The model was developed for rail transport.

Integrating the Model of the Air Suspension System in Vehicle Models

Several researchers have studied the application of the GENSYS and Quaglia models to understand the suspension systems (structure and control), specifically the cab suspension system. The following paragraphs outline studies that integrated the suspension system model into the vehicle model.
Sayyaadi and Shokouchi [14] used the GENSYS model to study the impacts of the structural parameters of a suspension system in a vehicle. The research developed a horizontal and vertical quarter model, considered friction, and identified dynamic stiffness in relation to force-displacement and the dynamic stiffness in the frequency zone. It also studied the impacts of structural parameters, such as the volume of the reservoir and the diameters and lengths of pipes to calculate the design of the suspension system in the vehicle. Moheyeldein et al. [15] established two quarter vehicle models: the classical model and the GENSYS model, using the random excitation function, and studied the impacts of suspension system structural parameters such as ride height, diameters of the air spring, pressure of the air spring, volume of the reservoir, and diameter and length of the pipes. The authors compared the classical model with the GENSYS model by means of acceleration of the sprung mass and the dynamic load, thereby confirming the preciseness of the GENSYS model. Abid [16] conducted research establishing an air suspension system model equivalent to the passive suspension system model of passenger automobiles. In the research, a quarter model using the GENSYS model and a quarter model of the passive suspension system were studied, with the aim to find out the optimal specifications for the air suspension system according to relative displacement, similar to a passive suspension system given the same input excitation. This was achieved through using the OptiY programming for minimizing the variations when comparing the displacements of the two models.
Tang [17] established the air spring model to suspend the cab in accordance with the Quaglia model, whereas the parameters of effective area and the volume of the air spring can be identified via experiments. Co-simulation between ADAMS and AMESim was used to integrate the air spring model in the dynamic model of automobile cabs. Comparisons were made between the results of experiments and simulations and established according to the ride comfort under random road excitation. The purpose of the study was to understand the ride comfort by means of acceleration at the position of the driver in the frequency range; however, the study did not examine dynamic loads. Hondo [18] established a model and experiment to identify the relation between the input pressure of leveling valves and the pressure of the air spring by means of the air mass flow rate through the valve under the impact of centrifugal inertia force.
Studies of active and semi-active control for the air suspension system include research by Razdan et al. [19], who recommended a responsive control system and active fluctuation control through the internal air flow rate control in the system, and introduced the algorithms for controlling the air mass flow rate through valves according to different parameters. This research used a quarter model and the air suspension system model for control calculations.
In general, the studies showed that the air suspension system model is established based on the descriptions of the dynamics and thermodynamics of the air flow in the system. The complexity of the model depends on the specialty and preciseness of the structural parameters, and the calculations of losses, so that different models can be formulated. The model of the air suspension system can be used to study the dynamics of wheels, to optimize the suspension system design, or to establish vehicle models.

1.2.2. Dynamic Load

Buhari et al. [20] studied the DLC of heavy vehicles. They established a quarter model using the air suspension system with different structures: single axles, double axles, and triple axles, of various suspension systems (air spring and leaf spring), as the basis for comparison. The parameters used in the study include: load level, with random excitation on type C roads, at the speed of 30 m/s. The research results brought forward some important conclusions, as follows: (1) dynamic load is influenced by four variables: vehicle velocity, road type, load level, and the type of suspension system; (2) the load level 1/3 of the full load causes the most severe damage to the road, compared with other load levels, and (3) the DLC of vehicles with the air suspension system is always smaller than that using leaf spring suspension systems. The research used a quarter model and conditions of a common road type and fixed velocity. Siddiqui [21] conducted an analysis of the impacts of dynamic loads of urban buses on roads and the influential factors on dynamic load, and studied ride comfort of urban buses in many seat locations in the passenger compartment. Study results focused mainly on the relation between dynamic loads and the ride comfort of urban buses. Muluka [22] established a dynamic model for 3-axle trucks using the air suspension system with consideration of the air spring, factors impacting the dynamic load of vehicle wheels, and optimizing the anti-shock function, as well as the elasticity unit for less dynamic load. It is in this research where a vertical half-model 3-axle truck was established. Hu [23] pointed out the variables affecting the DLC of a heavy-duty truck, including: excitation frequency, velocity, and load level. The research established the relation between the DLC and a function of velocity versus the road with a high roughness value and versus the road with a low roughness value. Research results were generated on a quarter model of trucks with two road types and three load levels. However, the scope of the study was still limited, and a full-function automobile model has not been considered yet.
In the literature, several studies have been concerned with various vehicles, ranging from trucks, passenger automobiles, to tractor semi-trailers, with relevant content about factors affecting dynamic load and comparisons of dynamic load of suspension systems and optimization of design parameters of suspension systems for reduced dynamic load. The variables affecting the dynamic load have been investigated at a general level. The above-mentioned studies suggest that the use of the air suspension system according to the GENSYS model and the application of a full vertical dynamic model for tractor semi-trailers are new and require more strategic evaluation in terms of impacting factors of dynamic loads, which include vehicle velocity and road types.

1.3. Paper Contributions

The purpose of this paper is to evaluate the possibility to reduce the dynamic load of a semi-trailer by using the air suspension system against the leaf spring suspension system. The contributions of this paper are listed as follows:
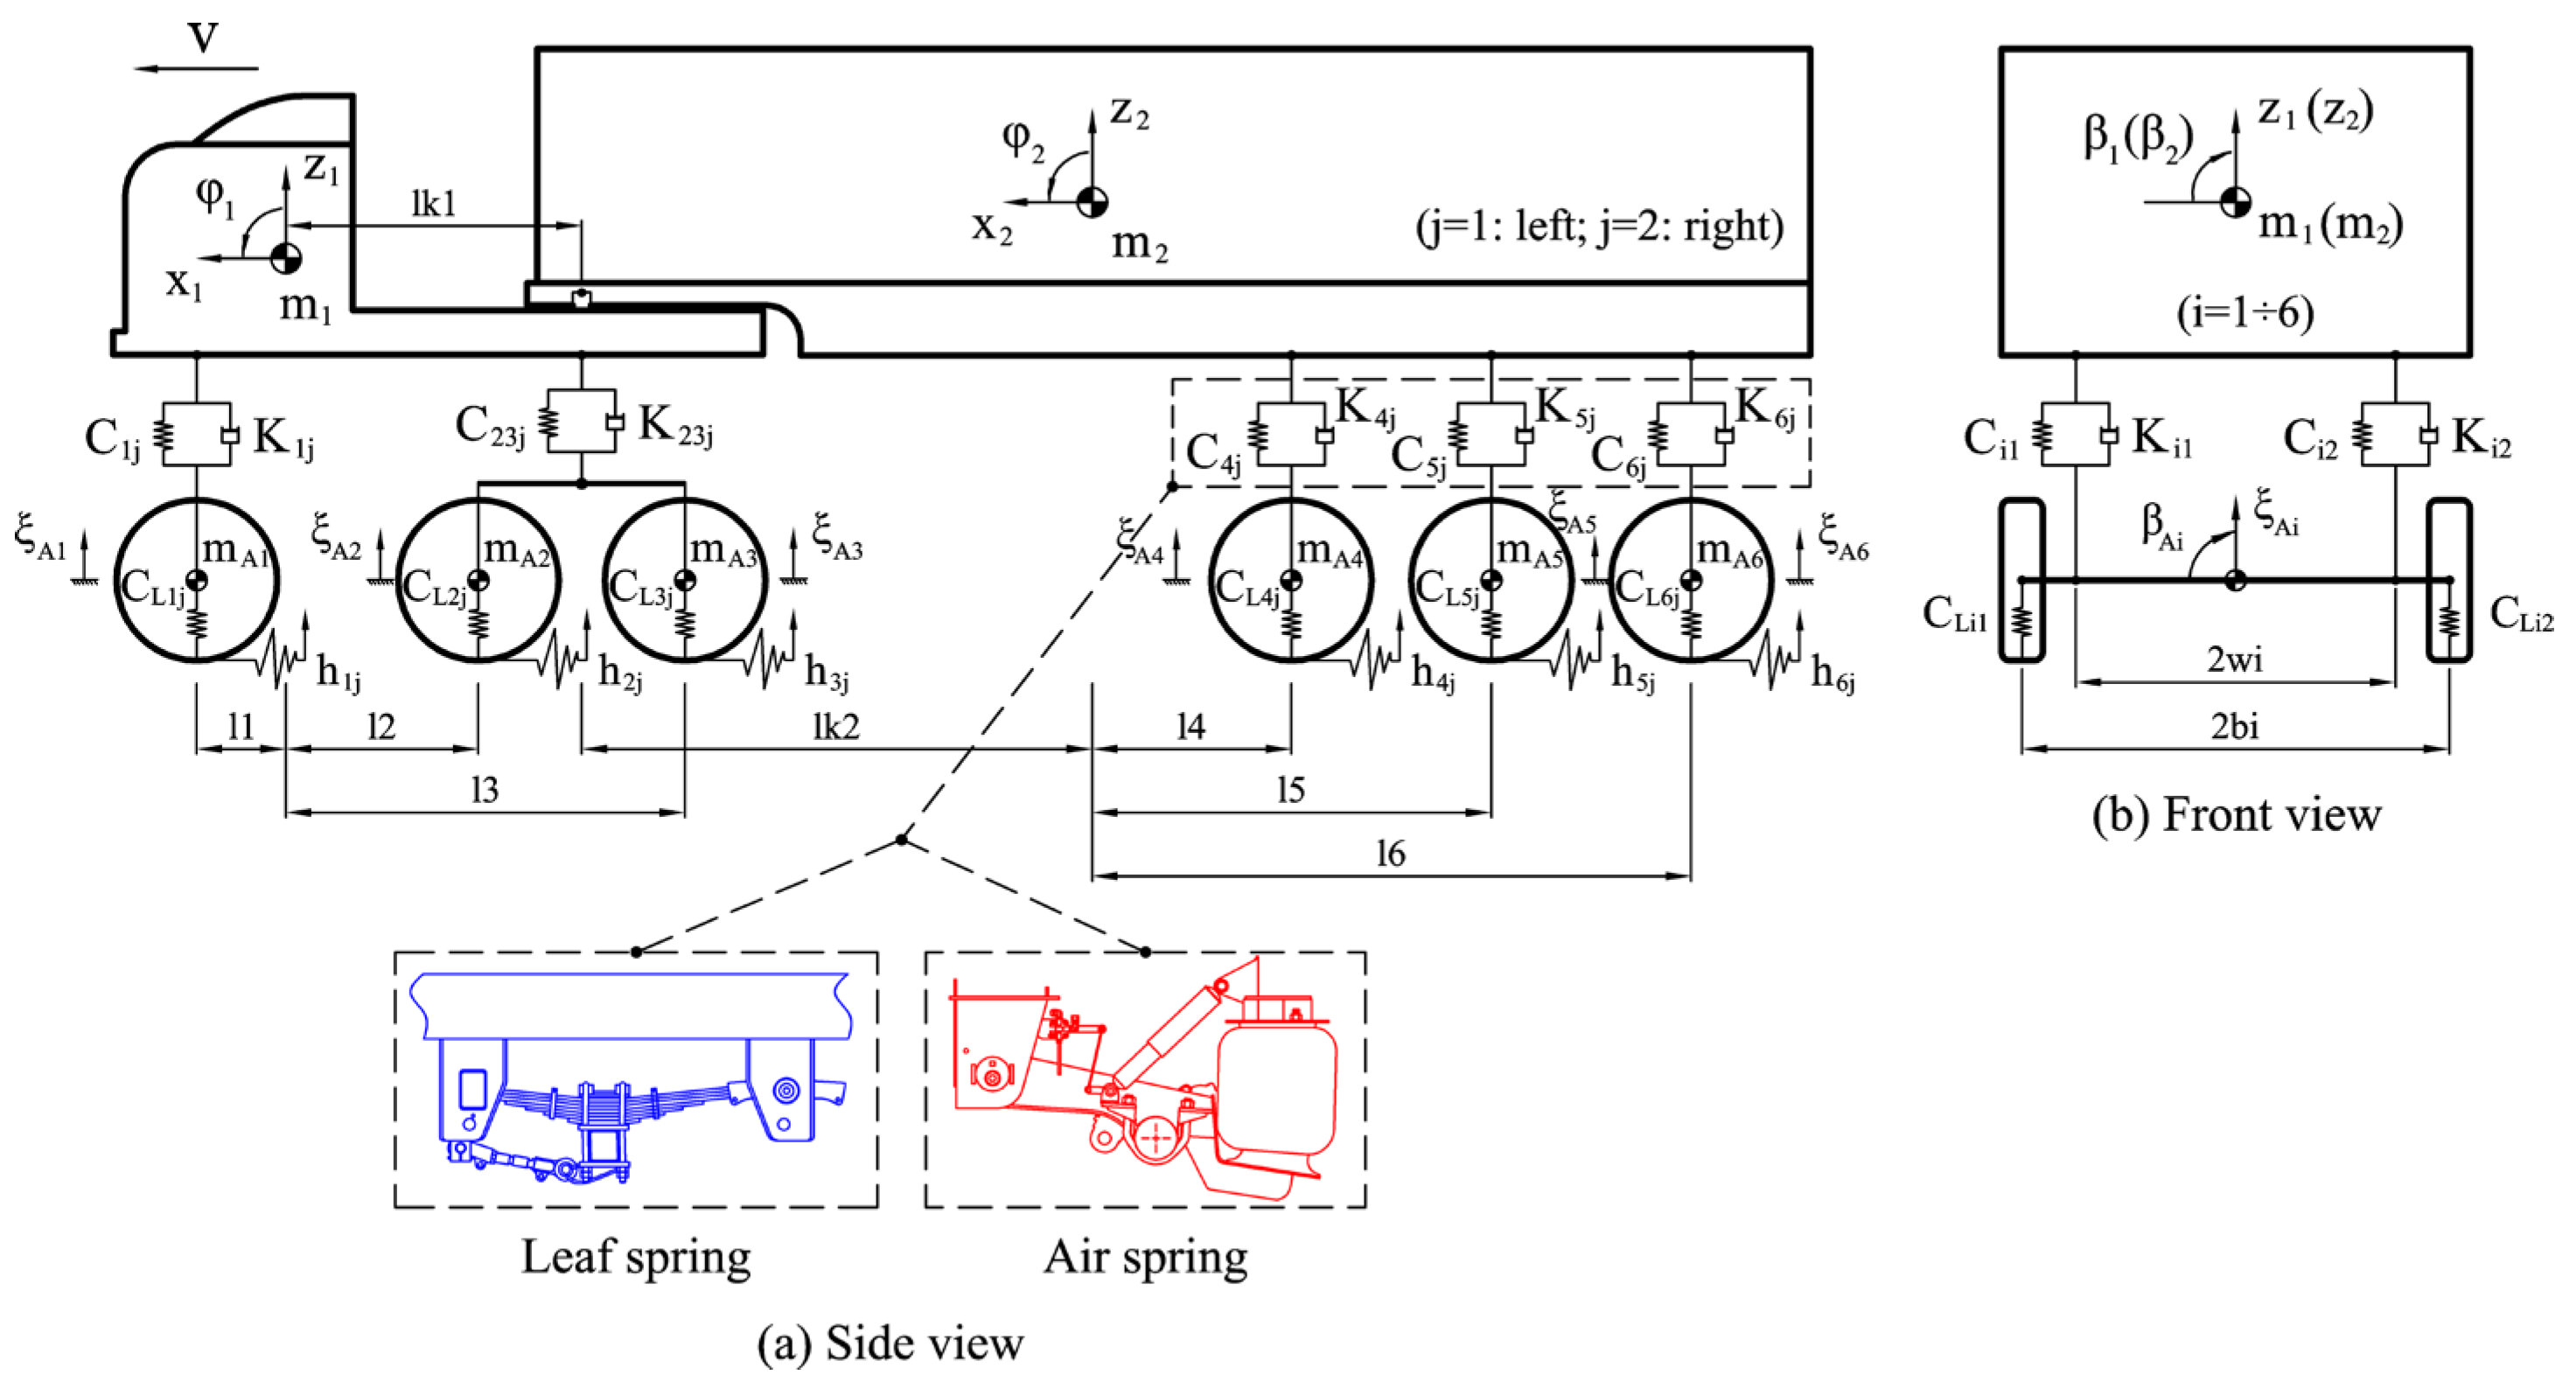
Propose a full vertical dynamic model of a 6-axle tractor semi-trailer with 26 degrees of freedom for the leaf spring suspension systems and 28 degrees of freedom for the air suspension systems. Leaf suspension systems are used for the tractor and the air suspension system for the semi-trailer. These two suspension systems are presented as two sub-models, in which the air suspension system is based on the GENSYS model and integrated into the vehicle model.
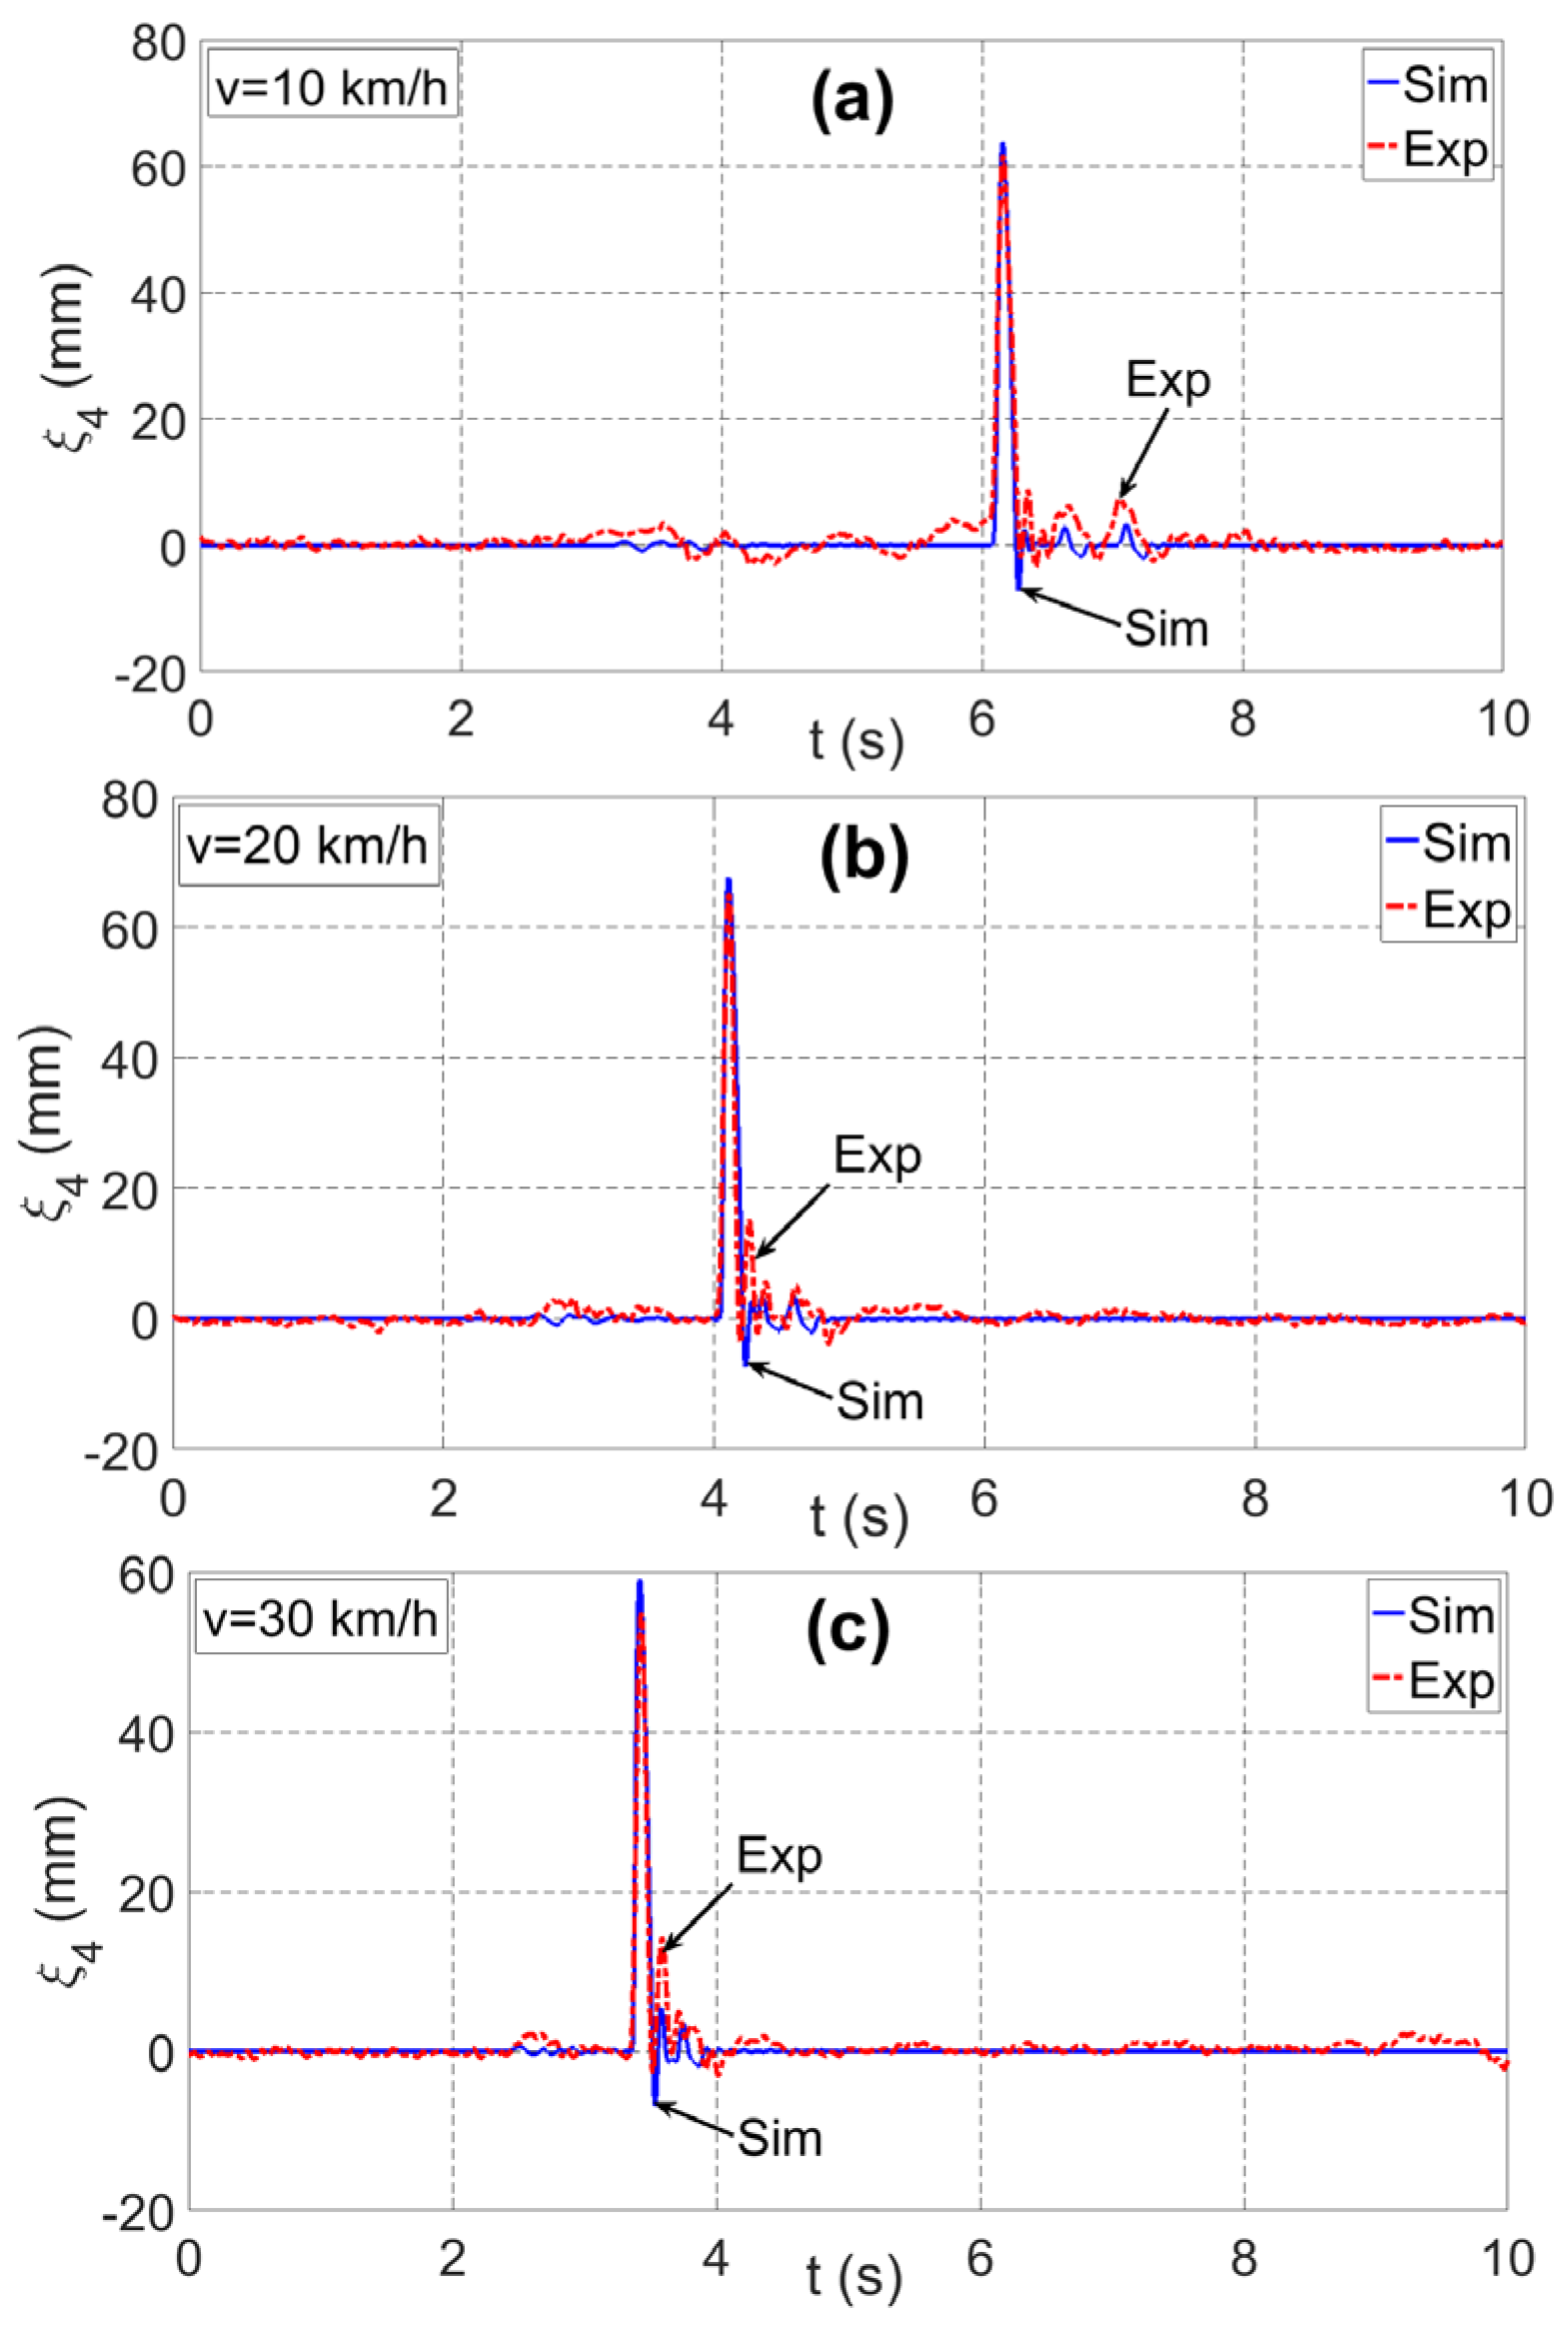
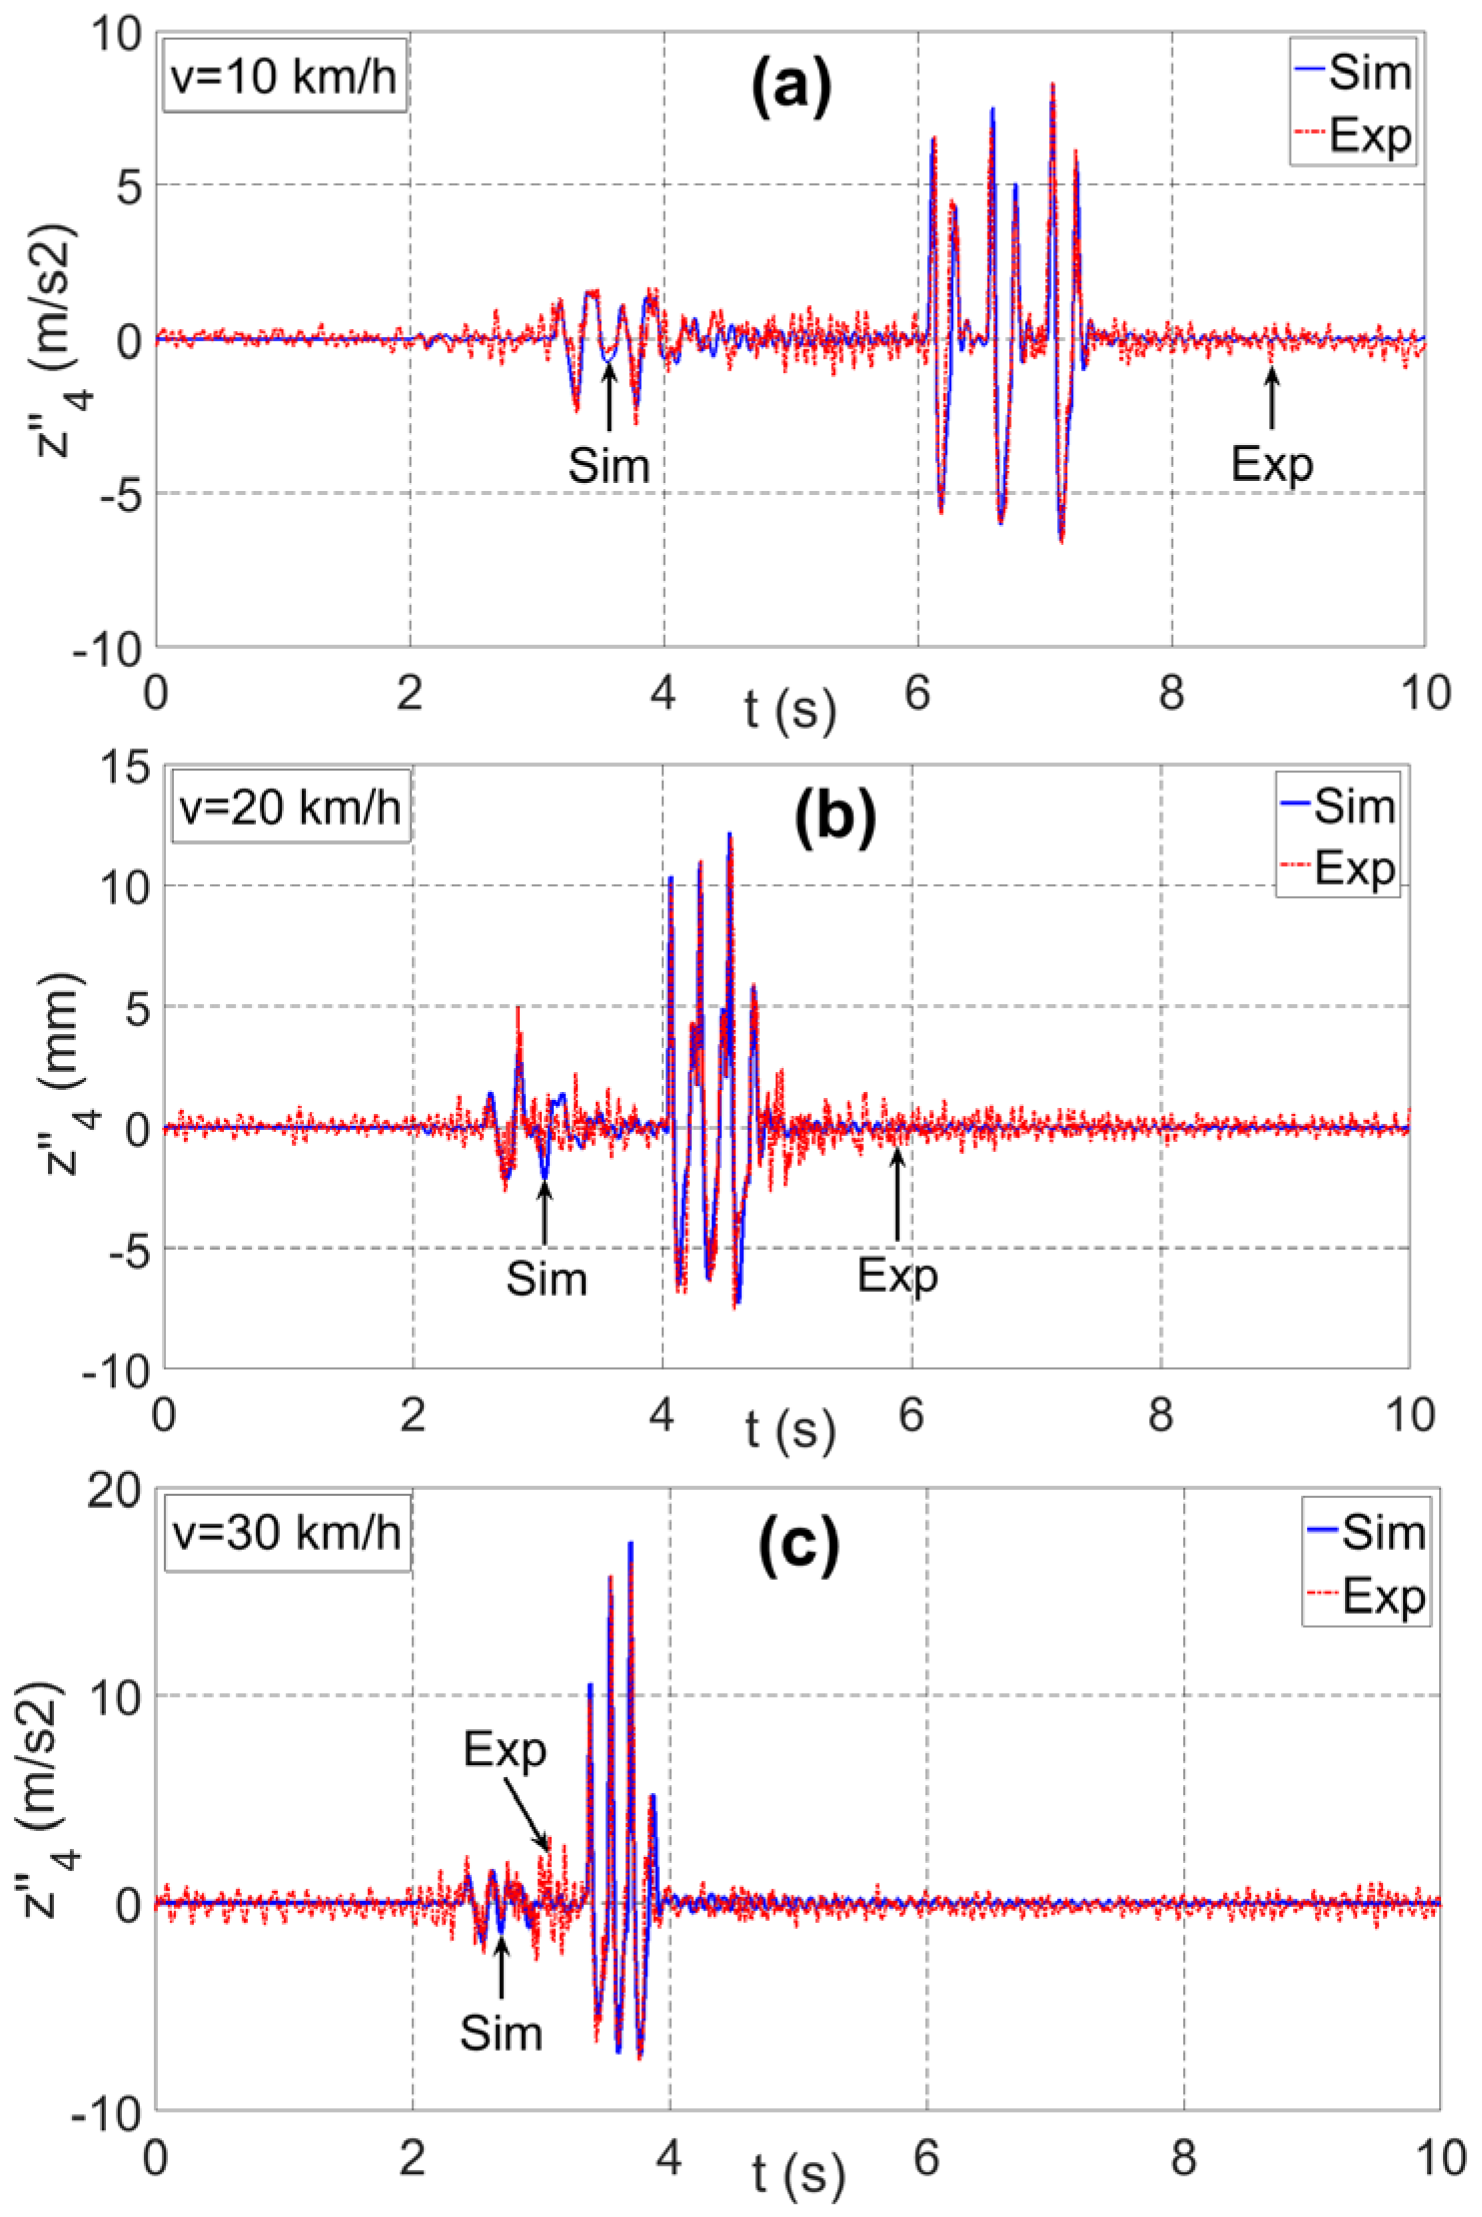
Validate the full model through real experiments using measurement parameters, including: displacement of un-sprung mass at the 4th axle, relative displacement of sprung and un-sprung mass at the 4th axle (suspension space), acceleration of sprung mass at the 4th axle, and movement velocity of the vehicle. The validation results between the research model and the experiments at different velocities showed that the Pearson correlation coefficient is higher than 0.8, and the percent error of the highest value is smaller than 6.3%.
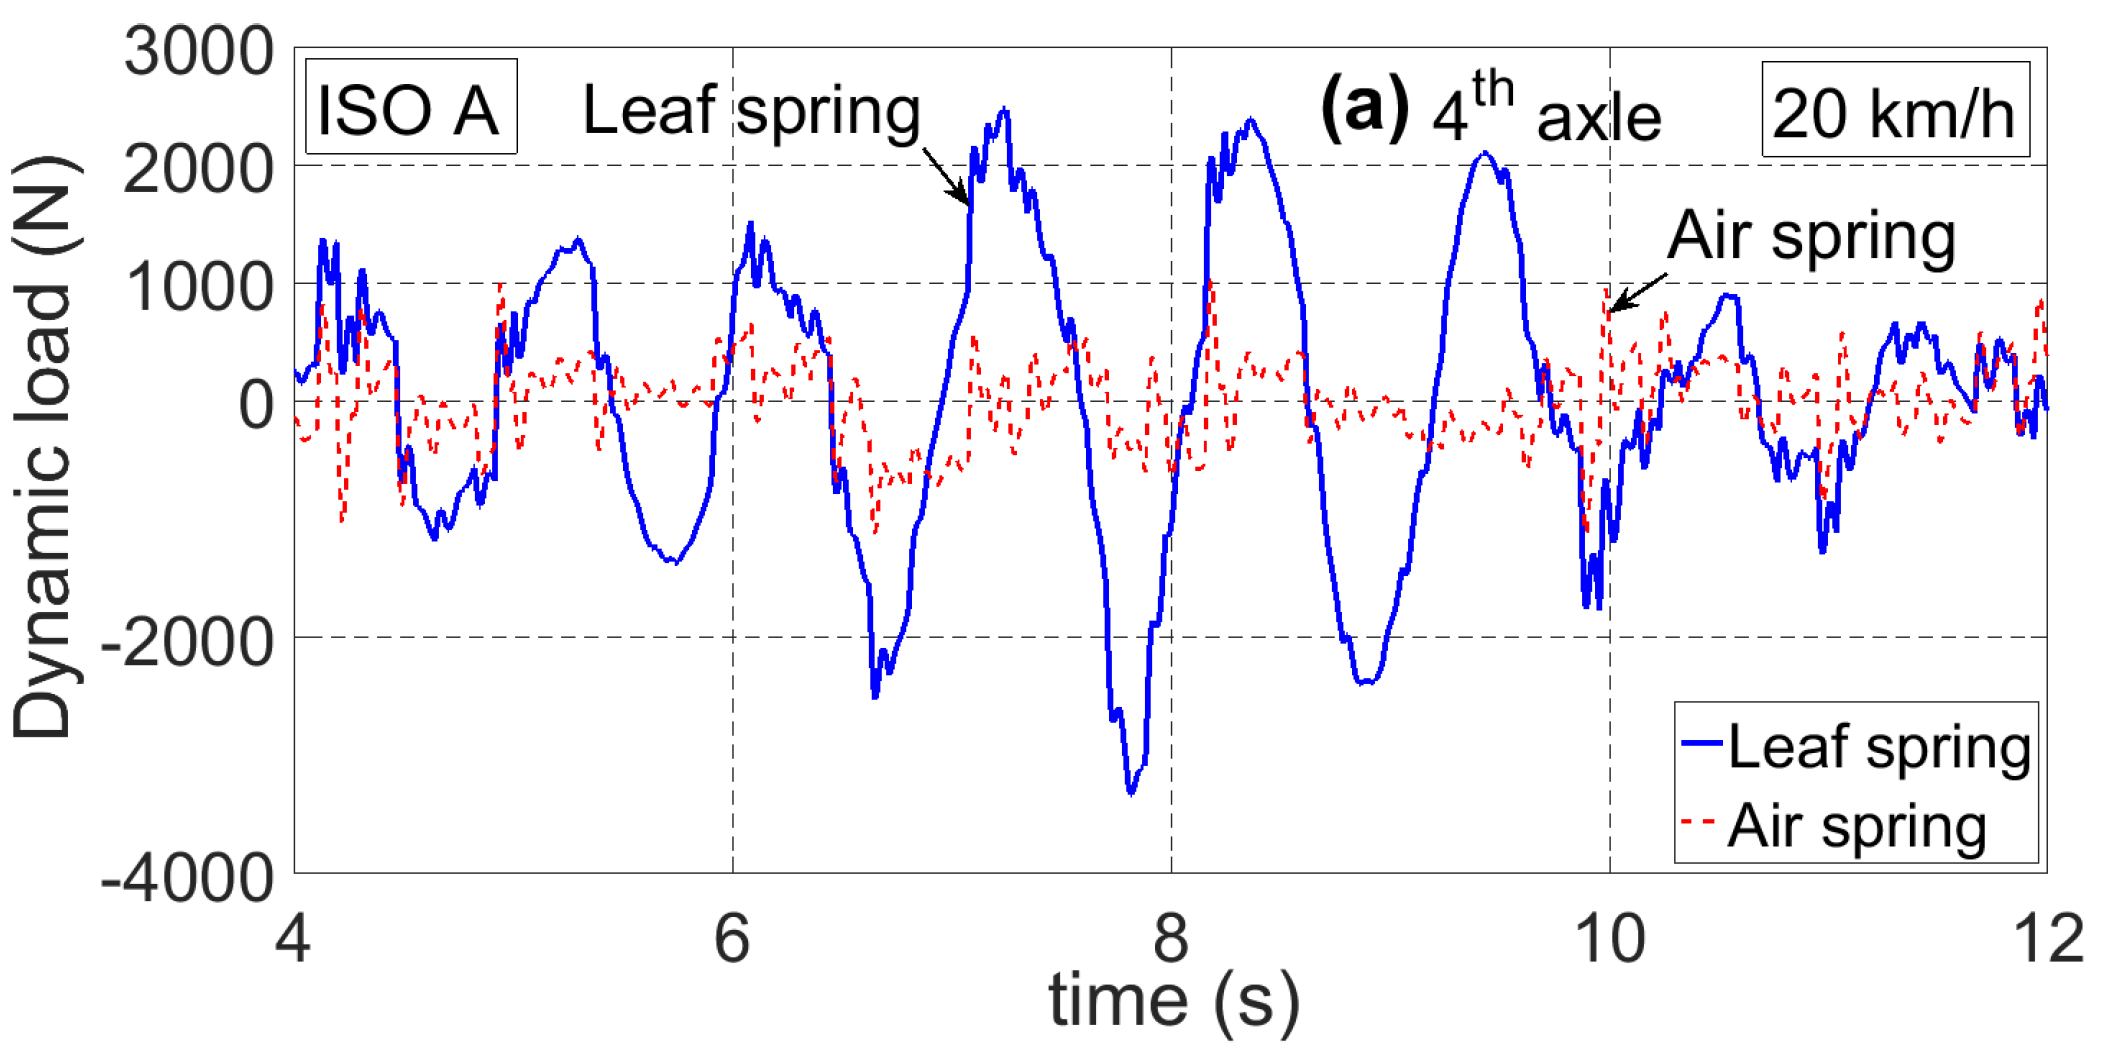
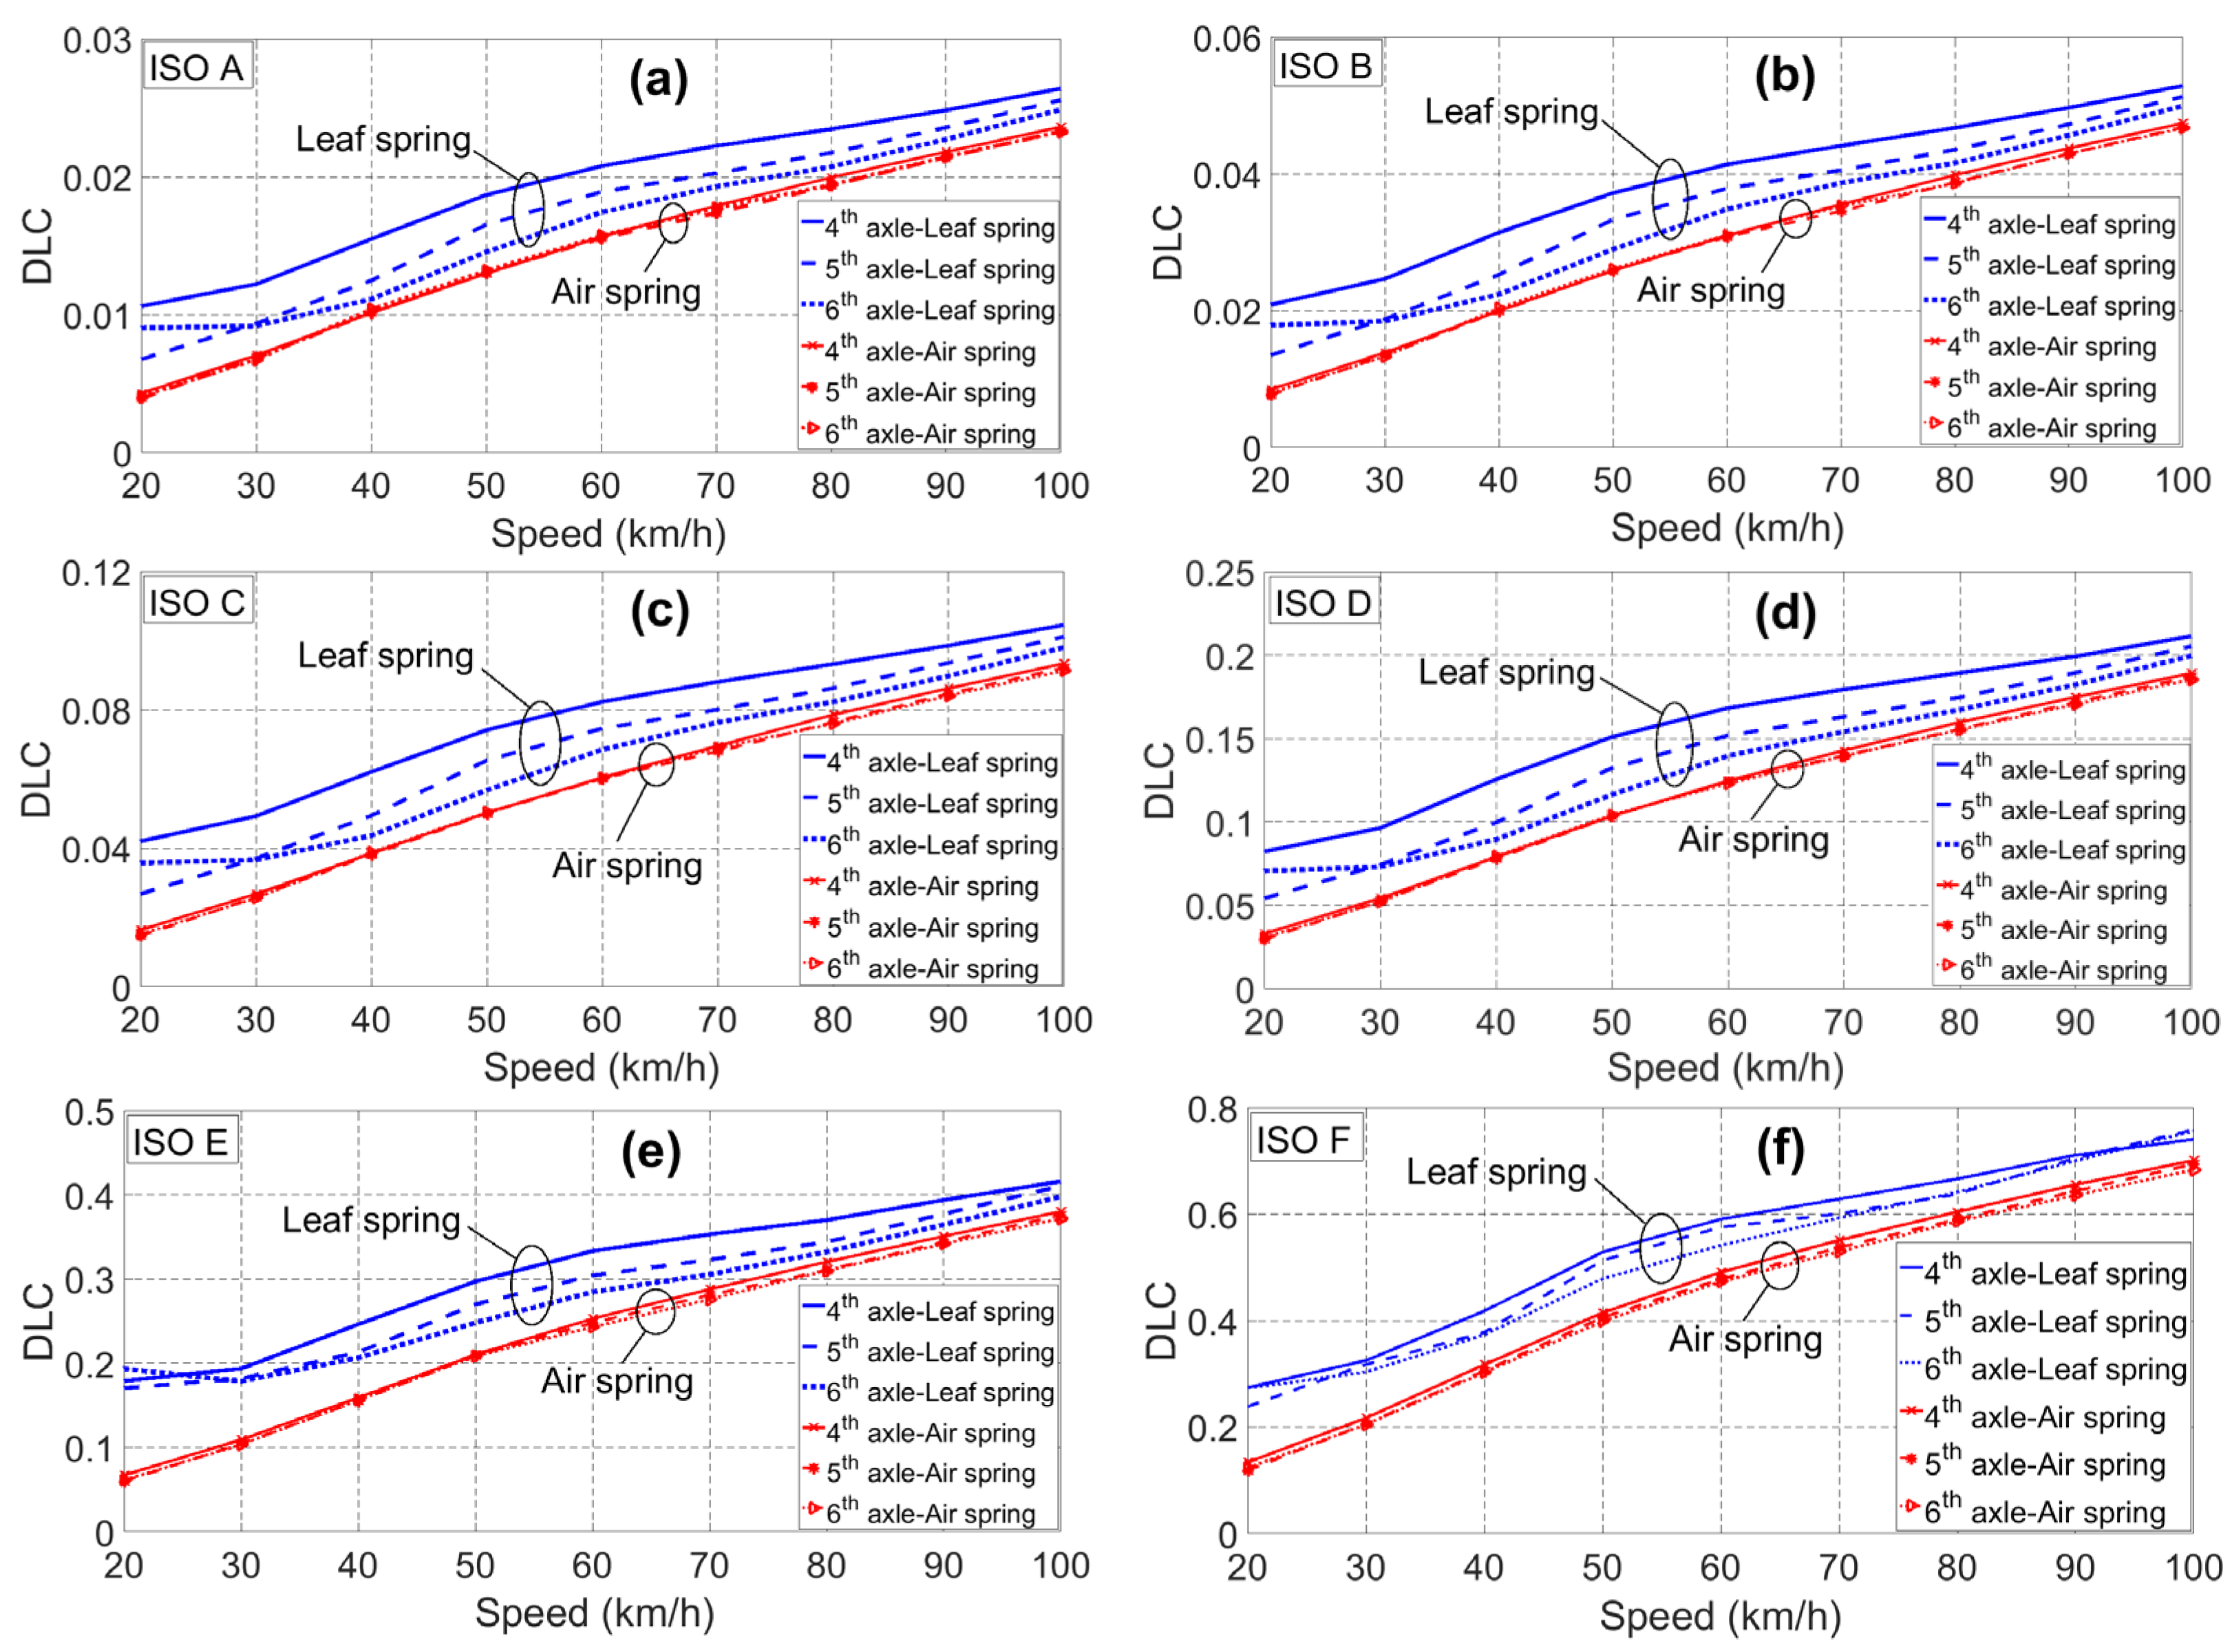
Comparisons of the DLC on the 4th, 5th, and 6th axles of the semi-trailer with the two types of suspension system in diversified driving conditions, including: velocity range from 20 to 100 km/h and random types of roads according to ISO 8608:2016, ranging from road A to road F. Comparative results will show that the air suspension system could, on average, reduce dynamic load by up to 29.3% compared to the conventional semi-trailer using the leaf spring suspension systems.

2. Vehicle Modeling of a Tractor Semi-Trailer

2.1. Full Model of a Tractor Semi-Trailer

A full vertical dynamic model of a tractor semi-trailer (full model) is developed in Figure 1, where the tractor comprises of three axles using the leaf spring system, where the 2nd and 3rd axles are balance axles. The semi-trailer has three axles with two types of suspension systems (leaf spring and air spring), as two sub-models. The full model with leaf spring suspension contains 26 degrees of freedom, whereas the one with the air suspension system has 28 degrees of freedom. Air spring is considered as a high-pressure compressed air reservoir with variable volume. The compression and expansion of the air spring not only changes the volume but also the thermodynamic state of the air inside of the air spring. Therefore, the air spring stiffness is nonlinear; meanwhile, the leaf spring stiffness can be considered with a constant value (described in Section 2.2.1 and Section 2.2.2). Tire stiffness is also considered with a constant value (in Equation (A13) of Appendix A).
The full model was established based on the multi-body system (MBS) method applying the Newton–Euler Equations [24]. The equations for the tractor semi-trailer are defined as follows:
m 1 ( z ¨ 1 x ˙ 1 φ ˙ 1 ) = ( F C 11 + F K 11 + F C 12 + F K 12 ) + ( F C 231 + F K 231 + F C 232 + F K 232 ) F k z 1
J y 1 φ ¨ 1 = j = 1 2 ( l 1 ( F C 1 j + F K 1 j ) + ( l 2 + l 3 2 ) ( F C 23 j + F K 23 j ) ( h 1 r 11 ) ( F x 1 j + F x 2 j + F x 3 j ) ( M 1 j + M 2 j + M 3 j ) ) ( h w 1 h 1 ) F w x 1 + ( h 1 h k 1 ) F k x 1 l k 1 F k z 1
J x 1 β ¨ 1 = w 1 ( F C 11 + F K 11 F C 12 F K 12 ) + w 2 ( F C 231 + F K 231 F C 232 F K 232 ) M T 1 M T 2 M T 3
m 2 ( z ¨ 2 x ˙ 2 φ ˙ 2 ) = j = 1 2 ( F C 4 j + F K 4 j + F C 5 j + F K 5 j + F C 6 j + F K 6 j ) + F k z 2
J y 2 φ ¨ 2 = j = 1 2 ( l 4 ( F C 4 j + F K 4 j ) + l 5 ( F C 5 j + F K 5 j ) + l 6 ( F C 6 j + F K 6 j ) ( h 1 r 41 ) ( F x 4 j + F x 5 j + F x 6 j ) ( M 4 j + M 5 j + M 6 j ) ) ( h w 2 h 2 ) F w x 2 ( h 2 h k 2 ) F k x 2 l k 2 F k z 2
J x 2 β ¨ 2 = i = 4 6 ( w i ( F C i 1 + F K i 1 F C i 2 F K i 2 ) M T i )
{ m A 1 ξ ¨ A 1 = ( F C L 11 + F C L 12 ) ( F C 11 + F K 11 + F C 12 + F K 12 ) J A x 1 β ¨ A 1 = b 1 ( F C L 11 F C L 12 ) + w 1 ( F C 12 + F K 12 F C 11 F K 11 ) + M T 1
{ m A i ξ ¨ A i = ( F C L i 1 + F C L i 2 ) ( F C K i 1 + F C K i 2 ) J A x i β ¨ A i = b i ( F C L i 1 F C L i 2 ) + w i ( F C K i 2 F C K i 1 ) + M T i ( with   i = 2 ; 3 )
{ m A i ξ ¨ A i = ( F C L i 1 + F C L i 2 ) ( F C i 1 + F K i 1 + F C i 2 + F K i 2 ) J A x i β ¨ A i = b i ( F C L i 1 F C L i 2 ) + w i ( F C i 2 + F K i 2 F C i 1 F K i 1 ) + M T i ( with   i = 4 ; 5 ; 6 )
In the Equations (2), (4), and (5), j = 1 for the left wheels and j = 2 for the right wheels. The equations determine the binding force, as specified in Appendix A. The symbols and values of the parameters of the model are presented in Appendix B.

2.2. Suspension Models of Semi-Trailer

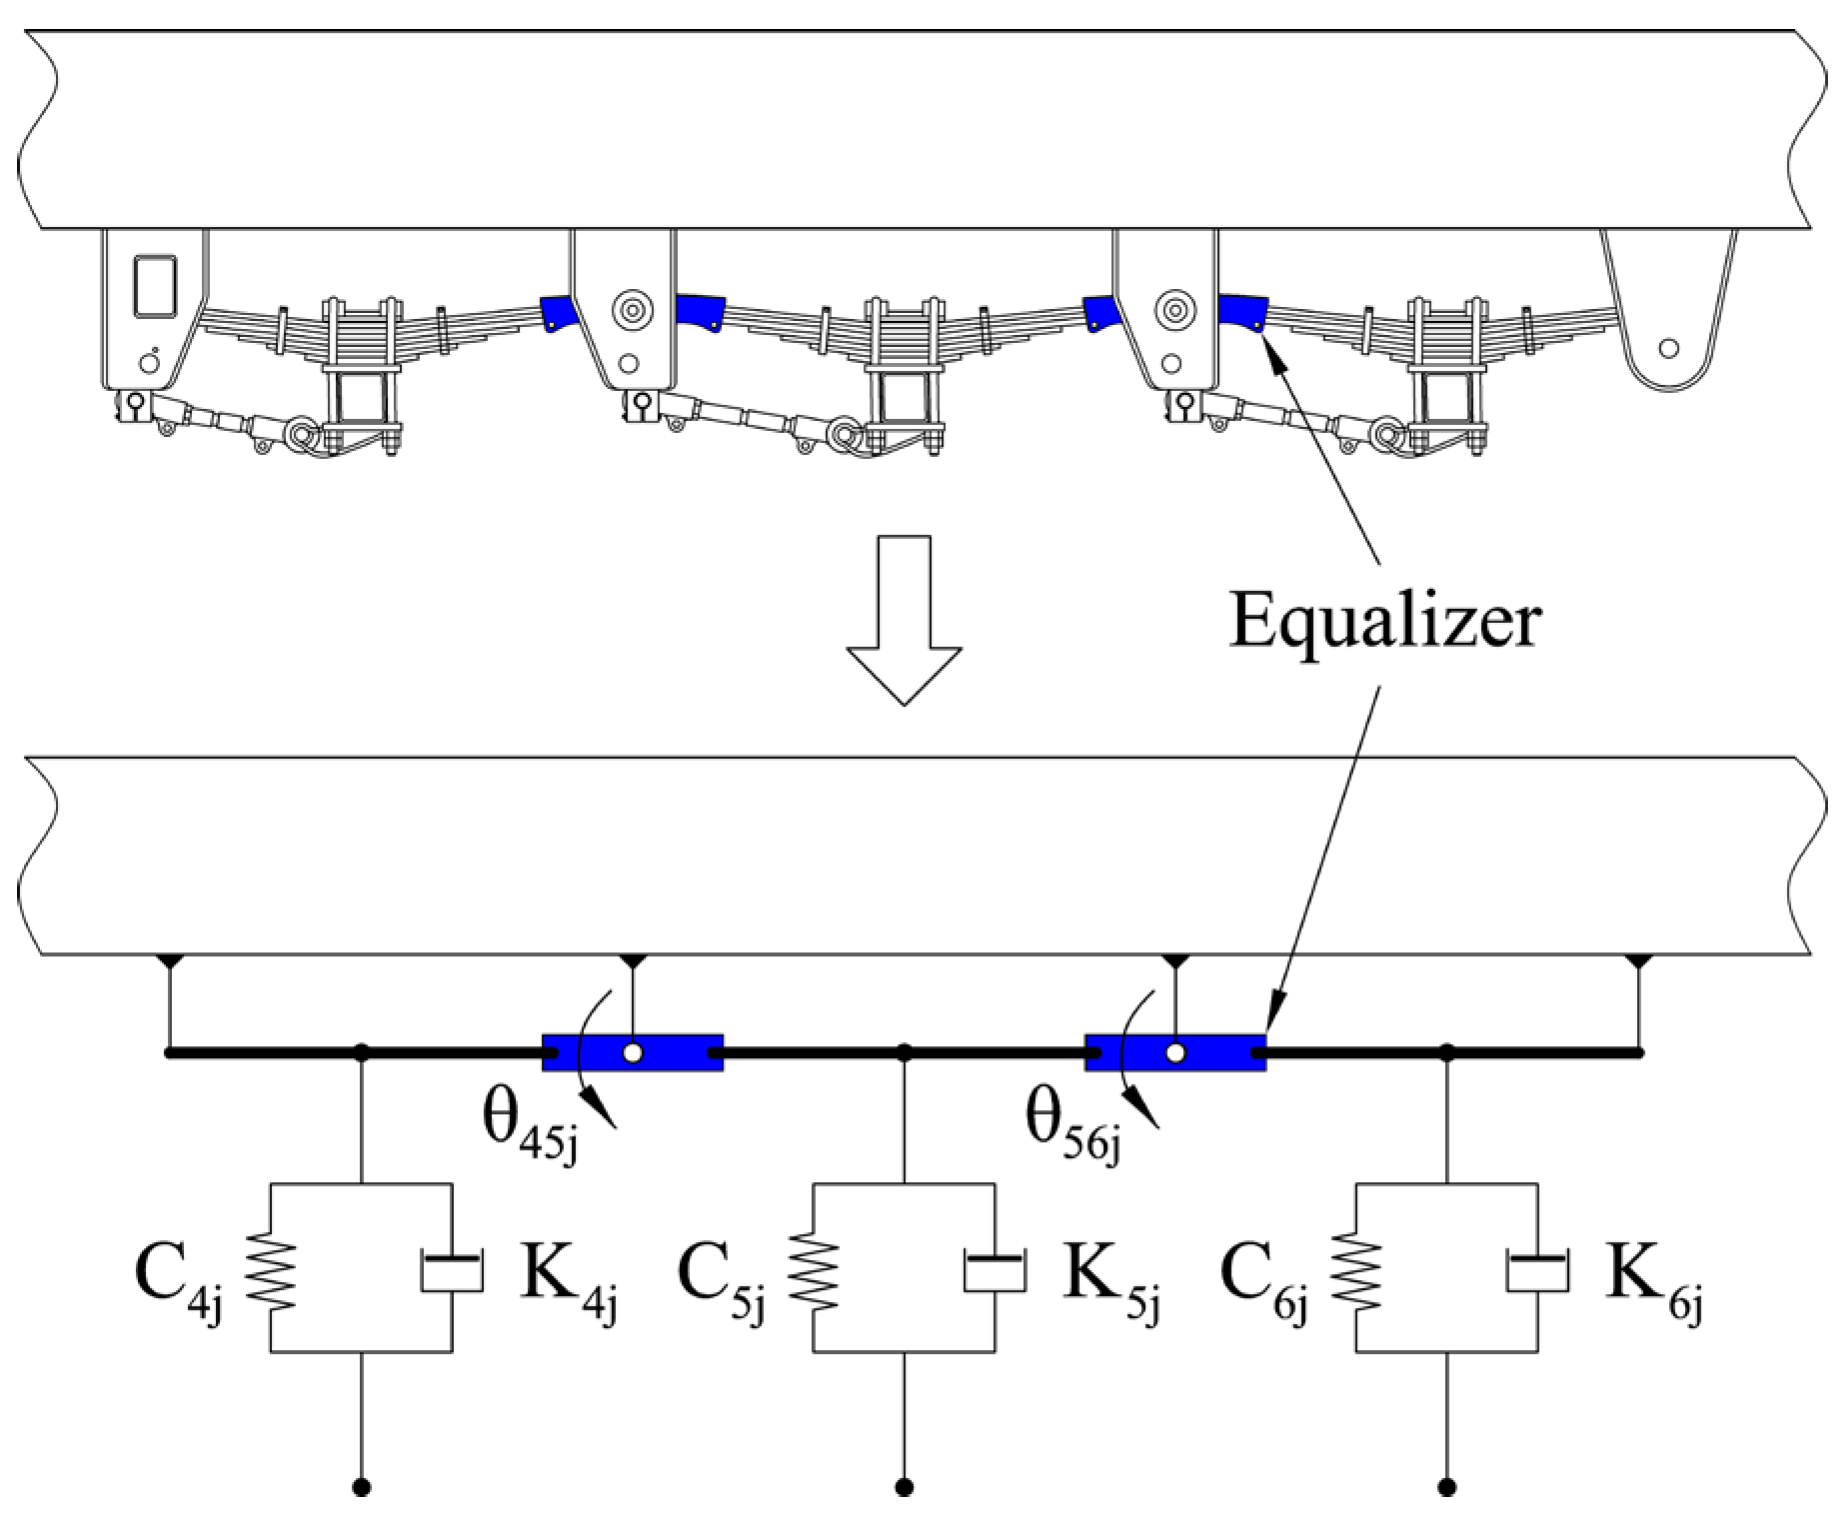
2.2.1. Leaf Spring Model

The leaf spring suspension system for the semi-trailer is a continuously balanced suspension system. The sets of leaf springs on each axle are connected to each other through the longitudinal balance bar (equalizer), as shown in Figure 2. It is this binding mode that creates a dynamic balance of each axle. Hence, it is necessary to express the dynamic equation for this equalizer. The binding force, FCij, of the suspension system while the stiffness of the leaf spring remains constant is:
F C ij = C ij ( ξ Dij z uij )
The dynamic equations of the equalizer in the suspension system are as follows:
J y 45 j θ ¨ 45 j = c 4 ( F C 5 j + F K 5 j F C 4 j F K 4 j )
J y 56 j θ ¨ 56 j = c 4 ( F C 6 j + F K 6 j F C 5 j F K 5 j )
In Equations (10)–(12), i = 1 ÷ 6, j = 1 for the left wheels, and j = 2 for the right wheels.

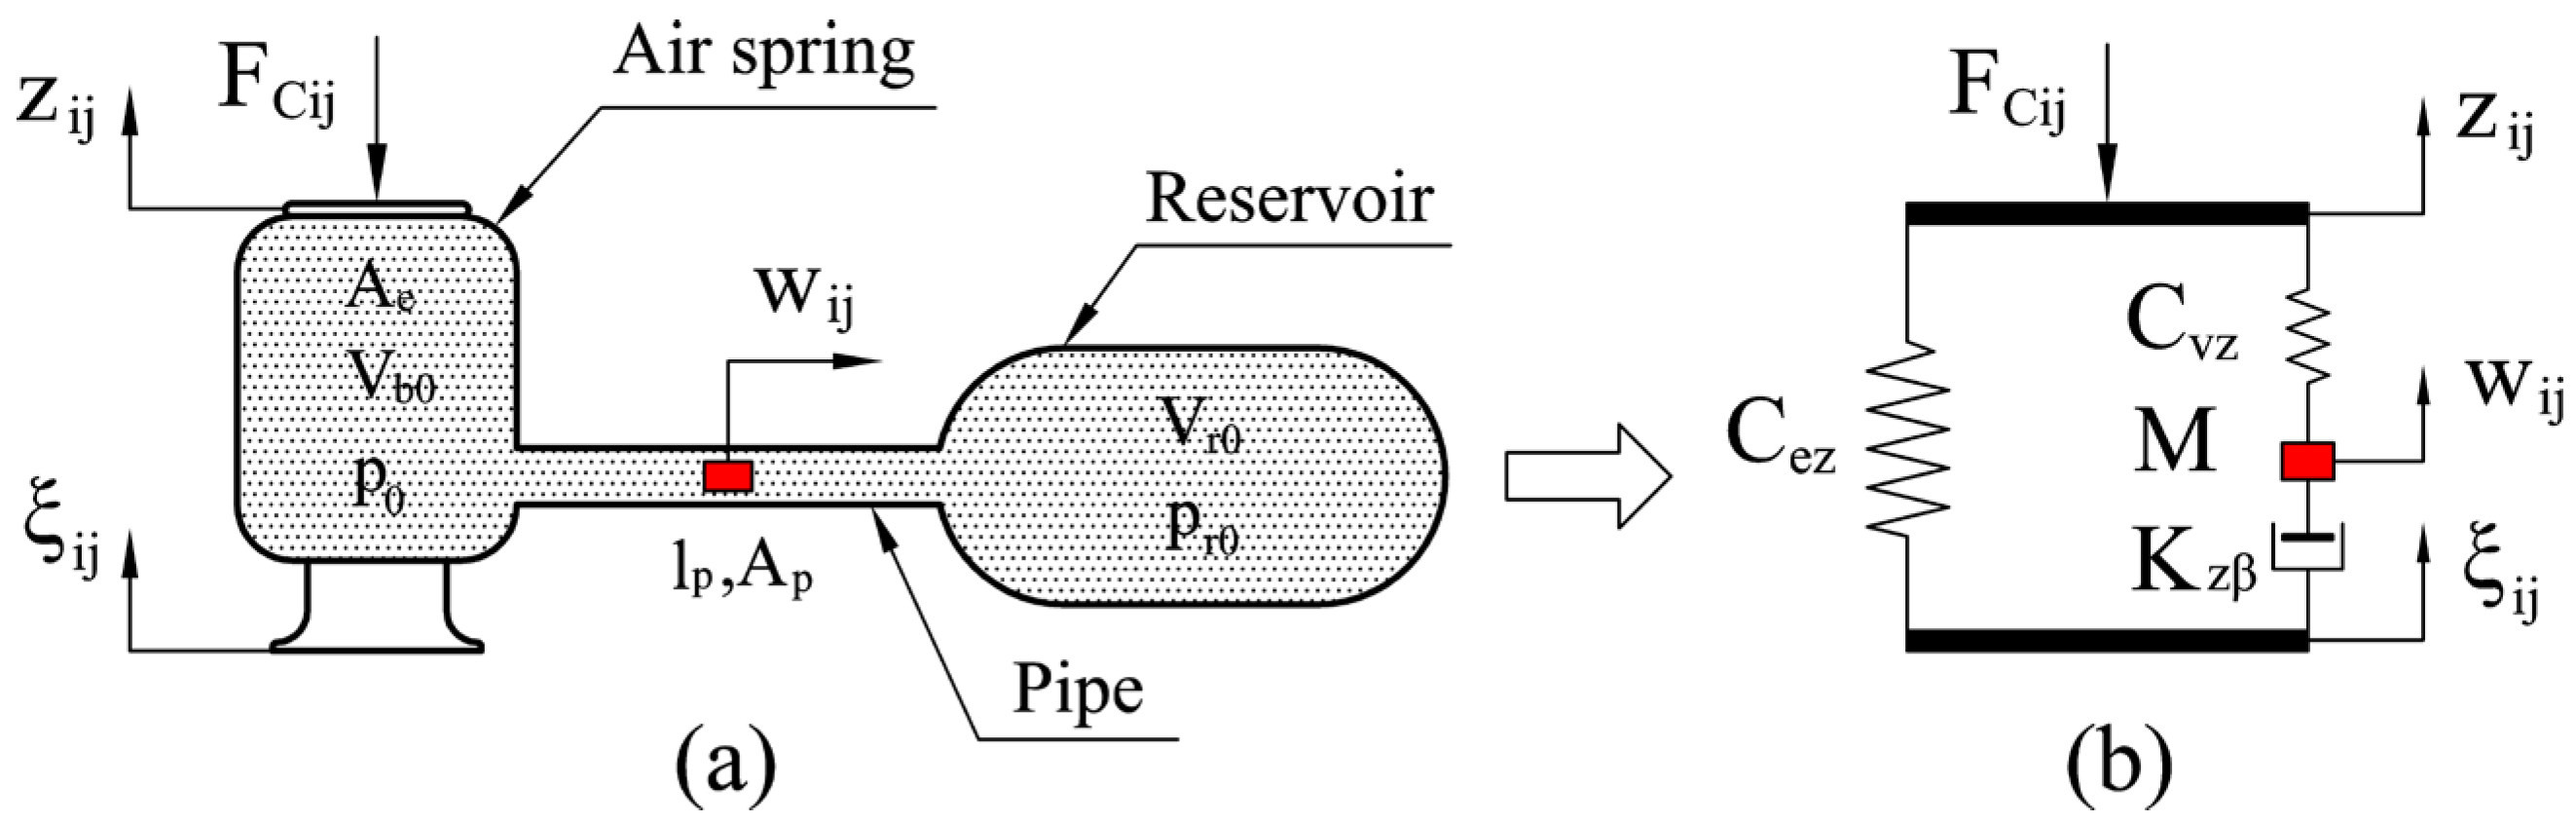
2.2.2. Air Suspension Model

This sections presents the model of the air suspension system based on the deployment of the GENSYS model [25,26], as shown in Figure 3. The structure of the air suspension system semi-trailer comprises of three components: the air spring, the reservoir, and the pipes (Figure 3a). It is modeled according to the GENSYS model with three components: the elastic component (Cez, Cvz), the viscous nonlinear damping component (K), and the mass of the circulating air flow (M), as shown in Figure 3b. In this study, the air suspension model with the air spring element using the GENSYS model was combined with the vehicle model, and therefore the following assumptions were used: ignore the internal friction of the system, and the effect of hysteresis is due to the internal friction.
Displacements zij, ξij, and wij are the displacements of the upper part of the air spring, the lower part of the air spring, and of the air flow inside the pipes, respectively.
The static load is the function of the air in the air spring as follows:
F z t = ( p 0 p a ) A e
Equations to determine the binding force of the air suspension system are as follows:
F C i j = C e z ( ξ i j z ij ) + C v z ( ξ ij z ij w i j )
M w ¨ i j = C v z ( ξ ij z ij w ij ) K z β | w ˙ i j | 2 s i g n ( w ˙ i j )
C e z = p 0 A e 2 n V b 0 + V r 0
C v z = C e z V r 0 V b 0
M = l p A p ρ ( A e A p V r 0 V b 0 + V r 0 ) 2
K z β = K s ( A e A p V r 0 V b 0 + V r 0 ) 3
K s = 1 2 ρ k t A p

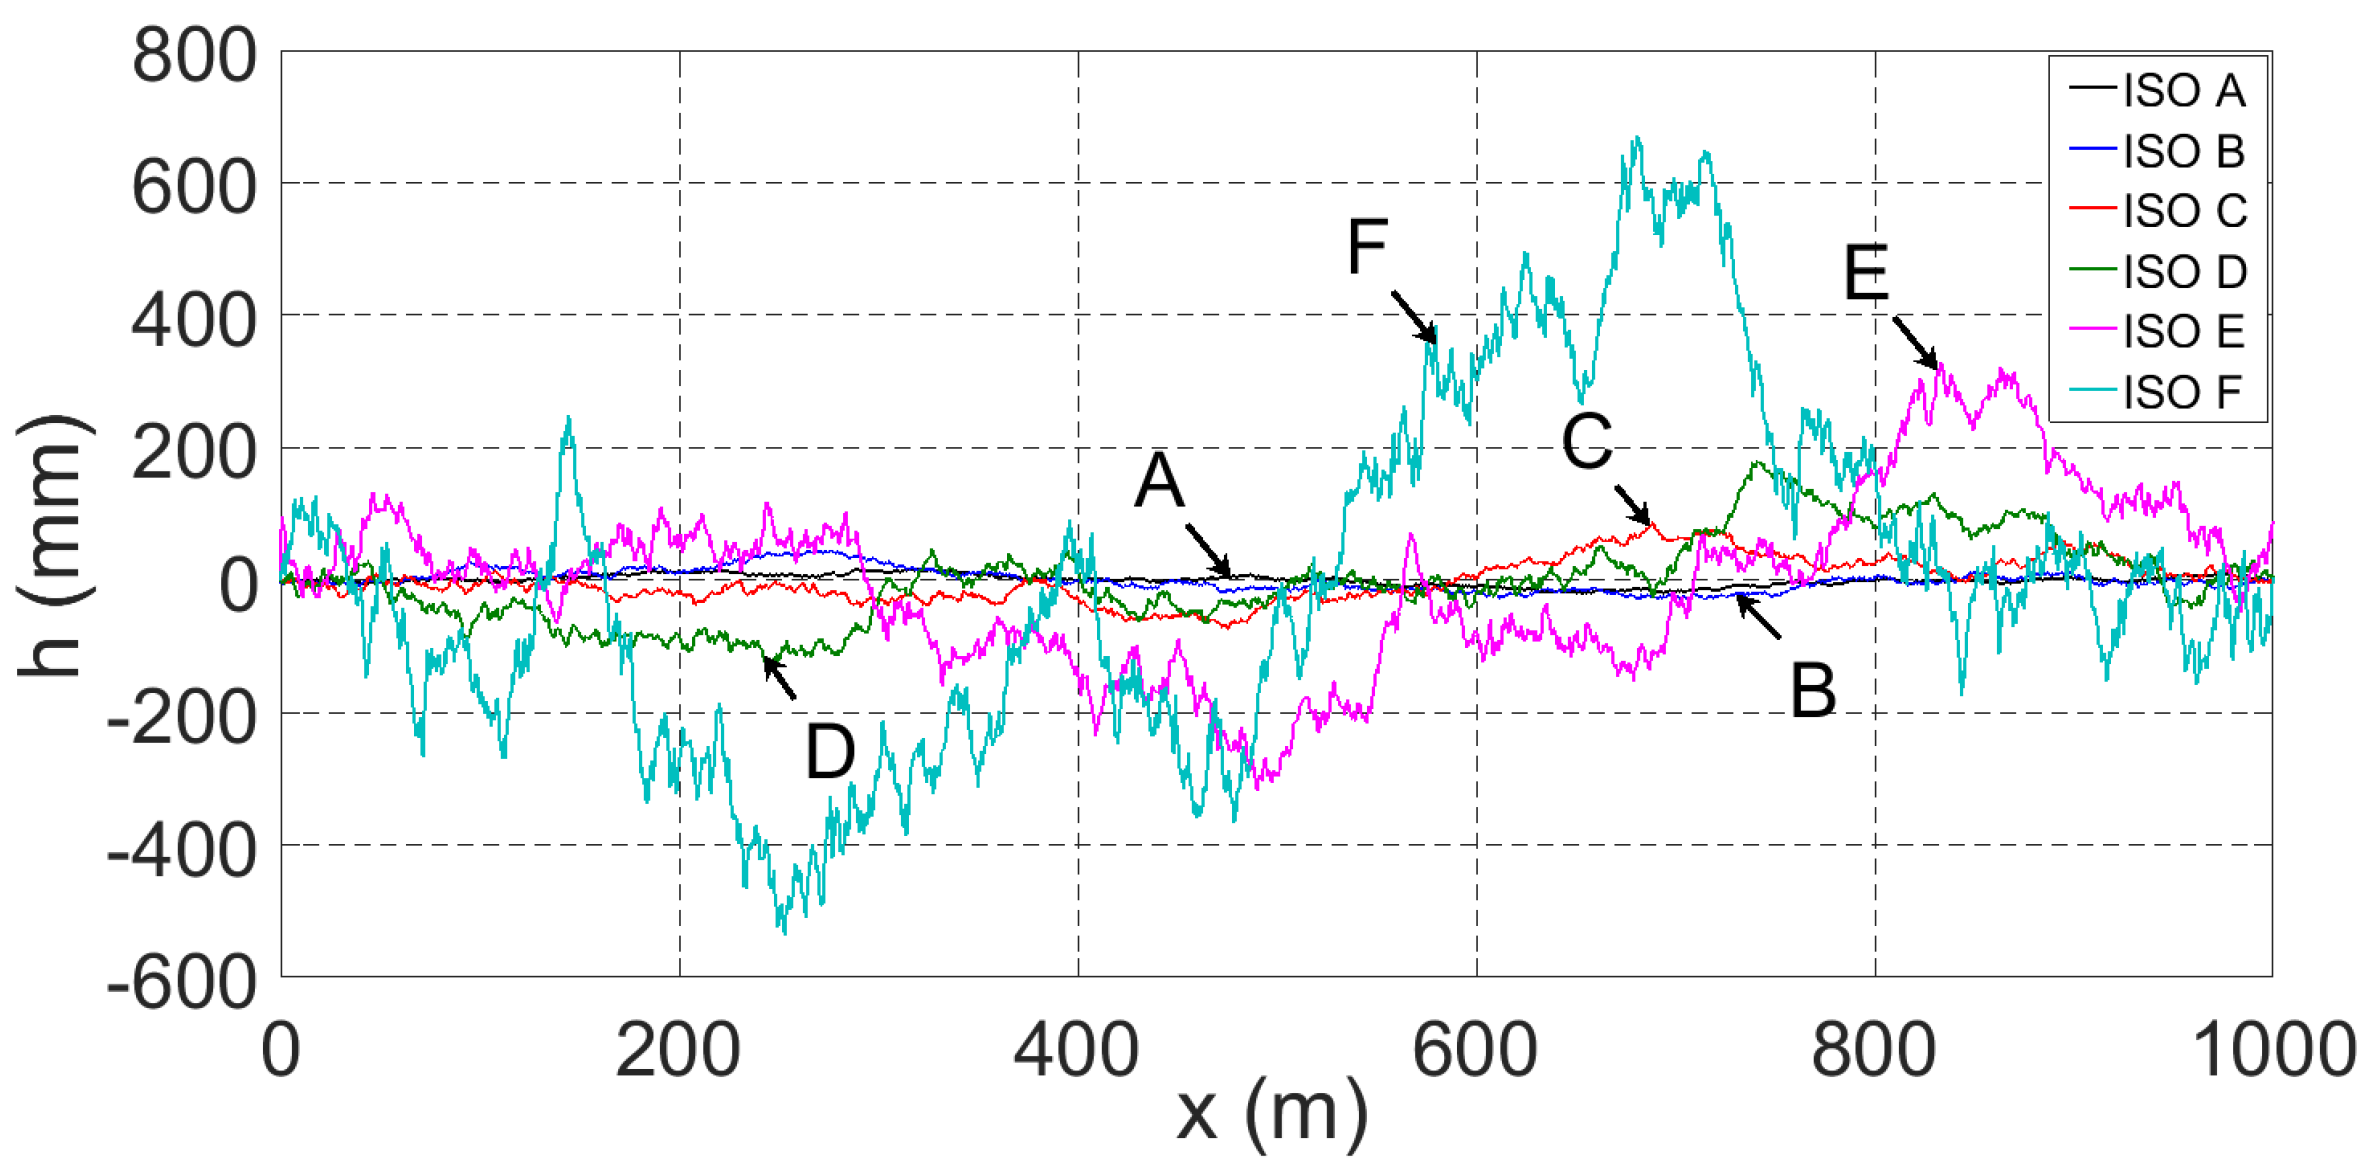
2.3. Random Road Profile

Random road profiles are formulated according to the ISO standard 8608:2016 [27]. By using the sinusoidal method, the height, h(x), of the road profile is determined in the following equation:
h ( x ) = i = 1 N 2 G d ( n i ) Δ n cos ( 2 π i Δ nx + φ i ) ;   Δ n = 1 L
where φi is the random phase taken from [0…2π] (rad), and L is the length of the road section created randomly (m). The random road profiles according to the ISO standard 8608:2016, formulated from Equation (21), are shown in Figure 4.

3. Evaluation Criteria

The dynamic load of the semi-trailer at each vehicle axle is assessed by the dynamic load coefficient (DLC) in Formula (22) [28]. The greater the value of DLC, the higher the dynamic load: for movement safety and road protection, this value is desired to be as small as possible.
D L C i = R M S ( F C L ( i ) ) F z ( t i )
R M S ( F C L ( i ) ) = 1 T 0 T F C L ( i ) 2 d t
Here, FCL(i) is the dynamic load of the wheels on axle i (N), Fz(ti) is the static load of the wheels on axle i in the vertical direction (N), and T is the time of measurement/study (s).
In order to evaluate the extent of the reduction of the dynamic load of a semi-trailer at each axle, Formula (24) is used to compare the efficiency of the air suspension system with that of the leaf spring suspension system:
Δ D L C i ( % ) = D L C i L e a f D L C i A i r D L C i L e a f × 100
where D L C i L e a f , D L C i A i r are the values of the DLC in the models of leaf spring and air suspension systems, in respective axles. In Formulas (22)–(24), i = 4, 5, and 6.

4. Validation of the Tractor Semi-Trailer Model Using Real Experiments

4.1. Experimental Purpose

The experimental purpose was to validate the model by comparing the test parameters and the simulated ones. The experiments were conducted to measure the parameters of the vehicle in the vertical direction, given the bump cosine excitation, at different speeds. The vehicle used in the experiments was a semi-trailer branded DOOSUNG DV-CSKS-400AR-1, linked with a tractor branded HYUNDAI HD700, as shown in Figure 5. The tractor has three axles, with the two rear axles using the leaf suspension system, and the semi-trailer has three axles using the air suspension system.

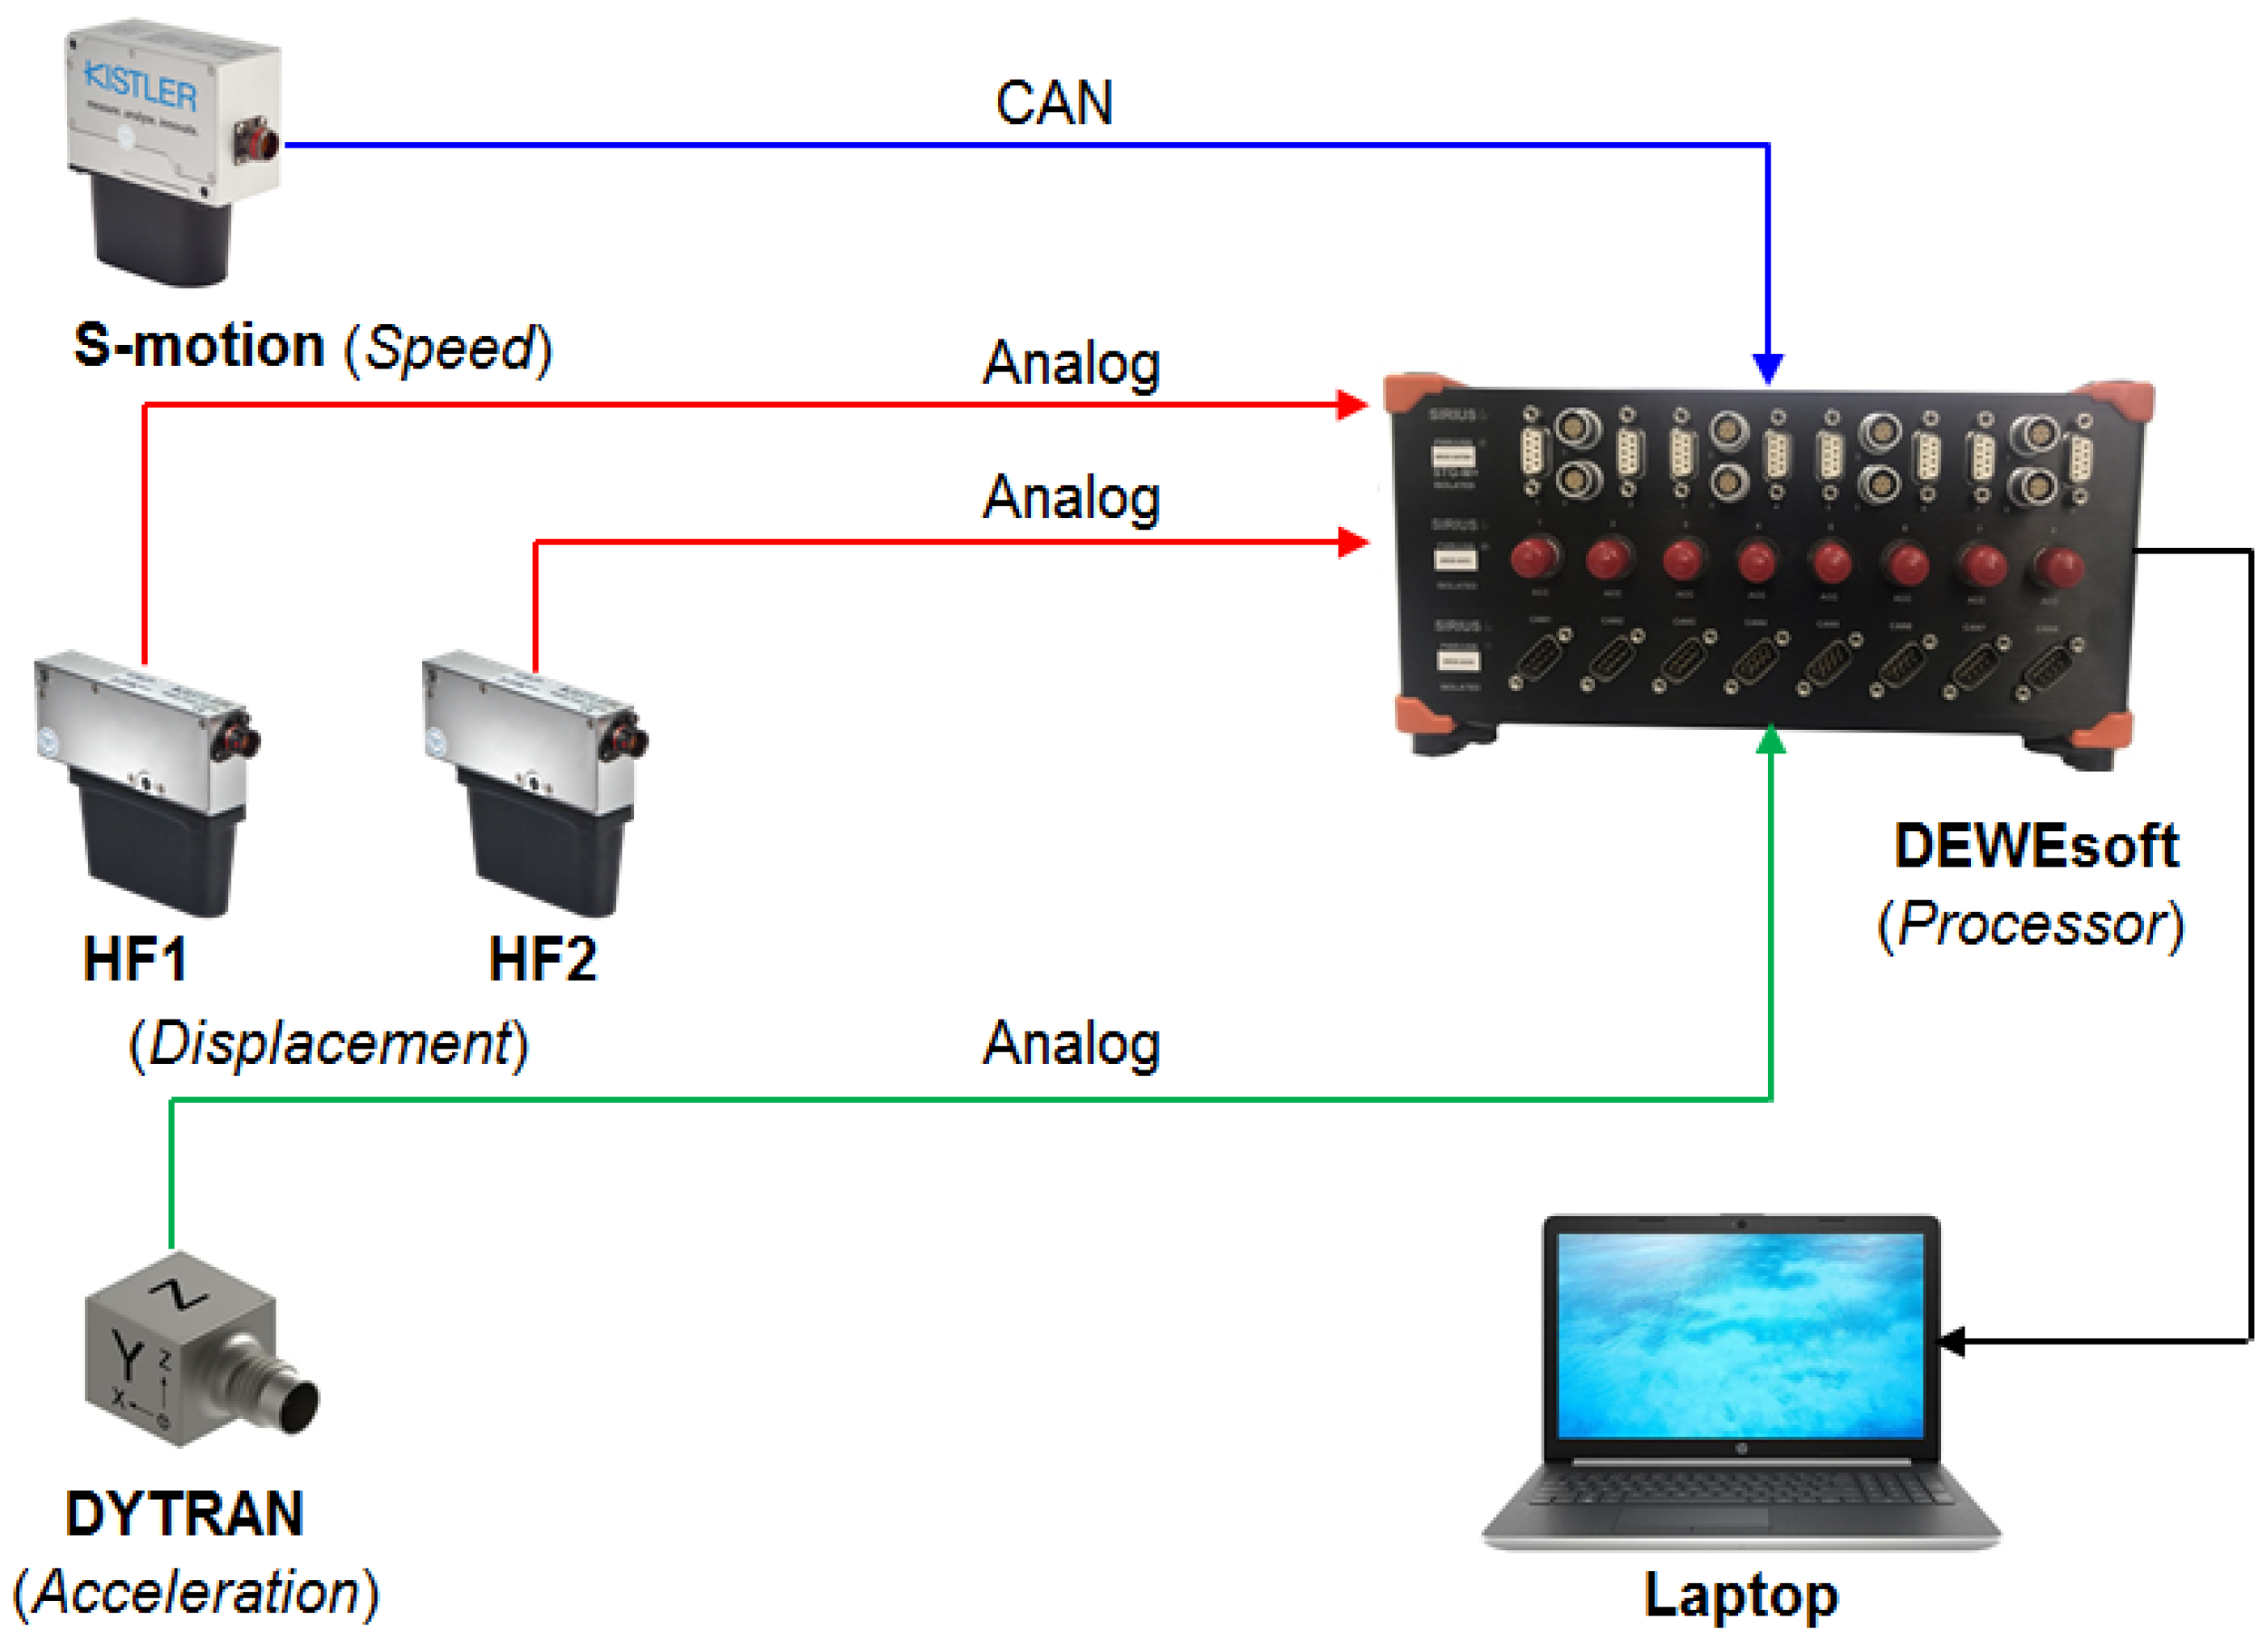
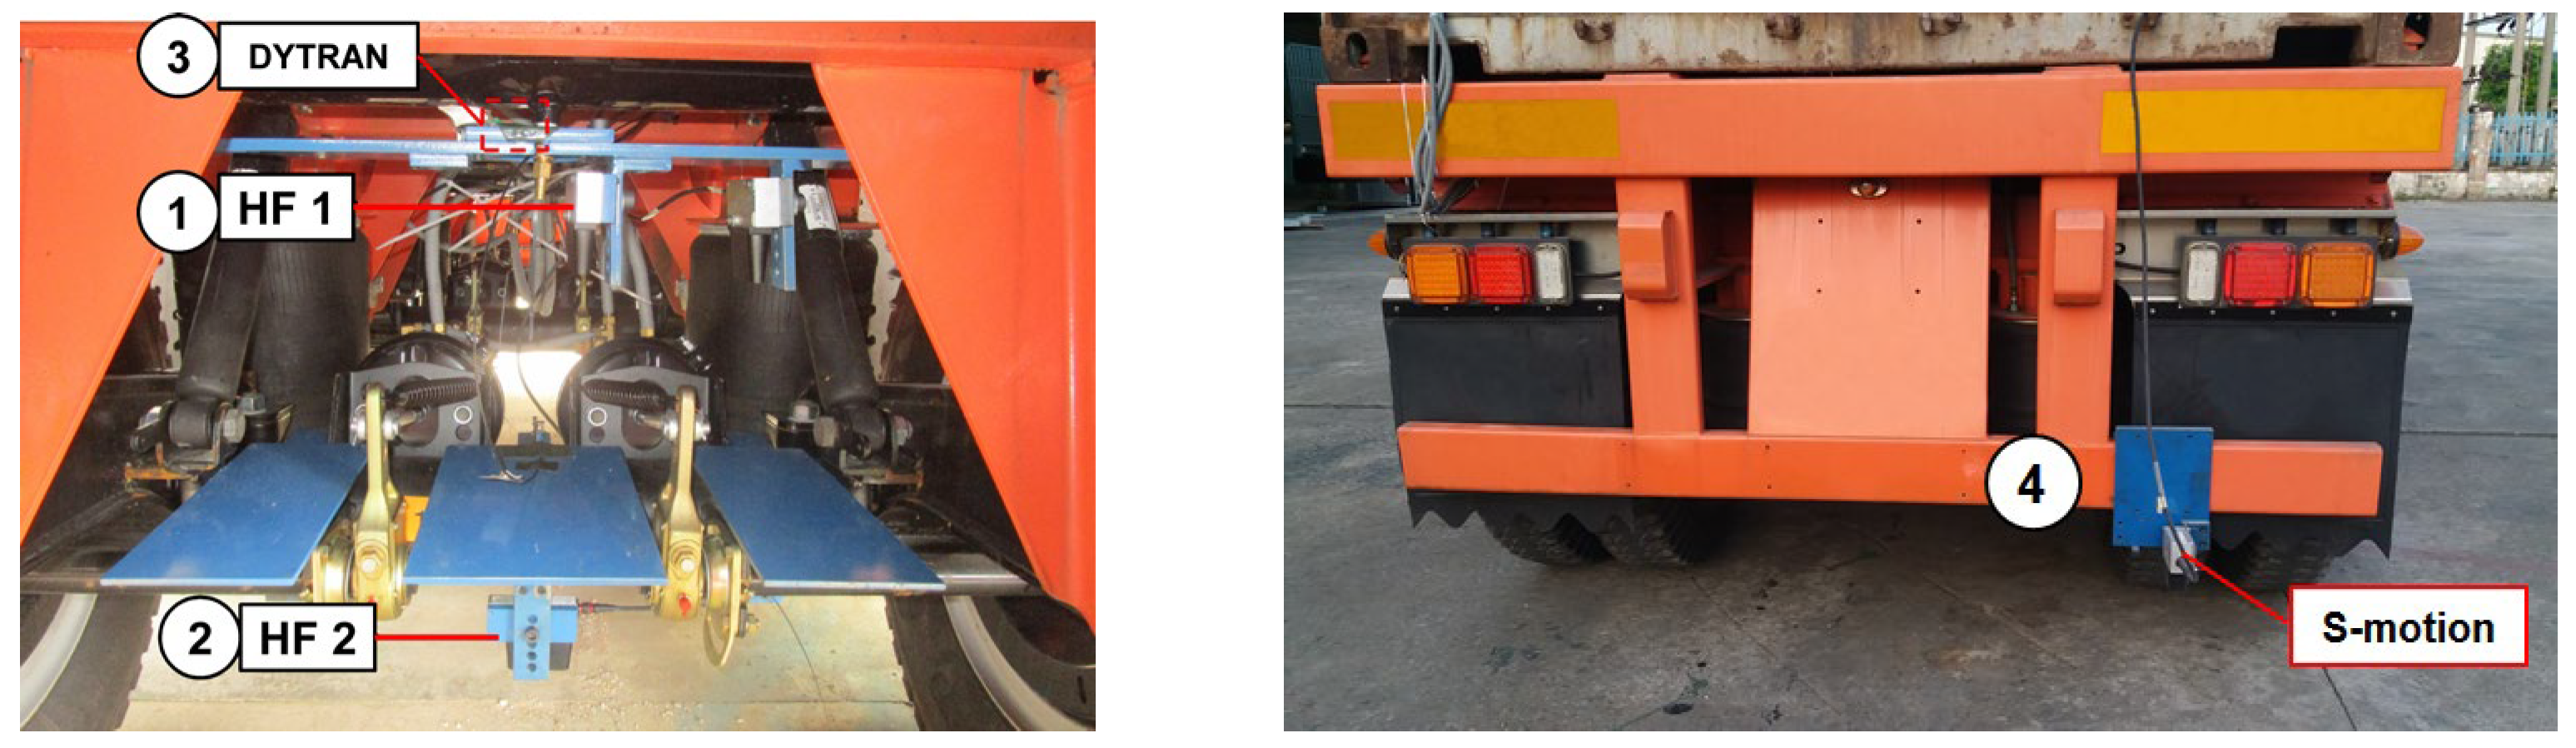
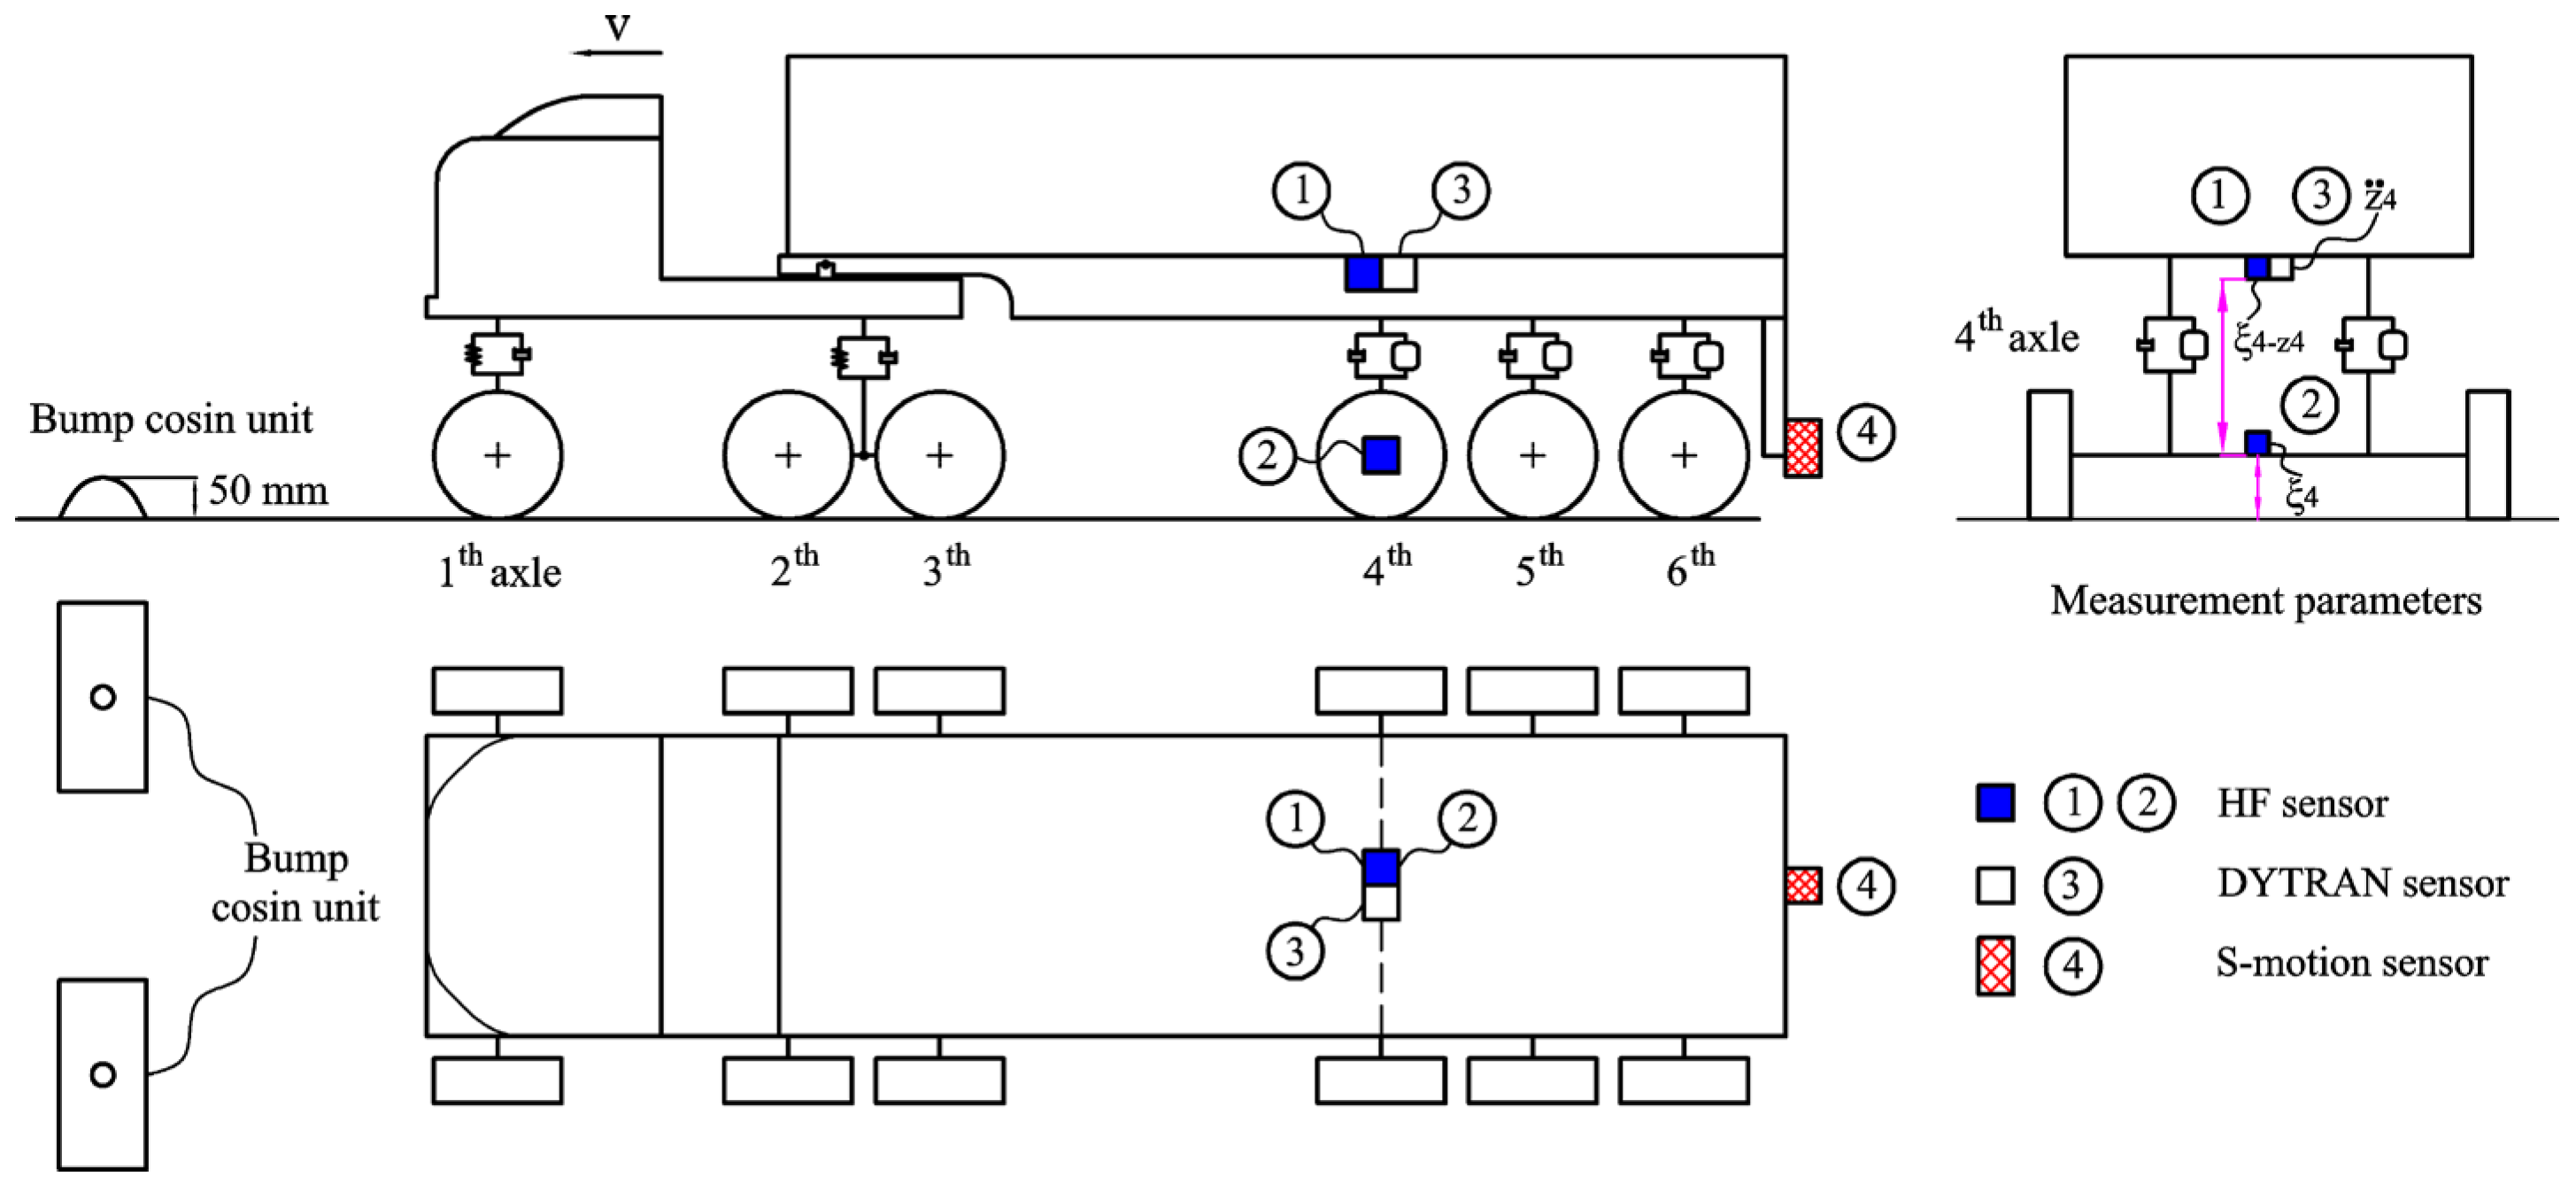
4.2. Equipment for the Experiment

The measurement equipment, comprising of 4 sensors, a signal-processing device, and a computer, connected as shown in Figure 6, specifically included:
Displacement measurement sensor (02 units), HF-750C by Kistler (Ostfildern, Germany).
Acceleration measurement sensor (01 unit), DYTRAN-3263A2 by DYTRAN Instruments, Inc. (Chatsworth, CA, USA).
Vehicle speed sensor (01 chiếc), Correvit S-motion DTI model 2055A by Kistler (Ostfildern, Germany).
Signal processor set, model SIRIUS, a set of 3 types: SIRIUSi-8xSTGM+, SIRIUSi-8xACC, and SIRIUSi-8xCAN, by DEWEsoft (Trbovlje, Slovenia).
A computer for control and displaying measurement results.
Sensors were installed on the vehicle at the location of the 4th axle (on the vehicle axle and frame) and the rear position, as in Figure 7. The HF1 sensor was placed on the vehicle frame for measuring relative displacements between the vehicle frame and the axle. The HF2 sensor was placed underneath the axle for measuring axle displacement, the DYTRAN sensor was placed on the vehicle frame for measuring the acceleration of the vehicle body, and the S-motion sensor was placed at the end of the vehicle for measuring the speed of the vehicle. The S-motion sensor is used to send signals in CAN format, and the remaining sensors are used to send analog signals. Signals from sensors are sent via the processor DEWEsoft for display on the computer screen in real-time mode, allowing visual real-time results.

4.3. The Design of Experiments

A bump cosine unit of 50 mm height was used to stimulate the wheels of the two sides. The vehicle moves steadily at speeds changing in the range of 10, 20, and 30 km/h, as described in Figure 8, and the necessary parameters are summarized in Table 1. The measurement results from the moment of maintained constant speed, until the vehicle passes the bump cosine unit. The results are measured instantaneously and processed via the signal processor.

4.4. Results

The experimental results corresponding to the speeds of 10, 20, and 30 km/h are displayed in Figure 9 and Figure 10. The parameters displayed include: axle vertical displacement and acceleration of the vehicle body at the point of the 4th axle.

4.5. Comparison of the Results in Simulation and Experiments

The correlation coefficient (r) is a statistics ratio that measures the covariance between two variables. The correlation coefficient value ranges from −1 to 1. A value of the correlation coefficient of 0 (or near 0) implies that there is no linear dependency between the two variables; in contrast, correlations equal to −1 or 1 imply that the two variables are absolutely correlated. The value of the correlation coefficient below zero (r < 0) implies that when “x” increases, then “y” decreases (and vice versa, when “x” decreases then “y” increases). If the value of the correlation coefficient is positive (r > 0), it means “x” increases, which can cause “y” to increase, and if “x” decreases, then “y” decreases, accordingly. There are many correlation coefficients, however the most popular is the Pearson correlation coefficient [29], which is defined as follows:
r = i = 1 n ( x i x ¯ ) ( y i y ¯ ) [ i = 1 n ( x i x ¯ ) 2 ] [ i = 1 n ( y i y ¯ ) 2 ]
where xi is the individual spot measurements in the experiment, x ¯ is the average value of all measurement points in the experiment, yi is the value at each point of the simulation, and y ¯ is the average value of all points of the simulation.
The error of the highest value is defined as in Equation (26):
Δ i ( % ) = y i , m a x x i , m a x x i , m a x × 100
where xi,max is the highest value of the experiment and yi,max is the highest value of the simulation.
The comparison results of the simulation and the experiment by Pearson correlation coefficient and the error of the highest value are demonstrated in Table 2 and Table 3.
The errors between simulation and experiment results are shown through the Pearson correlation coefficient and the error of the highest value. Table 2 and Table 3 show that the error of the highest value is 6.23%, and the correlation coefficients are all greater than 0.8, which proves the preciseness of the vertical dynamic model. The parameters are listed in Appendix B, and closely follow the measured parameters in the experiment.

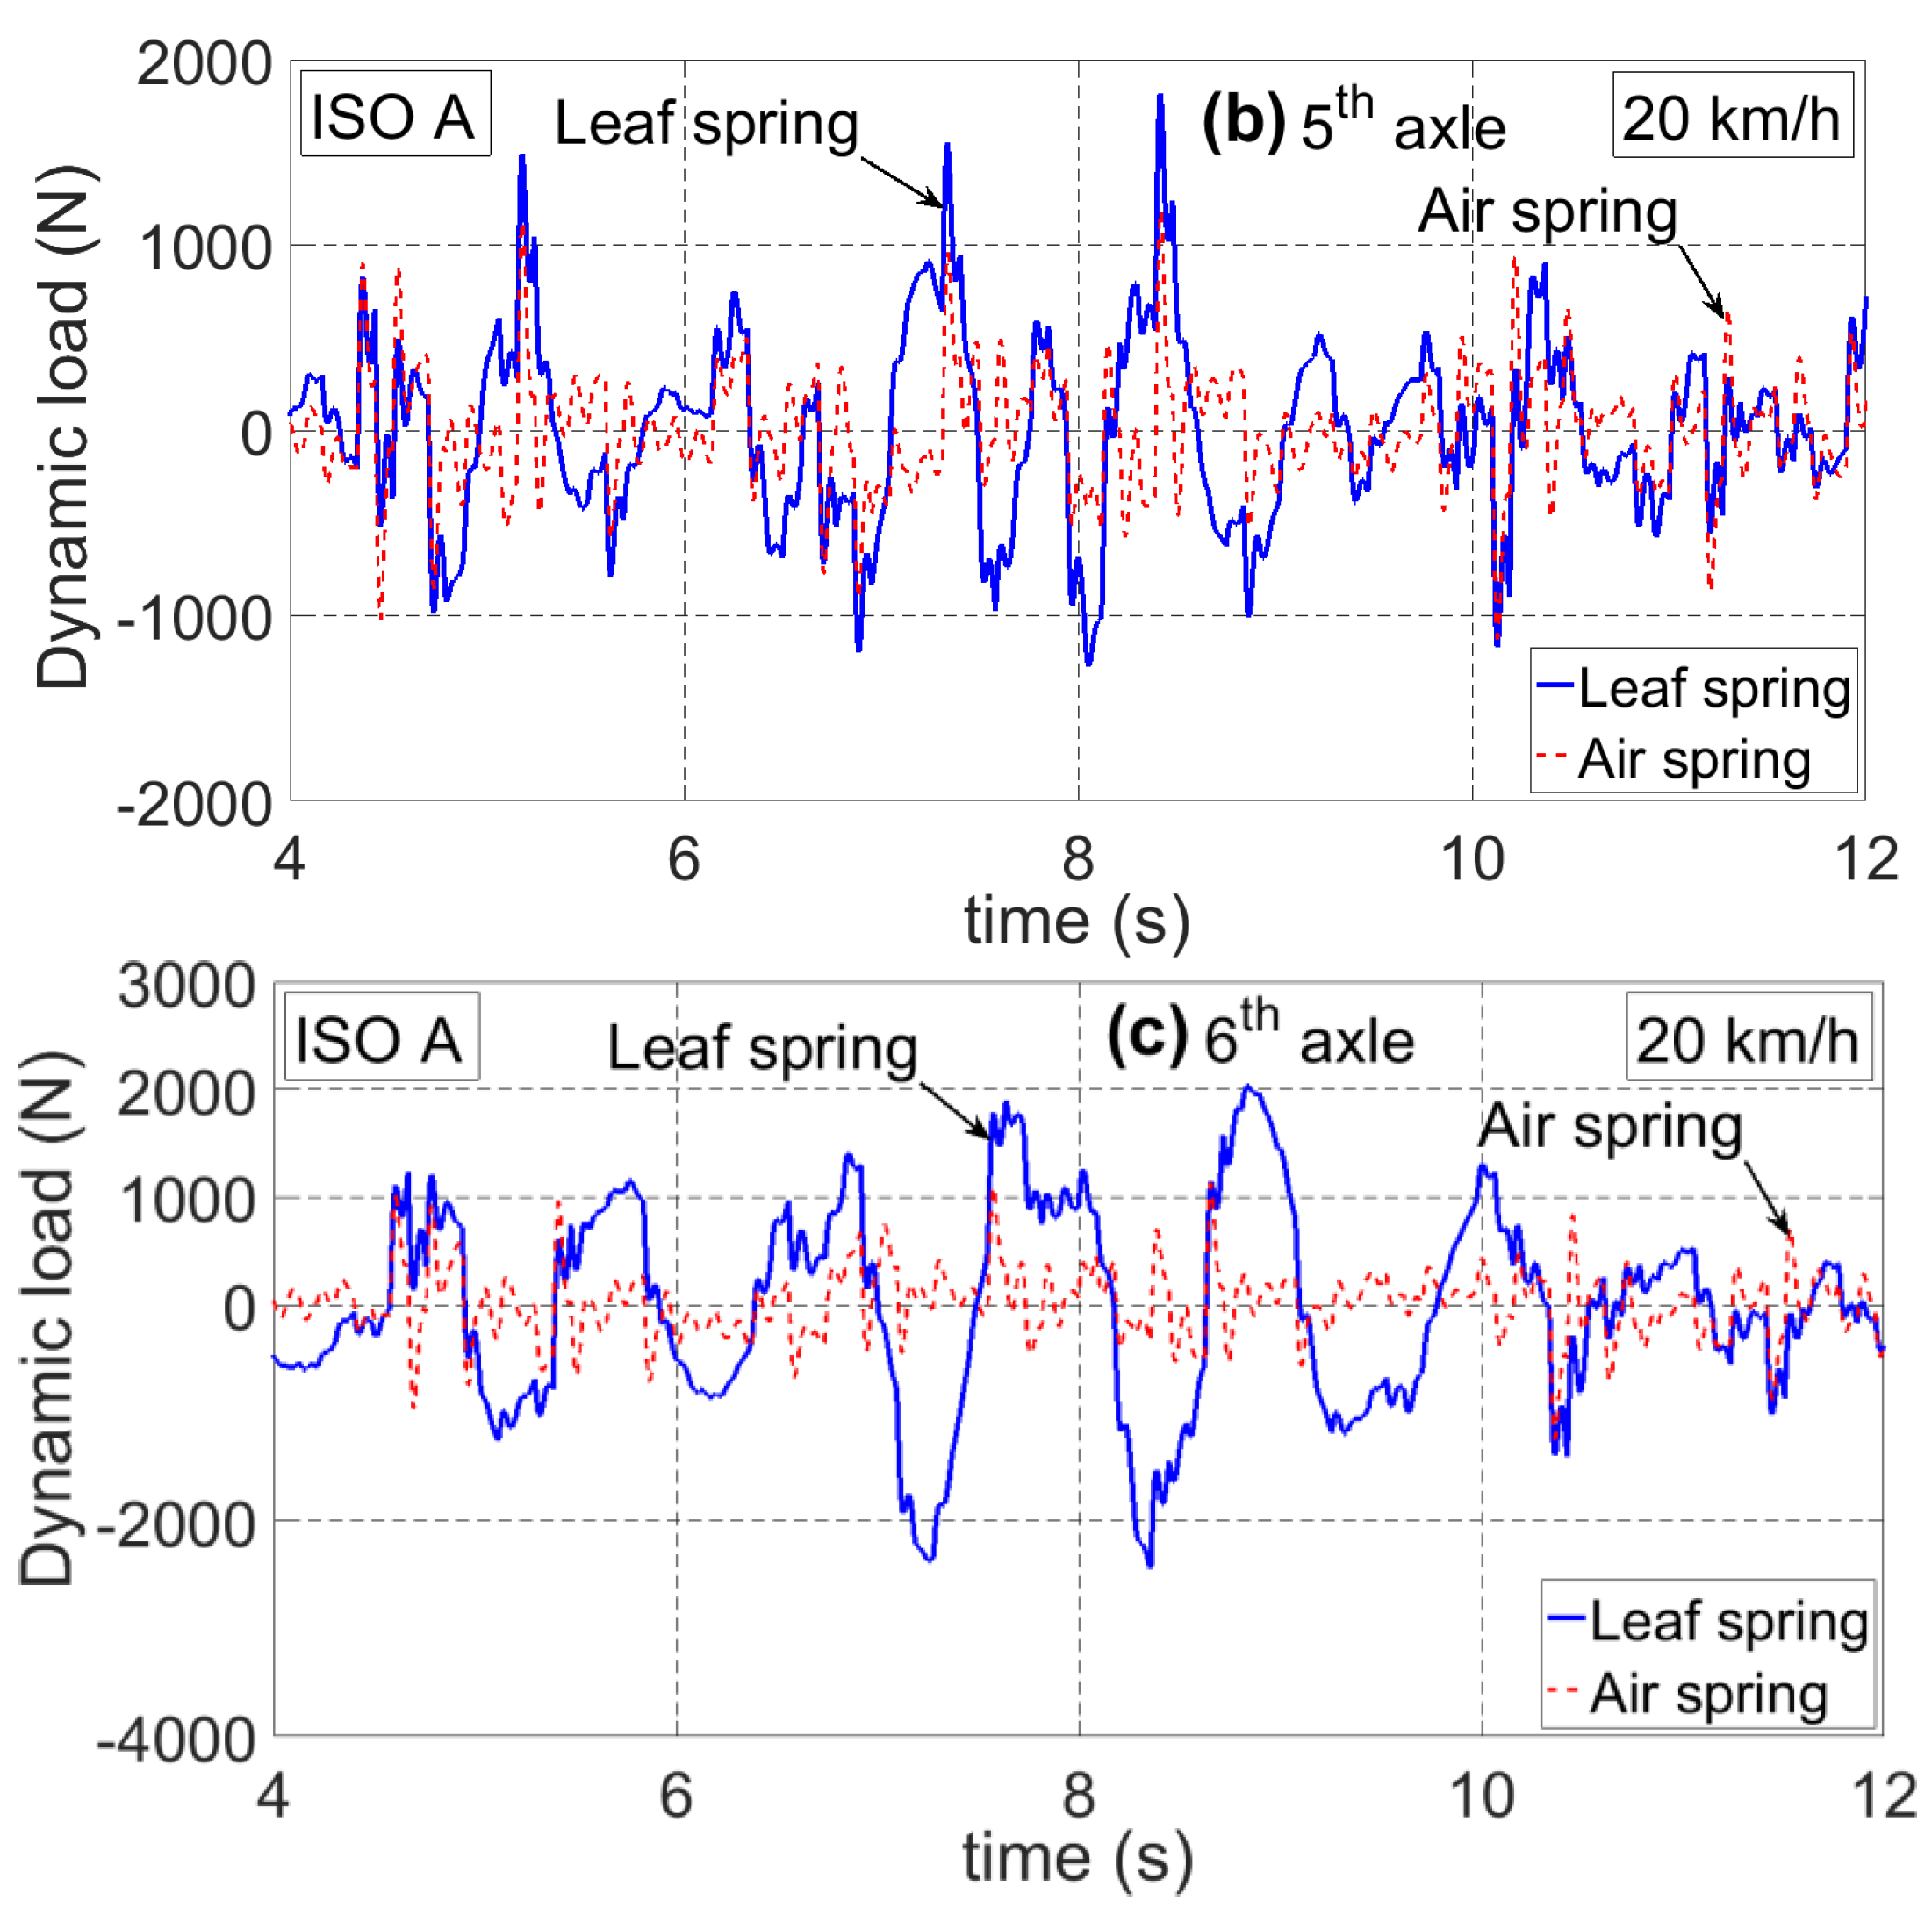
5. Simulation Results Analysis

This study examined the random road types, according to the ISO standard 8608:2016, corresponding to A, B, C, D, E, and F. The tractor semi-trailer’s motions correspond to the changing speed, from 20 to 100 km/h, at the speed interval of 10 km/h. The evaluation results are shown in DLC values.
Dynamic load (FCL) at the 4th, 5th, and 6th axles corresponds to road type A and a speed of 20 km/h, as shown in the time domain in Figure 11. The plots show a smaller dynamic load on all 3 axles of the semi-trailer using the air suspension system than that of the semi-trailer using the leaf spring suspension system.
The comparison of DLC values on the 4th, 5th, and 6th axles of the semi-trailer using both types of suspension systems, responding to each random road type and speed of vehicles from 20 to 100 km/h, can be seen in Figure 12. The semi-trailer in this study is fully loaded.
The results in Figure 12 show that when the road type changes from A to F, the value of DLC on the axles is increased in both cases of vehicles with leaf spring and air suspension systems. However, the comparison of the two types of suspension systems shows that the value of the DLC with the air suspension system is always smaller than that of the DLC with the leaf spring suspension system, on all types of roads and all three axles. The decrease in DLC value was the lowest on road type A and the highest on road type E, which are shown in the values of ΔDLCi (%) in Table 4, Table 5 and Table 6.
At the 4th axle, the extent of the reduction of the DLCDLC4) was from 5.4% to 62.4%, and at the 5th and 6th axles was in the ranges of 7.4–64.9% and 5.5–68.1%, respectively. On the other hand, the extent to which the DLC value changed among the axles of the semi-trailer with the air suspension system is not remarkable (Figure 12), and this is also another advantage of the air suspension system, in terms of sharing of loads among axles.
The DLC values of both types of suspension system are shown in Table 4, Table 5 and Table 6 and are summarized as follows:
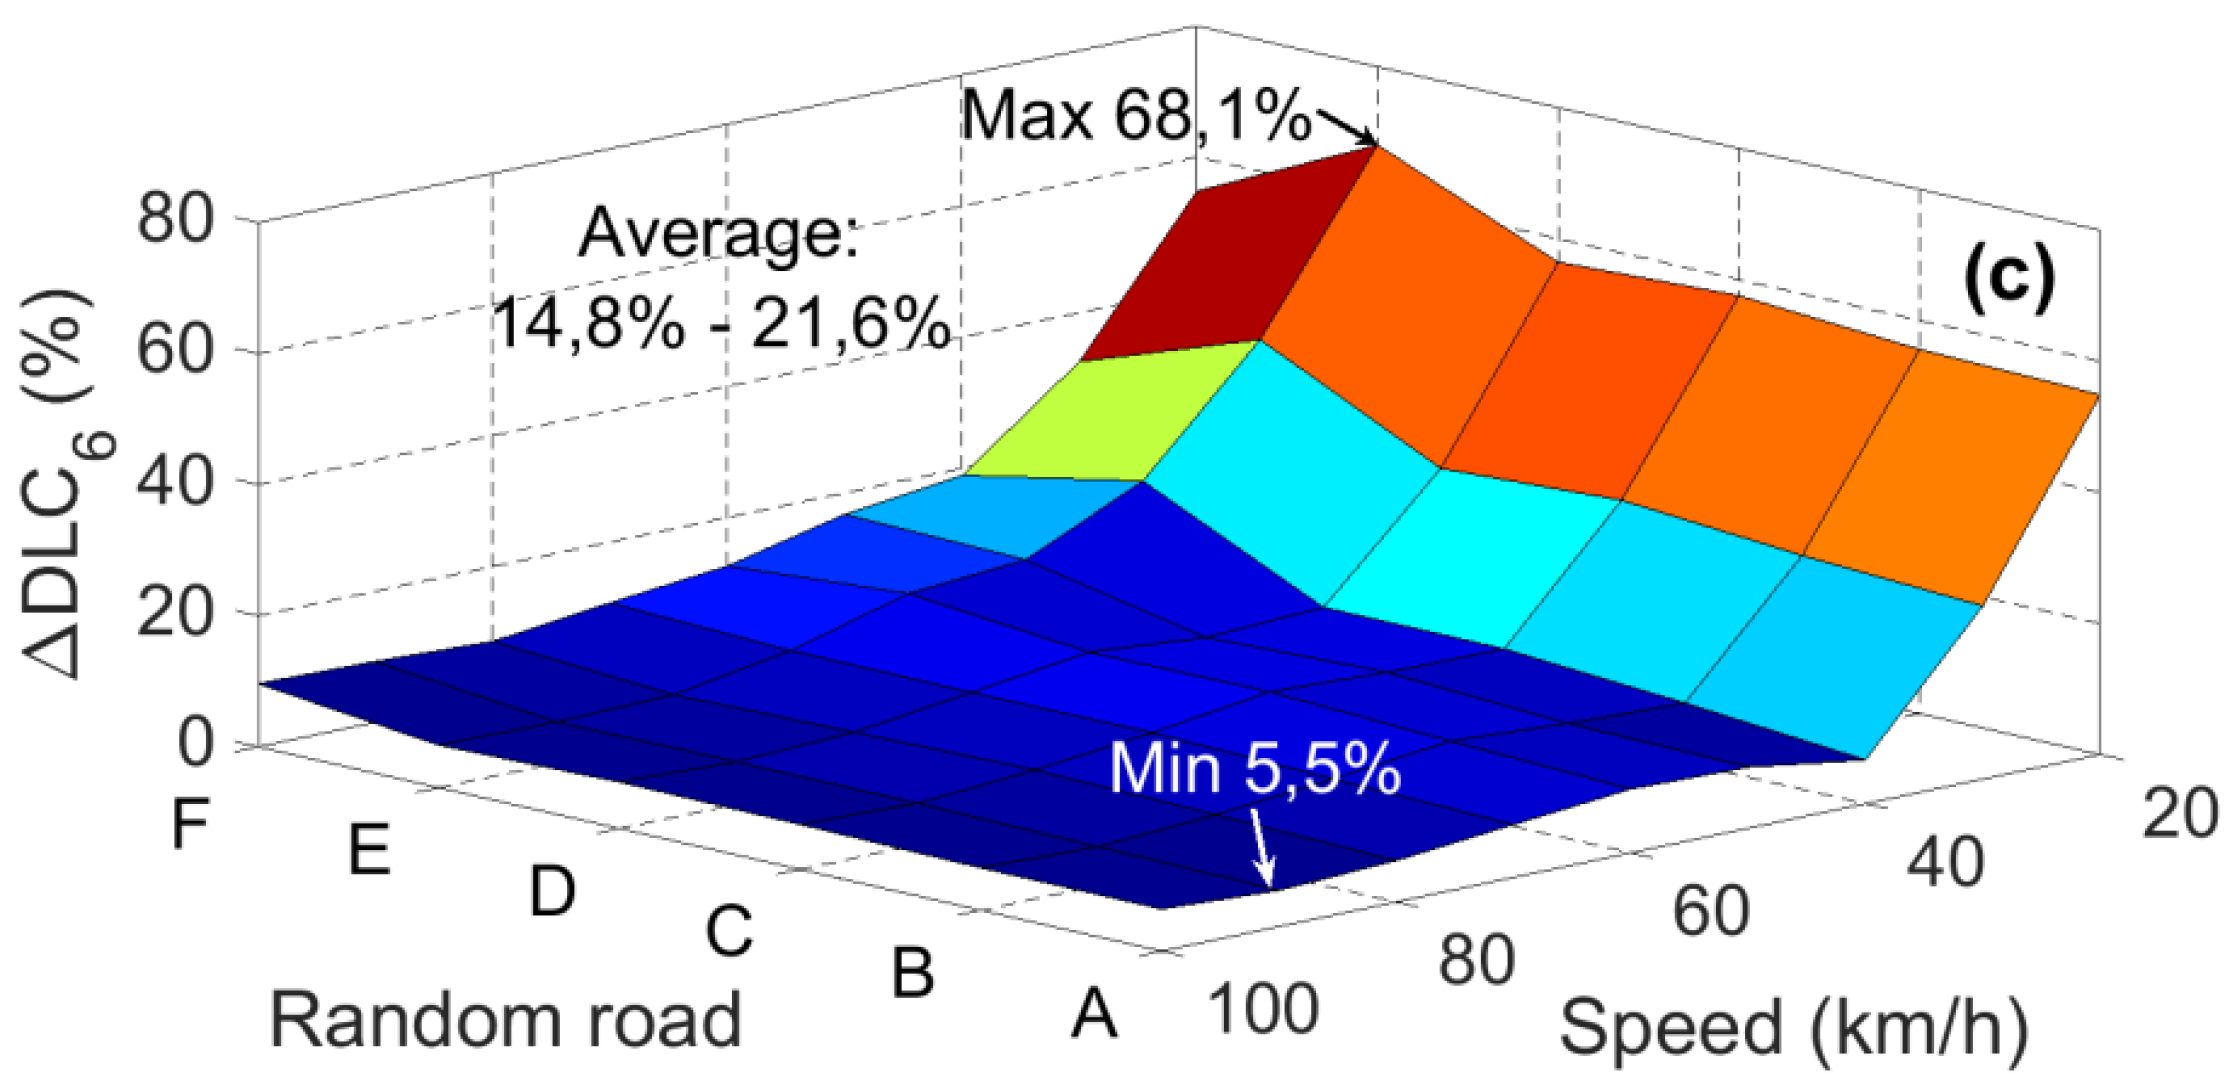
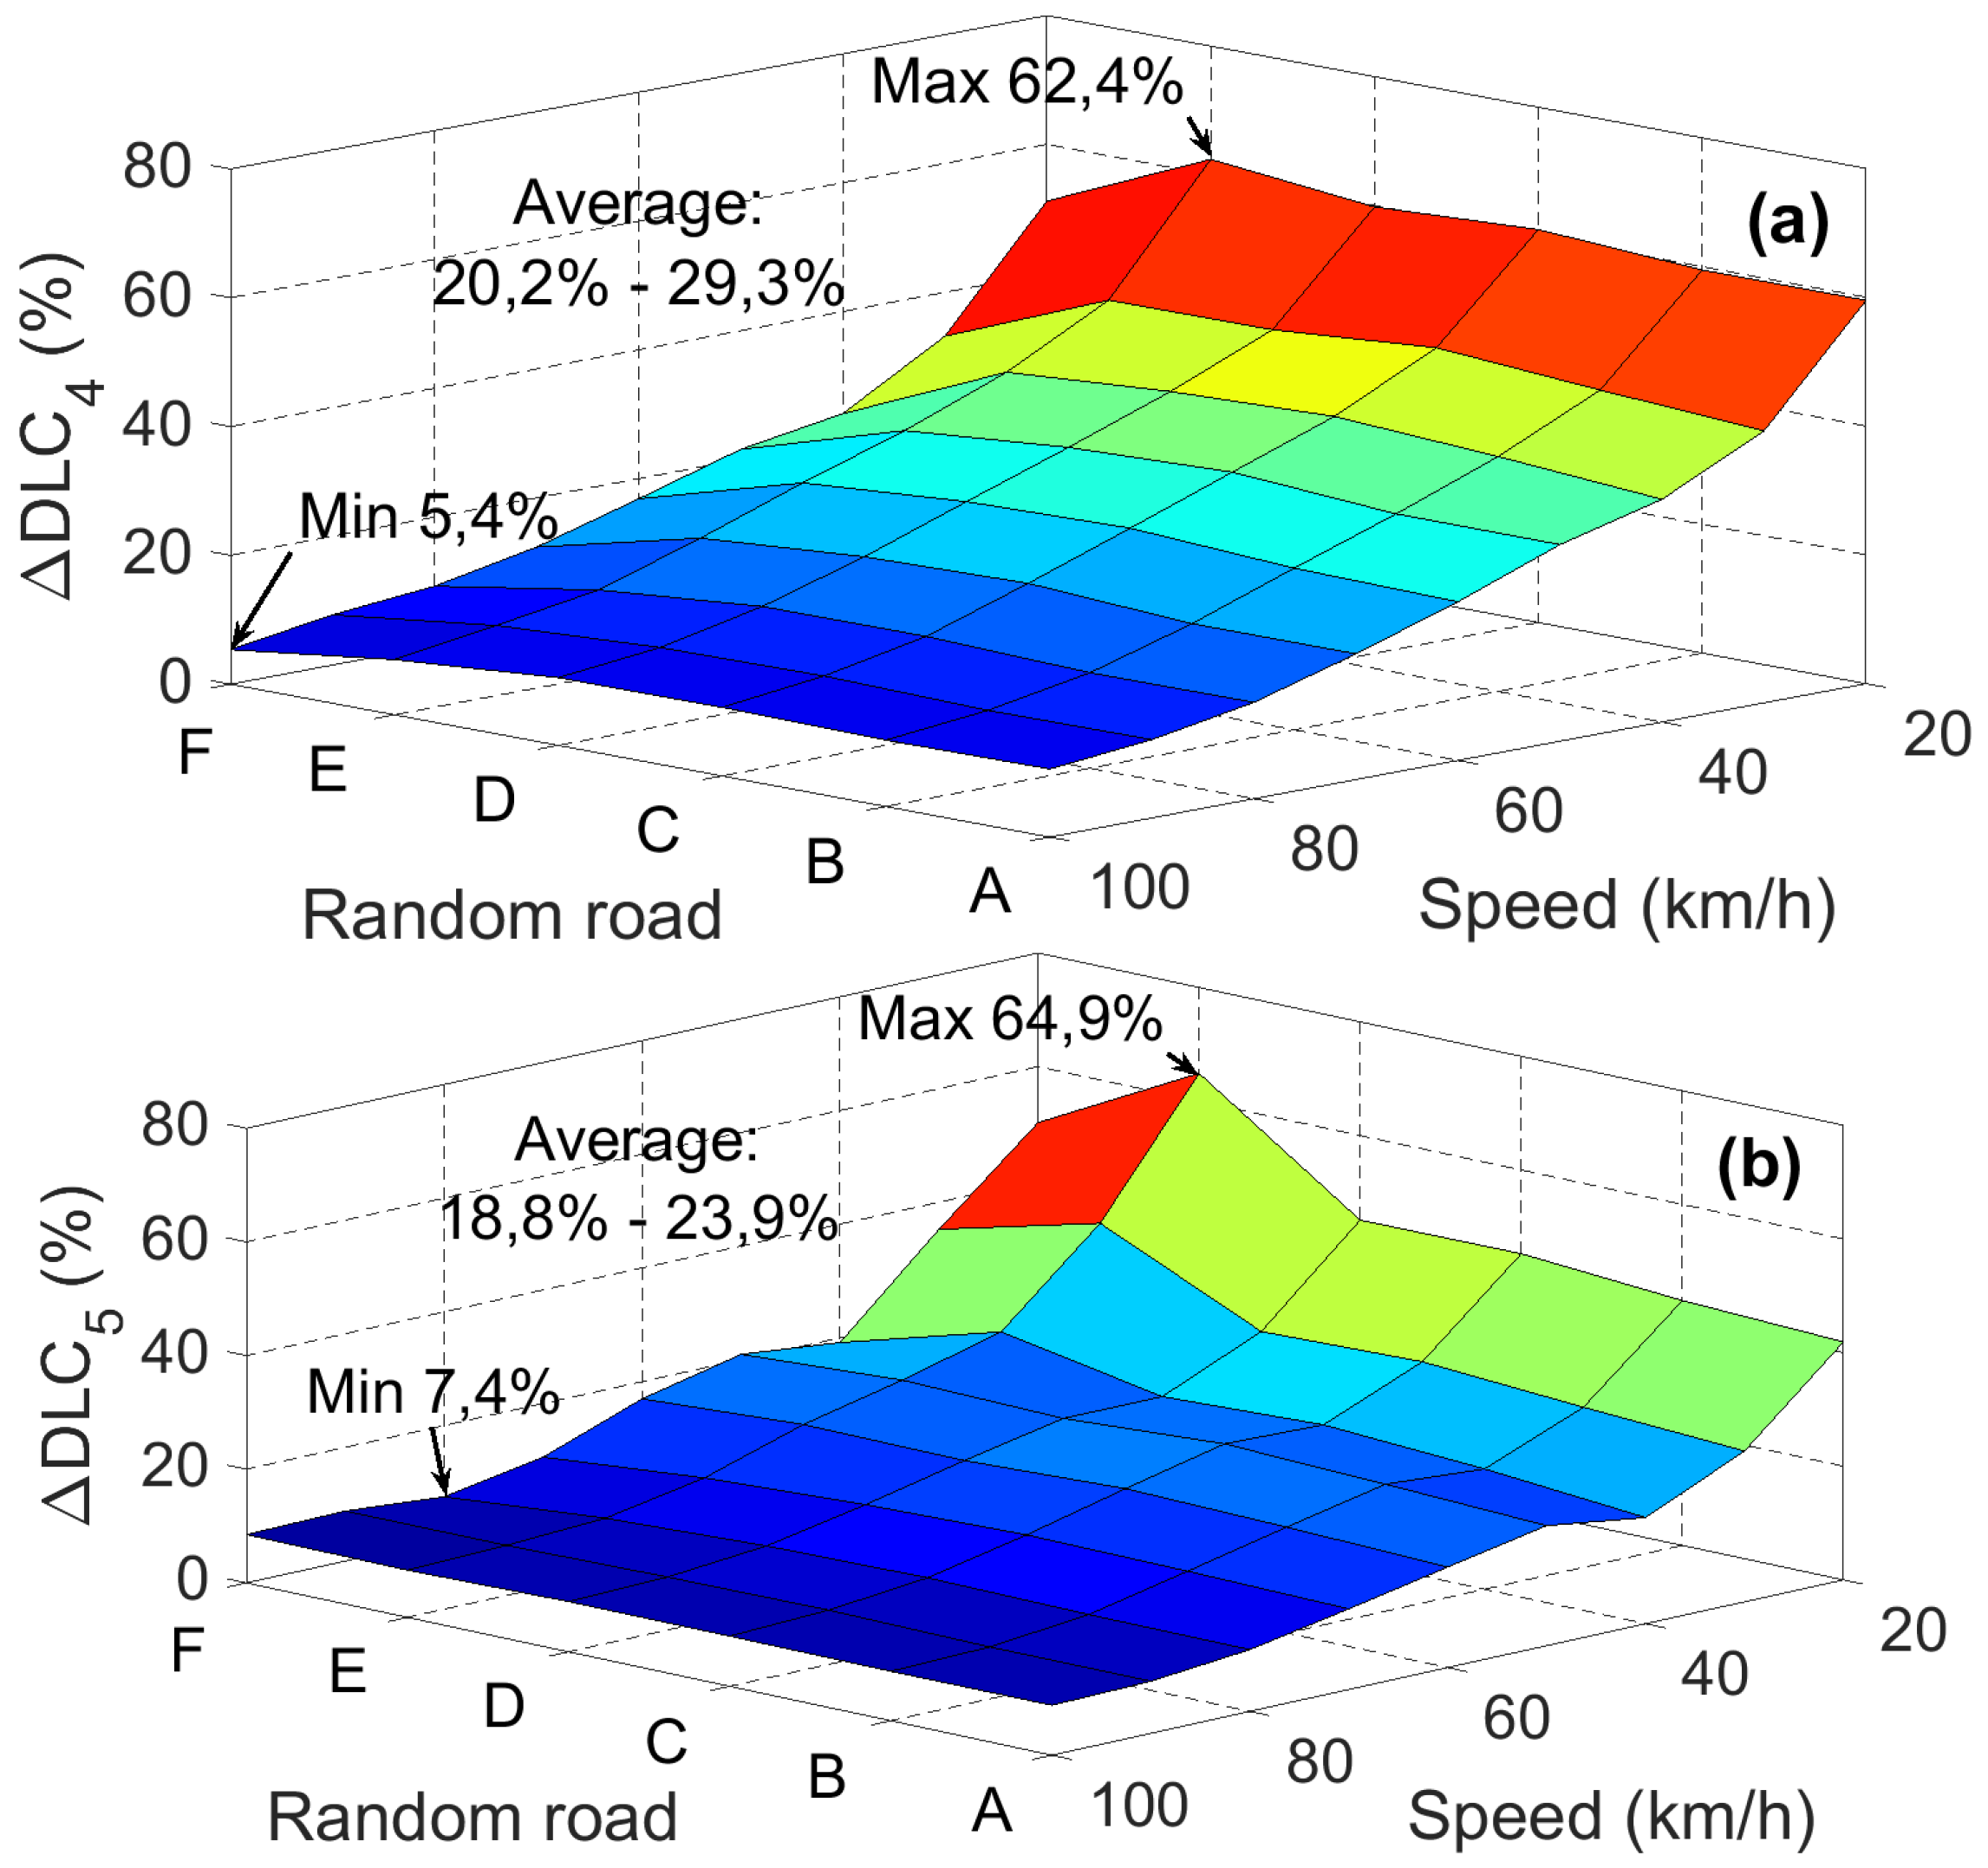
ΔDLC in both suspension systems became smaller when the vehicle speed was higher. At low speed, the extent of the reduction in DLC was remarkable: by 62.4% at the 4th axle, at 20 km/h, on the road type E, by 64.9% at the 5th axle on the road type E, and by 68.1% at the 6th axle on the road type E. When vehicle speed increased, the extent to which DLC reduced was smaller: by 5.4% at the speed of 100 km/h, on the road type F, at the 4th axle, by 7.4% at the speed of 80 km/hm on the road type F, at the 5th axle, and by 5.5% at the speed of 90 km/h, on the road type A, at the 6th axle.
The average ΔDLC value with both suspension systems gradually reduced from the 4th axle to the 6th axle; at the 4th axle, it was reduced the most, by 29.3%, at the 5th axle by 23.9%, and at the 6th axle by 21.6%.
At different speeds, the average ΔDLC values dropped in the range from 14.8% to 29.3%. The axles of the semi-trailer show behavioral differences in Table 4, Table 5 and Table 6 due to the following reasons:
The excitation of each axle is not simultaneous, there is a phase difference between axles.
The geometrical position of each axle relative to the vehicle’s center of gravity is different, leading to a different vertical displacement at each axle.
For a clearer understanding of the reduction extent of DLC values of the semi-trailer using the air suspension system, 3D graphics was used to demonstrate ΔDLC (%) of individual axles by speed and road surface, as shown in Figure 13.
The 3D graph in Figure 13 shows that the ΔDLC value of the semi-trailer using air suspension was lower than that of the semi-trailer using the leaf suspension system. It is shown within the speed range of 20 to 100 km/h, on the road types from A to F, at all three axles (4th, 5th, and 6th) of the semi-trailer. The maximum reductions were seen on road type E at the speed of 20 km/h (62.4% at the 4th axle, 64.9% at the 5th axle, and 68.1% at the 6th axle). The minimum reductions were 5.4% at the 4th axle on road type F at the speed of 100 km/h, 7.4% at the 5th axle on the road type F at the speed of 80 km/h, and 5.5% at the 6th axle on the road type A at the speed of 90 km/h. This shows that the largest reduction occurred on the road type E and at a low speed (20 km/h), while the smallest reduction occurred at a high speed (≥80 km/h).
The survey, evaluation, and experimental results have shown the effectiveness of the air suspension system in reducing the dynamic load of the tractor semi-trailer vehicle. The GENSYS air spring model used in conjunction with the vehicle model was clearly demonstrated in this study. Further studies of the effect of internal friction and the calculation of equivalent mechanical impedance should be considered in assessing the ride comfort and safety road holding of automobiles in general and of tractor semi-trailers in particular [30,31].

6. Conclusions

This paper presented a full vertical dynamic model of a tractor semi-trailer. This model considers a semi-trailer using two types of suspension systems (leaf spring and air spring) and a tractor using leaf spring suspension systems. The air suspension system was modeled on the basis of the GENSYS model. The dynamic model of the semi-trailer has been validated via experiments, with the percent error of the highest value being 6.23% and the Pearson correlation coefficient being higher than 0.8, corresponding to different speeds, thereby confirming the correctness of the research model in comparison with the experimental vehicle. Evaluation and comparative results have shown that the tractor semi-trailer using the air suspension system can reduce the dynamic load across a speed range of 20 to 100 km/h, on all random road types from A to F, in accordance with ISO 8608:2016. DLC values can reduce, on average, by 14.8–29.3% compared with the tractor semi-trailer using the leaf spring suspension system. The research results have reinforced the advantages of the air suspension system in heavy vehicles for the purpose of less road damages.
Perspectives of future research can include the development of the models of the tractor semi-trailer using the air suspension system, with the Quaglia model, in which leveling valve attributes are identified via experiments.

Author Contributions

Conceptualization, D.V.H., V.V.T., V.T.N. and O.S.; methodology, D.V.H., V.V.T., V.T.N. and O.S.; software, D.V.H., V.V.T. and V.T.N.; validation, D.V.H., V.V.T. and V.T.N.; formal analysis, D.V.H., V.V.T. and V.T.N.; investigation, D.V.H., V.V.T., V.T.N. and O.S.; resources, D.V.H., V.V.T., V.T.N. and O.S.; data curation, D.V.H., V.V.T., and V.T.N.; writing—original draft preparation, D.V.H., V.V.T. and V.T.N.; writing—review and editing, O.S.; visualization, D.V.H. and V.V.T.; supervision, O.S. All authors have read and agreed to the published version of the manuscript.

Funding

This research received no external funding.

Conflicts of Interest

The authors declare no conflict of interest.

Appendix A

Equations to Determine Binding Forces

Binding forces of a suspension system at the 1st, 2nd, and 3rd axles of the tractor:
{ F C 1 j = { C ( ξ 1 j z 1 j + f d 1 j n ) i f f d 1 j n < ( ξ 1 j z 1 j ) C 1 j ( ξ 1 j z 1 j ) i f f d 1 j t ( ξ 1 j z 1 j ) f d 1 j n C ( ξ 1 j z 1 j f d 1 j t ) i f ( ξ 1 j z 1 j ) < f d 1 j t F K 1 j = K 1 j ( ξ ˙ 1 j z ˙ 1 j ) ; ( j = 1 , 2 )
{ F C 23 j = { C ( ξ 23 j z 23 j + f d 23 j n ) i f f d 23 j n < ( ξ 23 z 23 j ) C 23 j ( ξ 23 j z 23 j ) i f f d 23 j t ( ξ 23 j z 23 j ) f d 23 j n C ( ξ 23 j z 23 j f d 23 j t ) i f ( ξ 23 j z 23 j ) < f d 23 j t F K 23 j = K 23 j ( ξ ˙ 23 j z ˙ 23 j ) ; ( j = 1 , 2 )
Equations used to determine the points of displacement above or below the suspension system at the 1st, 2nd, and 3rd axles of the tractor:
{ z 11 = z 1 l 1 sin φ 1 + w 1 sin β 1 z 12 = z 1 l 1 sin φ 1 w 1 sin β 1 ξ 11 = ξ A 1 + w 1 sin β A 1 ξ 12 = ξ A 1 w 1 sin β A 1
{ z 231 = z 1 + l 2 + l 3 2 sin φ 1 + w 2 + w 3 2 sin β 1 z 232 = z 1 + l 2 + l 3 2 sin φ 1 w 2 + w 3 2 sin β 1 ξ 231 = 1 2 ( ξ A 2 + ξ A 3 + w 2 sin β A 2 + w 3 sin β A 3 ) ξ 232 = 1 2 ( ξ A 2 + ξ A 3 - w 2 sin β A 2 - w 3 sin β A 3 )
Binding forces of balance suspension systems at the 2nd and 3rd axles of the tractor:
{ F C K 21 = 1 2 ( F C 231 + F K 231 ) J y C B 11 θ ¨ 11 a F C K 31 = 1 2 ( F C 231 + F K 231 ) + J y C B 11 θ ¨ 11 a
{ F C K 22 = 1 2 ( F C 232 + F K 232 ) J y C B 12 θ ¨ 12 a F C K 32 = 1 2 ( F C 232 + F K 232 ) + J y C B 12 θ ¨ 12 a
Damping force of suspension systems of the tractor semi-trailer:
F K i j = K i j ( ξ ˙ i j z ˙ i j ) ; ( i = 4 , 5 , 6 ; j = 1 , 2 )
Displacement at the center point of the wheel of the tractor semi-trailer:
ξ wij = ξ Ai + ( - 1 ) j - 1 b i sin β Ai ( i = 1 ÷ 6 ; j = 1 , 2 )
Displacement below the suspension system of the semi-trailer:
ξ ij = ξ Ai + ( - 1 ) j - 1 w i sin β Ai ( i = 4 ,   5 ,   6 ; j = 1 ,   2 )
Displacement above the leaf spring suspension system of the semi-trailer:
{ z 41 = z 2 + l 4 sin φ 2 + w 4 sin β 2 c 4 sin θ 451 z 42 = z 2 + l 4 sin φ 2 w 4 sin β 2 c 4 sin θ 452 z 51 = z 2 + l 5 sin φ 2 + w 5 sin β 2 + c 4 sin θ 451 c 4 sin θ 561 z 52 = z 2 + l 5 sin φ 2 w 5 sin β 2 + c 4 sin θ 452 c 4 sin θ 562 z 61 = z 2 + l 6 sin φ 2 + w 6 sin β 2 + c 4 sin θ 561 z 62 = z 2 + l 6 sin φ 2 w 6 sin β 2 + c 4 sin θ 562
Displacement of the upper point in the air suspension system of the semi-trailer:
{ z 41 = z 2 + l 4 sin φ 2 + w 4 sin β 2 z 42 = z 2 + l 4 sin φ 2 w 4 sin β 2 z 51 = z 2 + l 5 sin φ 2 + w 5 sin β 2 z 52 = z 2 + l 5 sin φ 2 w 5 sin β 2 z 61 = z 2 + l 6 sin φ 2 + w 6 sin β 2 z 62 = z 2 + l 6 sin φ 2 w 6 sin β 2
Determination of the binding force from the axles to the vehicle body:
F x 11 + F x 12 = f ( F z t 11 + F z t 12 ) F x 21 + F x 22 + F x 31 + F x 32 = f ( F z t 21 + F z t 22 + F z t 31 + F z t 32 ) M 21 + M 22 + M 31 + M 32 r b x F x 41 + F x 42 = f ( F z t 41 + F z t 42 ) F x 51 + F x 52 = f ( F z t 51 + F z t 52 ) F x 61 + F x 62 = f ( F z t 61 + F z t 62 )
Binding forces between the wheels and the road surface:
F C L i j = { C L i j ( h i j ξ w i j ) i f h i j ( ξ w i j f i j t ) 0 0 i f h i j ( ξ w i j f i j t ) < 0 F z i j = F C L i j + F z t i j   ( i = 1 : 1 : 6 ; j = 1 , 2 )
Aerodynamic force:
F w x 1 = C x A x 1 ρ v 0 2 2
F w x 2 = C x A x 2 ρ v 0 2 2
Active moment:
M 21 = M 22 = M 31 = M 32 = 1 4 ( ( G 1 + G 2 ) gf + 1 2 ρ C x A x 1 v o 2 ) r 21

Appendix B

Table A1. Vehicle parameters.
No.ParametersSymbolValueUnit
1Distance from CG of tractor to 1st axlel11.522m
2Distance from CG of tractor to 2nd axlel21.528m
3Distance from CG of tractor to 3rd axlel32.828m
4Distance from CG of tractor to 5th wheellk11.918m
5Distance from CG of semi-trailer to kingpinlk25.377m
6Distance from CG of semi-trailer to 4th axlel42.493m
7Distance from CG of semi-trailer to 5th axlel53.803m
8Distance from CG of semi-trailer to 6th axlel65.113m
9Tire trace on 1st axle of tractor2b12.06m
10Tire trace on 2nd and 3rd axles of tractor2b2, 2b31.85m
11Tire trace on 4th, 5th, and 6th axles of semi-trailer2b4, 2b5, 2b61.84m
12Width between 2 leaf springs of 1st axle of tractor2w10.88m
13Width between 2 leaf springs of 2nd and 3rd axles of tractor2w2, 2w31.02m
14Width between 2 air springs of 4th, 5th, and 6th axles of semi-trailer2w4, 2w5, 2w60.89m
15Static tire diameter of tractor and semi-trailerrij0.542m
16Sprung mass of tractorm16490kg
17Sprung mass of semi-trailerm236,210kg
18Un-sprung mass distributed on 1st axle of tractormA1570kg
19Un-sprung mass distributed on 2nd and 3rd axles of tractormA2, mA3 785kg
20Un-sprung mass distributed on 4th, 5th, and 6th axles of semi-trailermA4, mA5, mA6750kg
21Leaf spring stiffness of wheels 11 and 12 of tractorC11, C12250,000N/m
22Leaf spring stiffness of wheels 231 and 232 of tractorC231, C2321,400,000N/m
23Tire stiffness of wheels 11 and 12 of tractorsCL11, CL12980,000N/m
24Leaf spring stiffness of wheels 41, 42, 51, 52, 61, and 62 of semi-trailerC4j, C5j, C6j313,700N/m
25Tire stiffness of wheels 21, 22, 31, and 32 of tractorCL2j, CL3j1,960,000N/m
26Tire stiffness of wheels 41, 42, 51, 52, 61, and 62 of semi-trailerCL4j, CL5j, CL6j1,960,000N/m
27Damping coefficient of wheels 11 and 12 of tractorK11, K1215,000Ns/m
28Damping coefficient of wheels 231 and 232 of tractorK231, K23230,000Ns/m
29Damping coefficient of wheels 41, 42, 51, 52, 61, and 62 of semi-trailerK4j, K5j, K6j15,000Ns/m
30Effective area of the air spring (calculated for 1 air spring)Ae0.0483m2
31Diameter of the air springDb0.248m
32The inner diameter of the pipedp0.01m
33Pipe lengthlp3m
34Initial pressure of the air spring in full loadp0818,000Pa
35Pressure of reservoirpr8.5 × 105Pa
36Atmospheric pressurepa1.0 × 105Pa
37Initial volume of the air springVb012 × 10−3m3
38Volume of reservoir (one piece)Vr00.048m3
39Specific mass density of atmospheric air in standard conditionρ1.185kg/m3
40Adiabatic coefficientn1.4/
41Non-linear exponential factorβ1.8/
42Loss coefficientkt3.5/

References

  1. Available online: https://hdstruckdrivinginstitute.com/blog/semi-trucks-numbers/ (accessed on 6 November 2021).
  2. Number of Lories, Road Tractors, Semi-Trailers and Trailers. Available online: https://ec.europa.eu/eurostat/statistics-explained/index.php?title=File:Number_of_lorries,_road_tractors,_semi-trailers_and_trailers,_2012.png#file (accessed on 6 November 2021).
  3. Cebon, D. Handbook of Vehicle-Road Interaction; Taylor & Francis: London, UK; New York, NY, USA, 1999; pp. 310–334. [Google Scholar]
  4. Chen, Y. Modeling Control and Design STUDY of Balanced Pneumatic Suspension for Improved Roll Stability in Heavy Trucks. Ph.D. Thesis, Virginia Polytechnic Institute and State University, Blacksburg, VA, USA, 2017; p. 8. [Google Scholar]
  5. Wang, J. Nonlinear Modeling and h-Infinity Model Reference Control of Pneumatic Suspension System. Ph.D. Thesis, Iowa State University, Ames, IA, USA, 2012. [Google Scholar]
  6. Quaglia, G.; Sorli, M. Air Suspension Dimensionless Analysis and Design Procedure; Department of Mechanics, Politecnico di Torino: Torino, Italy, 2001. [Google Scholar]
  7. Van Tan, V. Enhancing the Roll Stability of Heavy Vehicles by Using an Active Anti-Roll Bar System. Ph.D. Thesis, University Grenoble Alpes, Grenoble, France, 2017. [Google Scholar]
  8. Zhu, H.; Yang, J.; Zhang, Y.; Feng, X. A novel air spring dynamic model with pneumatic thermodynamics, effective friction and viscoelastic damping. J. Sound Vib. 2017, 408, 87–104. [Google Scholar] [CrossRef]
  9. Nieto, A.J.; Morales, A.L.; Gonzalez, A.; Chicharro, J.M.; Pintado, P. An analytical model of pneumatic suspension based on an experimental characterization. J. Sound Vib. 2008, 313, 290–307. [Google Scholar] [CrossRef] [Green Version]
  10. Chang, F.; Lu, Z.H. Dynamic Model of an Air Spring and Integration into a Vehicle Dynamics Model. Proc. Inst. Mech. Eng. Part D J. Automob. Eng. 2008, 222, 1813–1825. [Google Scholar] [CrossRef]
  11. Chen, Y.; He, J.; King, M.; Chen, W.; Wang, C.; Zhang, W. Model development and Dynamic Load-Sharing of Longitudinal-Connected Air Suspensions. J. Mech. Eng. 2013, 59, 14–24. [Google Scholar] [CrossRef] [Green Version]
  12. White, D.L. Parametric Study of Leveling System Characteristics on Roll Stability of Trailing Arm Air Suspension for Heavy Trucks; SAE Technical Paper No. 2000-01-3480; SAE International: Warrendale, PA, USA, 2000. [Google Scholar]
  13. Nakajima, T.; Shimokawa, Y.; Mizuno, M.; Sugiyama, H. Air Suspension System Model Coupled with Leveling and Differential Pressure Valves for Railroad Vehicle Dynamics Simulation. J. Comput. Nonlinear Dyn. 2014, 9, 031006. [Google Scholar] [CrossRef]
  14. Sayyaadi, H.; Shokouhi, N. Effects of Air Reservior Volume and Connecting Pipes Length and Diameter on the Air Spring Behavior in Rail-Vehicles; Department of Mechanical Engineering, Sharif University of Technology: Sharif, Iran, 2009. [Google Scholar]
  15. Moheyeldein, M.M.; Abd-El-Tawwab, A.M.; Abd El-gwwad, K.A.; Salem, M.M. An analytical study of the performance indices of air spring suspensions over the passive suspension. Beni-Suef Univ. J. Basic Appl. Sci. 2018, 7, 5245–5534. [Google Scholar] [CrossRef]
  16. Abid, H.J.; Chen, J.; Nassar, A.A. Equivalent air spring suspension model for quarter-passive model of passenger automobiles. Hindawi Publ. Corp. Int. Sch. Res. Not. 2015, 2015, 974020. [Google Scholar] [CrossRef] [Green Version]
  17. Tang, G.; Zhu, H.; Zhang, Y.; Sun, Y. Studies of Air Spring Mathematical Model and Its Performance in Cab Suspension System of Commercial Vehicle; SAE Technical Paper 2015-01-0608; SAE International: Warrendale, PA, USA, 2015. [Google Scholar]
  18. Hondo, T.; Tanaka, T. Investigation of relationship between initial setting of leveling valves and air spring pressure of a railway vehicle when assuming the centrifugal force action. In The IAVSD International Symposium on Dynamics of Vehicles on Roads and Tracks; Springer: Cham, Switzerland, 2020; pp. 252–260. [Google Scholar]
  19. Razdan, S.; Awasare, P.J.; Bhave, S.Y. Active Vibration Control using Air Spring. J. Inst. Eng. Ser. C 2018, 100, 1–12. [Google Scholar] [CrossRef]
  20. Buhari, R.; Rohani, M.M.; Abdullah, M.E. Dynamic Load Coefficient of Tyre Forces from Truck Axles. Appl. Mech. Mater. 2013, 405–408, 1900–1911. [Google Scholar] [CrossRef] [Green Version]
  21. Siddiqui, O.M. Dynamic Analysis of a Modern Urban Bus for Assessment of Ride Quality and Dynamic Wheel Loads. Ph.D. Thesis, Concordia University, Montreal, QC, Canada, 2000. [Google Scholar]
  22. Muluka, V. Optimal Suspension Damping and Axle Vibration Absorber for Reduction of Dynamic Tyre Loads. Ph.D. Thesis, Concordia University Montreal, Montreal, QC, Canada, 1998. [Google Scholar]
  23. Hu, P.; Zhang, X.N.; Tian, S. Research on heavy truck dynamic load coefficient and influence factors. MATEC Web Conf. 2016, 81, 02015. [Google Scholar] [CrossRef] [Green Version]
  24. Blundell, M.; Harty, D. The Multibody Systems Approach to Vehicle Dynamics; Elsevier: Berlin/Heidelberg, Germany, 2004; pp. 326–393. [Google Scholar]
  25. Berg, M. A Three-dimensional airspring model with friction and orifice damping. Veh. Syst. Dyn. 1999, 33, 528–539. [Google Scholar] [CrossRef]
  26. Van Tan, V.; Hung, T.M.; Sename, O. An investigation into the ride comfort of buses using an air suspension system. Int. J. Heavy Veh. Syst. 2021, 28, 184–205. [Google Scholar] [CrossRef]
  27. ISO 8608. Mechanical Vibration—Road Surface Profiles—Reporting of Measured Data; ISO: Geneva, Switzerland, 2016.
  28. Sweatman, P.F. A Study of Dynamic Wheel Forces in Axle Group Suspensions of Heavy Vehicles; Australian Road Research Board: Melbourne, Australia, 1983. [Google Scholar]
  29. Mukaka, M.M. Statistics Corner: A guide to appropriate use of Correlation coefficient in medical research. Malawi Med. J. 2012, 24, 69–71. [Google Scholar]
  30. Pugi, L.; Alfatti, F.; Berzi, L.; Favilli, T.; Pierini, M.; Forrier, B.; D’hondt, T.; Sarrazin, M. Fast modelling and identification of hydraulic brake plants for automotive applications. Int. J. Fluid Power 2020, 21, 169–210. [Google Scholar] [CrossRef]
  31. Pugi, L.; Palazzolo, A.; Fioravanti, D. Simulation of railway brake plants: An application to SAADKMS freight wagons. Proc. Inst. Mech. Eng. Part F J. Rail Rapid Transit 2008, 222, 321–329. [Google Scholar] [CrossRef]
Figure 1. Full vertical dynamic model of a tractor semi-trailer using two types of suspension systems: (a) Side view, (b) Front view.
Actuators 11 00012 g001
Figure 2. Suspension model of the semi-trailer using the leaf spring.
Actuators 11 00012 g002
Figure 3. Model of the air suspension system: (a) Physical model, (b) GENSYS model.
Actuators 11 00012 g003
Figure 4. The road profiles according to the ISO standard 8608:2016 (A–F).
Actuators 11 00012 g004
Figure 5. Tractor semi-trailer used in the experiment.
Actuators 11 00012 g005
Figure 6. Connection diagram of experimental equipment.
Actuators 11 00012 g006
Figure 7. Sensor locations.
Actuators 11 00012 g007
Figure 8. Experiment scenario description.
Actuators 11 00012 g008
Figure 9. Acceleration of the vehicle body at the 4th axle (z″4): (a) at 10 km/h, (b) at 20 km/h, (c) at 30 km/h.
Actuators 11 00012 g009
Figure 10. Displacement of the 4th axle (ξ4): (a) at 10 km/h, (b) at 20 km/h, (c) at 30 km/h.
Actuators 11 00012 g010
Figure 11. Responses to time domain of the dynamic load: (a) at the 4th axle, (b) at the 5th axle, (c) at the 6th axle.
Actuators 11 00012 g011aActuators 11 00012 g011b
Figure 12. Comparison of DLC values respective to the two types of suspension systems: (a) ISO A, (b) ISO B, (c) ISO C, (d) ISO D, (e) ISO E, (f) ISO F.
Actuators 11 00012 g012
Figure 13. The relationship between the extent of ΔDLC reduction, velocity, and road surface at the 4th, 5th, and 6th axles of the semi-trailer using the air suspension system: (a) ΔDLC4, (b) ΔDLC5, (c) ΔDLC6.
Actuators 11 00012 g013aActuators 11 00012 g013b
Table 1. Necessary parameters.
No.ParametersSymbolsSensorsPosition
1Relative displacement of the sprung mass and un-sprung mass at the 4th axle ξ4-z4HF11
2Displacement of the un-sprung mass at the 4th axleξ4HF22
3Acceleration of the sprung mass relative to the 4th axle z ¨ 4 DYTRAN3
4Speed of the vehiclevS-motion4
Table 2. Pearson correlation coefficient between the simulation and the experiment results.
Speedr(ξ4–z4)
[-]
r(ξ4)
[-]
r ( z ¨ 4 ) [-]
10 km/h0.80580.94490.8547
20 km/h0.85400.91920.8560
30 km/h0.89940.95300.8381
Table 3. Error of the highest value between the simulation and the experiment results.
Speedmax(ξ4–z4) (%)max(ξ4) (%)max( z ¨ 4 ) (%)
10 km/h1.803.450.24
20 km/h3.454.121.35
30 km/h5.896.235.78
Table 4. The extent of the reduction of ΔDLC (%): 4th axle.
ΔDLC4 (%)Random Road
ABCDEF
Speed (km/h)2059.559.561.059.862.451.2
3042.243.845.643.743.533.2
4034.636.538.037.135.324.1
5030.530.632.331.429.221.6
6024.625.126.625.924.116.9
7019.519.521.020.418.512.4
8015.014.815.715.613.49.3
9012.212.012.512.210.97.8
10010.610.310.610.58.65.4
Average27.628.029.328.527.320.2
Table 5. The extent of the reduction of ΔDLC (%): 5th axle.
ΔDLC5 (%)Random Road
ABCDEF
Speed (km/h)2041.943.145.345.164.950.1
3026.528.230.129.442.435.2
4018.721.222.921.827.119.2
5021.122.323.421.822.520.9
6017.718.619.418.218.517.0
7014.214.715.114.313.010.6
8010.911.011.410.99.77.4
909.29.19.69.38.88.8
1008.88.78.88.98.38.5
Average18.819.720.620.023.919.8
Table 6. The extent of the reduction of ΔDLC (%): 6th axle.
ΔDLC6 (%)Random Road
ABCDEF
Speed (km/h)2054.955.657.556.468.154.8
3026.427.930.128.742.132.5
406.79.111.111.224.318.9
509.39.811.310.416.016.7
609.710.812.111.914.612.6
708.18.89.69.59.710.7
806.37.17.77.26.78.6
905.55.96.36.46.39.3
1006.46.56.97.16.59.6
Average14.815.717.016.521.619.3
Publisher’s Note: MDPI stays neutral with regard to jurisdictional claims in published maps and institutional affiliations.

