Review

Characteristics of Hydraulic and Electric Servo Motors

1
Industrial Cyber-Physical Systems Research Center, National Institute of Advanced Industrial Science and Technology (AIST), Tsukuba Central 2, 1-1-1 Umezono, Tsukuba 305-8568, Japan
2
Faculty of Engineering and Design, Hosei University, 2-17-1 Fujimi, Tokyo 102-8160, Japan
*
Author to whom correspondence should be addressed.
Actuators 2022, 11(1), 11; https://doi.org/10.3390/act11010011
Submission received: 19 November 2021 / Revised: 30 December 2021 / Accepted: 1 January 2022 / Published: 5 January 2022
(This article belongs to the Section High Torque/Power Density Actuators)

Abstract

:
Until the 1970s, hydraulic actuators were widely used in many mechanical systems; however, recently, electric motors have become mainstream by virtue of their improved performance, and hydraulic motors have largely been replaced by electric motors in many applications. Although this trend is expected to continue into the future, it is important to comprehensively evaluate which motor is most suitable when designing mechanical systems. This paper presents the results of a survey of the performance of electric and hydraulic servo motors and aims to provide quantitative data that can be used as a reference for selecting appropriate motors. We surveyed AC, AC direct, brushless DC, and brushed DC electric motors and swash plate-type axial piston, bent axis-type axial piston, crank-type radial piston, and multistroke-type radial piston hydraulic motors. Performance data were collected from catalogs and nonpublic data. We compared and evaluated the characteristics of these diverse servo motors using indexes such as torque, rotating speed, output power, power density, and power rate.

1. Introduction

Hydraulic systems provide high power and a rapid response and have been widely used in many industrial fields. However, the partial or full electrification of hydraulic systems has been increasingly implemented—for example, in aircraft, off-highway machines, commercial vehicles, and automobiles—in order to reduce their environmental impact [1,2,3,4,5,6,7]. On the other hand, some industries continue to actively use hydraulic systems. Although many humanoid robots and legged robots used electric actuators with high performance, a recent increase in the output power and toughness of hydraulic actuators has attracted attention. Powerful hydraulic-driven robots, such as BigDog [8], Atlas [9], and HyQreal [10], have been developed [11], and many studies have been conducted on elemental technologies for hydraulic robots, including elemental equipment and control technologies [12,13,14,15]. Hydraulic systems have been also utilized in the renewable energy industry. Some wind and wave power generators use hydraulic systems to transfer power because hydraulic power transmissions enable easier maintenance and downsizing of systems relative to other types of transmission [16,17,18,19,20,21,22].
It is important for engineers and designers to select appropriate actuation systems for servo applications. The choice of using electric, hydraulic, or other motion systems is a fundamental decision that affects performance, cost, maintenance, safety, ease of use, flexibility, and reliability. Much research has been conducted over the past few decades to help evaluate the characteristics of these systems and determine the most appropriate choice for a particular use. In 1944, W. C. Trautman and R. E. Middleton compared the weight per power of hydraulic and electric components in aircraft and compared the total weight of these systems by listing the weights of each component [23]. M. H. Geyer and R. C. Treseder, in 1952, also compared the weights of hydraulic, electric, and pneumatic systems in aircraft, evaluating the advantages of each [24]. In 1960, P. H. Southwell noted differences between mechanical systems and other systems, i.e., hydraulic, pneumatic, and electric systems. In addition, the features of hydraulic and electric systems were described, and the relative performances of mechanical and hydrostatic transmissions were compared [25]. K. Foster and L. Fenney evaluated the dynamic characteristics of electric and hydraulic servo-drives by examining their power rates and conducting mathematical analyses of each servo-loop, in 1989 [26]. P. Dansfield, in 1990, surveyed several studies on the response of electric, hydraulic, and pneumatic actuators, evaluating their response characteristics to specific conditions [27]. W. Backé, in 1993, described progress in fluid power technologies, considering differences between the weight–power ratios of hydraulic and electric motors and showing that hydraulic motors had several advantages [28]. In 1997, K. Nakano and Y. Konno surveyed the performance of hydraulic and electric servo motors and evaluated relationships among the performance indexes and dimensional parameters of these motors [29]. To provide a means to select the appropriate actuator for a given mechanical task, J. E. Huber et al. presented and compared the performance characteristics of many types of linear actuators, including those driven by material shape changes, such as piezoelectric, shape memory alloy, thermal expansion, and magnetostrictive actuators, as well as electric and fluid power actuators, in 1997 [30]. W. Durfee et al., in 2011, considered whether hydraulic systems are appropriate for powered orthotics and compared the weights of hydraulic systems, which were found to be smaller than commonly used electromechanical systems [31]. In 2013, Y. Tanaka and S. Sakama et al. surveyed and compared the performances of electric, hydraulic, and pneumatic motors [32] based on the work of Nakano [29]. T. Kazama, in 2019, unlike many previous studies, focused on power transmission elements (hoses in hydraulic systems, tubes in pneumatic systems, and wires in electric drive systems) and conducted a comparison of the relationship between their weight and transmission power [33]. Previous studies have compared and evaluated the characteristics of various driving systems and components; however, it is unclear if the data in these studies are sufficient. In addition, the characteristics of the studied systems are likely to have changed significantly over the last several decades. Therefore, they might not always help in selecting the appropriate system to use. It is therefore important to expand the scope of the survey as much as possible and update survey data on a regular basis.
Although every component of a motion system and every type of drive system should ideally be investigated, it is difficult to survey and fairly evaluate all these systems because the amount of information available varies by system. In this paper, we focus on one of the most important components of the motion system, i.e., the servo motor. Furthermore, we focus on two drive systems, hydraulic and electric, which were surveyed as common drive systems in many previous studies. Although the target of this investigation is confined to hydraulic and electric servo motors, we have collected as wide a dataset as possible regarding these servo motors in order to present useful information for engineers and designers.

2. Survey Target

Table 1 shows the surveyed motors. We collected data based on specifications listed in motor product catalogs, documents, and nonpublic data. It should be noted that some information about these materials is omitted in the references since the number of materials is large: more than 300 catalogs and dozens of other documents were collected. We divided the electric motors into AC, AC direct, brushless DC, and brushed DC motors and hydraulic motors into swash plate-type axial piston, bent axis-type axial piston, crank-type radial piston, and multistroke-type radial piston motors. Among these, the brushless DC motor data were added relative to our previous study [32]. Moreover, we collected data on motors of various sizes and from different years. The total amount of data for each motor includes the same type of motor irrespective of the publication year of the catalog, resulting in a total amount of data for hydraulic and electric motors that was over ten times greater than that in previous studies. In that regard, this paper not only compares the performance of motors by differences in their drive system but also shows the transition of the performance of each motor.
In this paper, Section 4 shows the transition of motor characteristics using all collected data, and Section 5 shows the results of the comparison of the characteristics of motors listed in catalogs available in May 2020.

3. Performance Indexes

Hydraulic motors and electromagnetic motors differ in their actuation principles. In this paper, we evaluated their performance using data listed in catalogs, such as rated torque, output power, and rotating speed, and some indexes calculated from catalog data, similar to the evaluation methods used in previous studies [29]. Here, we introduce some of the performance evaluation indexes used in this paper.
To compare motor output power, we used the index of power density, Pd. Since the output power of many motors increases as the size of the motor increases, it can be difficult to accurately compare the output of variously sized motors using only the rated output of the motor, Pr. To compare different types of motors considering their size differences, we used not only the rated power Pr but also the power density Pd, which is defined by the ratio of Pr to the weight m of the motor, as shown in Equation (1):
Pd= Pr/m
For a high power density, the motor can be evaluated as relatively compact and with high output power.
For evaluating motor responsiveness, we also used specific indexes. One of these indexes is the power rate, Q. Another index is termed the torque–inertia ratio Tj, and it is defined as the ratio of the rated torque Tr to the polar moment of inertia Jm and can thus also evaluate responsiveness. However, the torque–inertia ratio of the motor changes according to its reduction ratio; therefore, it is not suitable for evaluating geared motors. Although we also collected data for gearless motors, this paper uses the power rate Q, which is more commonly used to evaluate motor responsiveness. The power rate Q is defined as the ratio of the square of the rated torque Tr to the moment of inertia Jm, as shown in Equation (2):
Q = Tr2/Jm
This equation shows that the power rate increases as torque increases. Moreover, since larger motors generally have higher torque, it can be inferred that larger motors have higher power rates. Therefore, when it is necessary to compare responsiveness while taking into consideration the influence of differences in motor size, the power rate density Qd is used, which is defined as the ratio of power rate Q to weight m, as shown in Equation (3):
Qd = Q/m
Unfortunately, data regarding the moment of inertia of some motors have not been published in catalogs. Therefore, it is not possible to evaluate the performance of these motors since the moment of inertia cannot be calculated.

4. Trends of Motor Characteristics
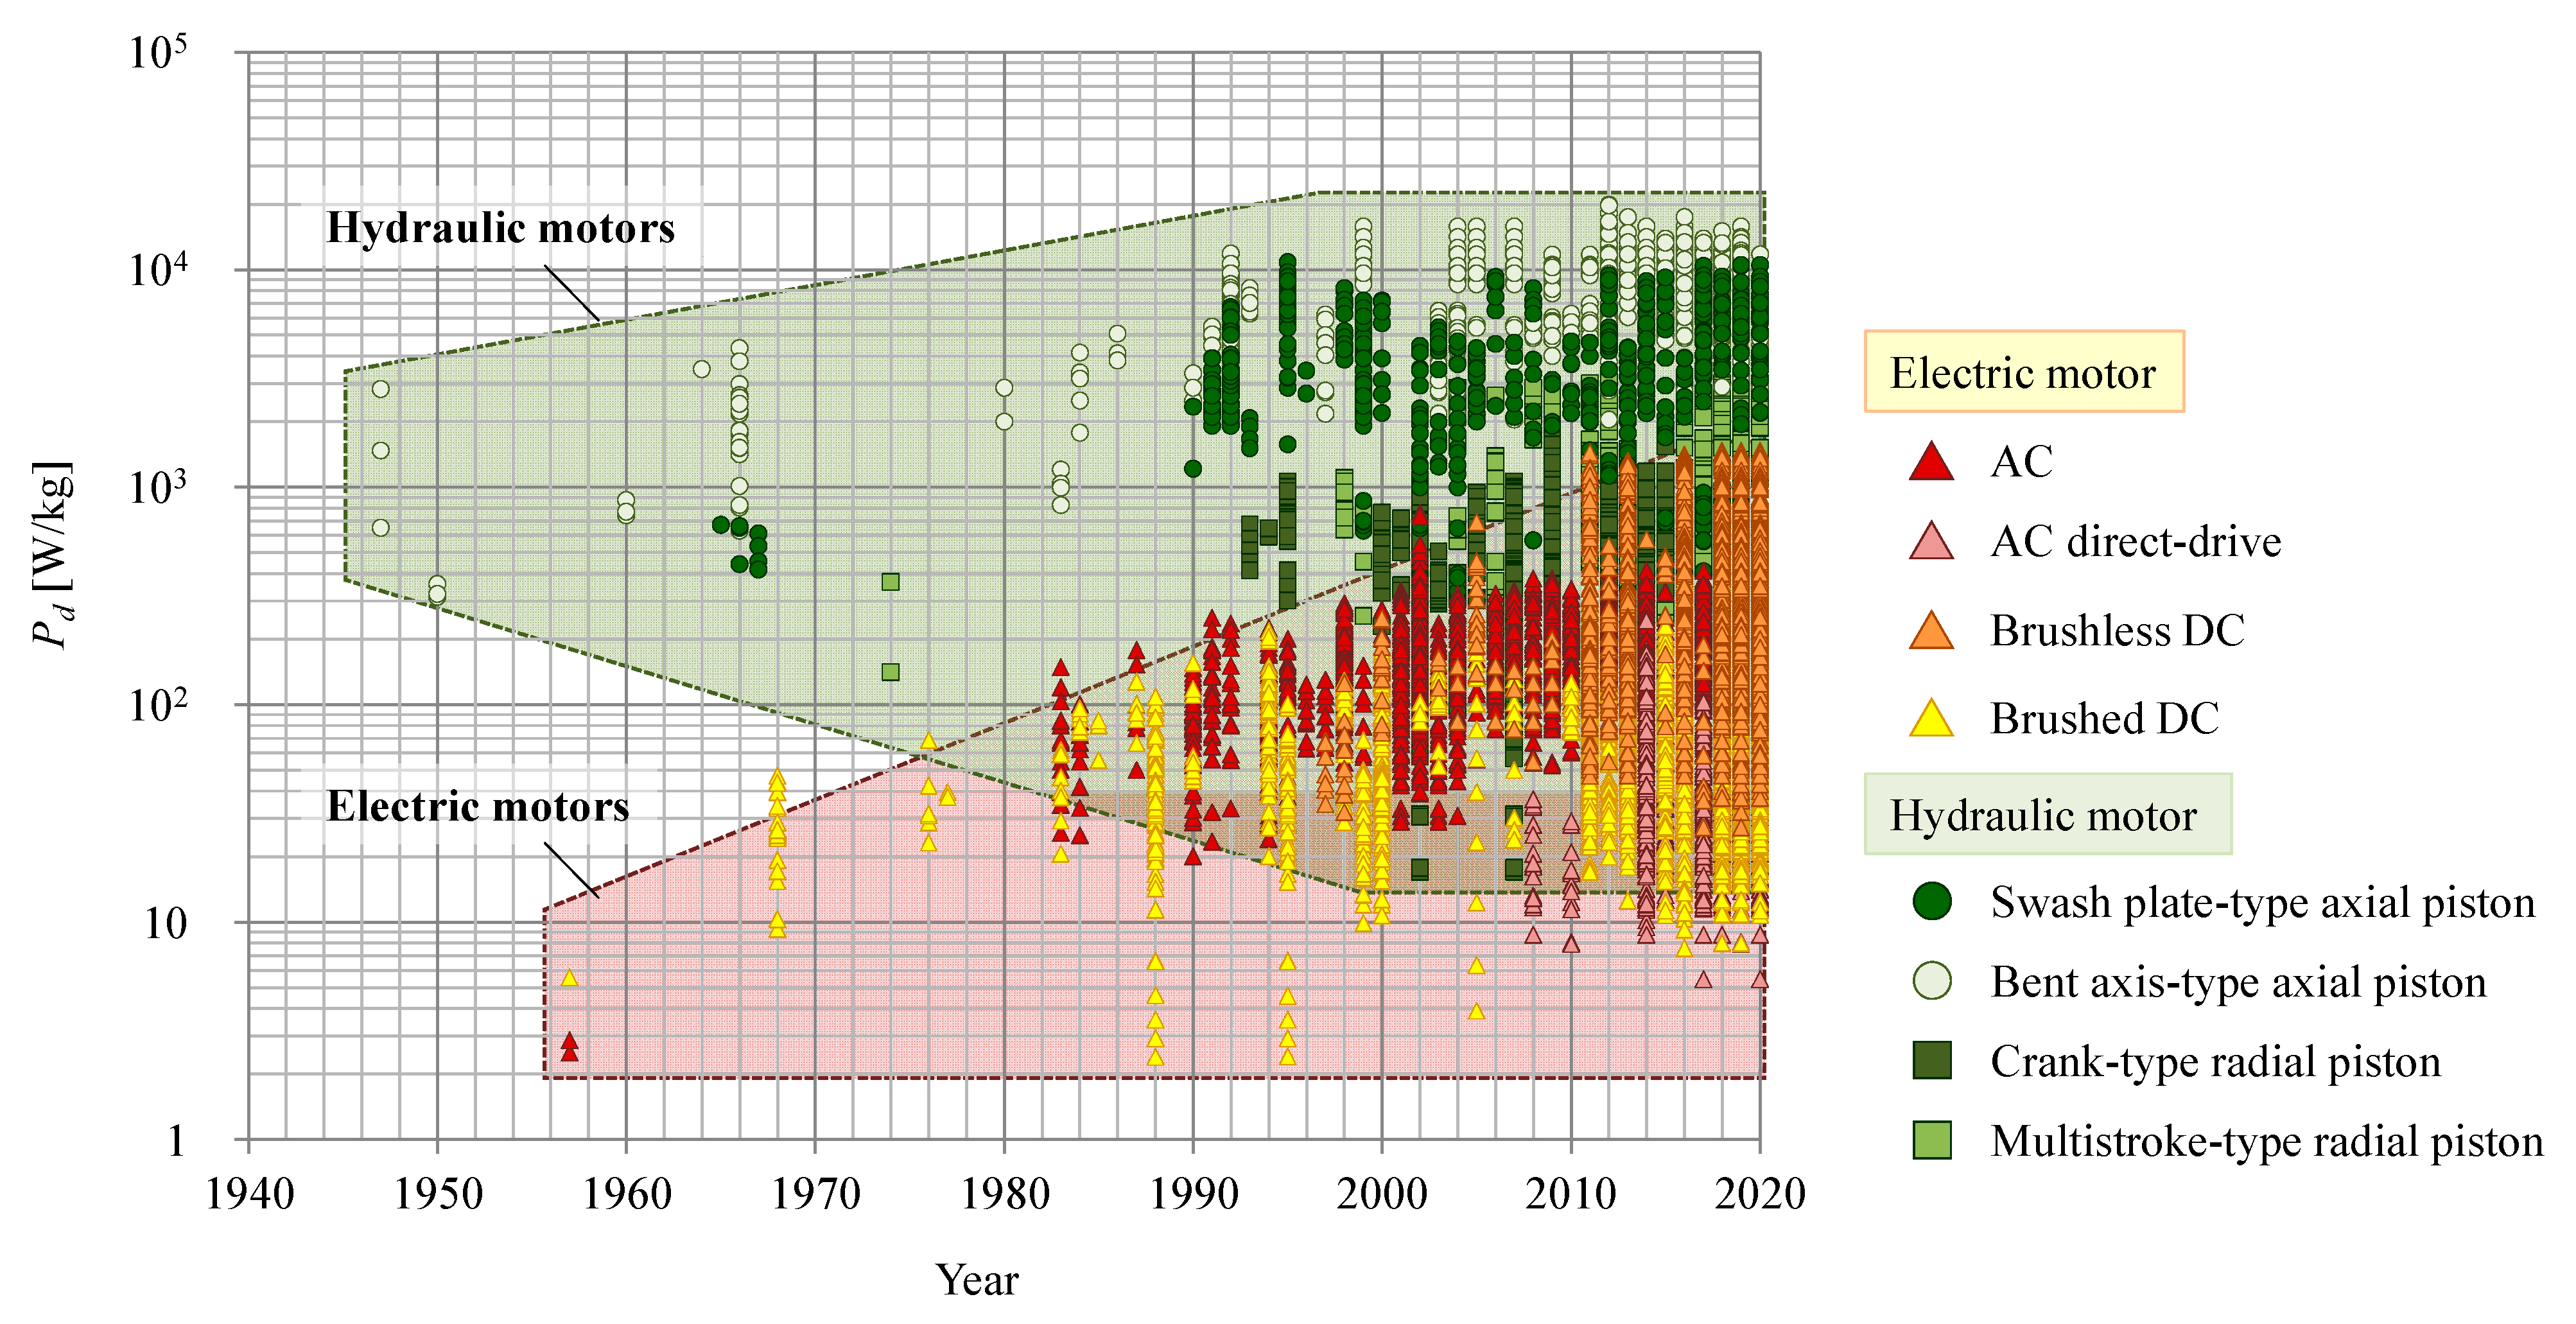
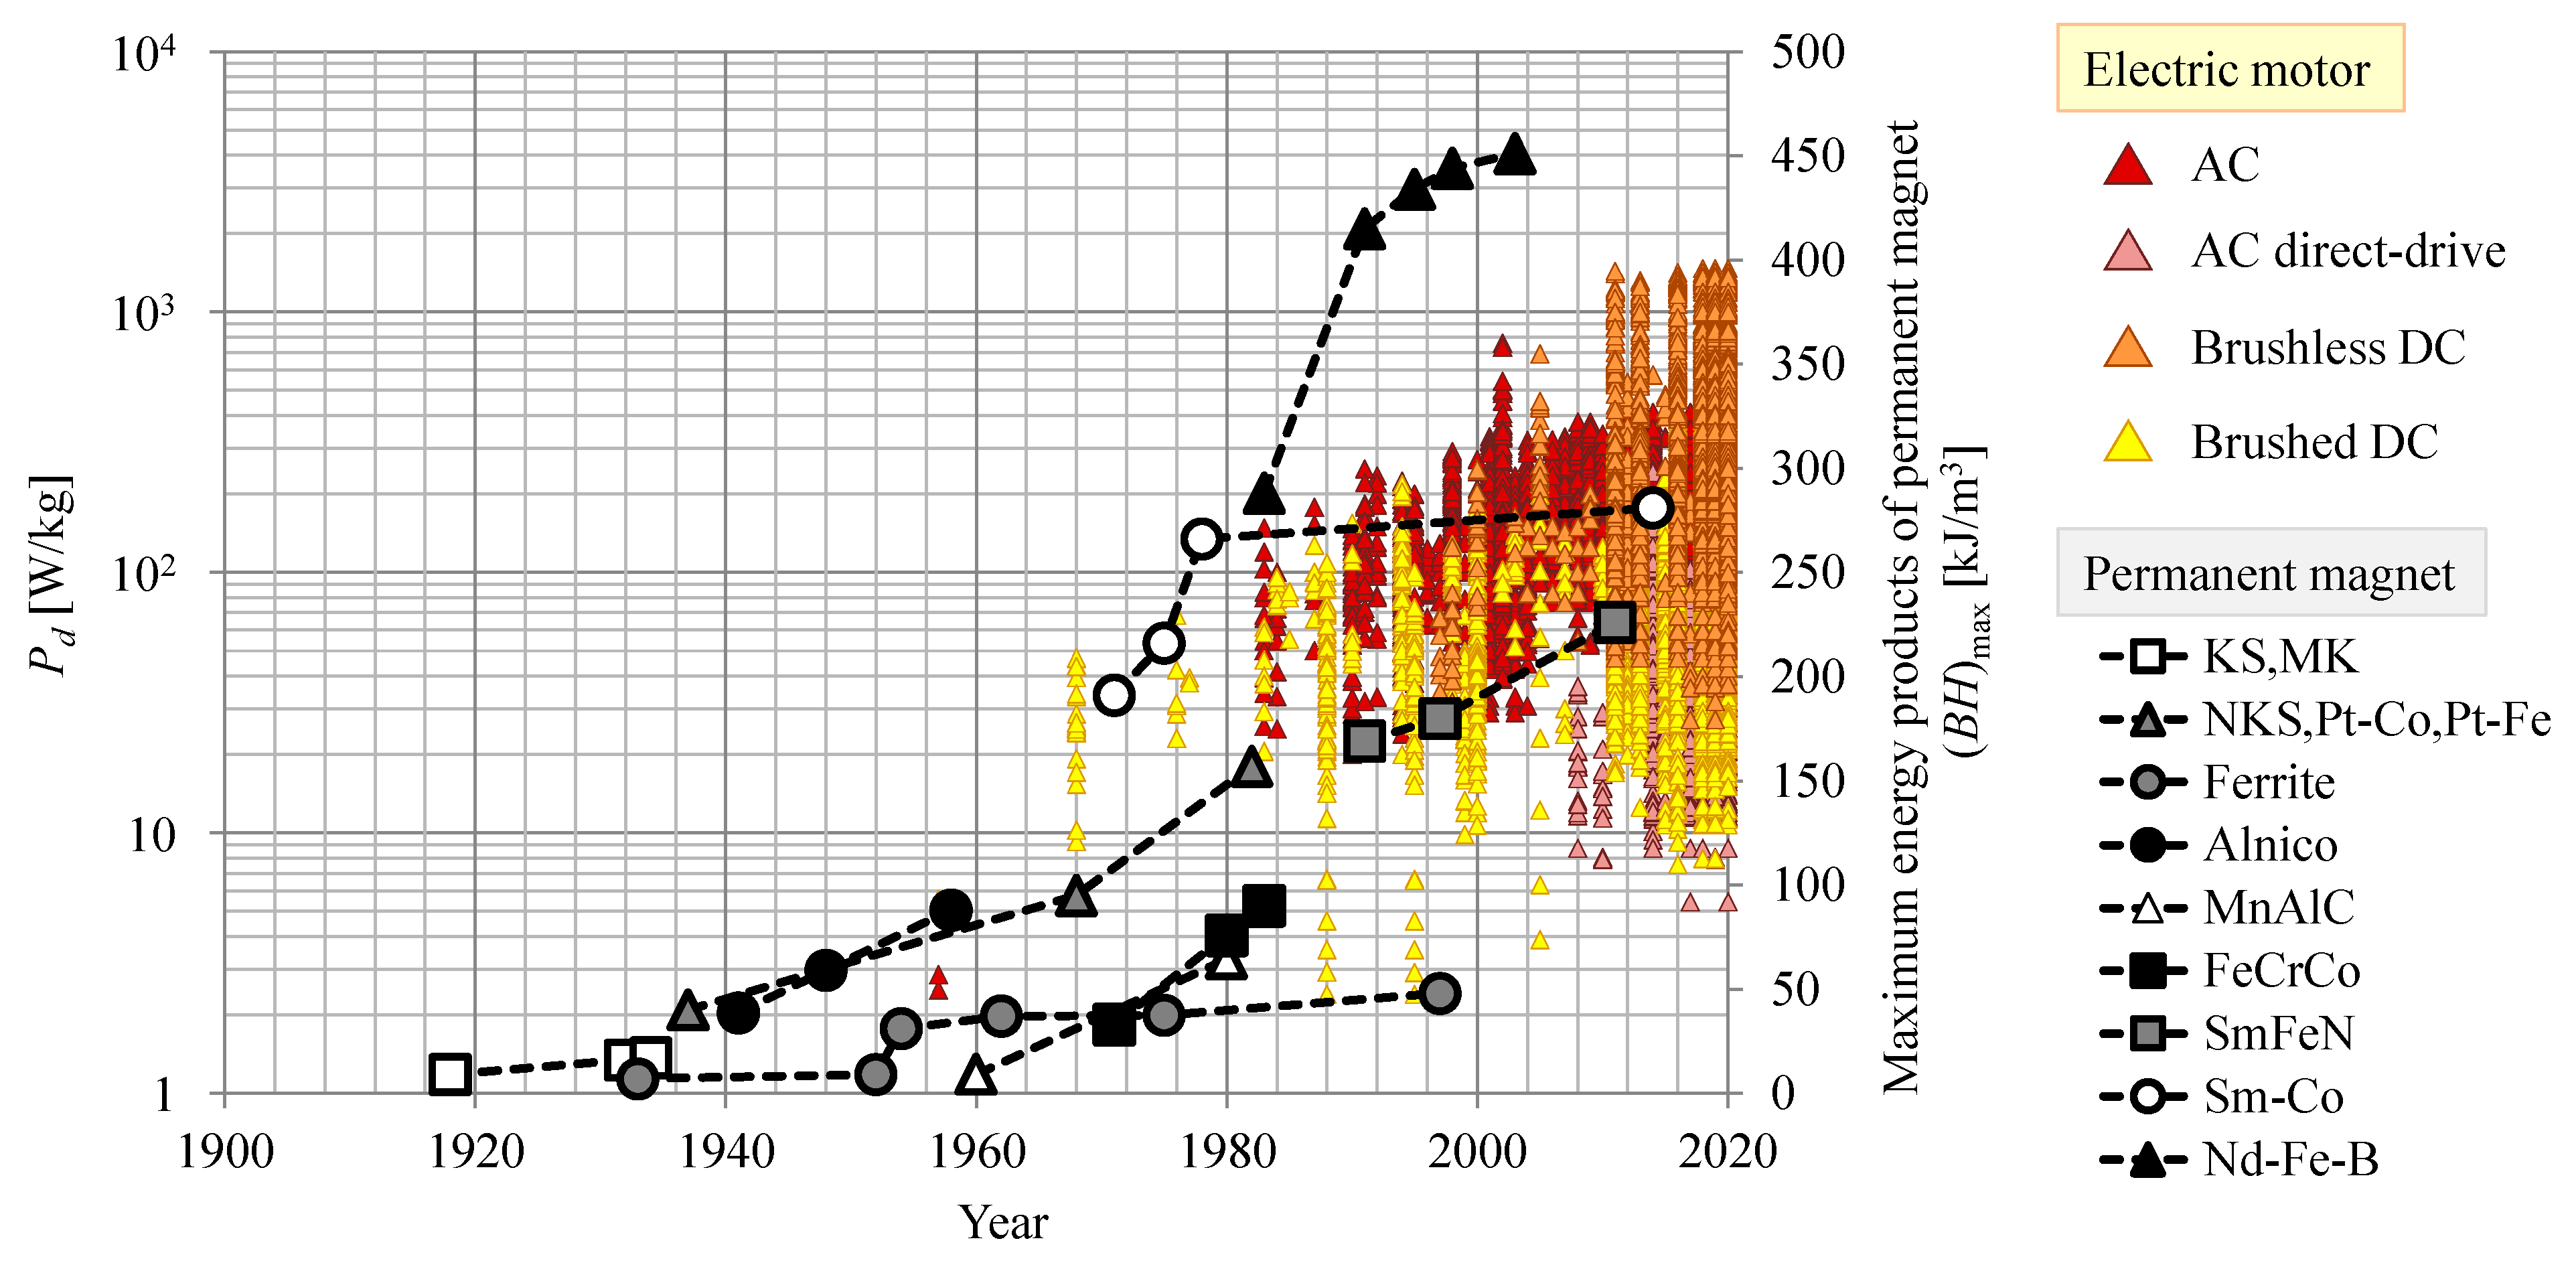
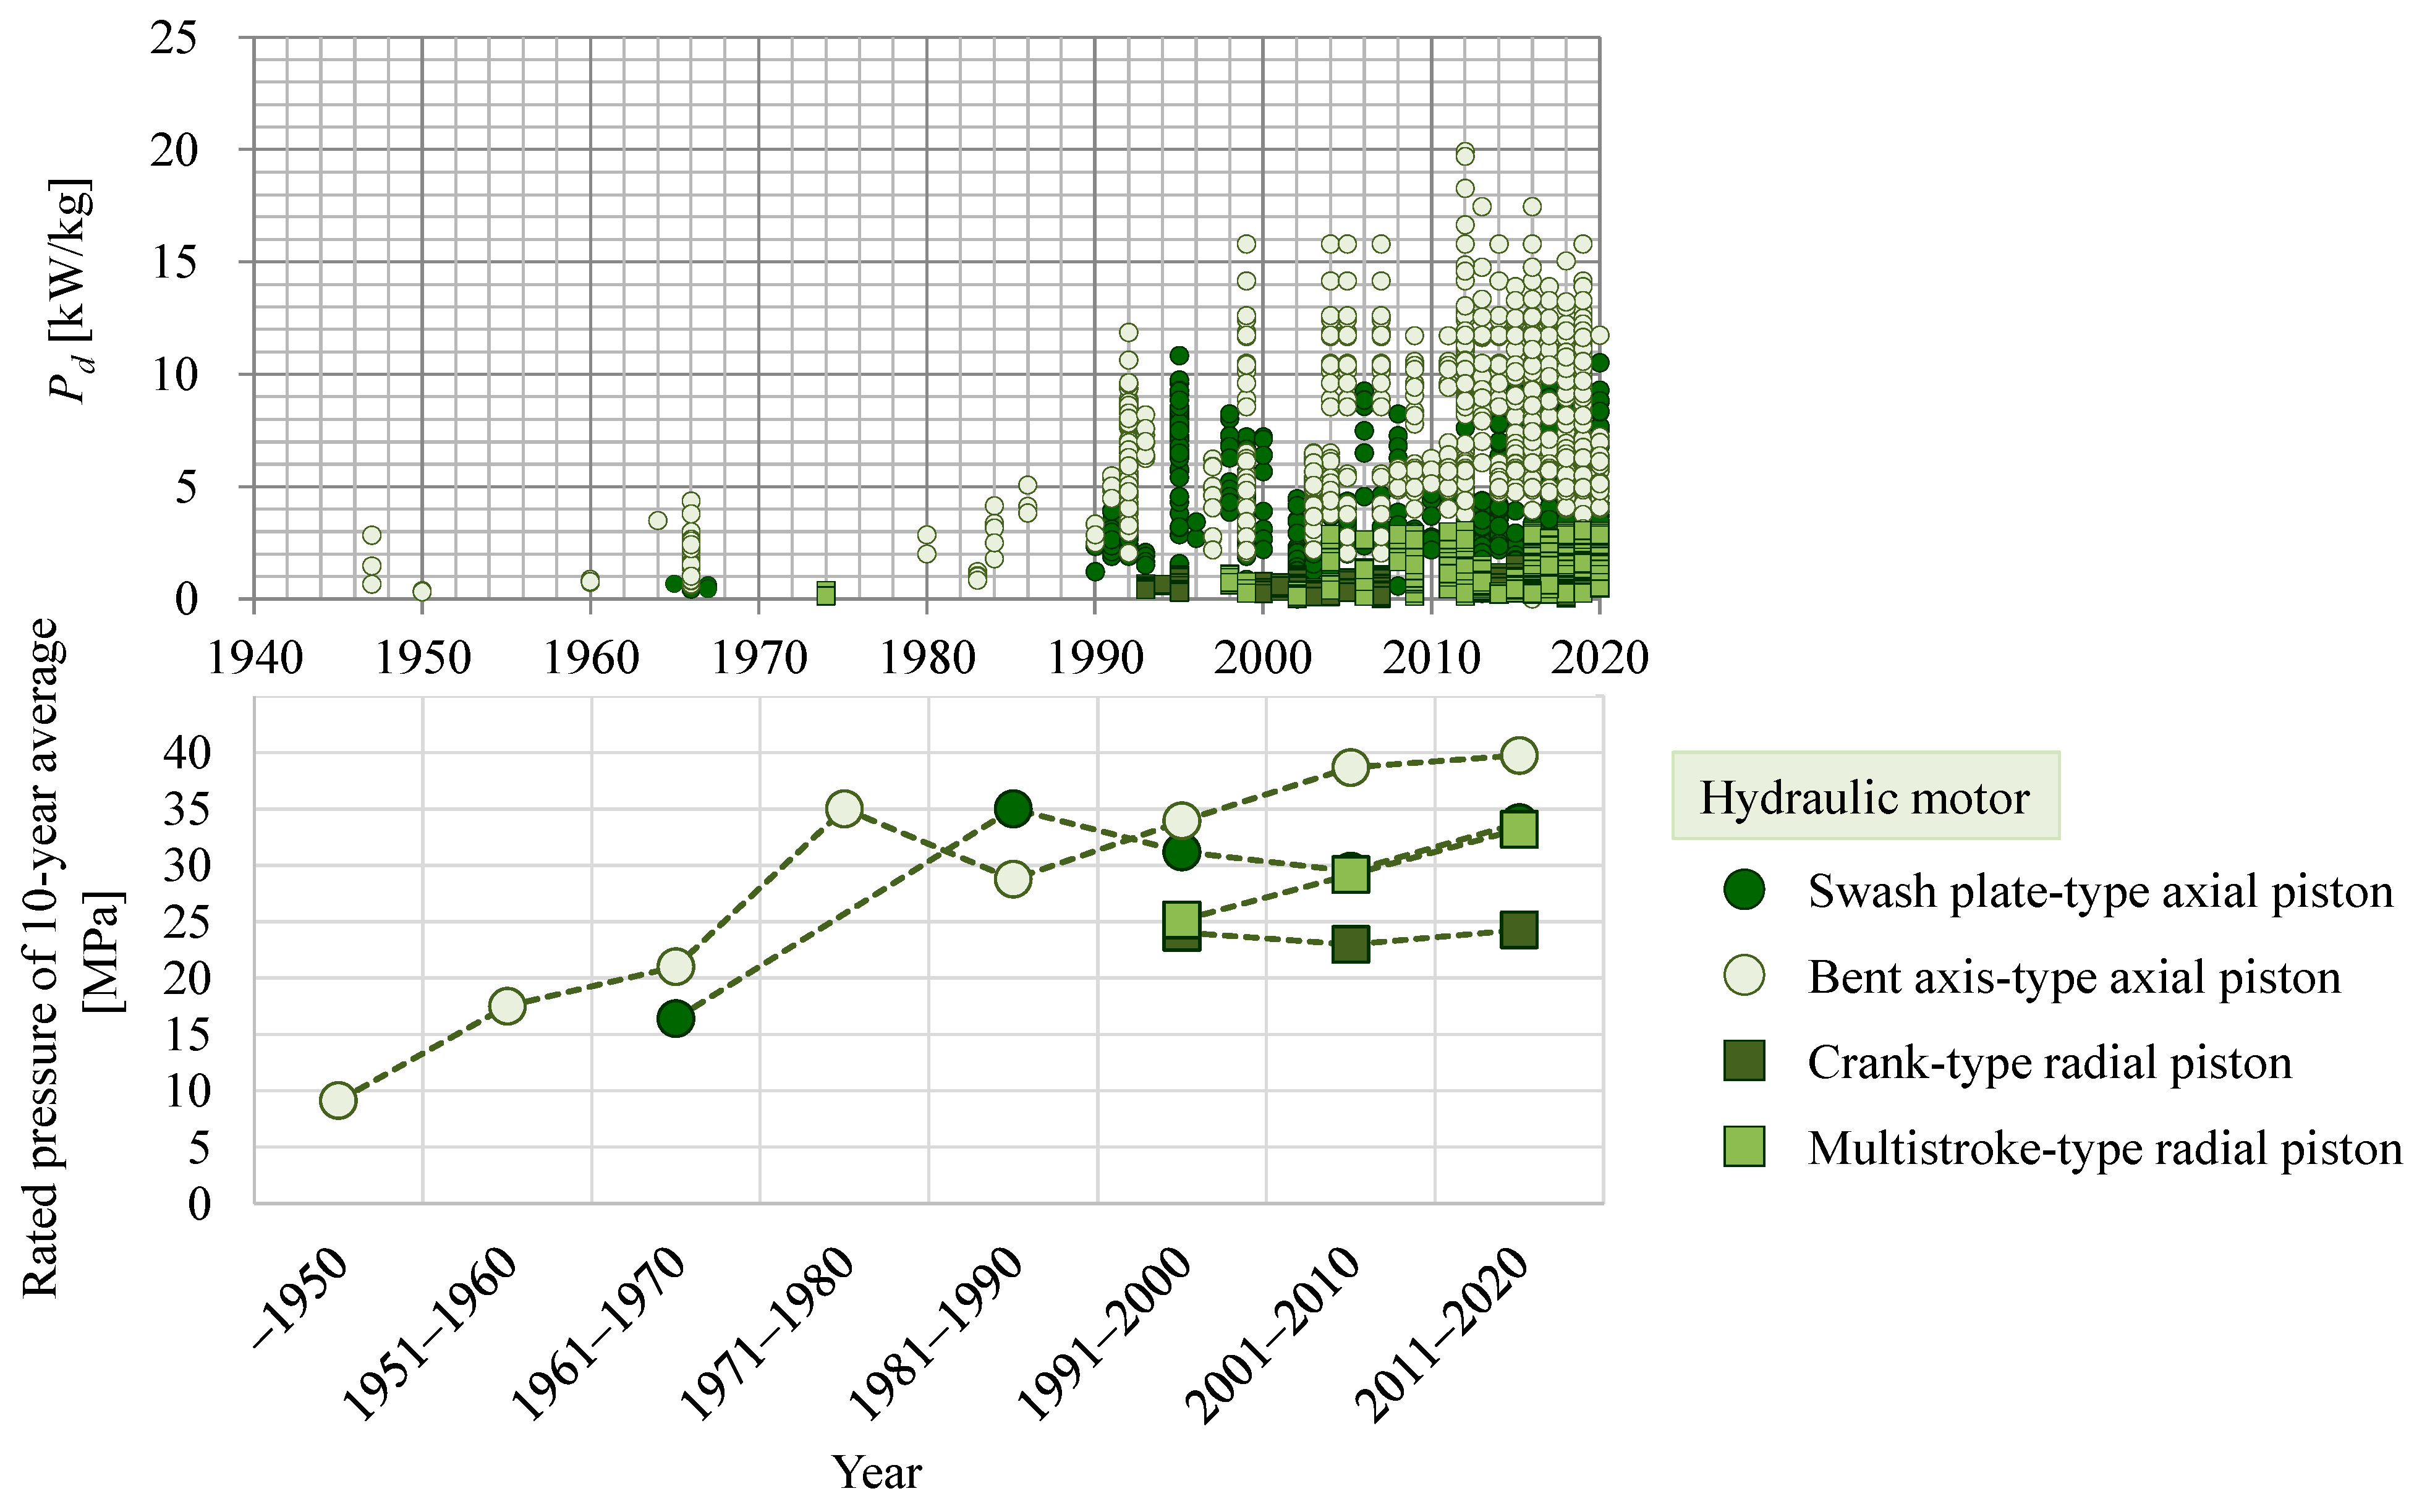
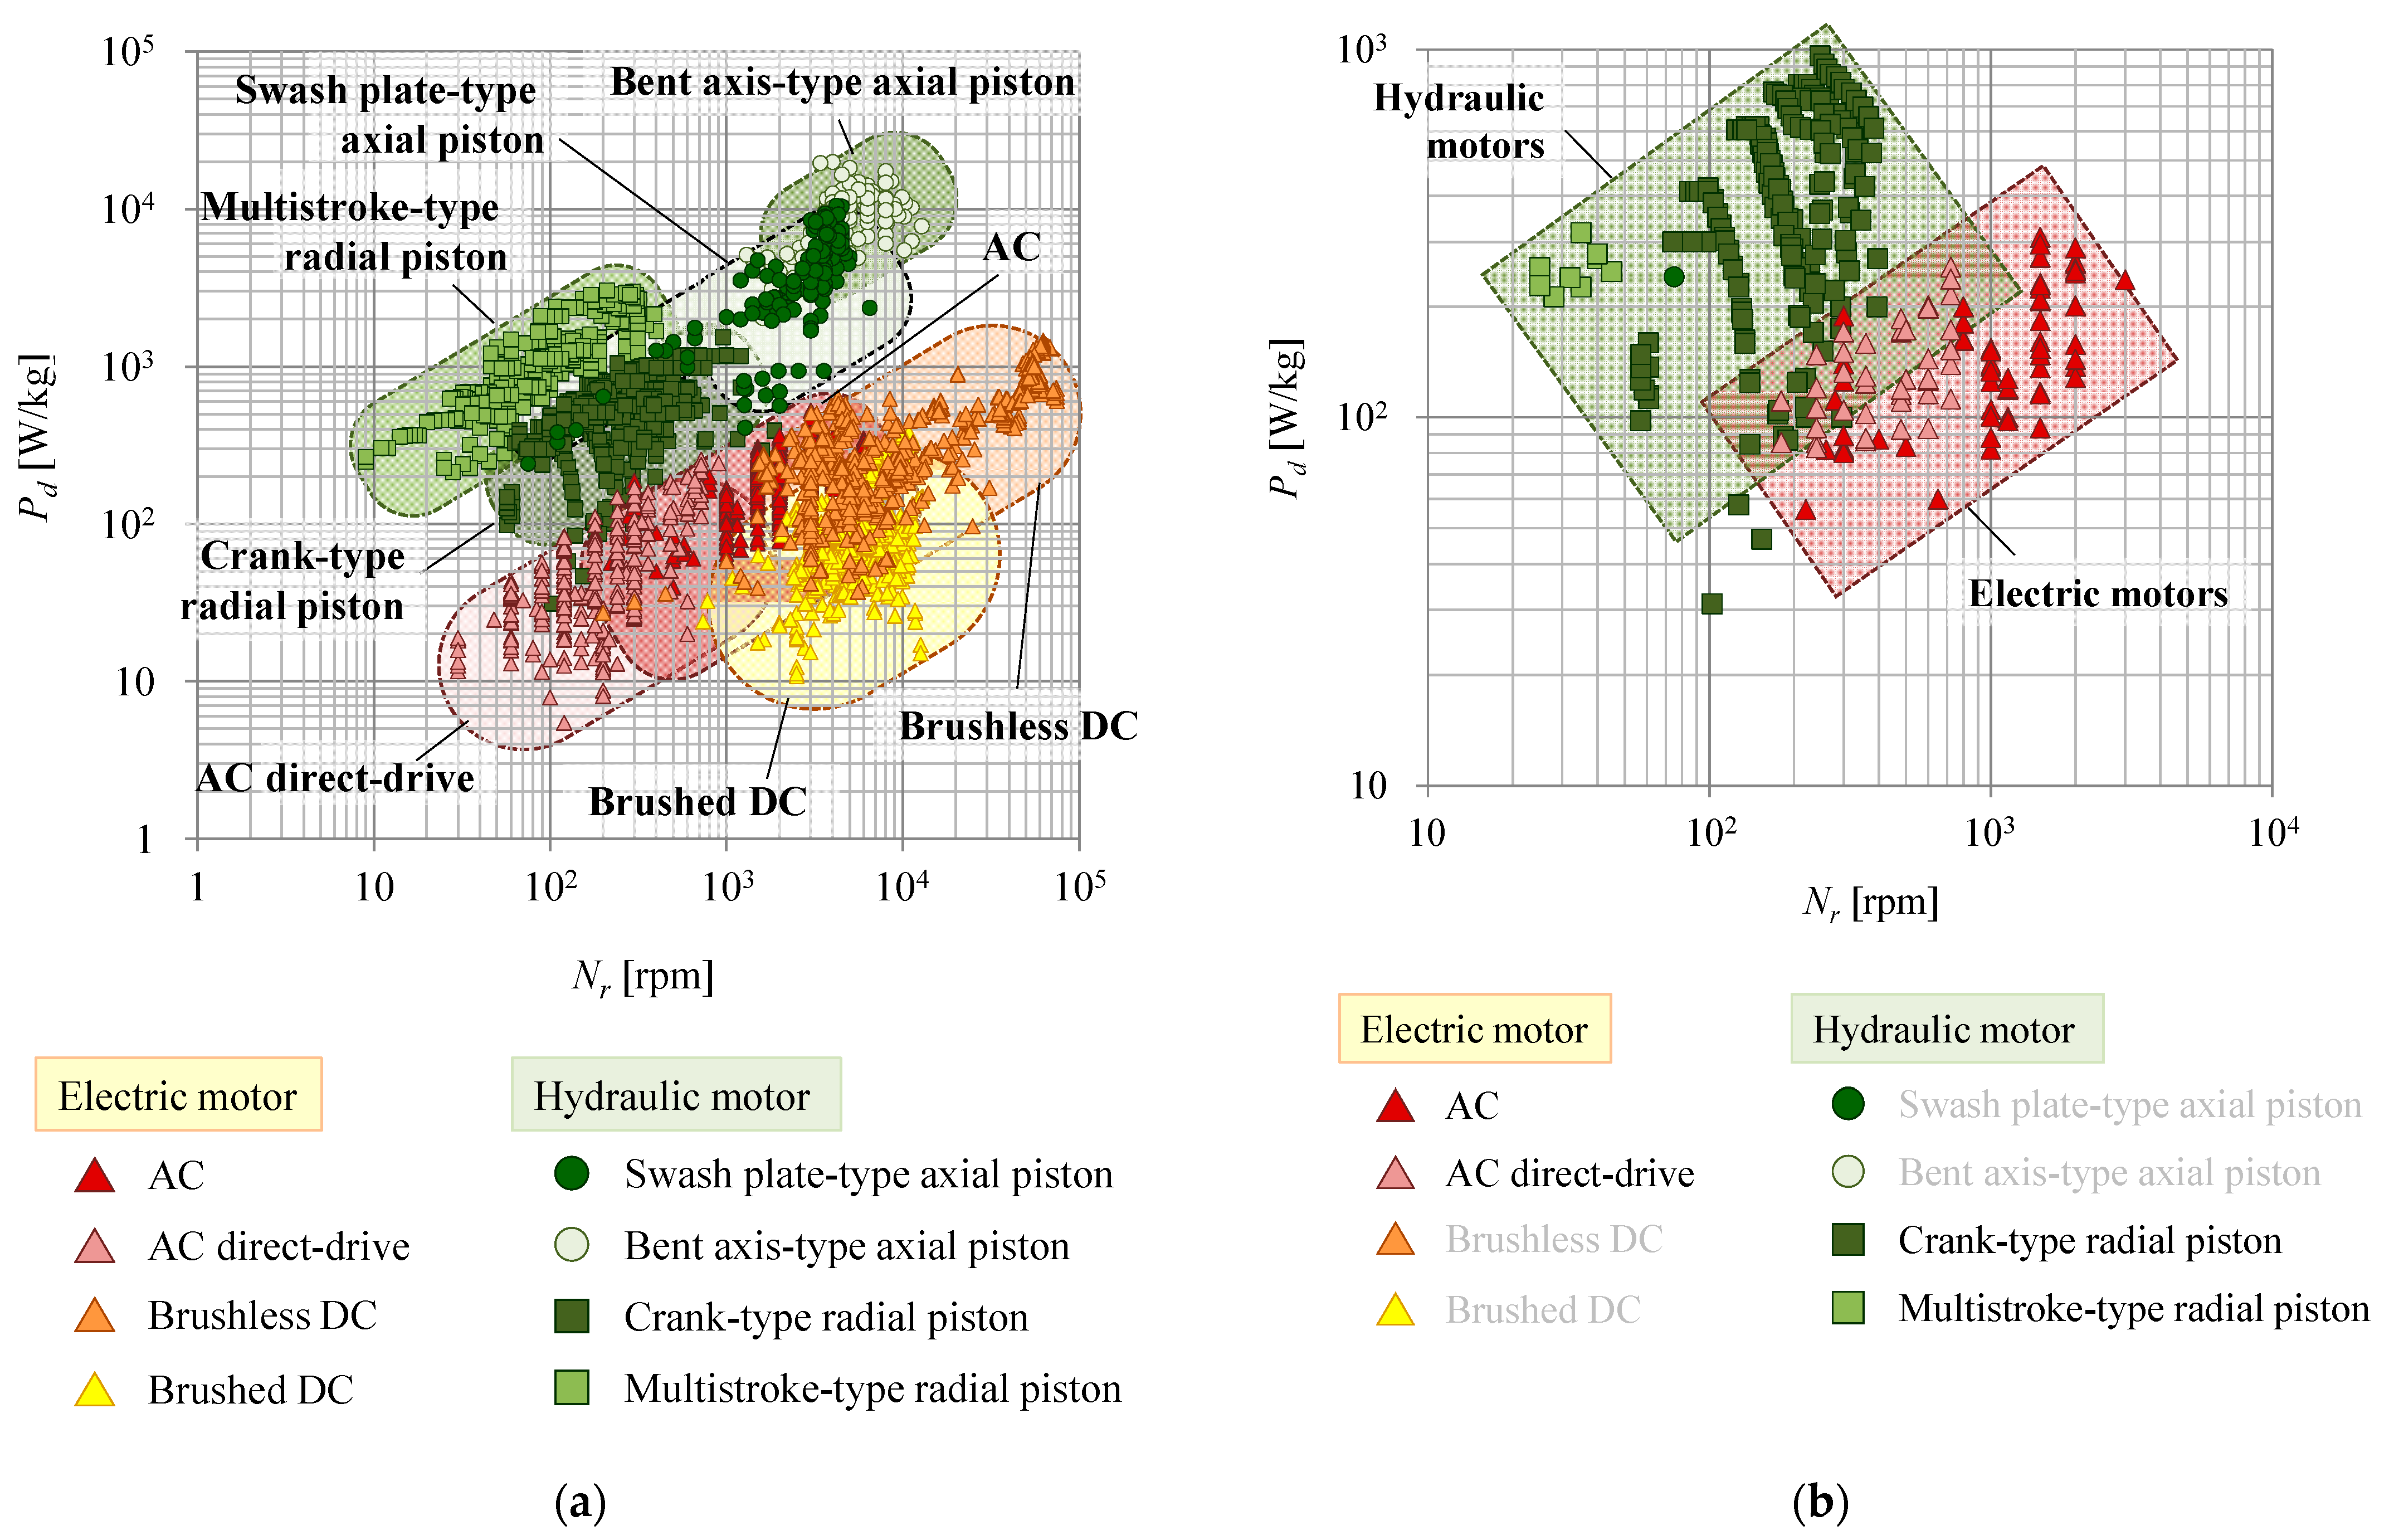
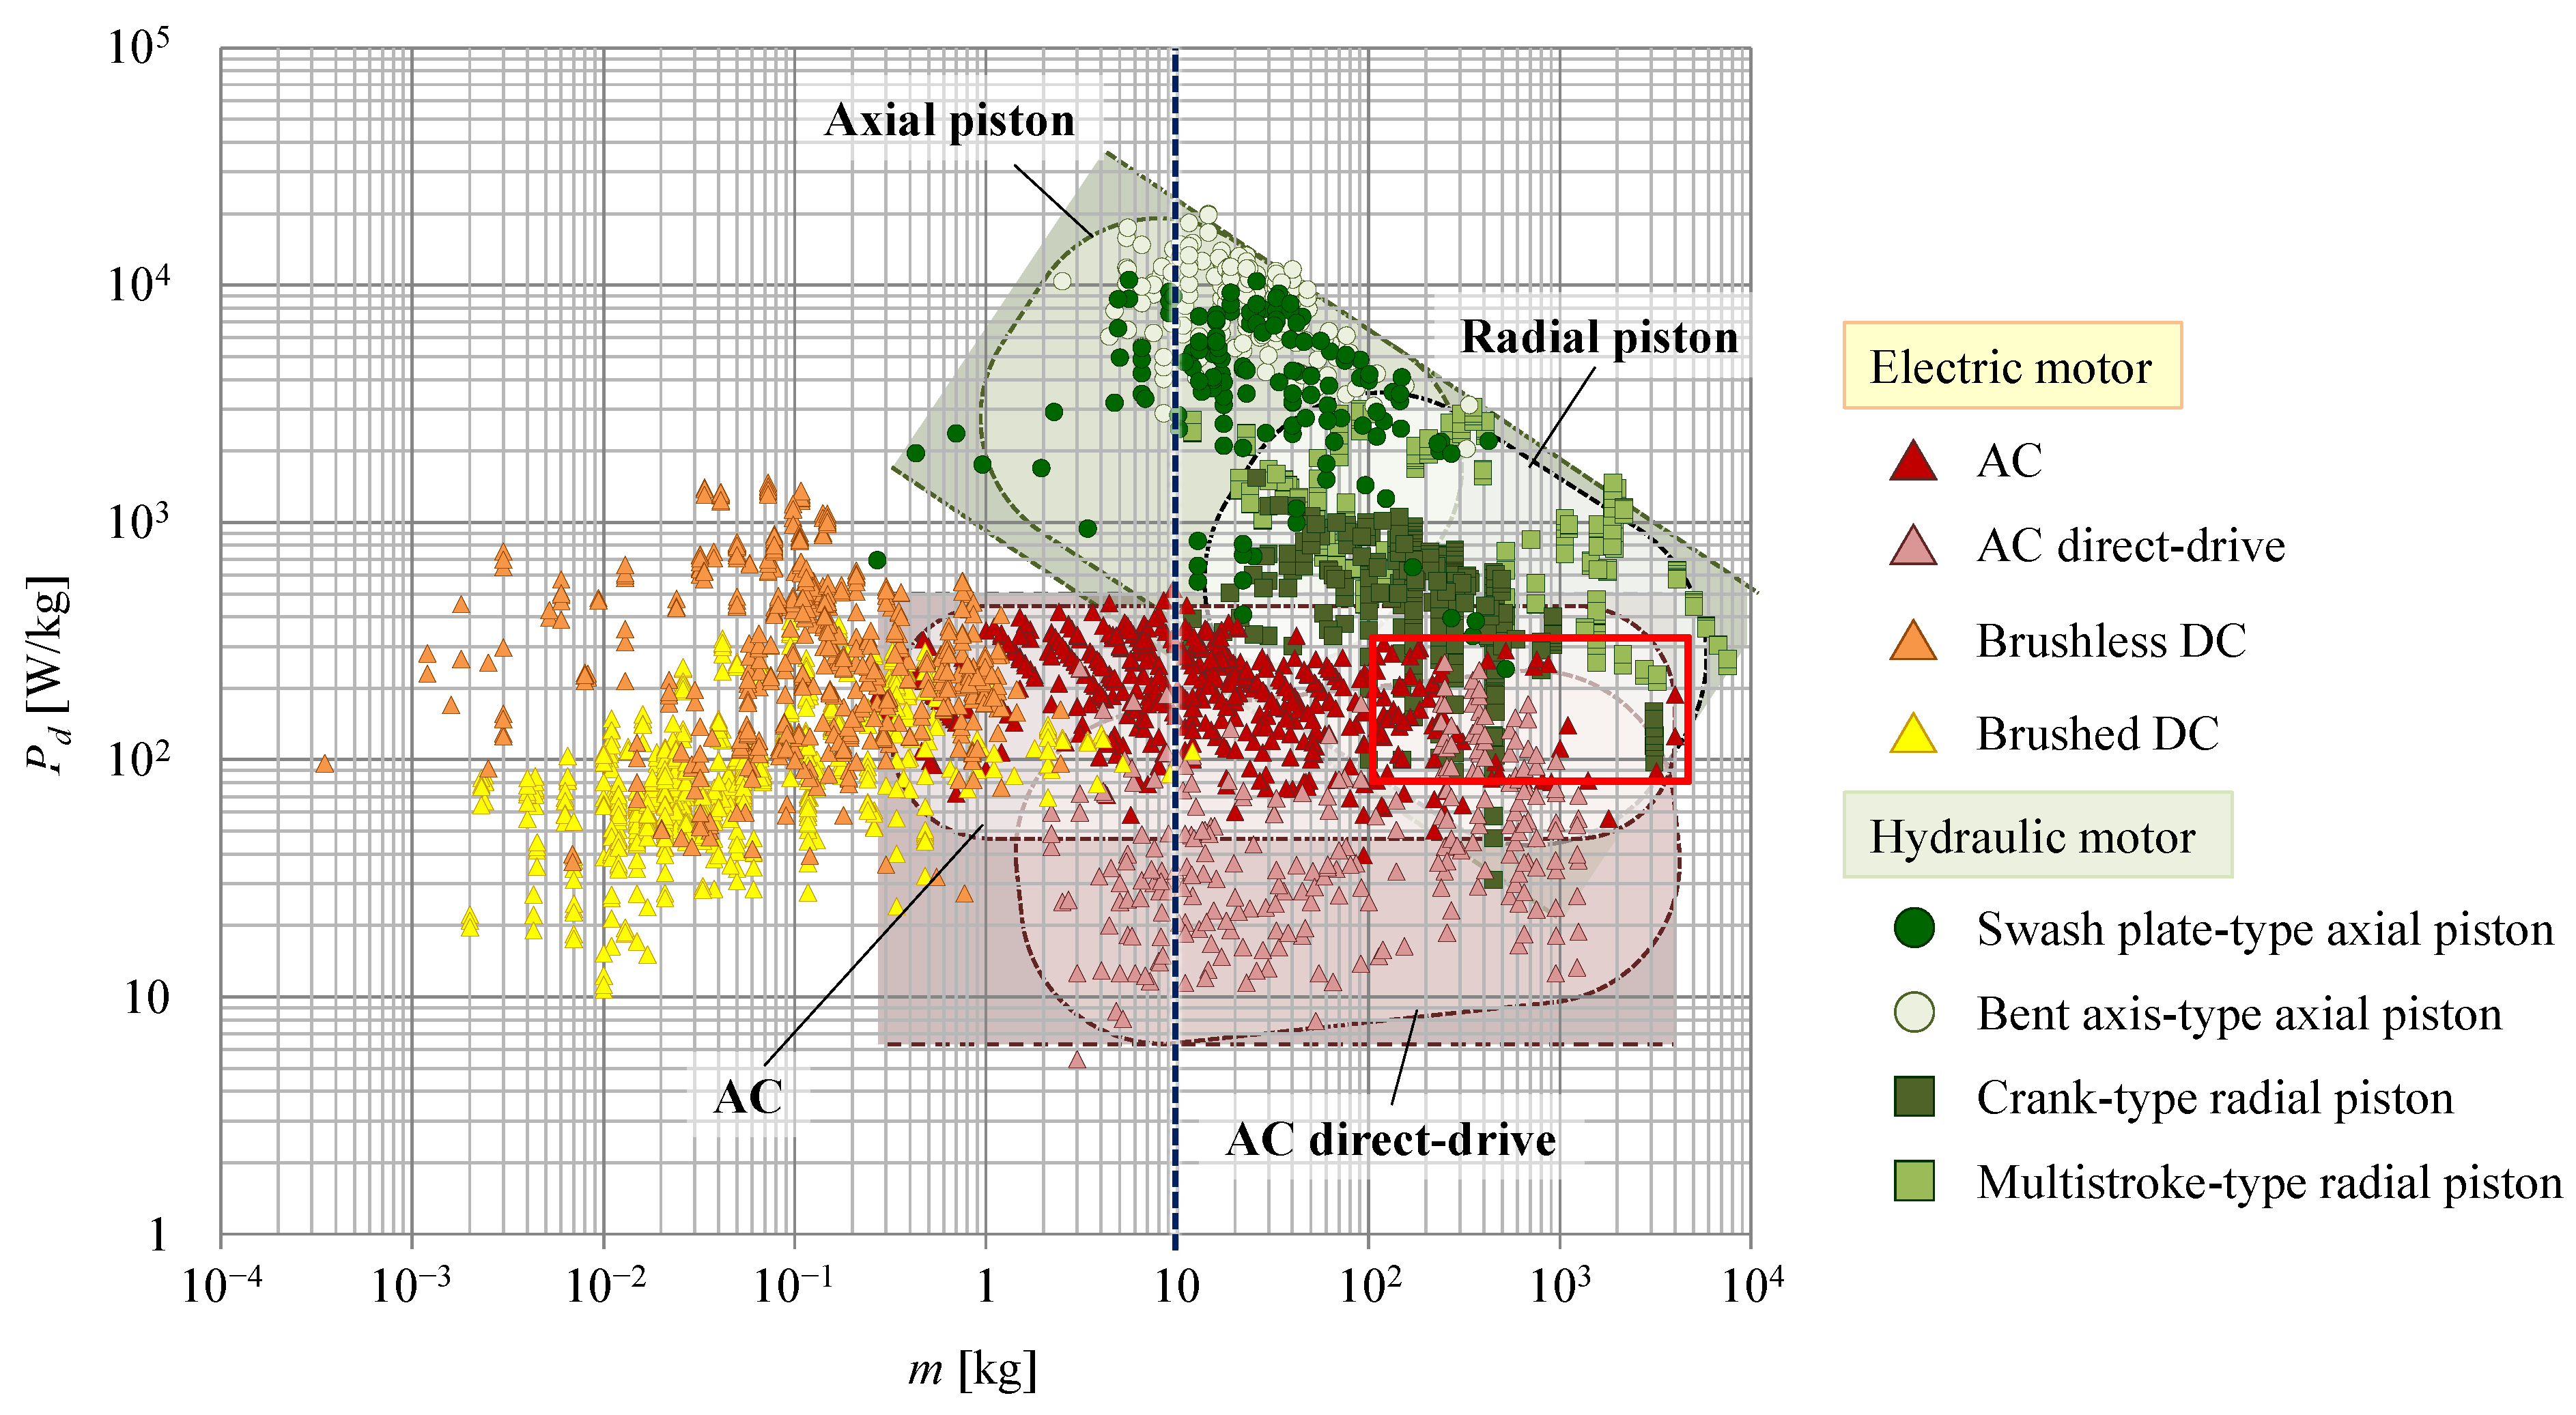
4.1. Power Density

Figure 1 shows the transition of the power densities of hydraulic and electric motors. The horizontal and vertical axes indicate the year in which the motor data were published and the power density of the motor, respectively. Note that the scale of the power density is logarithmic.
Hydraulic motors have a higher power density than electric motors; however, this difference has become progressively smaller over time. Before the 1990s, the power density of hydraulic motors was approximately two orders of magnitude greater than that of electric motors, but the performance of electric motors has dramatically improved over the decades; thus, nowadays, the difference between hydraulic and electric motors is only around one order of magnitude.
One of the main factors accounting for the improved performance of electric motors is the increase in the strength of permanent magnets. The transition of the maximum energy products of permanent magnets, together with the power density of electric motors, is shown in Figure 2. It is clear that the power density of the electric motors increased following the development of permanent magnets with high-maximum-energy products. In particular, the advent of the neodymium magnet, developed by Sagawa in 1984 [34], resulted in major improvements in motor performance. Since the 1970s, the performance of electric motors has increased as social needs, such as resource and energy conservation and improved productivity, have increased, accelerating the shift away from hydraulic motors, which had previously been mainstream, to electric motors. In addition, although the brushed DC motor had initially been widely used, AC motors became more common because of improvements in the performance of microcomputers and circuit elements used in inverters during the 1980s [35]. Moreover, during the 1990s, the power density of the AC motors was further enhanced by improvement of the winding method and innovative changes in the design and structure of motors [36]. Another remarkable point in this figure is the development of the brushless DC motor. The power density of brushless DC motors, which have been popular since the 1990s, has increased more than ten times in approximately 20 years, and brushless DC motors are now the electric motors with the highest power density.
Although the progress in electric motors is remarkable, the power density of hydraulic motors has also increased over the last few decades. The increased power density of hydraulic motors is linked to their increasing rated pressure. Figure 3 shows the power density of the hydraulic motors plotted in Figure 1, along with their 10-year average rated pressure. In this figure, the scale is not logarithmic. The rated pressures of hydraulic motors have increased by approximately three times since the 1940s, and this has been accompanied by an increase in power density.
Although the power densities of electric and hydraulic motors have increased over the past several decades, it is also clear that the performance of electric motors has not changed significantly in the last 10 years, whereas hydraulic motor performance has changed little in the last 30 years.

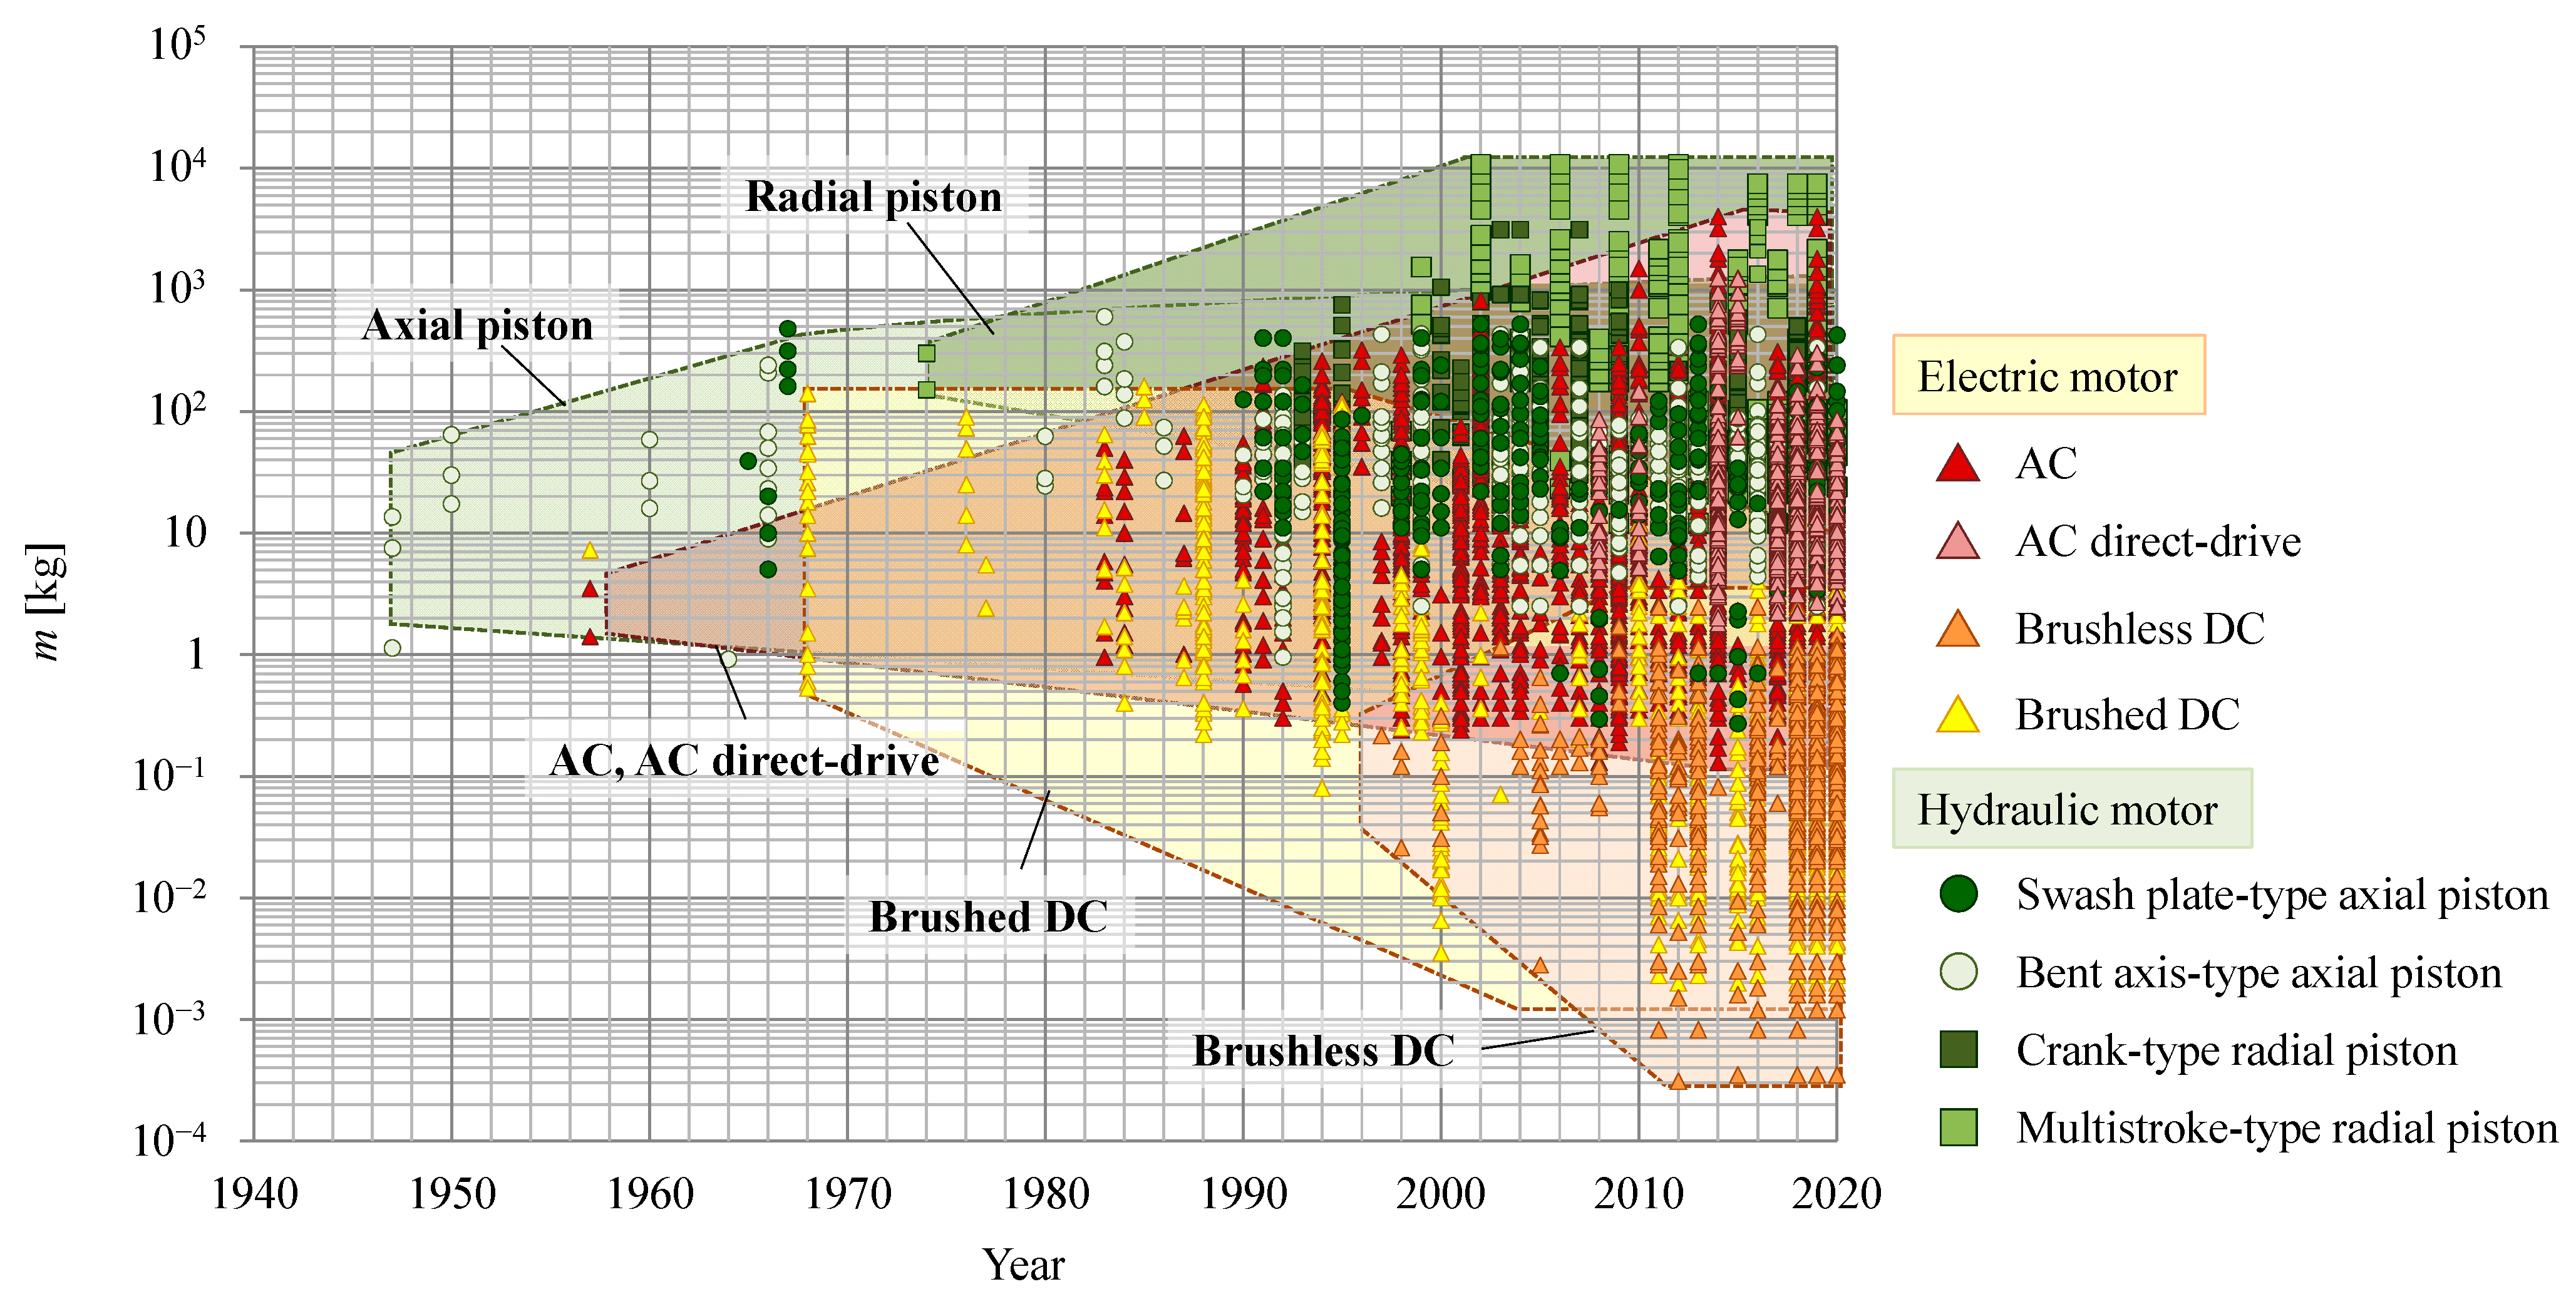
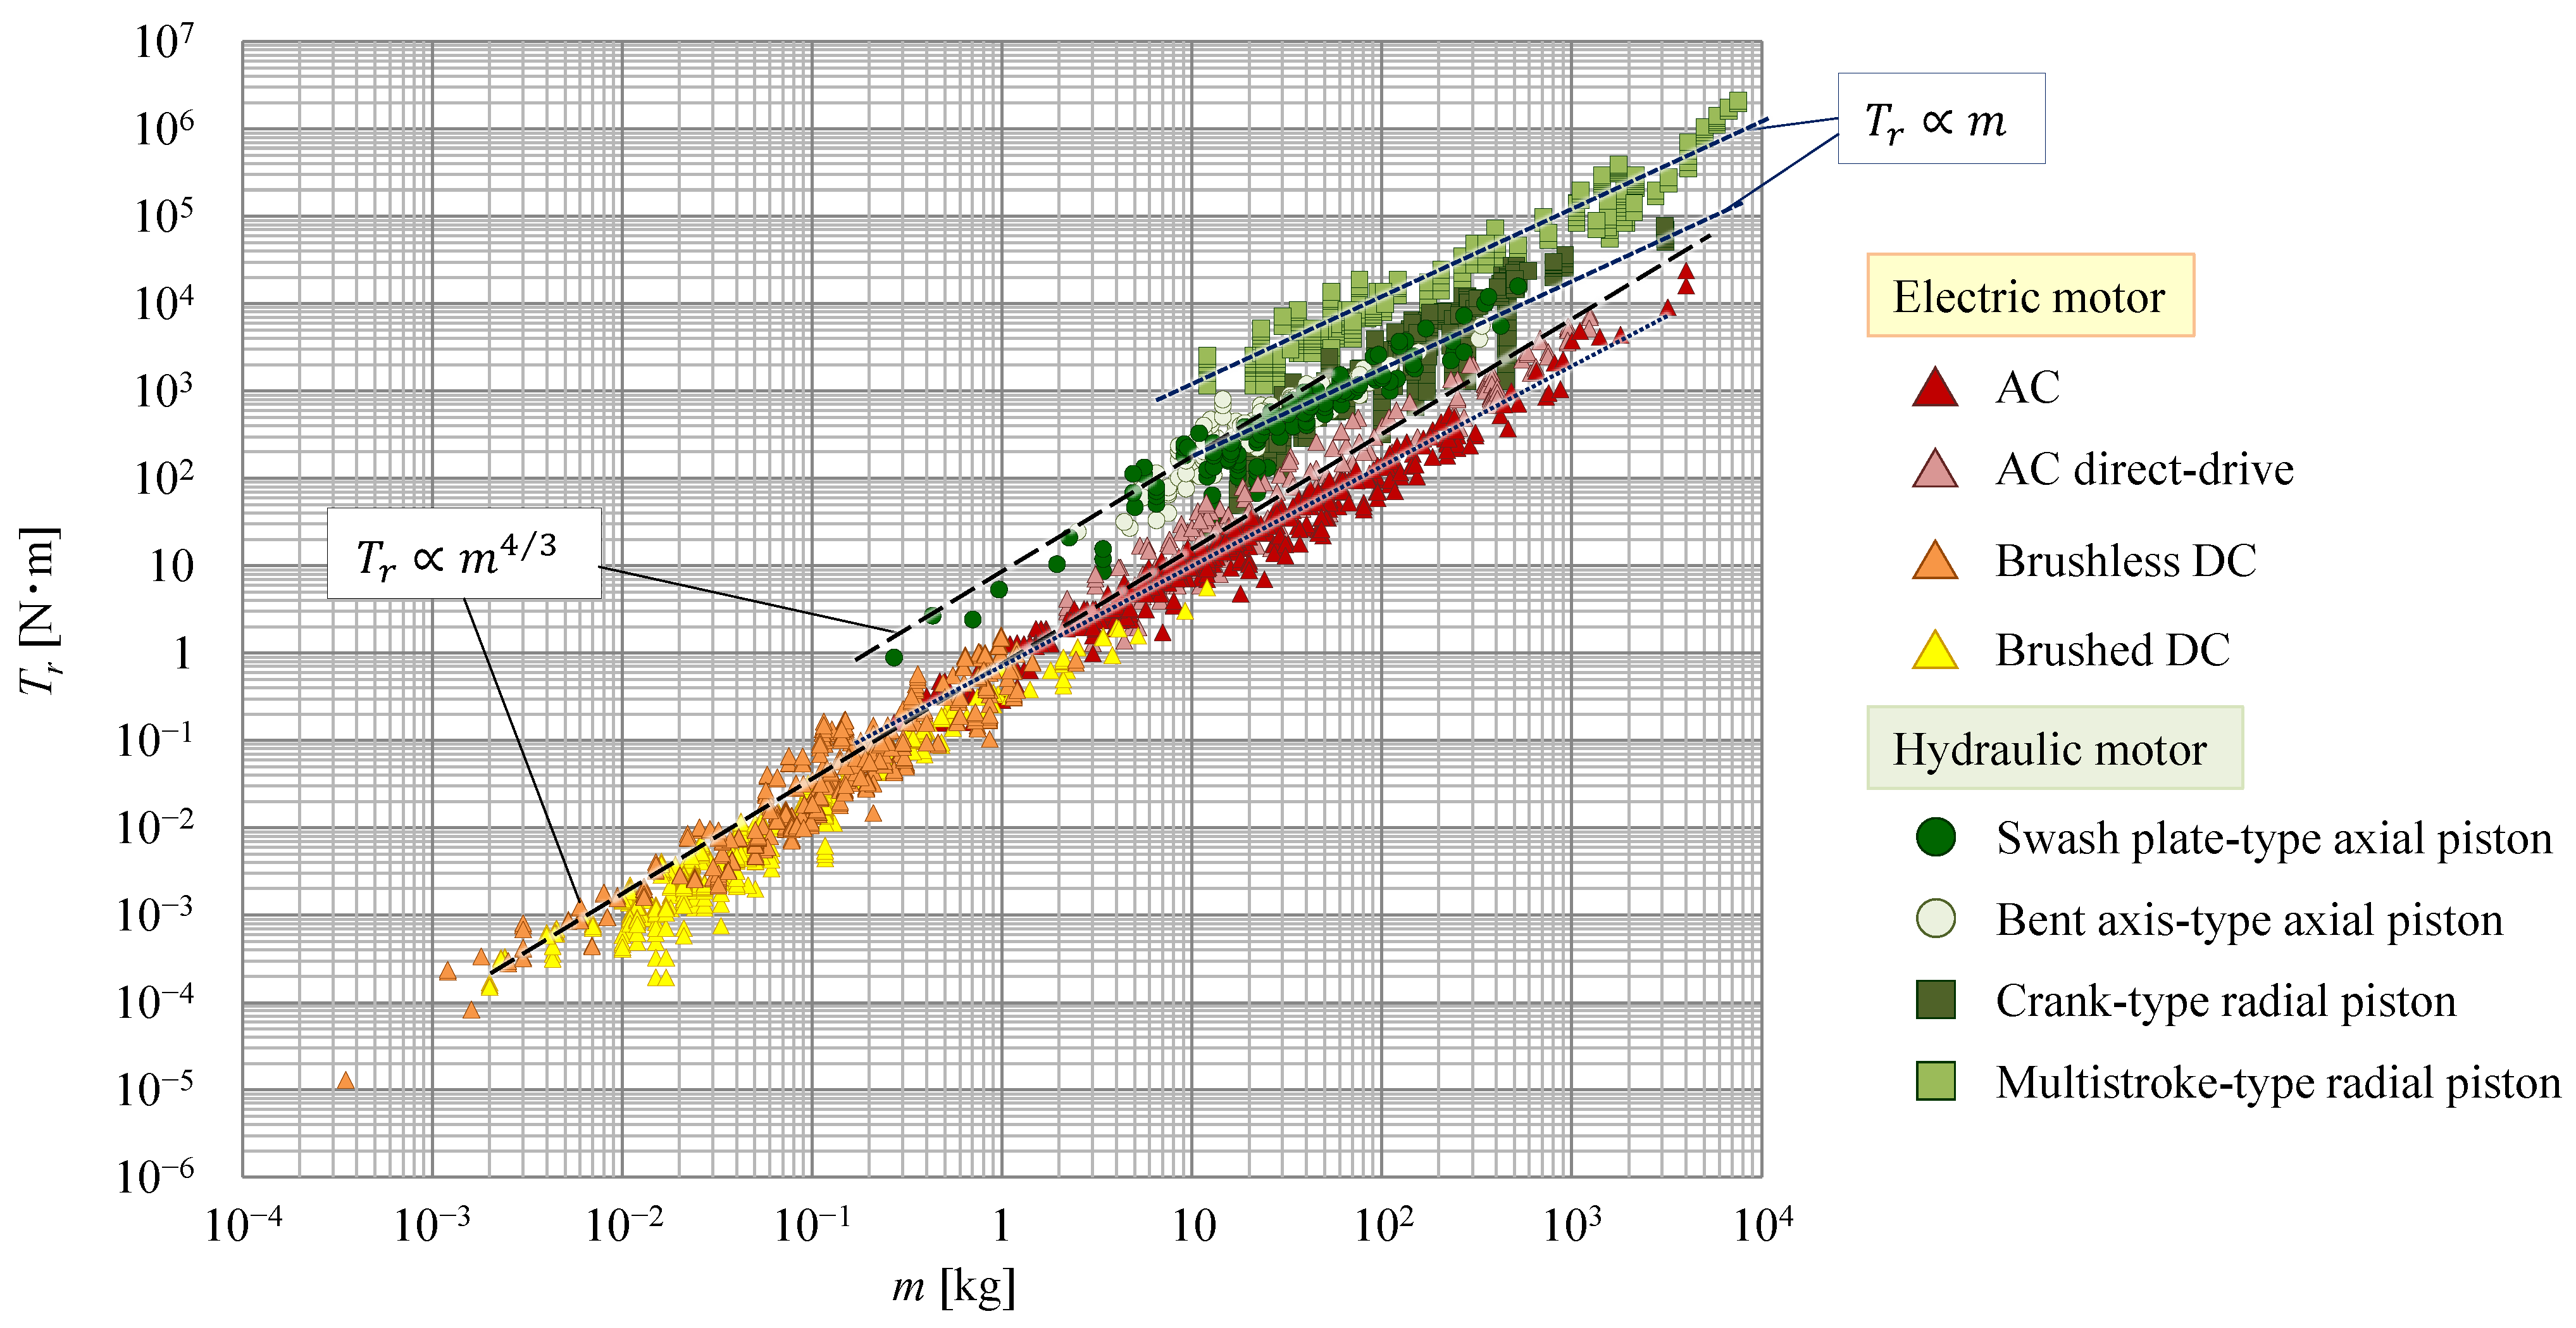
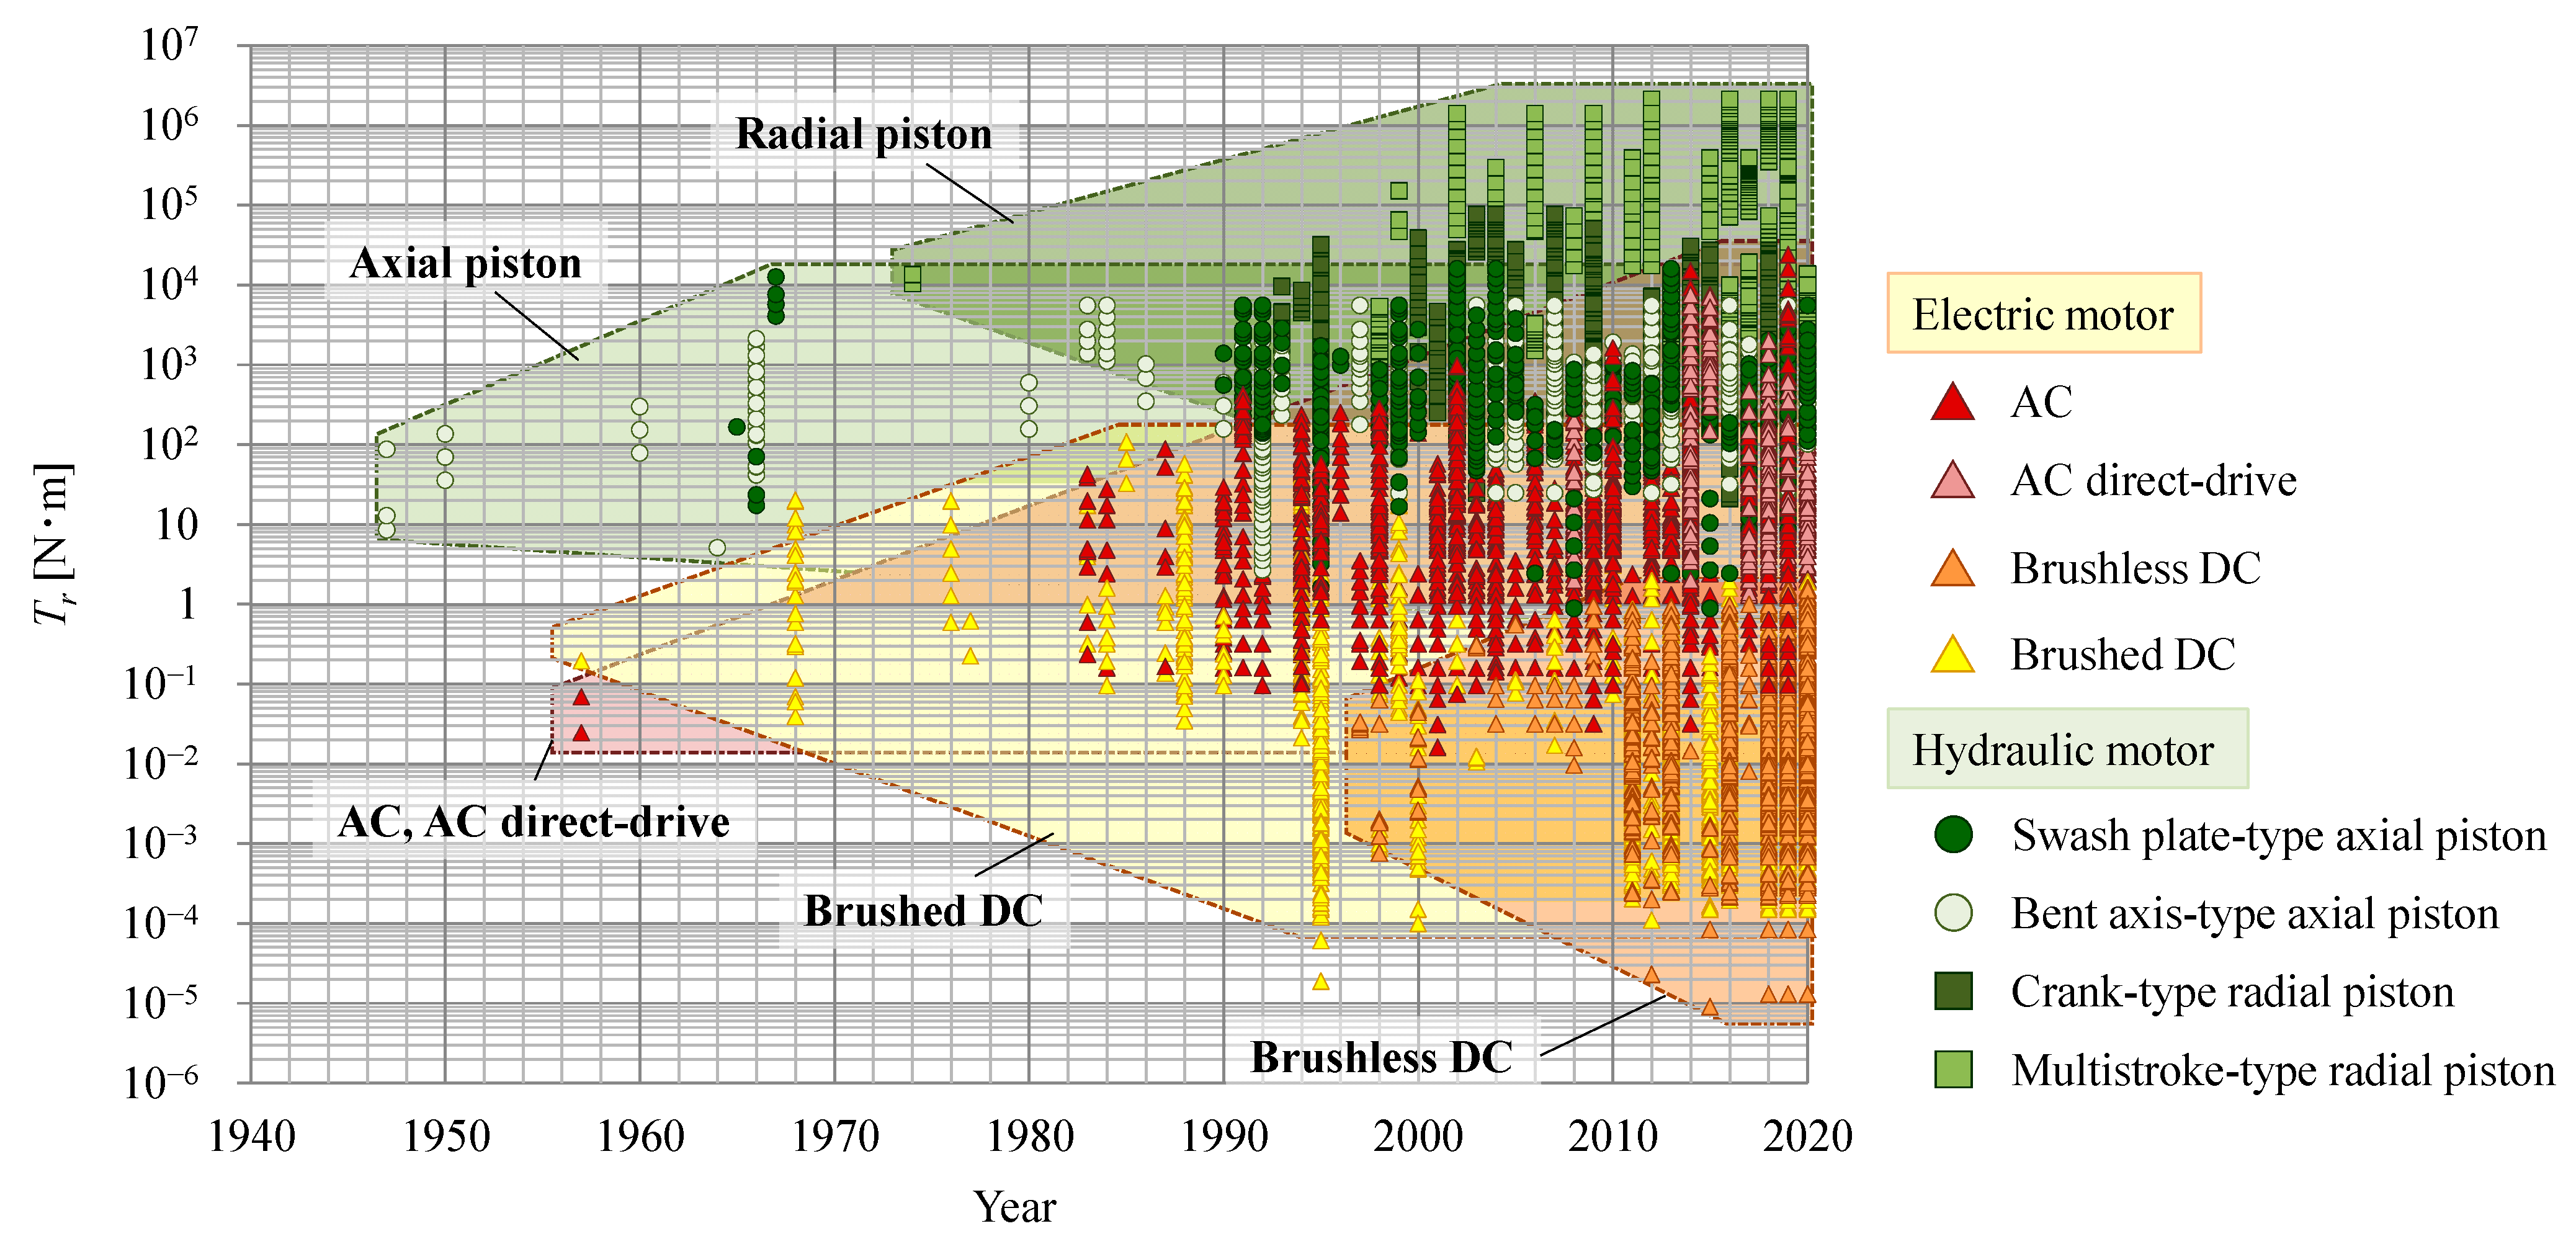
4.2. Weight and Torque

The transitions of motor weight and torque are shown in Figure 4 and Figure 5, respectively. Since the 1990s, electric motors, especially brushless DC motors, have become significantly lighter. It is clear that the aforementioned technological improvements in electric motors have substantively contributed to their miniaturization, and, consequently, the power density of electric motors has increased. In addition, with regard to AC motors, their weights have become both lighter and heavier; indeed, some are comparable to the heaviest hydraulic motors. It can thus be inferred that one of the major factors behind the development of heavy electric motors was an increased demand for the electrification of hydraulic systems. However, heavy electric motors have less torque than comparable hydraulic motors. Although large electric motors with high power have been developed, it remains difficult for modern electric motors to produce as much force as comparable hydraulic motors. Regarding hydraulic motors, the use of such relatively large motors has not changed for many years, and their weight and rated torque have not changed significantly. Small hydraulic motors less than 1 kg in weight have also been developed but are relatively few.

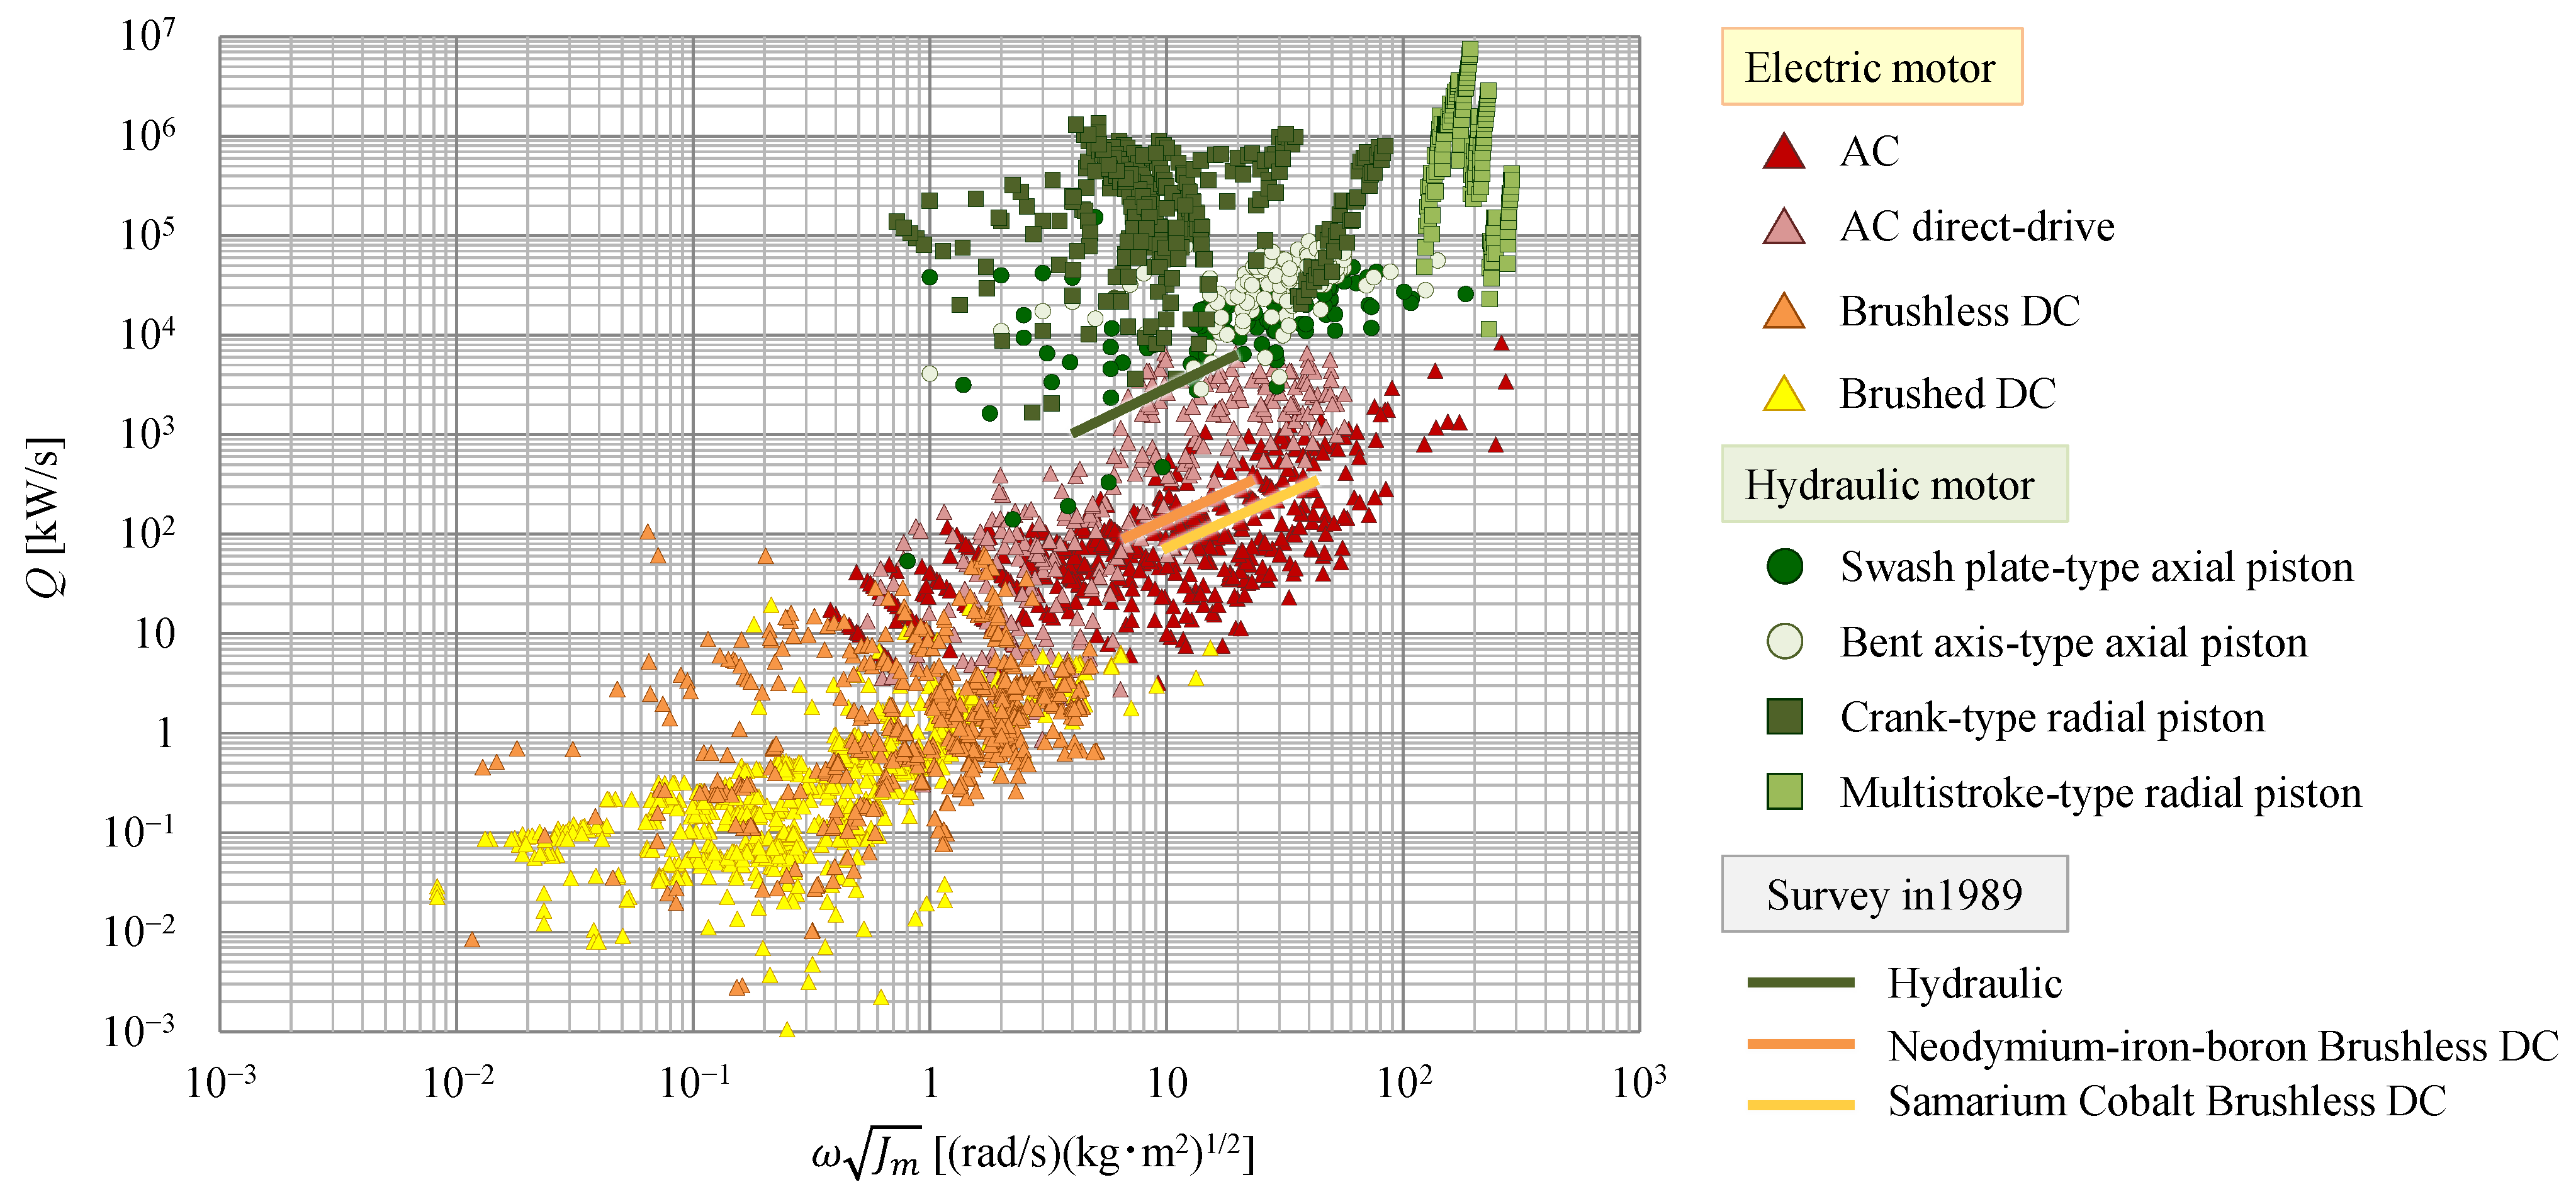
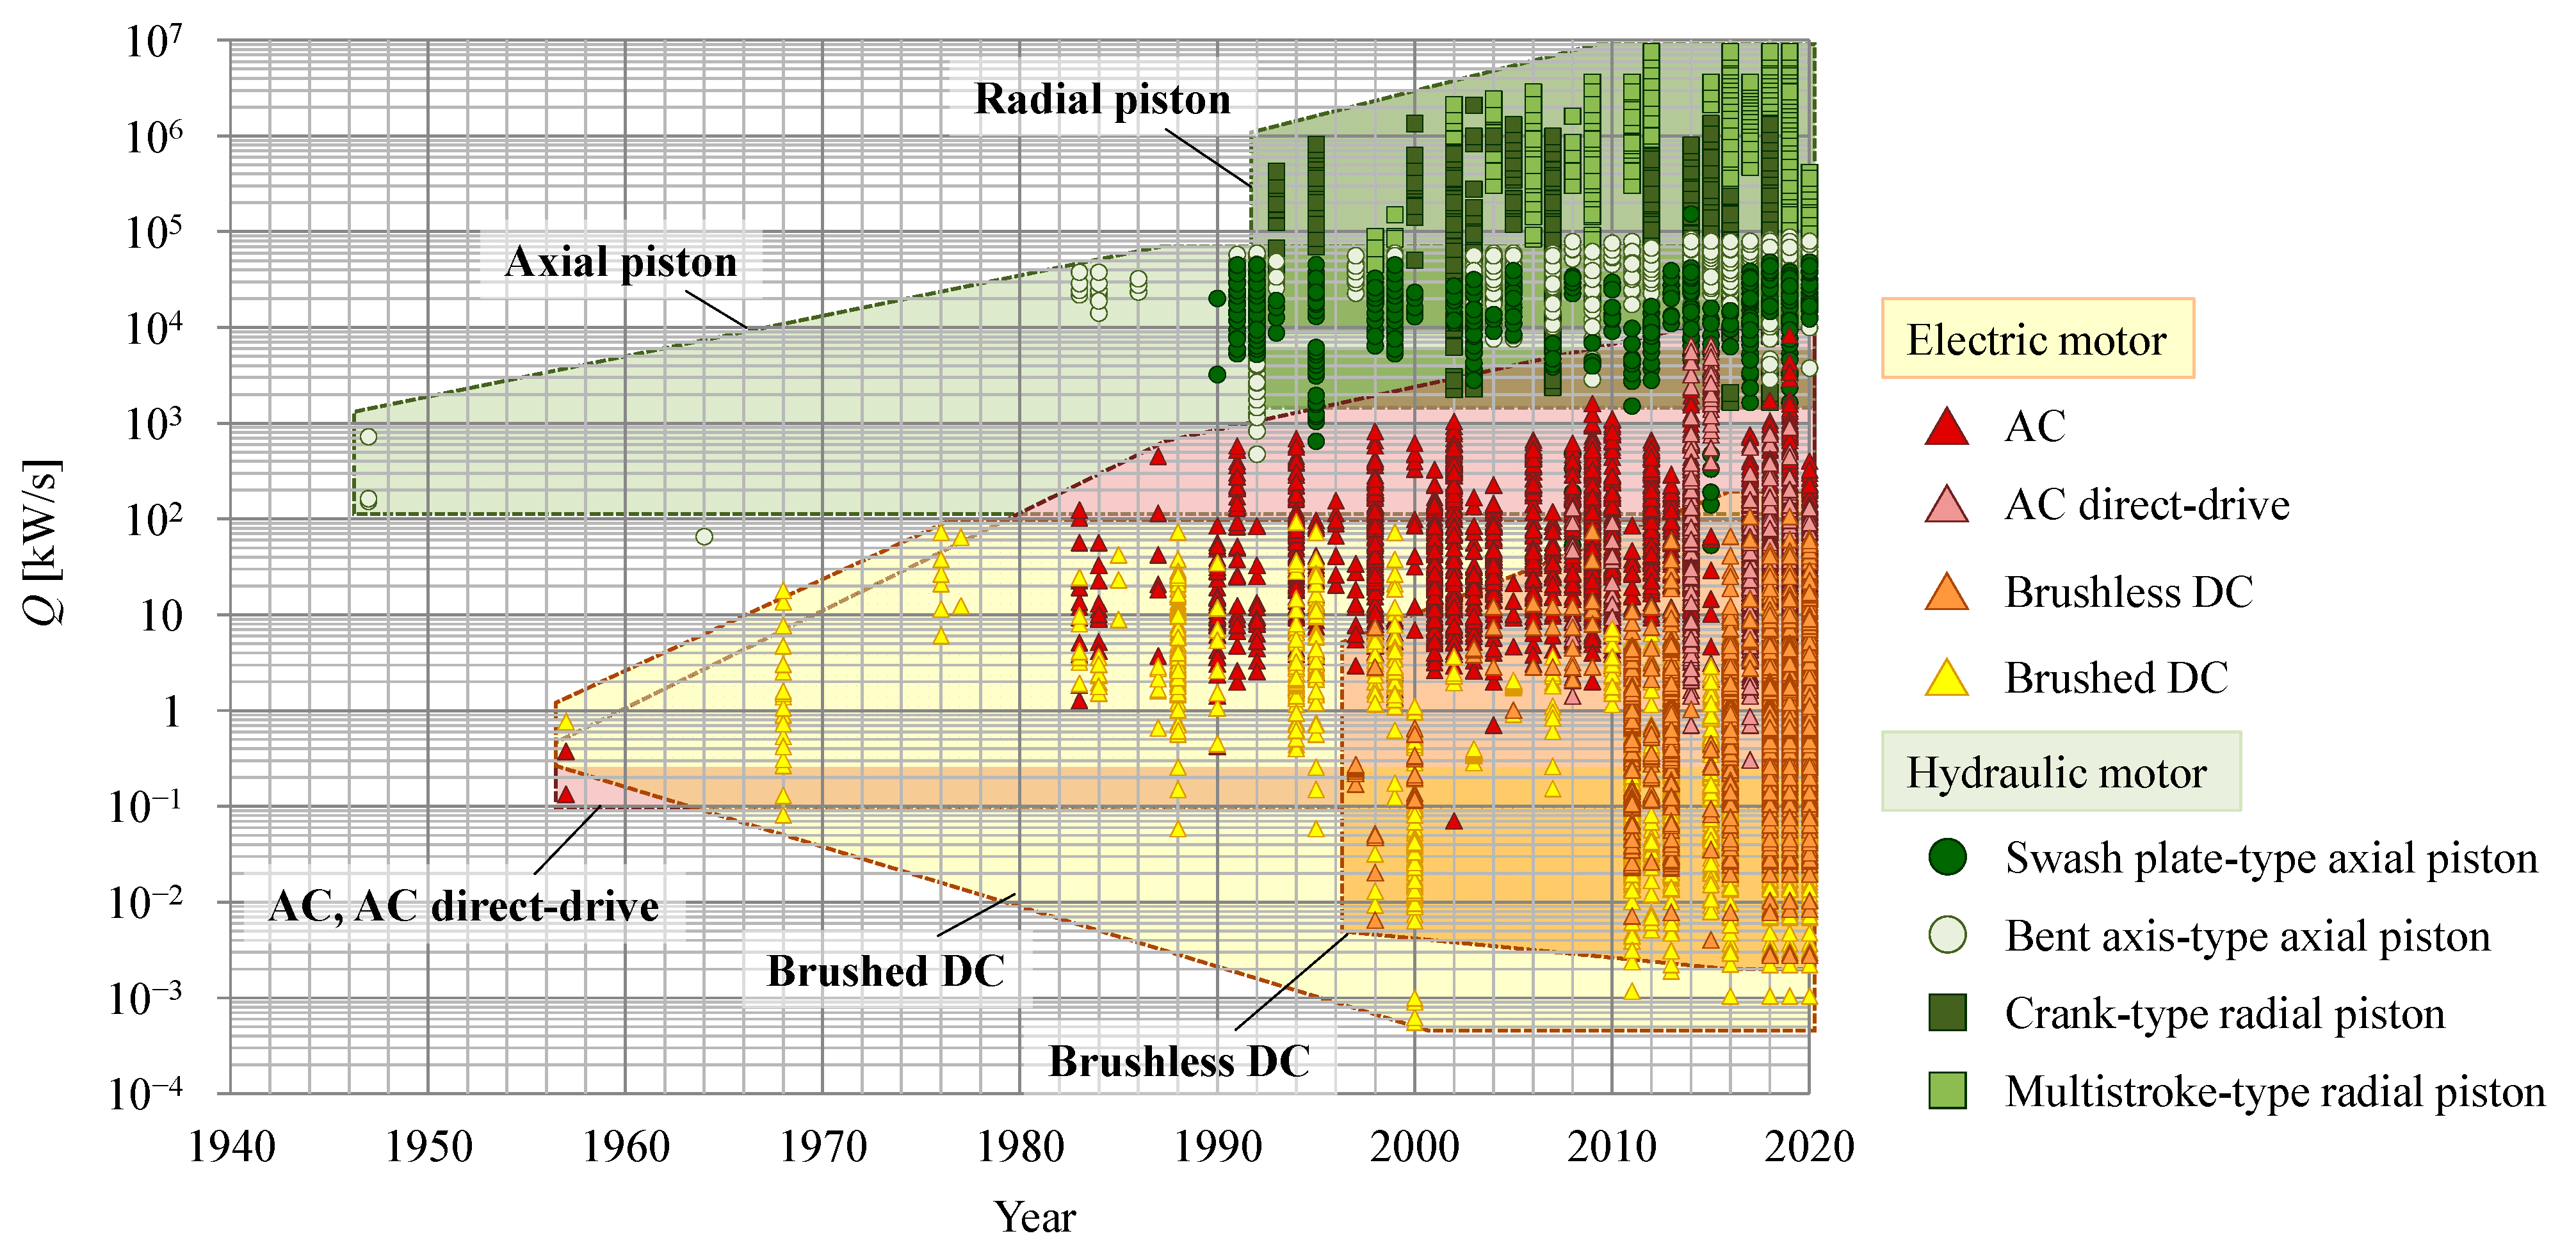
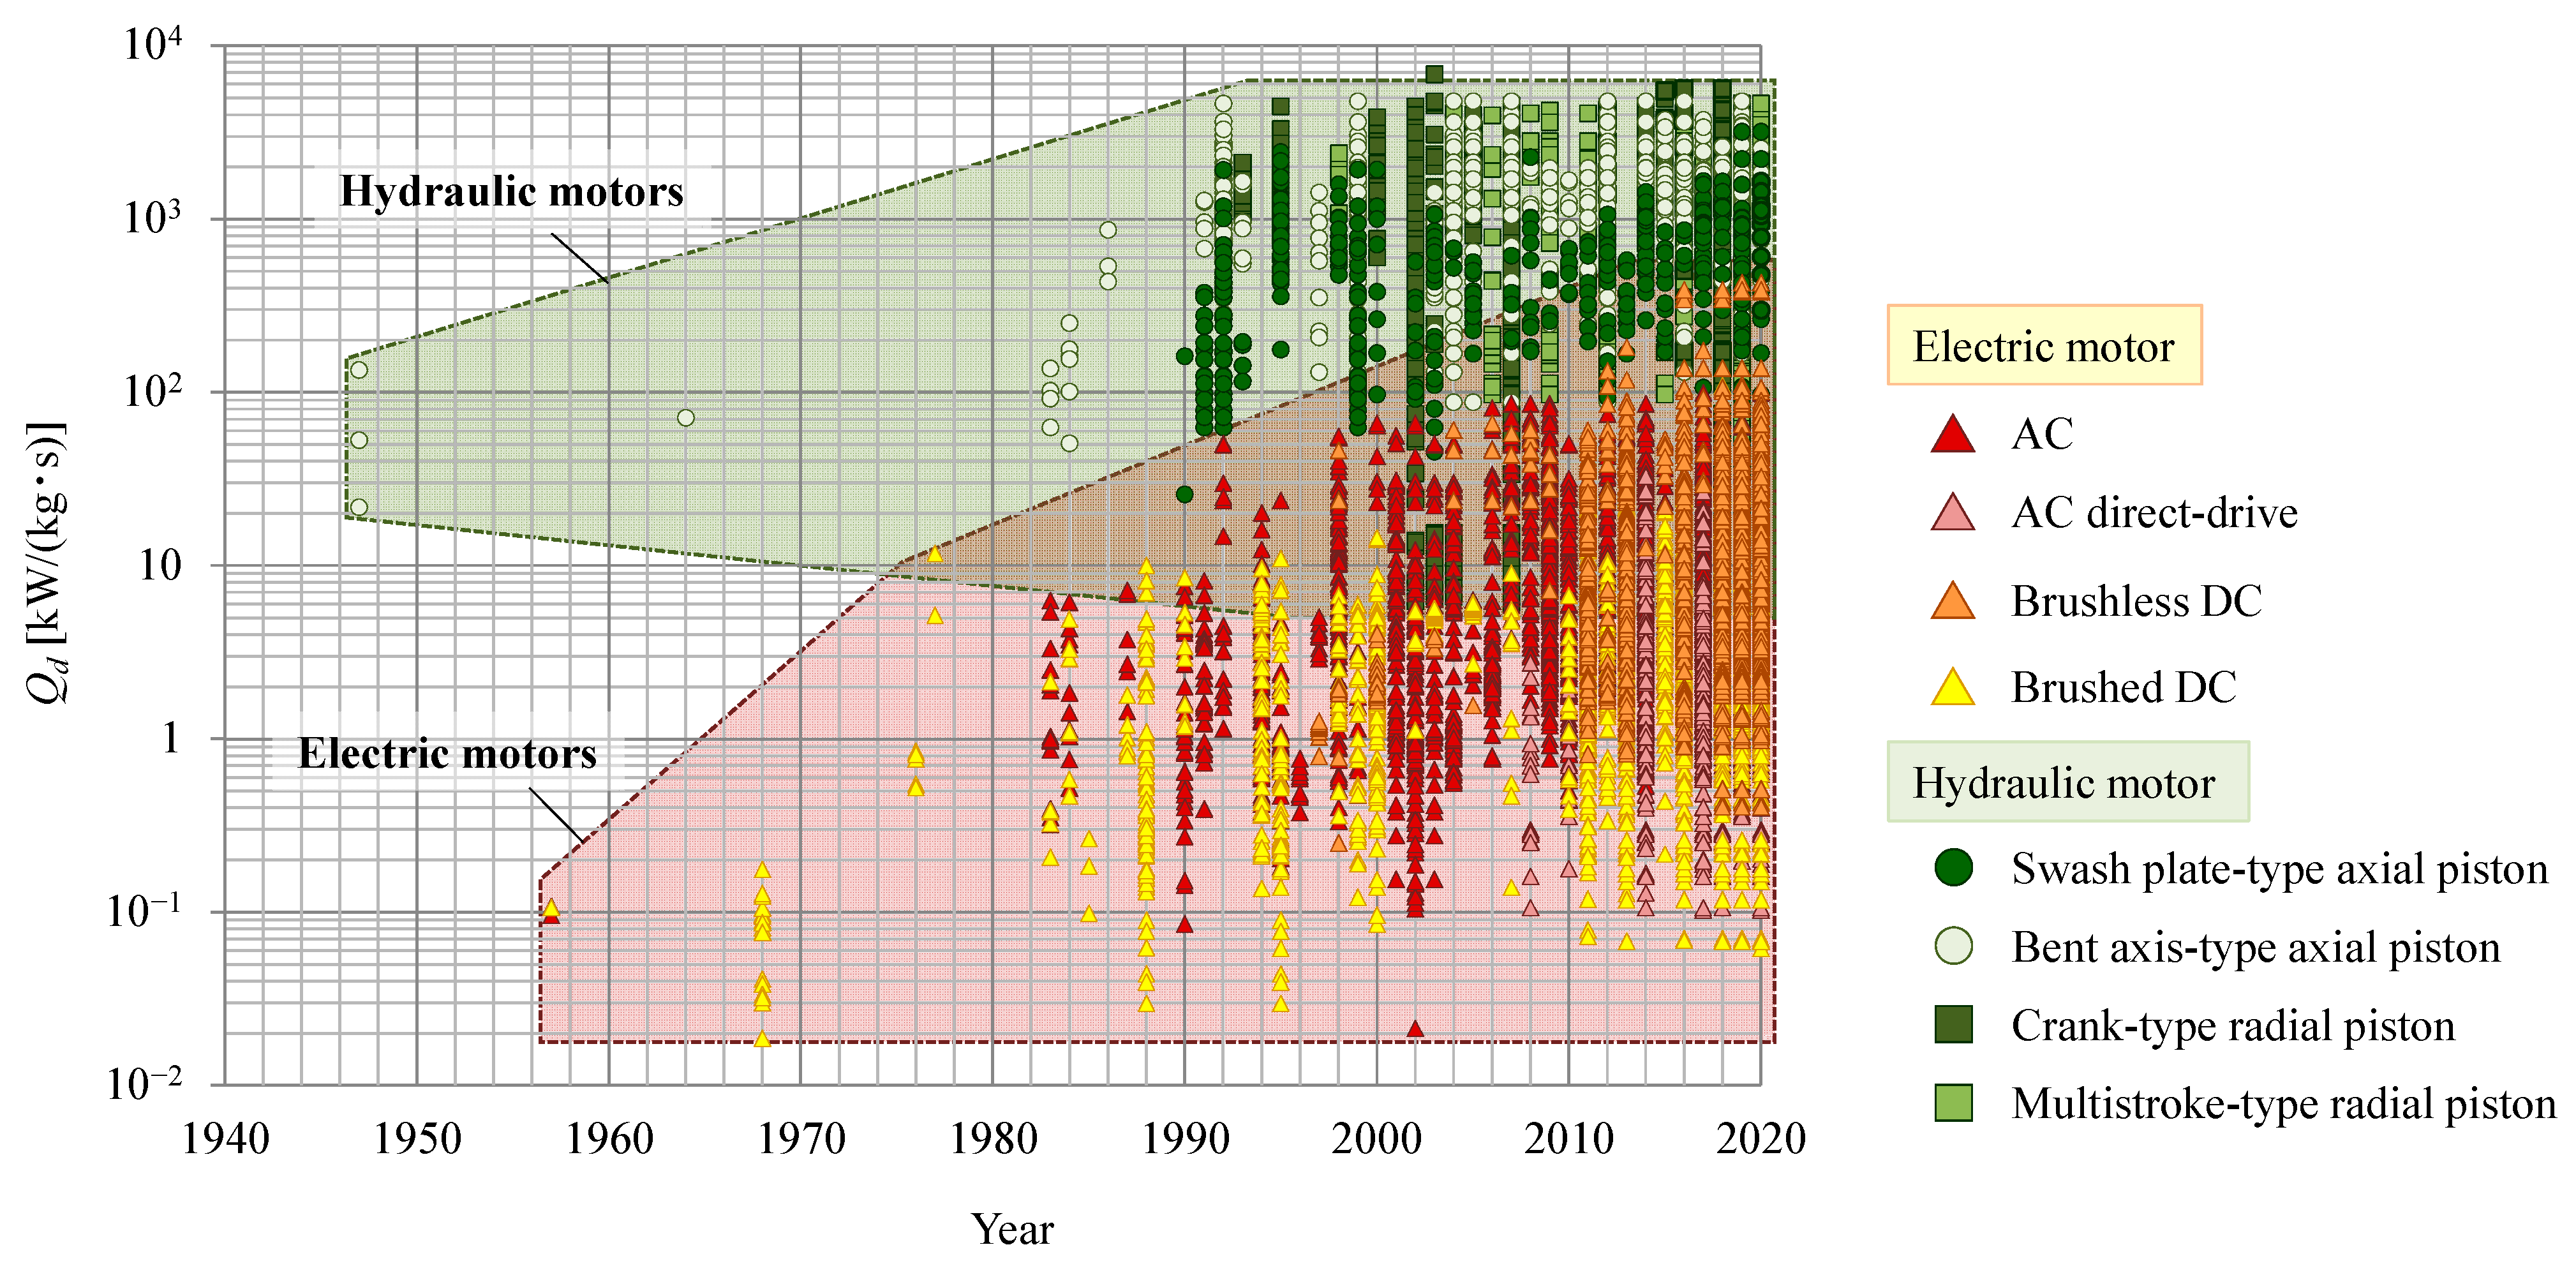
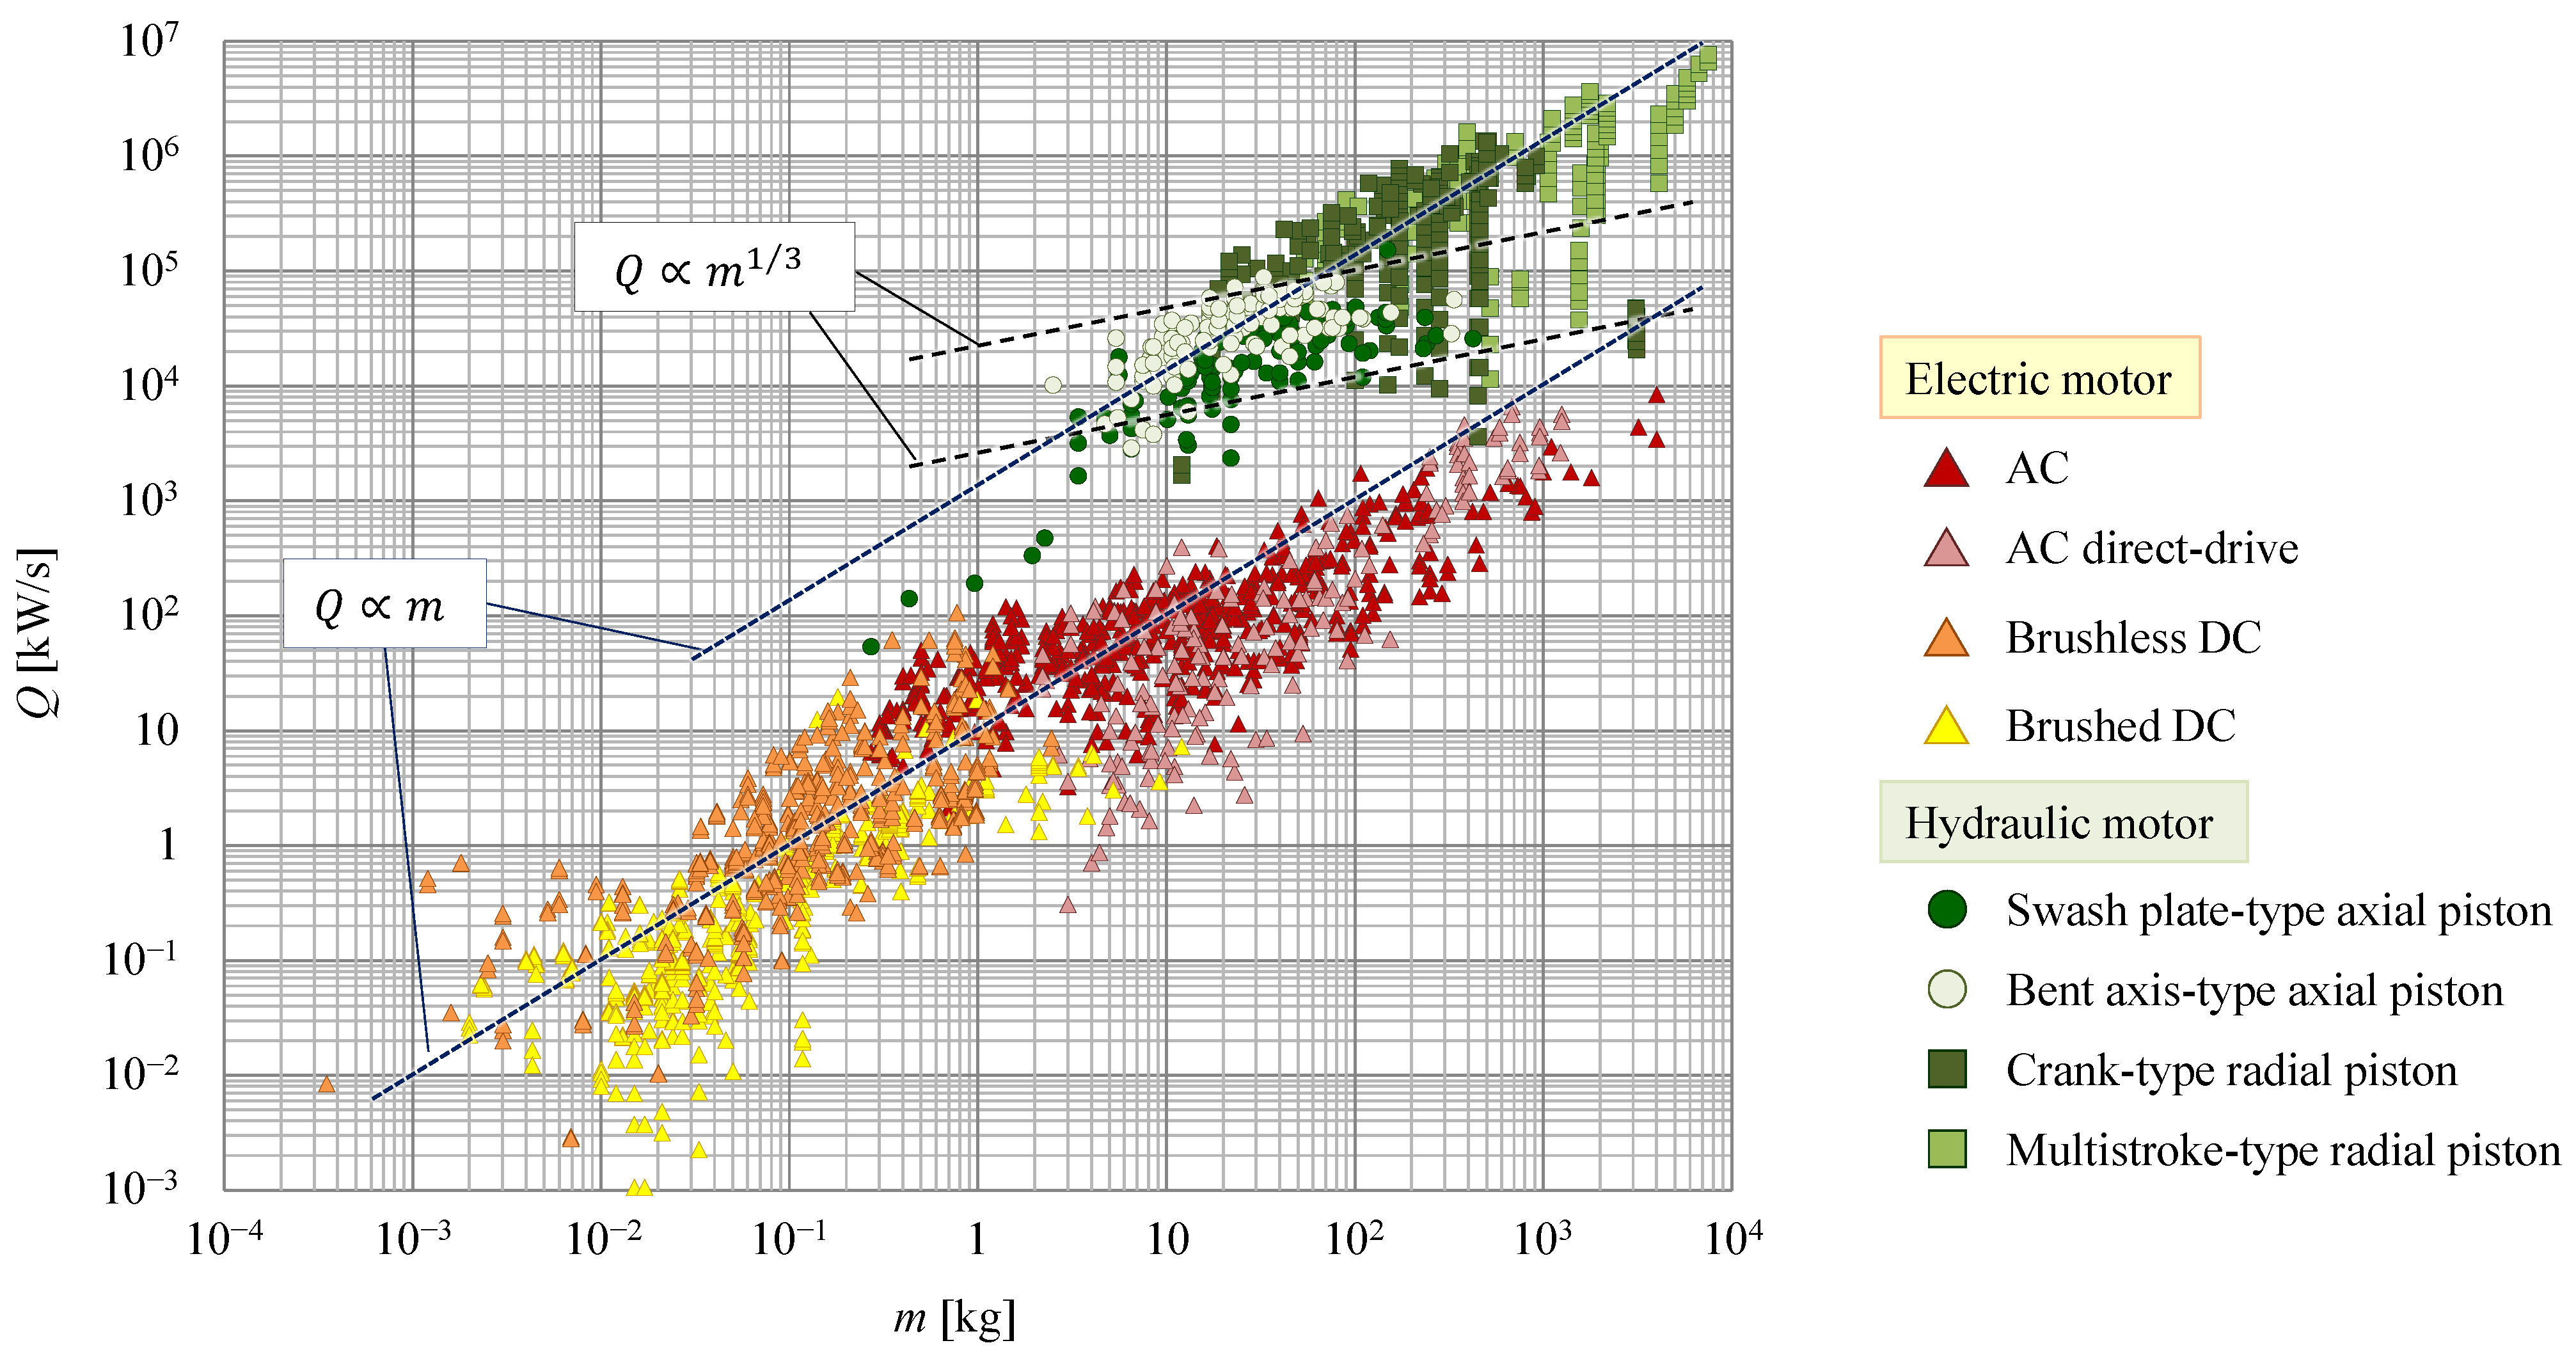
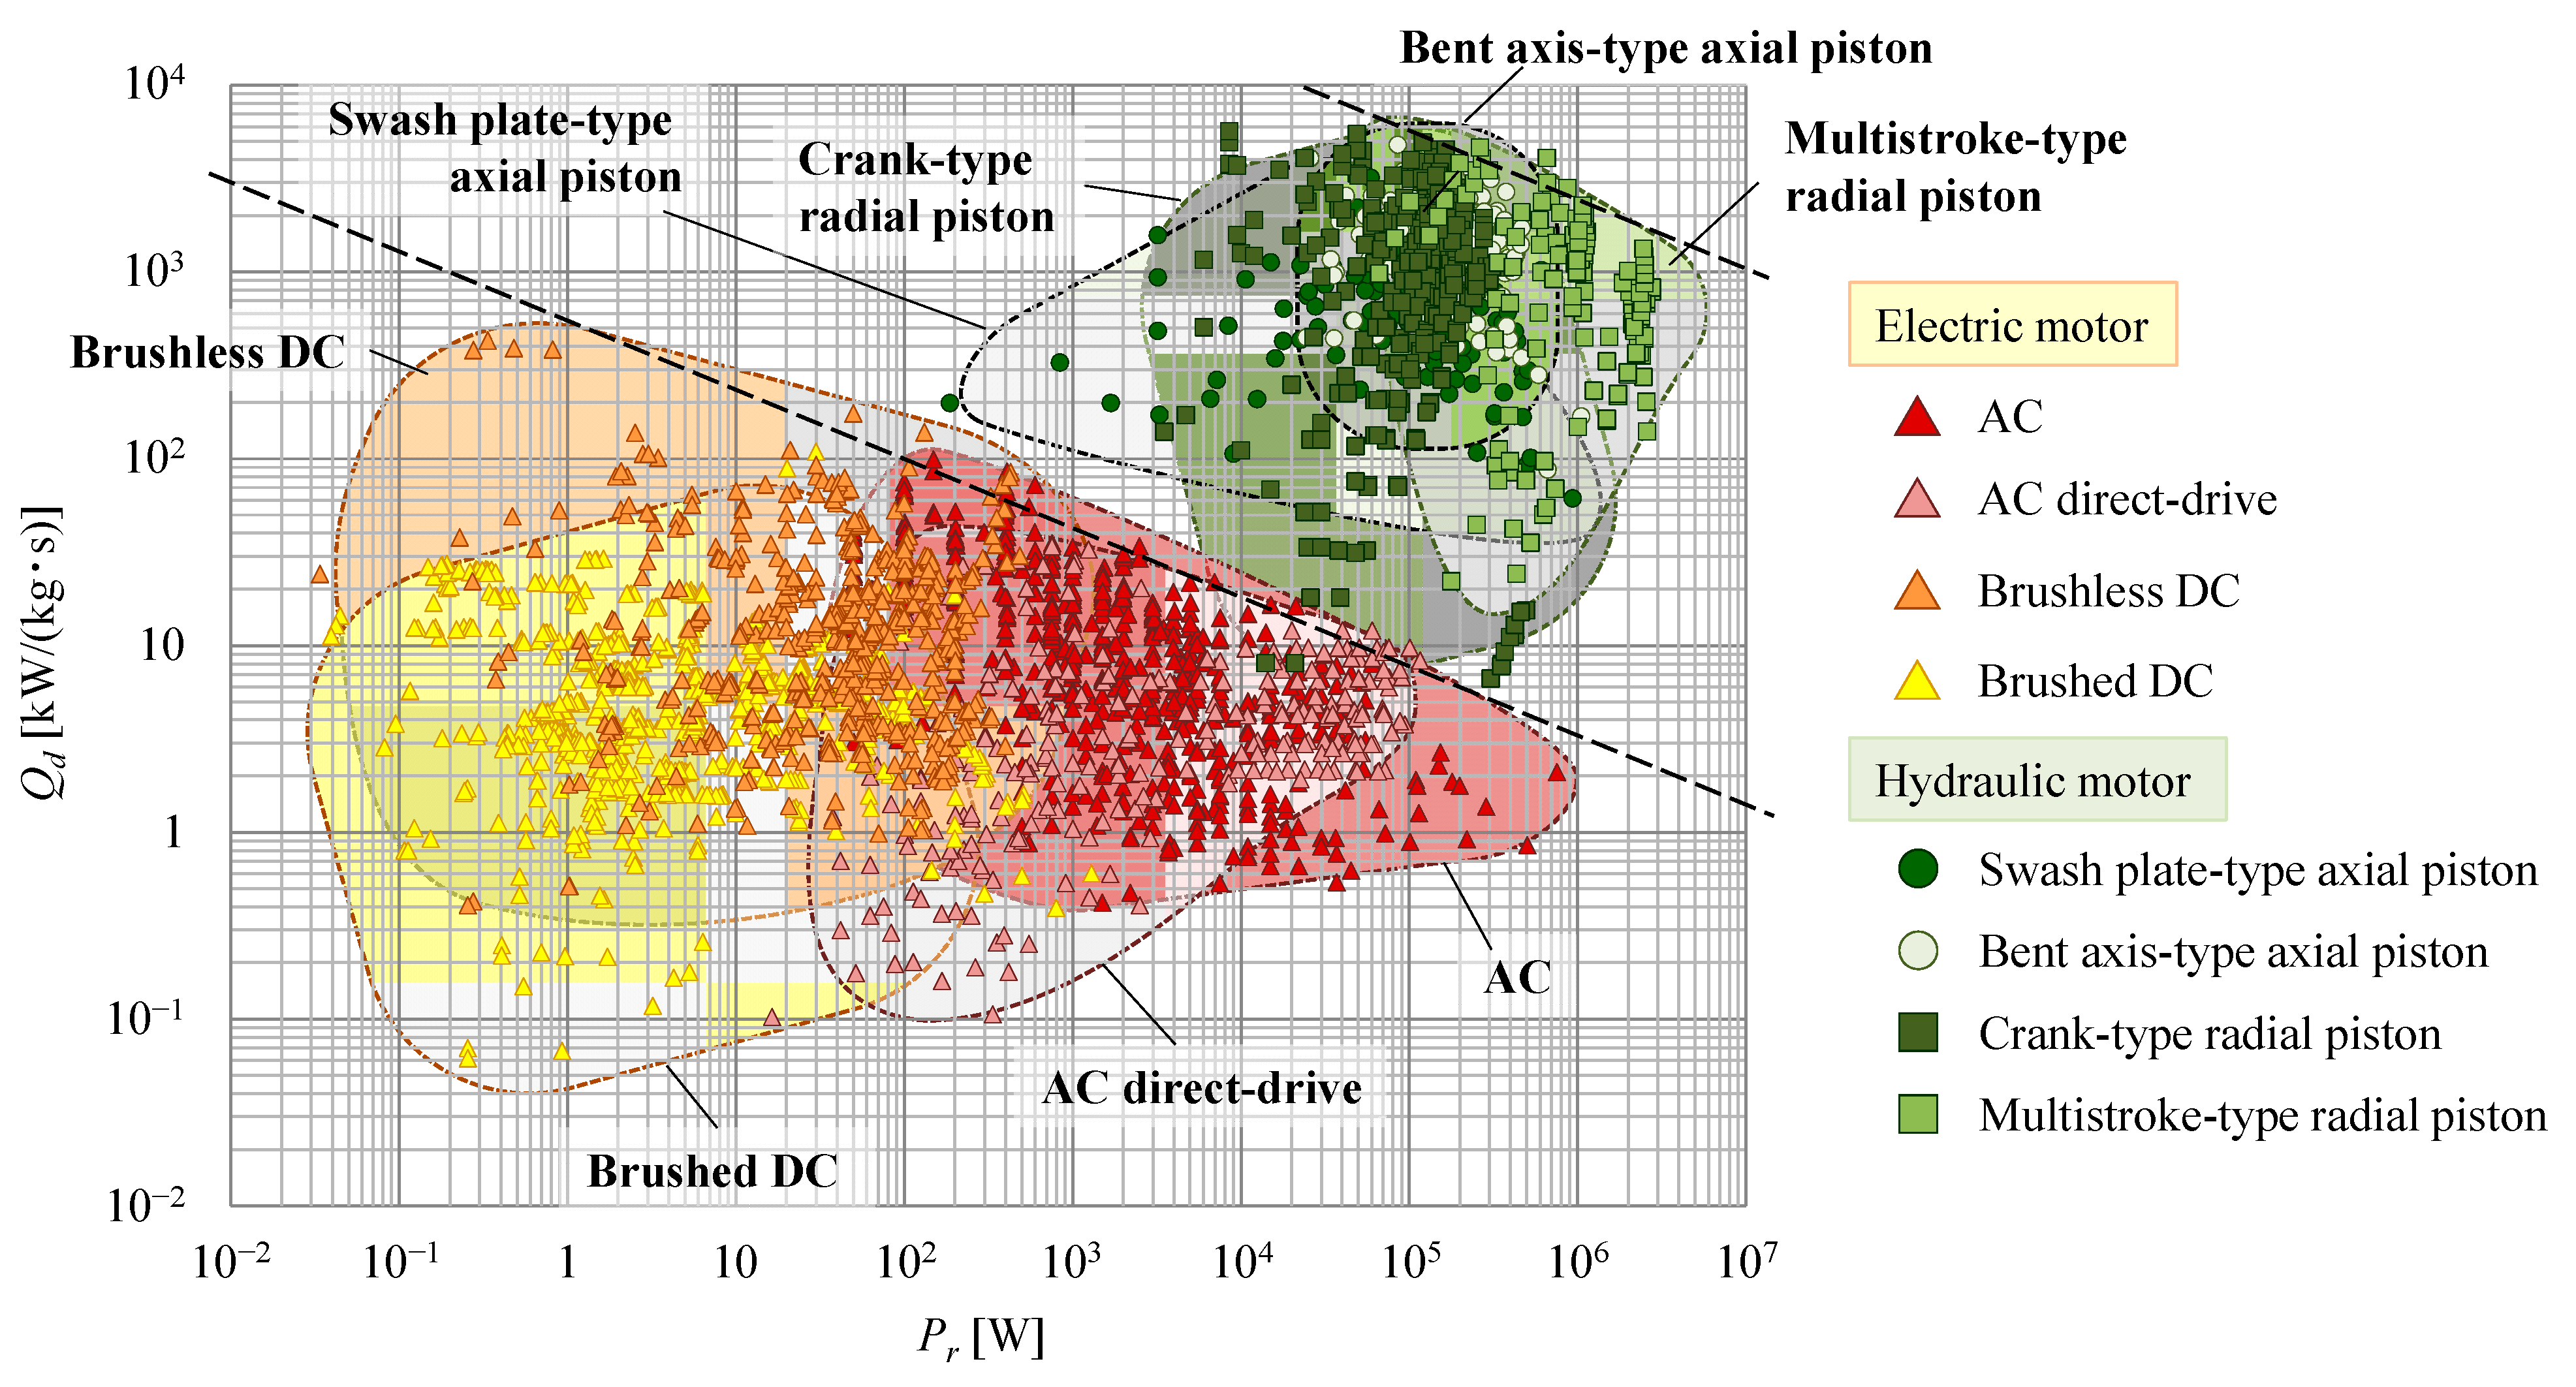
4.3. Power Rate and Power Rate Density

Figure 6 and Figure 7 show the advancement of the power rate and power rate density, respectively, of electric and hydraulic motors.
The power rate of hydraulic motors has not changed significantly with time, although that of radial piston motors has increased slightly. On the other hand, the power rate of electric motors has tended to increase, with the exception of DC motors. Moreover, differences in the transitions between hydraulic and electric motors become clearer when compared by power rate density. Although the power rate density of hydraulic motors has remained higher than that of electric motors for many years, the increased power rate density of electric motors is higher than that of hydraulic motors. It can be inferred that the improved performance of permanent magnets has also contributed to the increased power rate density in electric motors. The maximum power rate density of hydraulic motors is an order of magnitude greater than that of electric motors, but the power rate density of hydraulic motors has not changed since the 1990s. Therefore, the difference between these types of motor may be smaller in the future.

5. Trends of Motor Characteristics

5.1. Weight–Torque

To evaluate motor characteristics in more detail, we compared the relationships between two parameters related to motor performance. Here, the comparison targets are narrowed down to currently available motors. The relationship between motor weight m and rated torque Tr is shown in Figure 8.
Considering motor weight, electric motors show a wide range of weight distributions, from less than 1 g to several tons. On the other hand, the range of weight distribution of hydraulic motors is relatively small, and most hydraulic motors weigh more than 1 kg. However, when comparing the torques of motors with the same weight, the torque of hydraulic motors is found to be larger than that of electric motors at the same weights.
Nakano et al. [29] inferred, from the structure of the motors, that the torque of DC servo motors is proportional to 4/3 of the power of motor weight, whereas the torque of hydraulic motors is proportional to motor weight. Their survey results demonstrate that these inferences are valid. In addition, they confirmed that AC and DC servo motors show similar trends. On the other hand, some of the survey results shown in Figure 8 differ from the results of previous studies. For example, electric motors smaller than approximately 1 kg and hydraulic motors larger than around 20–30 kg agree with the above relationship, but some AC and small-sized hydraulic motors do not. The slope of the AC motors is smaller than that of the other electric motors, whereas that of hydraulic motors smaller than approximately 20 kg is almost proportional to the 4/3 power of motor weight. This suggests that, even for the same type of motor, characteristics may differ between large and small examples. However, the torque of AC direct-drive motors is proportional to the 4/3 power of the motor weight and is larger than that of AC servo motors of similar weight. Therefore, direct-drive motors are considered to be more suitable when a large torque is required to be generated by electric motors.
Comparing hydraulic motors by type shows that although axial piston and crank piston-type radial piston motors plot almost along the same straight line, multistroke-type radial piston motors plot significantly higher. The multistroke-type radial piston motors can generate the largest torque of all the motors surveyed, nearly two orders of magnitude greater than that of the AC servo motors.

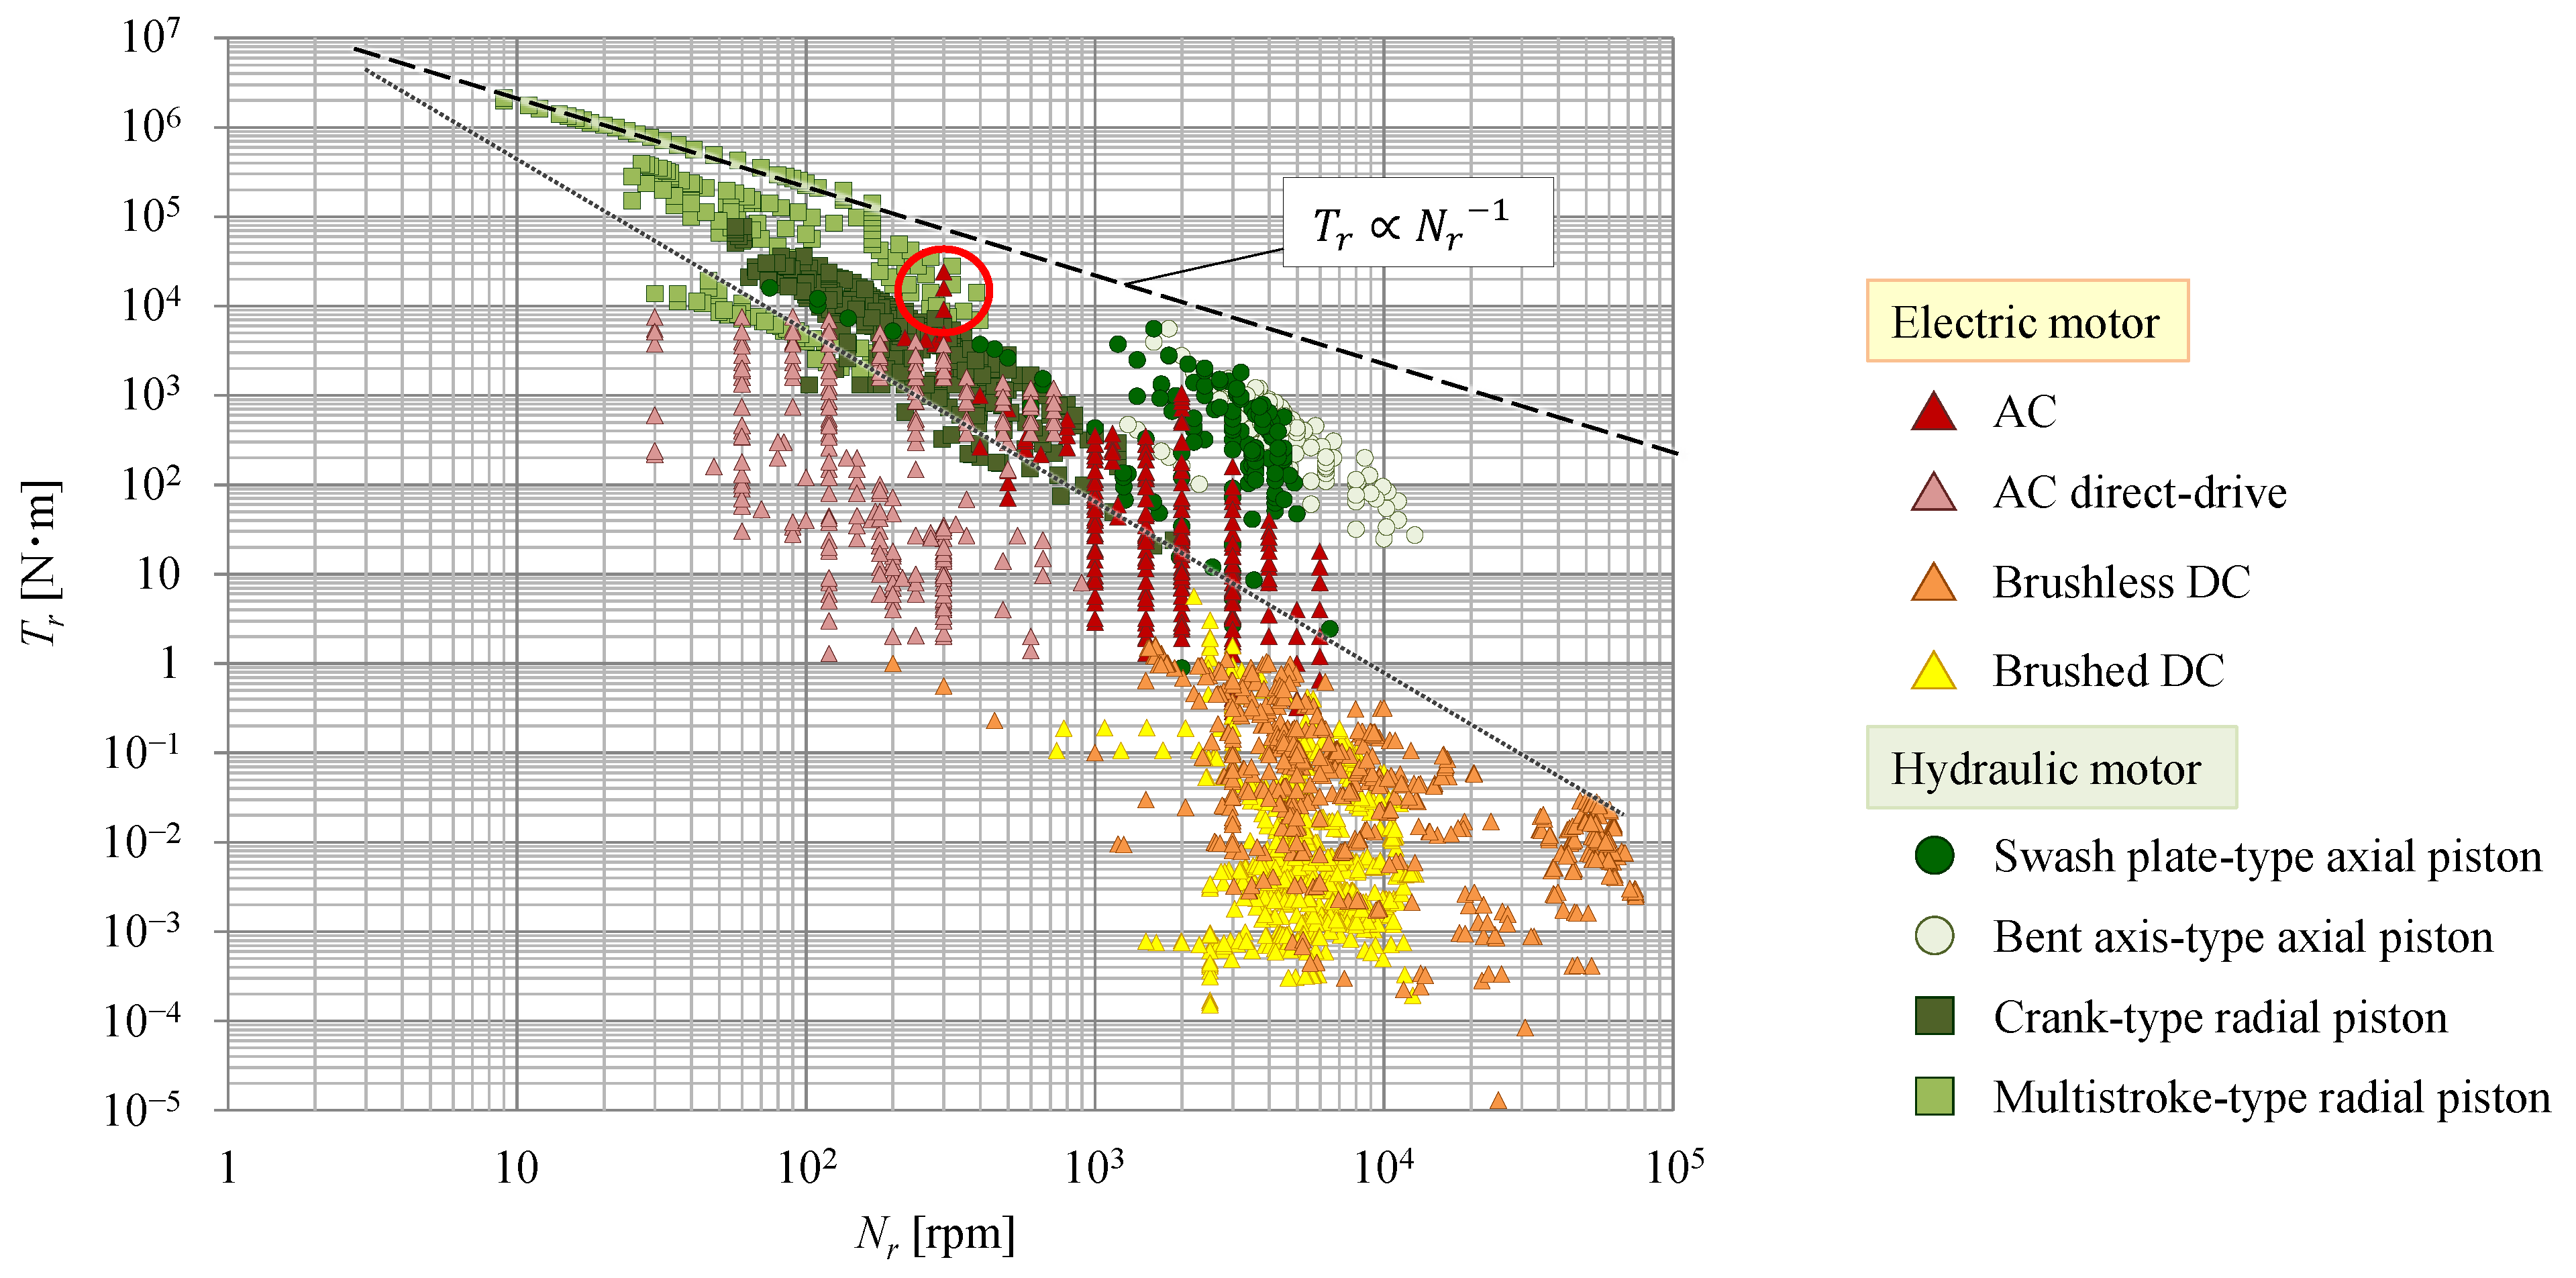
5.2. Rated Rotating Speed–Torque

Next, we compared the relationship between rated rotating speed Nr and rated torque Tr. These data are plotted in Figure 9. Since motor output power is calculated as the product of torque and rotating speed, it can be observed that the motors plotted in the upper right of Figure 9 have larger output powers.
Motor torque decreases as rotating speed increases in both hydraulic and electric motors. Moreover, the torque of hydraulic motors tends to be higher than that of electric motors, although some electric motors are comparable to hydraulic motors.
Considering this relationship in more detail, the torque of certain high-torque hydraulic motors is roughly inversely proportional to their rotating speed, but most motors have a larger slope. In other words, the faster the motor speed, the more noticeable the decrease in torque, and it becomes difficult to output a large power. Focusing on brushless DC motors, some can drive more than an order of magnitude faster than can other motors. However, the torque of brushless DC motors that rotate at the same speed as other motors is smaller than that of both AC and hydraulic motors.
Characterizing the relationship between the rotating speed and torque of motors allows an indirect evaluation of the relationship between speed and output power. Although motor weight was not considered in this evaluation, as can be seen from the evaluation in the previous section, the output power of the motor varies greatly depending on its weight. For example, the hydraulic motor plotted in the red circle in Figure 9 weighs approximately 200–400 kg, but the weight of the AC motor is around 4000 kg. In other words, electric motors are required to be ten times larger in size than hydraulic motors to output the same power at the speed of a hydraulic motor. In the next section, to evaluate this point, the relationship between motor weight and output power is considered.

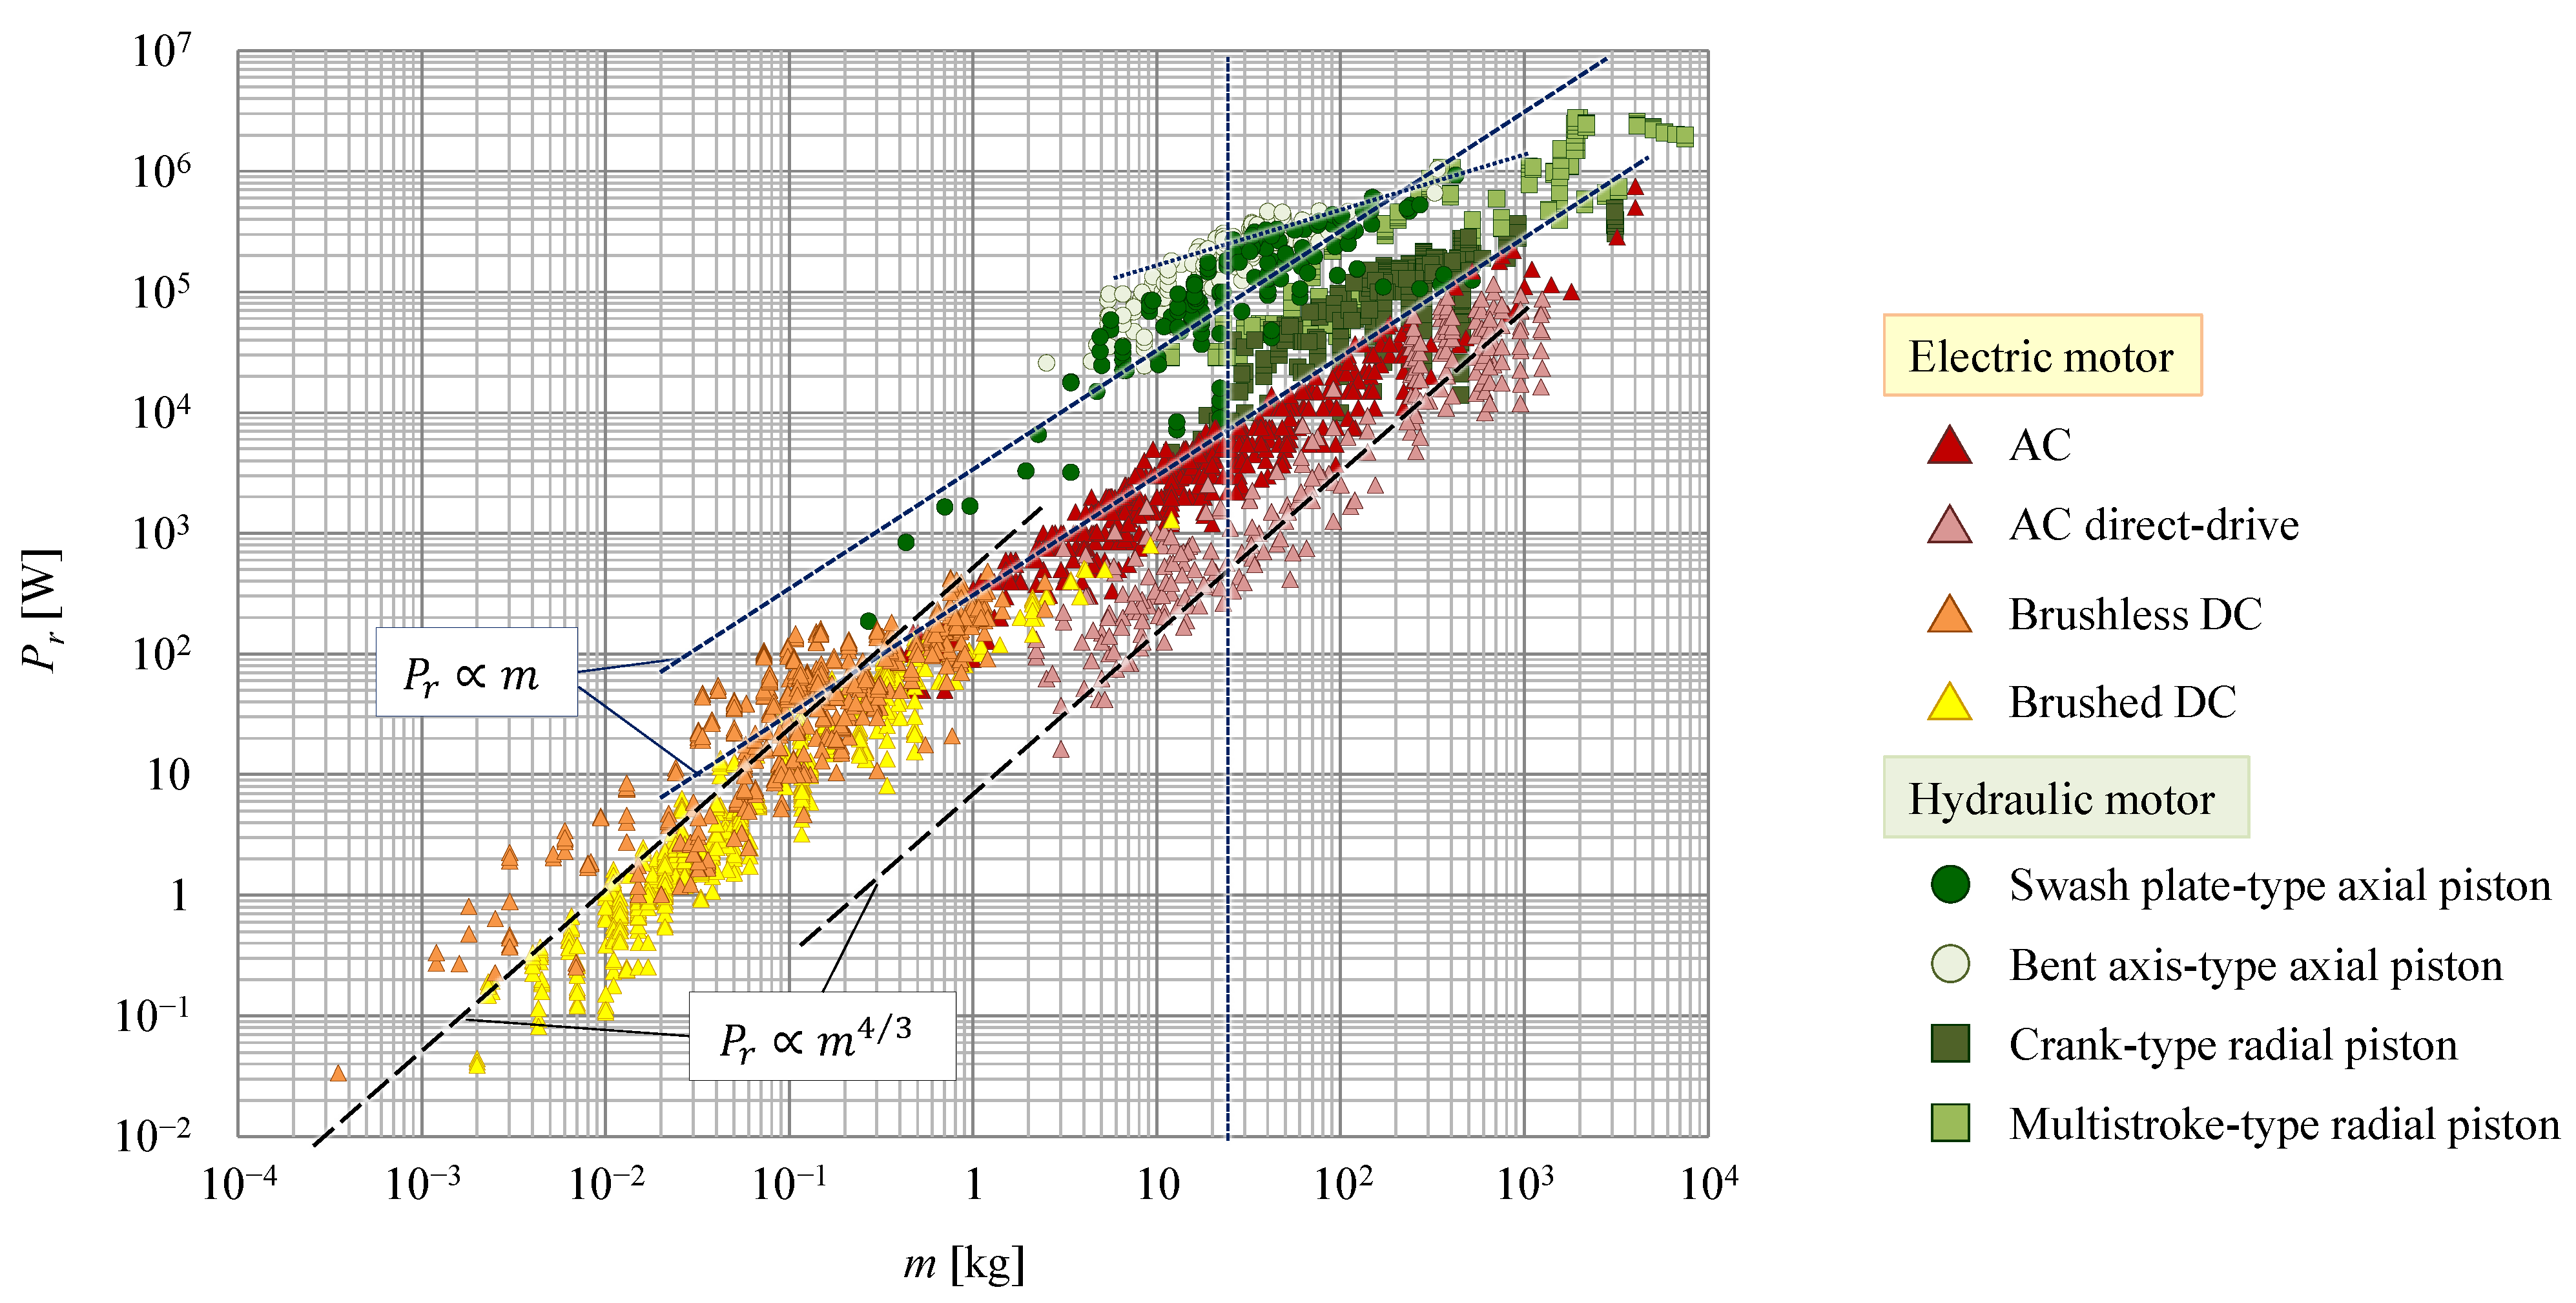
5.3. Weight, Rotating Speed–Power, Power Density

The relationship between motor weight m and output power Pr is shown in Figure 10. Nakano et al. [29] showed that this relationship tends to be similar to the relationship between motor weight and torque, i.e., that the output power of electric motors is proportional to the 4/3 power of motor weight, whereas that of hydraulic motors is proportional to the weight. However, in Figure 10, similar to the relationship between the motor weight and torque, the tendency of AC motors and some hydraulic motors is shown to be slightly different from previous studies. The slope of the output power of AC servo motors with respect to weight is slightly smaller than that of other electric motors; indeed, it is close to linear. For hydraulic motors, output power is roughly proportional to weight, but for axial piston motors, the slope decreases above 20–30 kg. Although the slope of the output power to the weight of hydraulic motors is smaller than that of electric motors, it also can be seen that the output power of hydraulic motors is larger than that of electric motors at all sizes.
The ratio of output power to weight represents the power density of motors defined by Equation (1). Figure 11 shows the power density relative to the weight of the motors. This figure also indicates that the power density of hydraulic motors is higher than that of electric motors. In particular, the difference in the power density of motors with a weight of around 10 kg is noticeable, since this difference is approximately two orders of magnitude. However, as motor size increases, the difference in power density between electric and hydraulic motors decreases. To clarify differences in these large-sized motors, we considered the relationship between the rated rotating speed and power density in Figure 12a. Therefore, the plotted positions of each motor can be separated by type. Comparing the motor speeds of electric and hydraulic motors of similar power density, the speeds of electric motors are found to be faster than those of hydraulic motors. The same tendency can be seen in Figure 12b, which extracts data in the range surrounded by the red square in Figure 11, i.e., where many plots of electric and hydraulic motors overlap. The output power of the motor is calculated as the product of its speed and torque; this indicates that when the power densities of electric and hydraulic motors are similar, the choice of the most suitable motor depends on whether speed or torque is more important.

5.4. Power Rate and Power Rate Density

Figure 13 shows the relationship between motor weight m and power rate Q calculated by Equation (2). The power rate of hydraulic motors is larger than that of electric motors of the same weight. Moreover, although the power rate of hydraulic motors tends to be proportional to the weight of the motor, the slope is smaller when viewed by motor type. Nakano et al. [29] demonstrated that the power rate of hydraulic motors is proportional to the 1/3 power of the motor weight. In the case of electric motors, the power rate is roughly proportional to the weight, which is consistent with the trend shown by Nakano et al. [29].
K. Foster et al. [26] defined an index calculated by the product of the angular velocity and the square root of inertia of motors; they used this to indicate motor capacity and compared the relationship of this index with the power rate. Herein, we also organize data according to this relationship and compare motor characteristics. Figure 14 shows the relationship between the index ωJm1/2 and the power rate Q. The angular velocity ω is calculated from the rated rotating speed Nr. As can be seen by the variables used in this index, a large amount of energy can be generated when index ωJm1/2 is increased. It is clear that the power rate increases as the output energy generated by the motors increases, such that the power rate of hydraulic motors is larger than that of electric motors; this result is similar to that reported in Figure 13. The lines in Figure 14 represent the results of the survey by K. Foster et al. [26] and confirm that the power rate to output energy of hydraulic motors has increased significantly, although the corresponding change in electric motors is smaller.
The relationship between rated output power Pr and power rate density Qd calculated by Equation (3) is shown in Figure 15. The overall tendency of hydraulic and electric motors shows that the power rate density decreases as the rated output power increases, although the power rate density of some motors tends to slightly increase in each series. However, it is important to note that the power rate densities of hydraulic motors are 10-fold or one-hundred-fold those of electric AC servo motors. We can thus evaluate that the responsiveness of hydraulic motors is higher than that of electric motors with similar weight or output power.

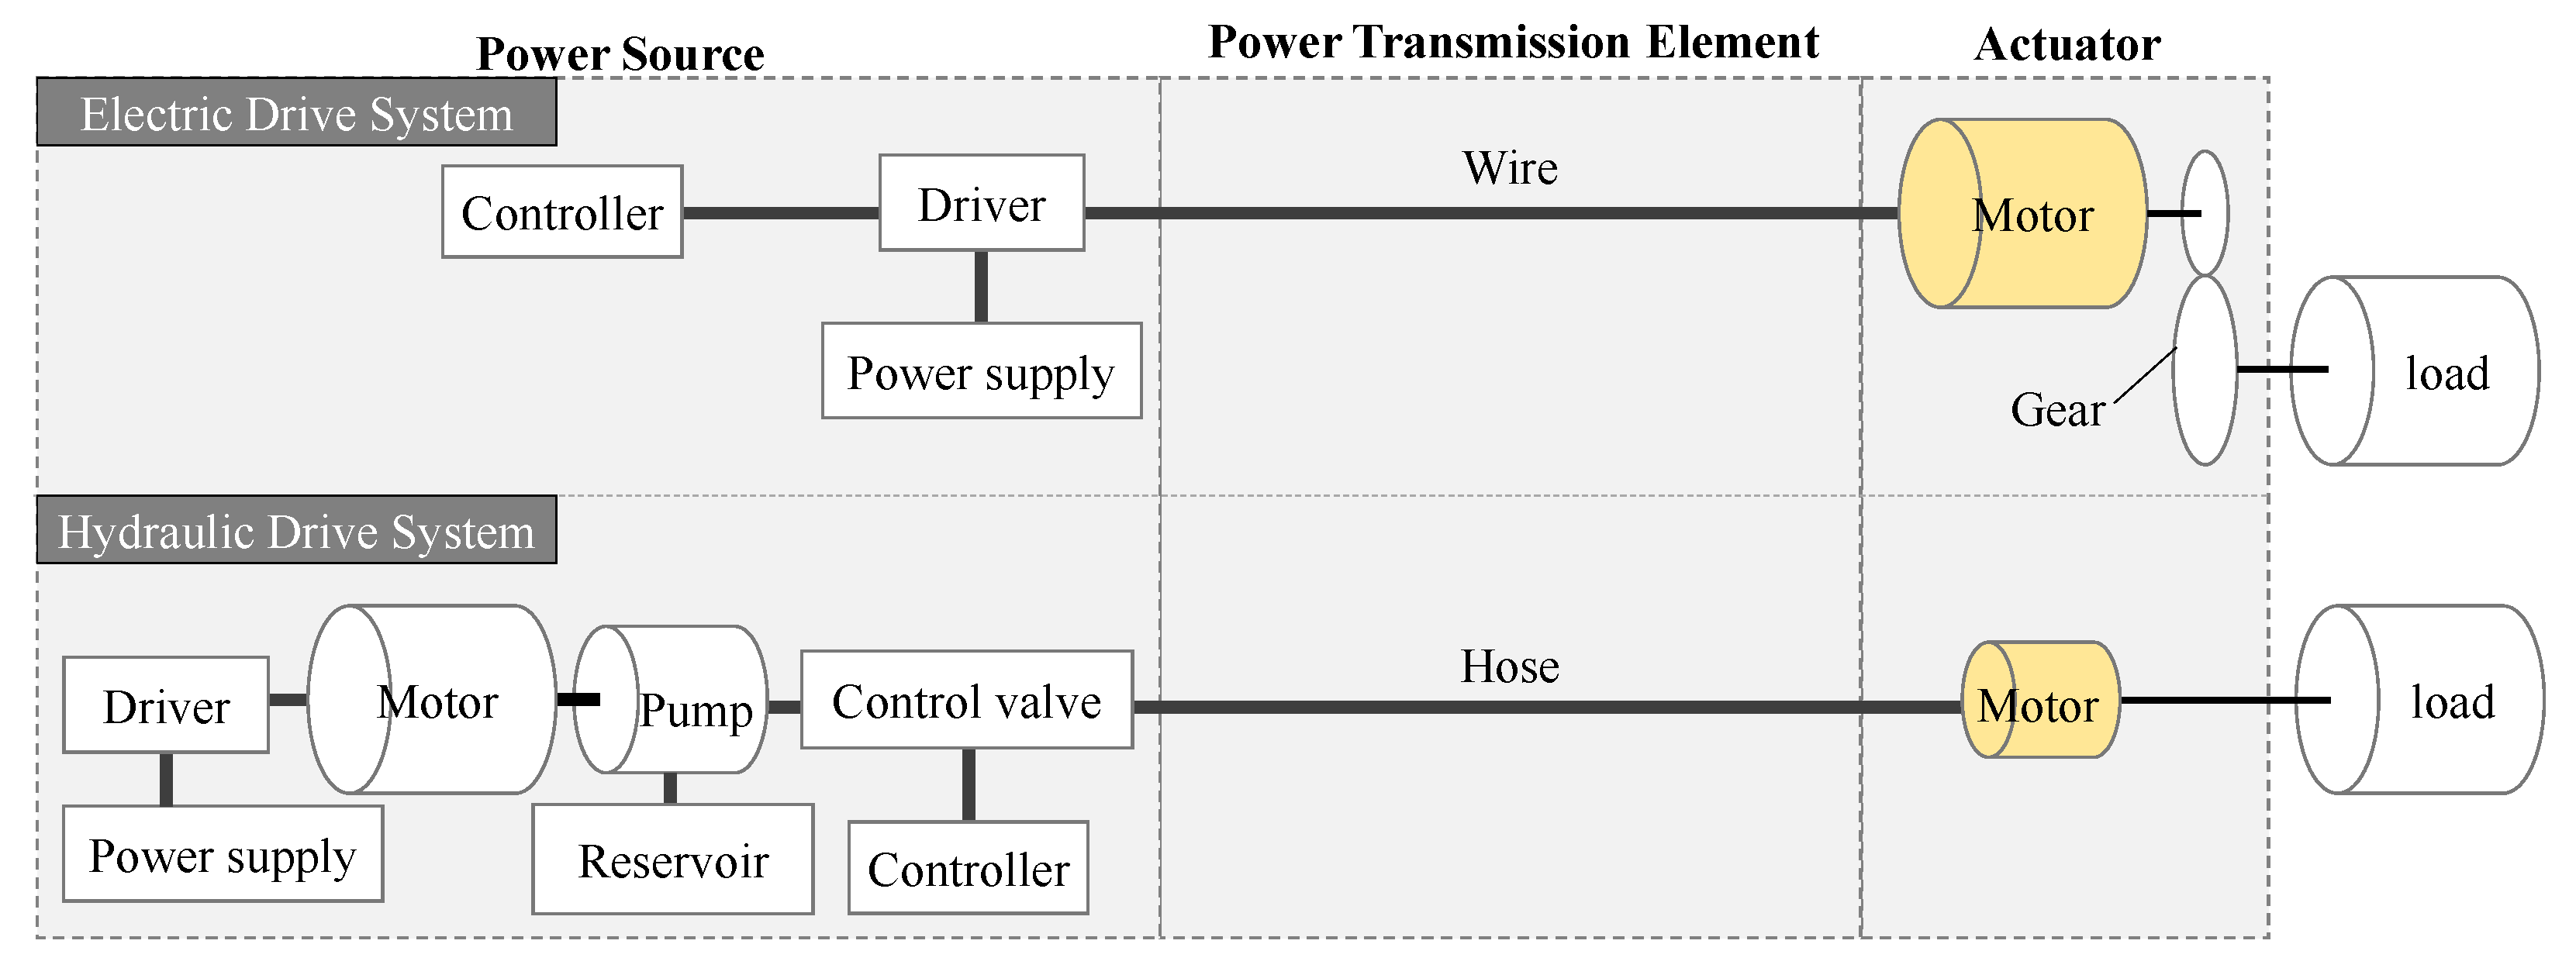
6. Comparison of Electric and Hydraulic Drive Systems

Several hydraulic motors have large torque, high power density, and a high power rate (Figure 16). Therefore, when high output power with the smallest possible size or high responsiveness is required, hydraulic motors are preferable to electric motors. However, electric motors have various sizes and can be driven at a higher speed. Although hydraulic motors have a high power density and are suitable for miniaturization and high output power, electric motors are preferred when a small size is required or when speed is more important than generated torque.
We compared electric and hydraulic systems focusing exclusively on the motor, but the analysis of the entire system is necessary before choosing between both systems. The schematic of the electric and hydraulic drive systems’ configuration is shown in Figure 17.
Hydraulic motors can generate a large force with a small size; however, they require reservoirs, pumps, etc., and the power source for hydraulic systems is typically larger than that for electric systems. Therefore, electric drive systems are appropriate when the size of the power source affects the entire design of the system. However, when the size of the power source has a minor effect on the entire system’s performance, such as when several actuators are used in a system with a high degree of freedom or when the actuators are moved remotely, a hydraulic drive system can be more suitable because the actuator sizes are crucial for the system performance. Additionally, although reduction gears are used with electric actuators, their use reduces the back drivability and impact resistance. Therefore, constructing the direct-drive system using hydraulic actuators is appropriate when high back drivability and impact resistance are required of the actuator.
Furthermore, when evaluating the entire system, one should consider the influence of the power transmission element. Reducing the hydraulic lines of an aircraft by adopting electro-hydrostatic actuators reduces its weight. Therefore, when the weight of the hydraulic lines has a significant effect on the entire system’s weight, it may be possible to reduce the entire system’s weight by replacing the hydraulic lines with wires [37]. However, Kazama compared the power densities of electric wires and hydraulic hoses and reported that hydraulic hoses have a higher power density than electric wires for high power transmission [33]. Thus, selecting the means of energy transmission by considering the power density of transmission elements is necessary.

7. Conclusions

This paper presents the results of a comparison between the characteristics of commercially available electric and hydraulic servo motors.
We collected data about the characteristics of these two types of servo motor based on both specifications found in catalogs and nonpublic data. Our survey targets included AC, AC direct, brushless DC, and brushed DC electric servo motors and swash plate-type axial piston, bent axis-type axial piston, crank-type radial piston, and multistroke-type radial piston hydraulic servo motors.
We compared the transition of servo motor performance and clarified that hydraulic motors are superior in terms of their power density and power rate density. However, electric motors have rapidly become smaller, more responsive, and with higher outputs. For this reason, differences in power density and power rate between electric and hydraulic motors have decreased.
Furthermore, we narrowed down the targets of comparison to motors available as of May 2020 and compared their characteristics. It was confirmed that the rated torque, output power, power density, and power rate of hydraulic motors are larger than the corresponding values of electric motors of similar weight. However, such performance differences between hydraulic and electric motors depend on motor size. Moreover, electric motors are faster than hydraulic motors when compared for similar power densities.
From the above considerations, hydraulic motors showed excellent performance in many indexes; however, the performance improvement of electric motors is particularly advantageous compared to the hydraulic motor, and the performance of electric motors is expected to be close to that of the hydraulic motors in the future. Regarding hydraulic motors, the performance has not changed significantly since the 1990s, and small-sized motors of approximately several tens of grams, such as electric motors, have not been developed. If the size of hydraulic motors is significantly reduced in the future, it will be possible to generate a larger force than that in conventional small electric motors and construct small mechanical systems that can perform work that requires a certain amount of force, which is difficult with fully electric systems.
In this study, the characteristics of actuators and electric and hydraulic drive systems are discussed. To determine whether an electric or hydraulic drive system is suitable, understanding the differences between electric and hydraulic drive systems in terms of the power source, power transmission element, and actuator, as well as the extent to which each element affects the entire system’s performance, is important.

Author Contributions

Conceptualization, S.S. and Y.T.; methodology, S.S. and Y.T.; formal analysis, S.S.; investigation, S.S.; data curation, S.S.; writing—original draft preparation, S.S.; writing—review and editing, Y.T. and A.K.; visualization, S.S.; supervision, Y.T.; project administration, A.K. All authors have read and agreed to the published version of the manuscript.

Funding

This research received no external funding.

Institutional Review Board Statement

Not applicable.

Informed Consent Statement

Not applicable.

Acknowledgments

Many companies cooperated to investigate data regarding the characteristics of servo motors. The authors would especially like to thank the many companies for their valuable support in providing the nonpublic data used in this study.

Conflicts of Interest

The authors declare no conflict of interest.

References

  1. Brinkman, N.; Eberle, U.; Formanski, V.; Grebe, U.-D.; Matthe, R. Vehicle Electrification—Quo Vadis?/Fahrzeugelektrifizierung—Quo Vadis? In Proceedings of the 33rd International Vienna Motor Symposium, Vienna, Austria, 26–27 April 2012; pp. 186–215. [Google Scholar]
  2. Pugi, L.; Delogu, M.; Grasso, F.; Berzi, L.; Pero, F.D.; Savi, R.; Boni, E. Electrification of Directional Drilling Machines for Sustainable Trenchless Excavations. In Proceedings of the 2019 IEEE International Conference on Environment and Electrical Engineering and 2019 IEEE Industrial and Commercial Power Systems Europe (EEEIC/I &CPS Europe), Genova, Italy, 11–14 June 2019; pp. 1–6. [Google Scholar]
  3. Lequesne, B. Automotive electrification: The nonhybrid story. IEEE Trans. Transp. Electrif. 2015, 1, 40–53. [Google Scholar] [CrossRef]
  4. Wenping, C.; Mecrow, B.C.; Atkinson, G.J.; Bennett, J.W.; Atkinson, D.J. Overview of electric motor technologies used for more electric aircraft (MEA). IEEE Trans. Ind. Electron. 2012, 59, 3523–3531. [Google Scholar] [CrossRef]
  5. Qiao, G.; Liu, G.; Shi, Z.; Wang, Y.; Ma, S.; Lim, T.C. A Review of Electromechanical Actuators for More/All Electric Aircraft Systems. Proc. Inst. Mech. Eng. Part C J. Mech. Eng. Sci. 2018, 232, 4128–4151. [Google Scholar] [CrossRef] [Green Version]
  6. Sarlioglu, B.; Morris, C.T. More electric aircraft: Review, challenges, and opportunities for commercial transport aircraft. IEEE Trans. Transp. Electr. 2015, 1, 54–64. [Google Scholar] [CrossRef]
  7. El-Refaie, A.M. Growing Role of Electrical Machines and Drives in Electrification. In Proceedings of the 2016 XXII International Conference on Electrical Machines (ICEM), Lausanne, Switzerland, 4–7 September 2016; pp. 364–370. [Google Scholar]
  8. Raibert, M.; Blankespoor, K.; Nelson, G.; Playter, R. BigDog, the Rough-Terrain Quadruped Robot. IFAC Proc. Vol. 2008, 41, 10822–10825. [Google Scholar] [CrossRef] [Green Version]
  9. ATLAS®. Available online: https://www.bostondynamics.com/atlas (accessed on 28 December 2021).
  10. Semini, C.; Barasuol, V.; Focchi, M.; Boelens, C.; Emara, M.; Casella, S.; Villarreal, O.; Orsolino, R.; Fink, G.; Fahmi, S. Brief Introduction to the Quadruped Robot HyQReal. In Proceedings of the Italian Conference on Robotics and Intelligent Machines (I-RIM), Rome, Italy, 18–20 October 2019; pp. 1–2. [Google Scholar]
  11. Suzumori, K.; Faudzi, A.A. Trends in hydraulic actuators and components in legged and tough robots: A review. Adv. Robot. 2018, 32, 458–476. [Google Scholar] [CrossRef]
  12. Mattila, J.; Koivumäki, J.; Caldwell, D.G.; Semini, C. A survey on control of hydraulic robotic manipulators with projection to future trends. IEEE/ASME Trans. Mechatron. 2017, 22, 669–680. [Google Scholar] [CrossRef]
  13. Kaminaga, H.; Ko, T.; Masumura, R.; Komagata, M.; Sato, S.; Yorita, S.; Nakamura, Y. Mechanism and Control of Whole-Body Electro-Hydrostatic Actuator Driven Humanoid Robot Hydra. In International Symposium on Experimental Robotics; Springer: Cham, Switzerland, 2016; pp. 656–665. [Google Scholar]
  14. Hyon, S.-H.; Taniai, Y.; Hiranuma, K.; Yasunaga, K.; Mizui, H. Overpressure compensation for hydraulic hybrid servo booster applied to hydraulic manipulator. IEEE Robot. Autom. Lett. 2019, 4, 942–949. [Google Scholar] [CrossRef]
  15. Barasuol, V.; Villarreal-Magaña, O.A.; Sangiah, D.; Frigerio, M.; Baker, M.; Morgan, R.; Medrano-Cerda, G.A.; Caldwell, D.G.; Semini, C. Highly-integrated hydraulic smart actuators and smart manifolds for high-bandwidth force control. Front. Robot. AI 2018, 5, 51. [Google Scholar] [CrossRef] [Green Version]
  16. Murrenhoff, H. Recent Sustainability Related Research Results in Fluid Power. In Proceedings of the 2011 International Conference on Fluid Power and Mechatronics, Beijing, China, 17–20 August 2011; pp. 991–1001. [Google Scholar]
  17. Hamzehlouia, S.; Izadian, A. Modeling of Hydraulic Wind Power Transfers. In Proceedings of the 2012 IEEE Power and Energy Conference at Illinois, Champaign, IL, USA, 24–25 February 2012; pp. 1–6. [Google Scholar]
  18. Cai, M.; Wang, Y.; Jiao, Z.; Shi, Y. Review of fluid and control technology of hydraulic wind turbines. Front. Mech. Eng. 2017, 12, 312–320. [Google Scholar] [CrossRef] [Green Version]
  19. Zhang, D.; Li, W.; Lin, Y.; Bao, J. An overview of hydraulic systems in wave energy application in China. Renew. Sustain. Energy Rev. 2012, 16, 4522–4526. [Google Scholar] [CrossRef]
  20. Gaspar, J.F.; Calvário, M.; Kamarlouei, M.; Soares, C.G. Design tradeoffs of an oil-hydraulic power take-off for wave Energy converters. Renew. Energy 2018, 129, 245–259. [Google Scholar] [CrossRef]
  21. Hansen, R.H.; Kramer, M.M.; Vidal, E. Discrete Displacement Hydraulic Power Take-Off System for the Wavestar Wave Energy Converter. Energies 2013, 6, 4001–4044. [Google Scholar] [CrossRef]
  22. Gaspar, J.F.; Calvário, M.; Kamarlouei, M.; Guedes Soares, C. Power take-off concept for wave energy converters based on oil-hydraulic transformer units. Renew. Energy 2016, 86, 1232–1246. [Google Scholar] [CrossRef]
  23. Trautman, W.C.; Middleton, R.E. Comparison of Hydraulic and Electrical Accessory Systems in Aircraft. SAE Trans. 1944, 52, 94–99. [Google Scholar]
  24. Geyer, M.H.; Treseder, R.C. Weight analysis of aircraft actuators. Trans. Am. Inst. Electr. Eng. Part II Appl. Ind. 1952, 71, 118–126. [Google Scholar]
  25. Southwell, P.H. Mechanical, Electrical or Hydraulic Transmission? Can. Agric. Eng. 1960, 2, 24–27. [Google Scholar]
  26. Foster, K.; Fenney, L. Characteristics and Dynamic Performance of Electrical and Hydraulic Servo-Drives. Proc. JFPS Int. Symp. Fluid Power 1989, 1989, 15–22. [Google Scholar] [CrossRef]
  27. Dransfield, P. Comparing the Responses of Electric, Pneumatic, and Hydraulic Servodrives. IFAC Proc. Vol. 1990, 23, 551–555. [Google Scholar] [CrossRef]
  28. Backé, W. The Present and Future of Fluid Power. Proc. Inst. Mech. Eng. Part I J. Syst. Control Eng. 1993, 207, 193–212. [Google Scholar] [CrossRef]
  29. Nakano, K.; Konno, Y. The comparative study on the characteristics of AC, DC Servomotors and hydraulic motors. Hydraul. Pneum. 1997, 28, 466–472. [Google Scholar] [CrossRef]
  30. Huber, J.E.; Fleck, N.A.; Ashby, M.F. The selection of mechanical actuators based on performance indices. Proc. R. Soc. Lond. Ser. A Math. Phys. Eng. Sci. 1997, 453, 2185–2205. [Google Scholar] [CrossRef]
  31. Durfee, W.; Xia, J.; Hsiao-Wecksler, E. Tiny Hydraulics for Powered Orthotics. In Proceedings of the 2011 IEEE International Conference on Rehabilitation Robotics, Zurich, Switzerland, 29 June–1 July 2011; p. 5975473. [Google Scholar]
  32. Tanaka, Y.; Sakama, S.; Nakano, K.; Kosodo, H. Comparative Study on Dynamic Characteristics of Hydraulic, Pneumatic and Electric Motors. In Proceedings of the ASME/BATH 2013 Symposium on Fluid Power & Motion Control, Sarasota, FL, USA, 6 October 2013; p. V001T001A037. [Google Scholar]
  33. Kazama, T. Comparison of power density of transmission elements in hydraulic, pneumatic, and electric drive systems. Mech. Eng. Lett. 2019, 5, 19–00139. [Google Scholar] [CrossRef] [Green Version]
  34. Sagawa, M.; Fujimura, S.; Togawa, N.; Yamamoto, H.; Matsuura, Y. New material for permanent magnets on a base of Nd and Fe (invited). J. Appl. Phys. 1984, 55, 2083–2087. [Google Scholar] [CrossRef]
  35. Mikami, H.; Ide, K.; Shimizu, Y.; Senoo, M.; Seki, H. Historical evolution of motor technology. Hitachi Rev. 2011, 60, 39. [Google Scholar]
  36. Kusuda, Y. New generation servomotors. Assem. Autom. 1999, 19, 190–196. [Google Scholar] [CrossRef]
  37. Kulshreshtha, A.; Charrier, J. Electric Actuation for Flight and Engine Control: Evolution and Challenges. In Proceedings of the 45th AIAA Aerospace Sciences Meeting and Exhibit, Reno, NV, USA, 8–11 January 2007. AIAA 2007-1391. [Google Scholar]
Figure 1. Transition of power density in electric and hydraulic motors.
Actuators 11 00011 g001
Figure 2. Transition of power density in electric motors and maximum energy products of permanent magnets.
Actuators 11 00011 g002
Figure 3. Transition of power density and rated pressure of hydraulic motors.
Actuators 11 00011 g003
Figure 4. Transition of motor weight.
Actuators 11 00011 g004
Figure 5. Transition of rated torque.
Actuators 11 00011 g005
Figure 6. Transition of power rate.
Actuators 11 00011 g006
Figure 7. Transition of power rate density.
Actuators 11 00011 g007
Figure 8. Correlation between weight and rated torque.
Actuators 11 00011 g008
Figure 9. Correlation between rated rotating speed and rated torque.
Actuators 11 00011 g009
Figure 10. Correlation between motor weight and rated output power.
Actuators 11 00011 g010
Figure 11. Correlation between motor weight and power density.
Actuators 11 00011 g011
Figure 12. Correlation between rated rotating speed and power density: (a) all plots; (b) data in the range surrounded by the red square in Figure 11.
Actuators 11 00011 g012
Figure 13. Correlation between motor weight and power rate.
Actuators 11 00011 g013
Figure 14. Correlation between output energy and power rate.
Actuators 11 00011 g014
Figure 15. Correlation between rated output power and power rate density.
Actuators 11 00011 g015
Figure 16. Summary of motor characteristics.
Actuators 11 00011 g016
Figure 17. Configuration example of electric and hydraulic drive system.
Actuators 11 00011 g017
Table 1. Survey targets for the comparison of servo motor characteristics.
Motor TypeNumber of CompaniesTotal Number of DataNumber of Data Listed in Currently Available Catalogs (as of May 2020)
ElectricAC938441013
AC direct4599308
Brushless DC83954705
Brushed DC62333611
HydraulicSwash plate-type axial piston1248560
Bent axis-type axial piston6726192
Crank-type radial piston4929488
Multistroke-type radial piston3954296
Publisher’s Note: MDPI stays neutral with regard to jurisdictional claims in published maps and institutional affiliations.

