Effects of Glycyrrhizin on Multi-Drug Resistant Pseudomonas aeruginosa


Abstract
:1. Introduction
2. Results
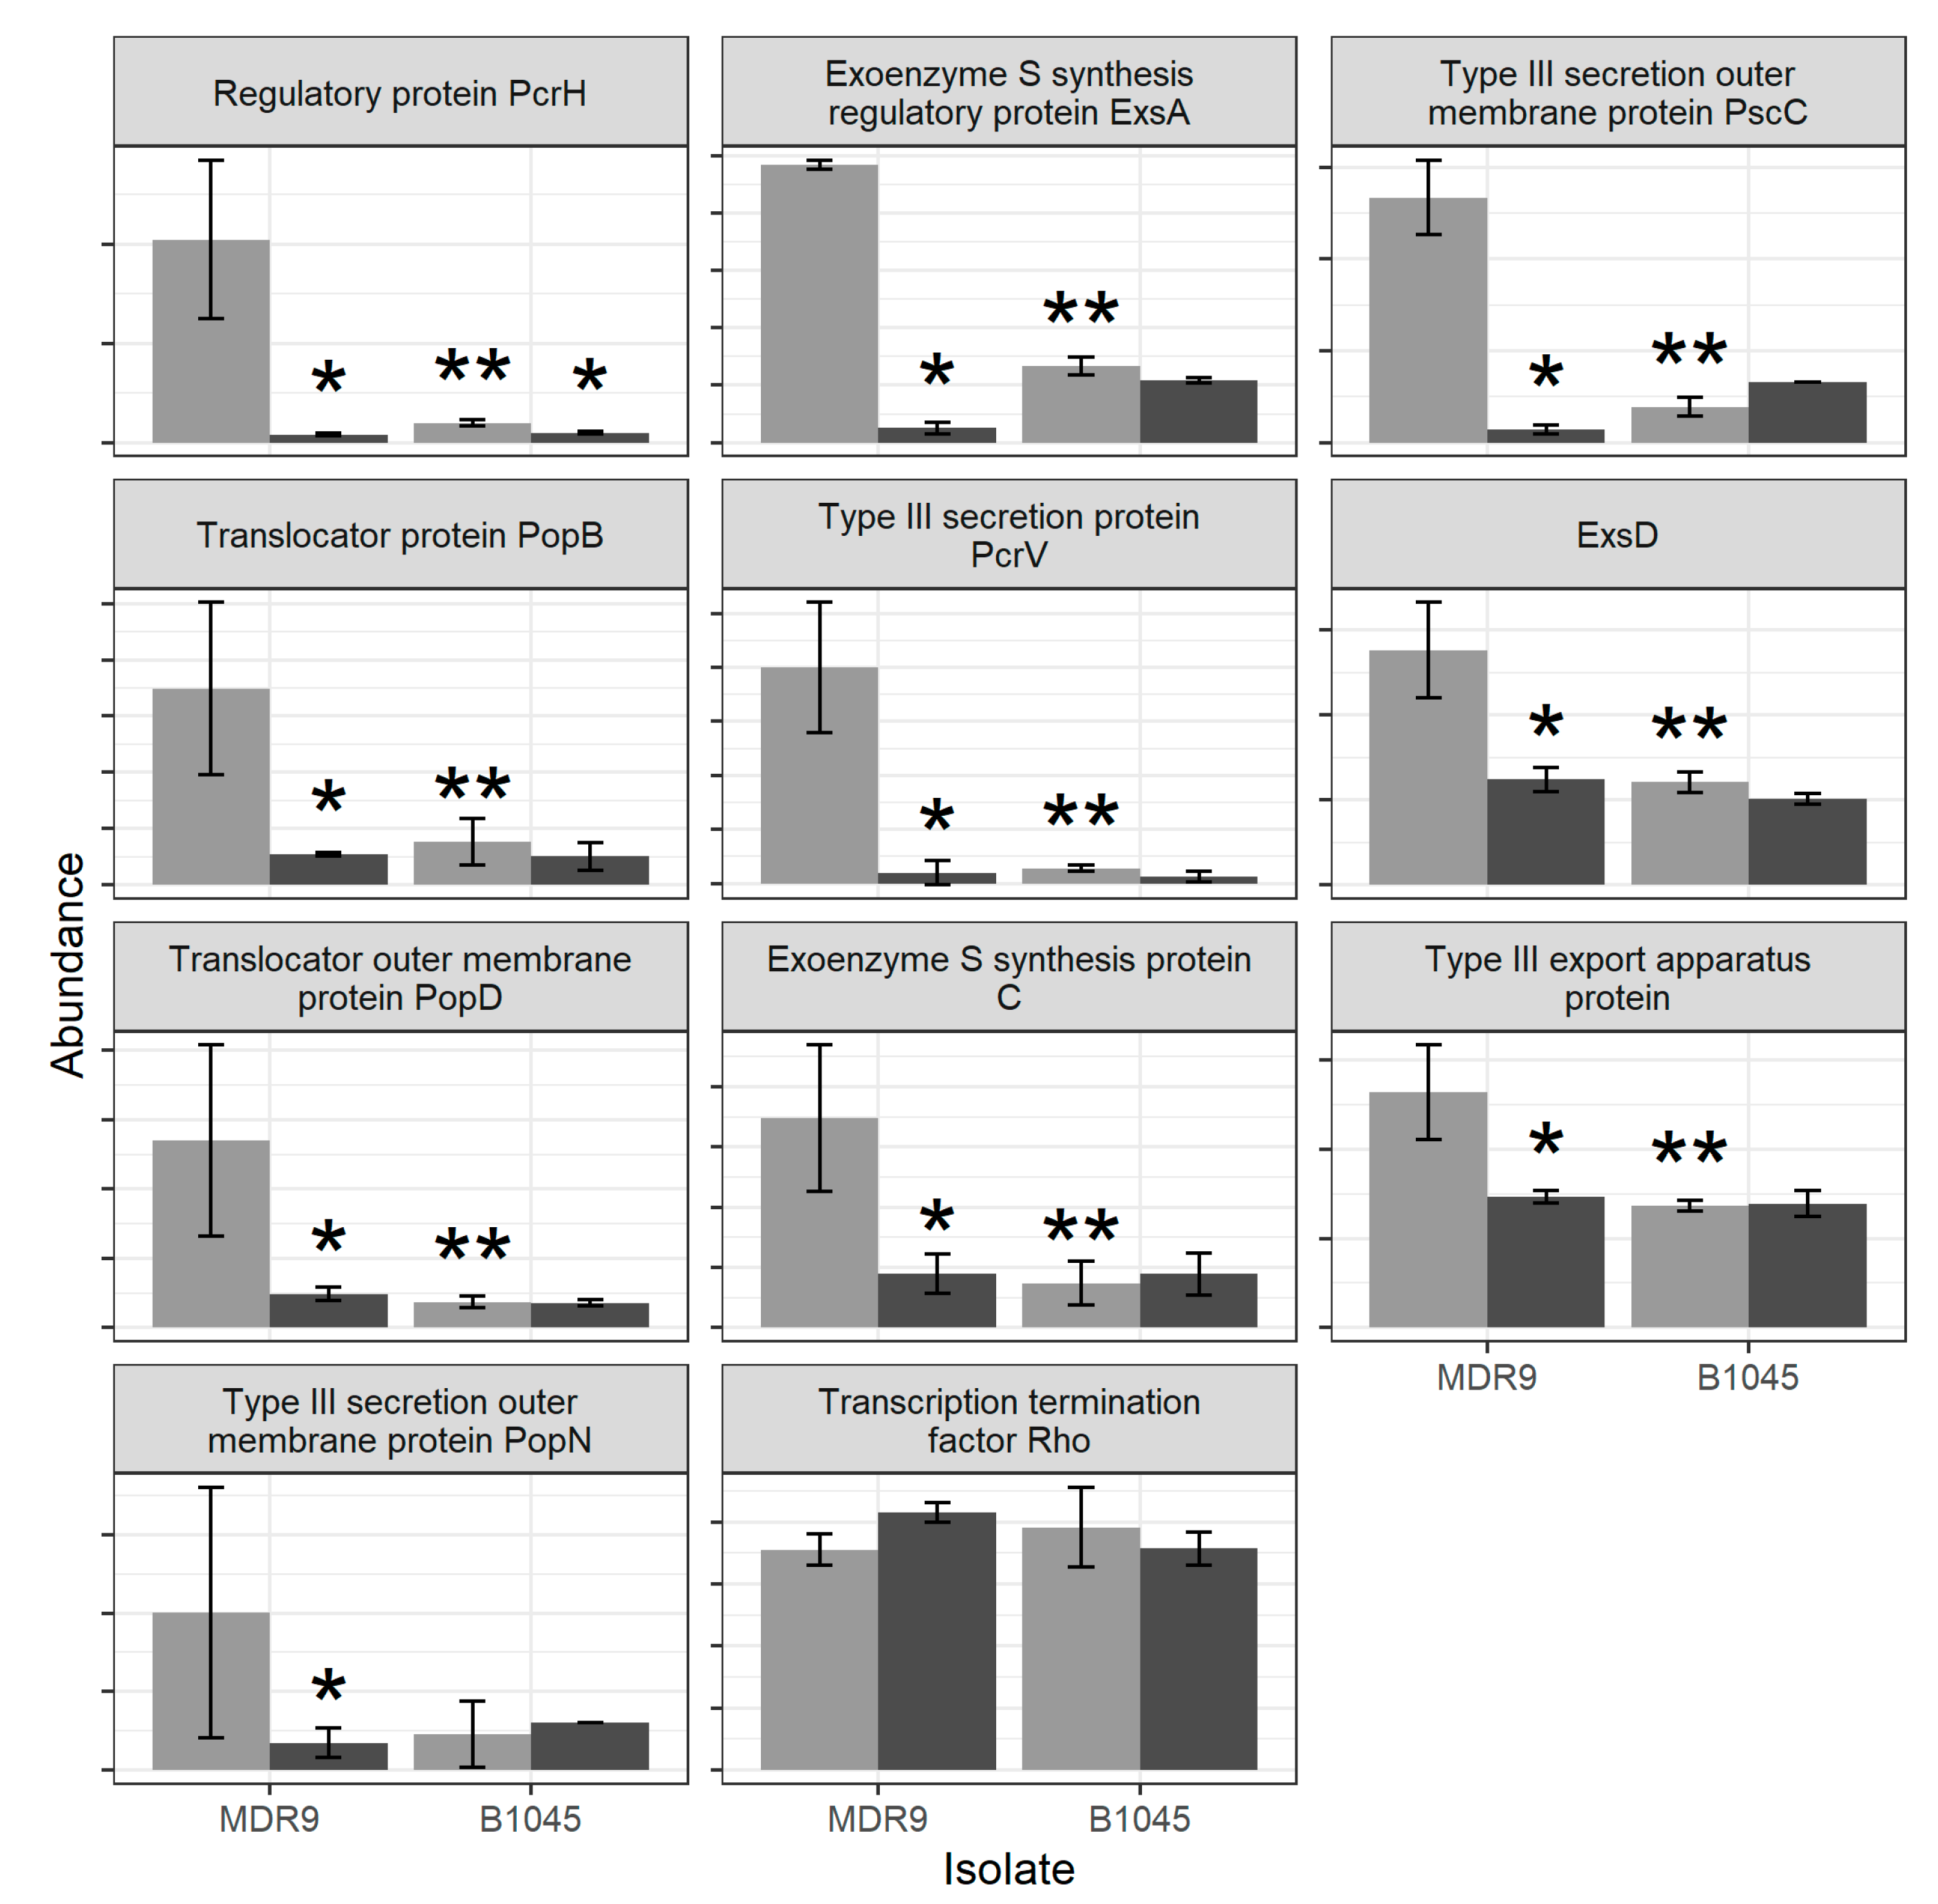
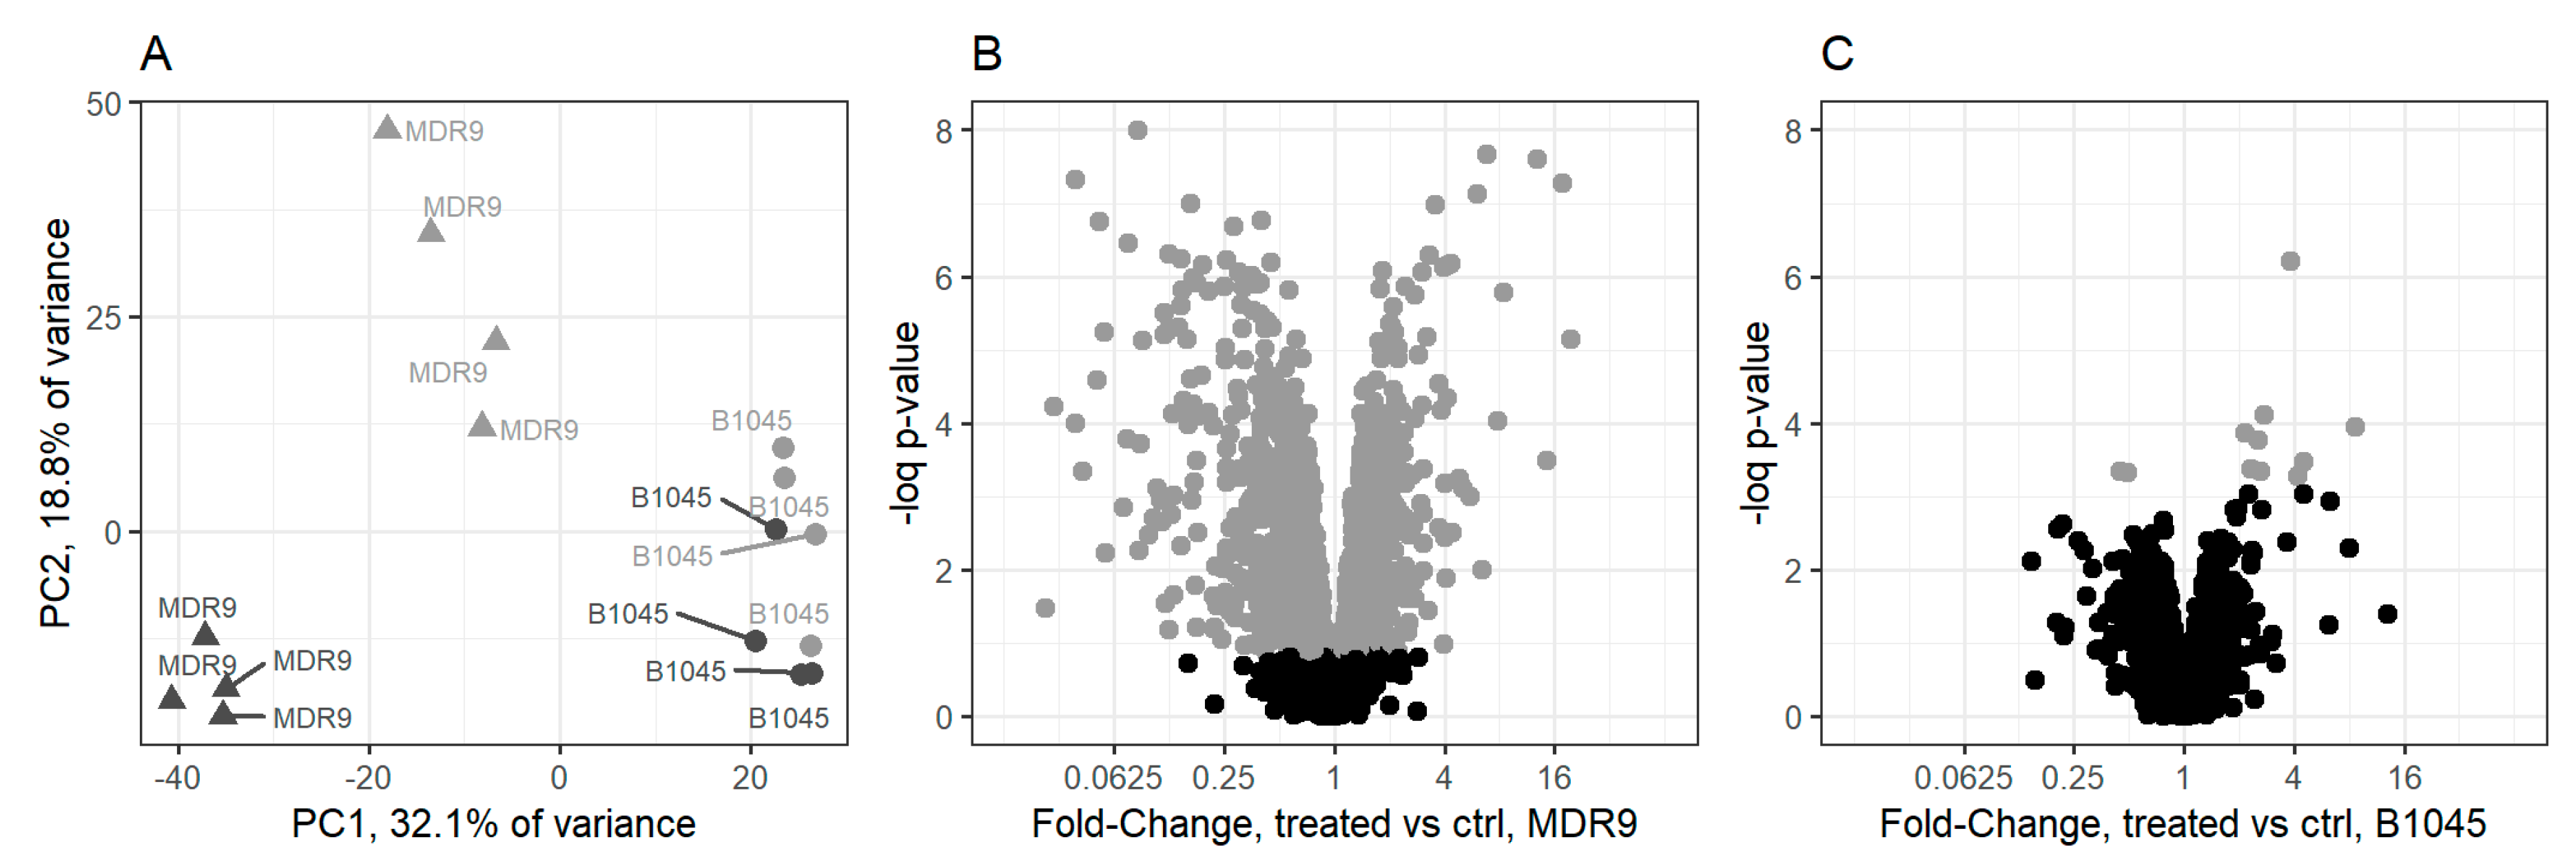
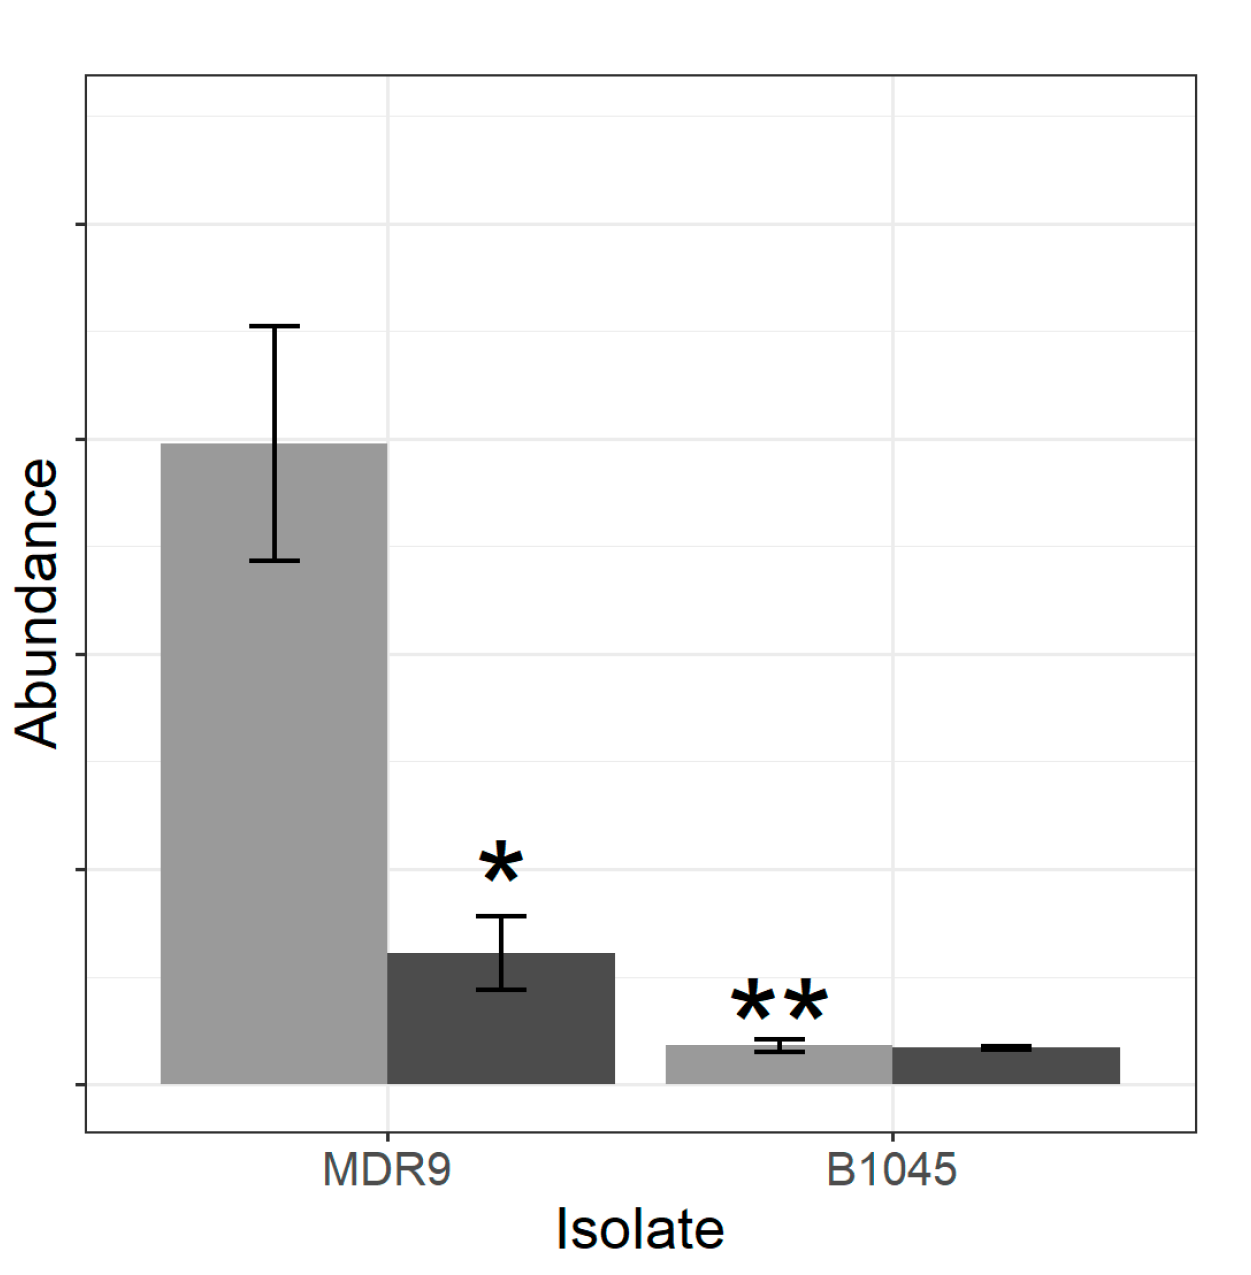
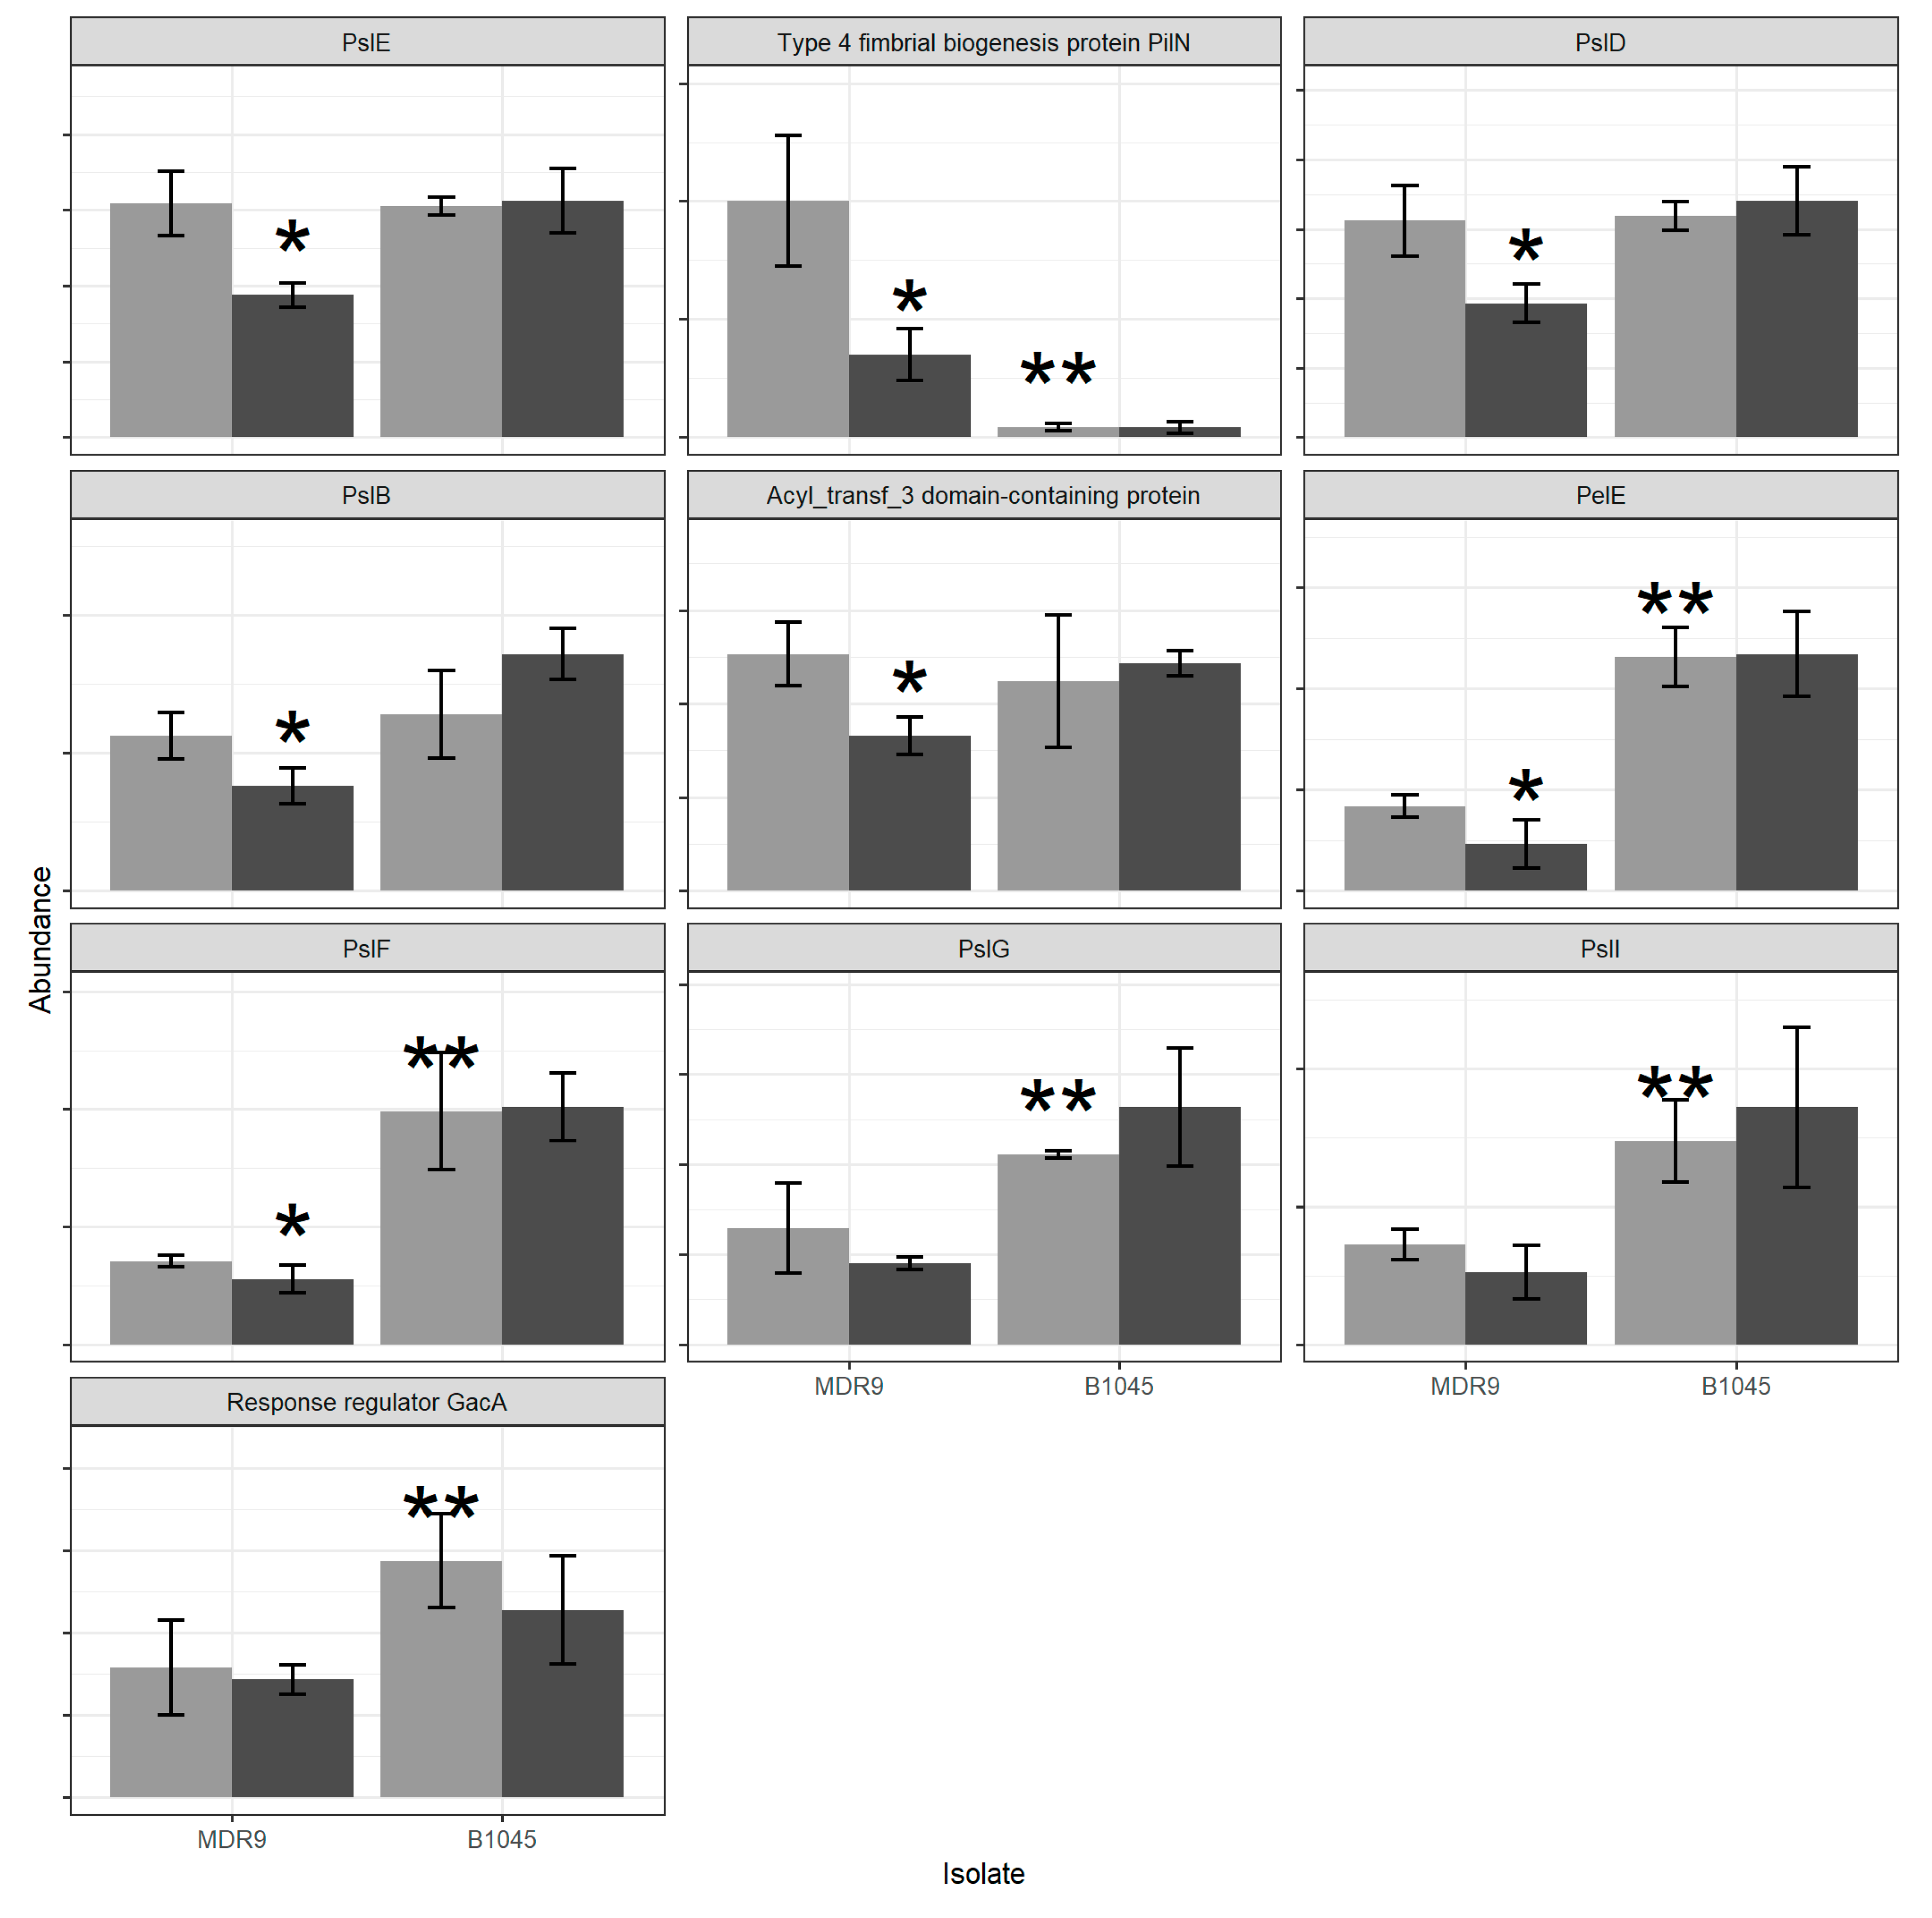
2.1. Proteomics
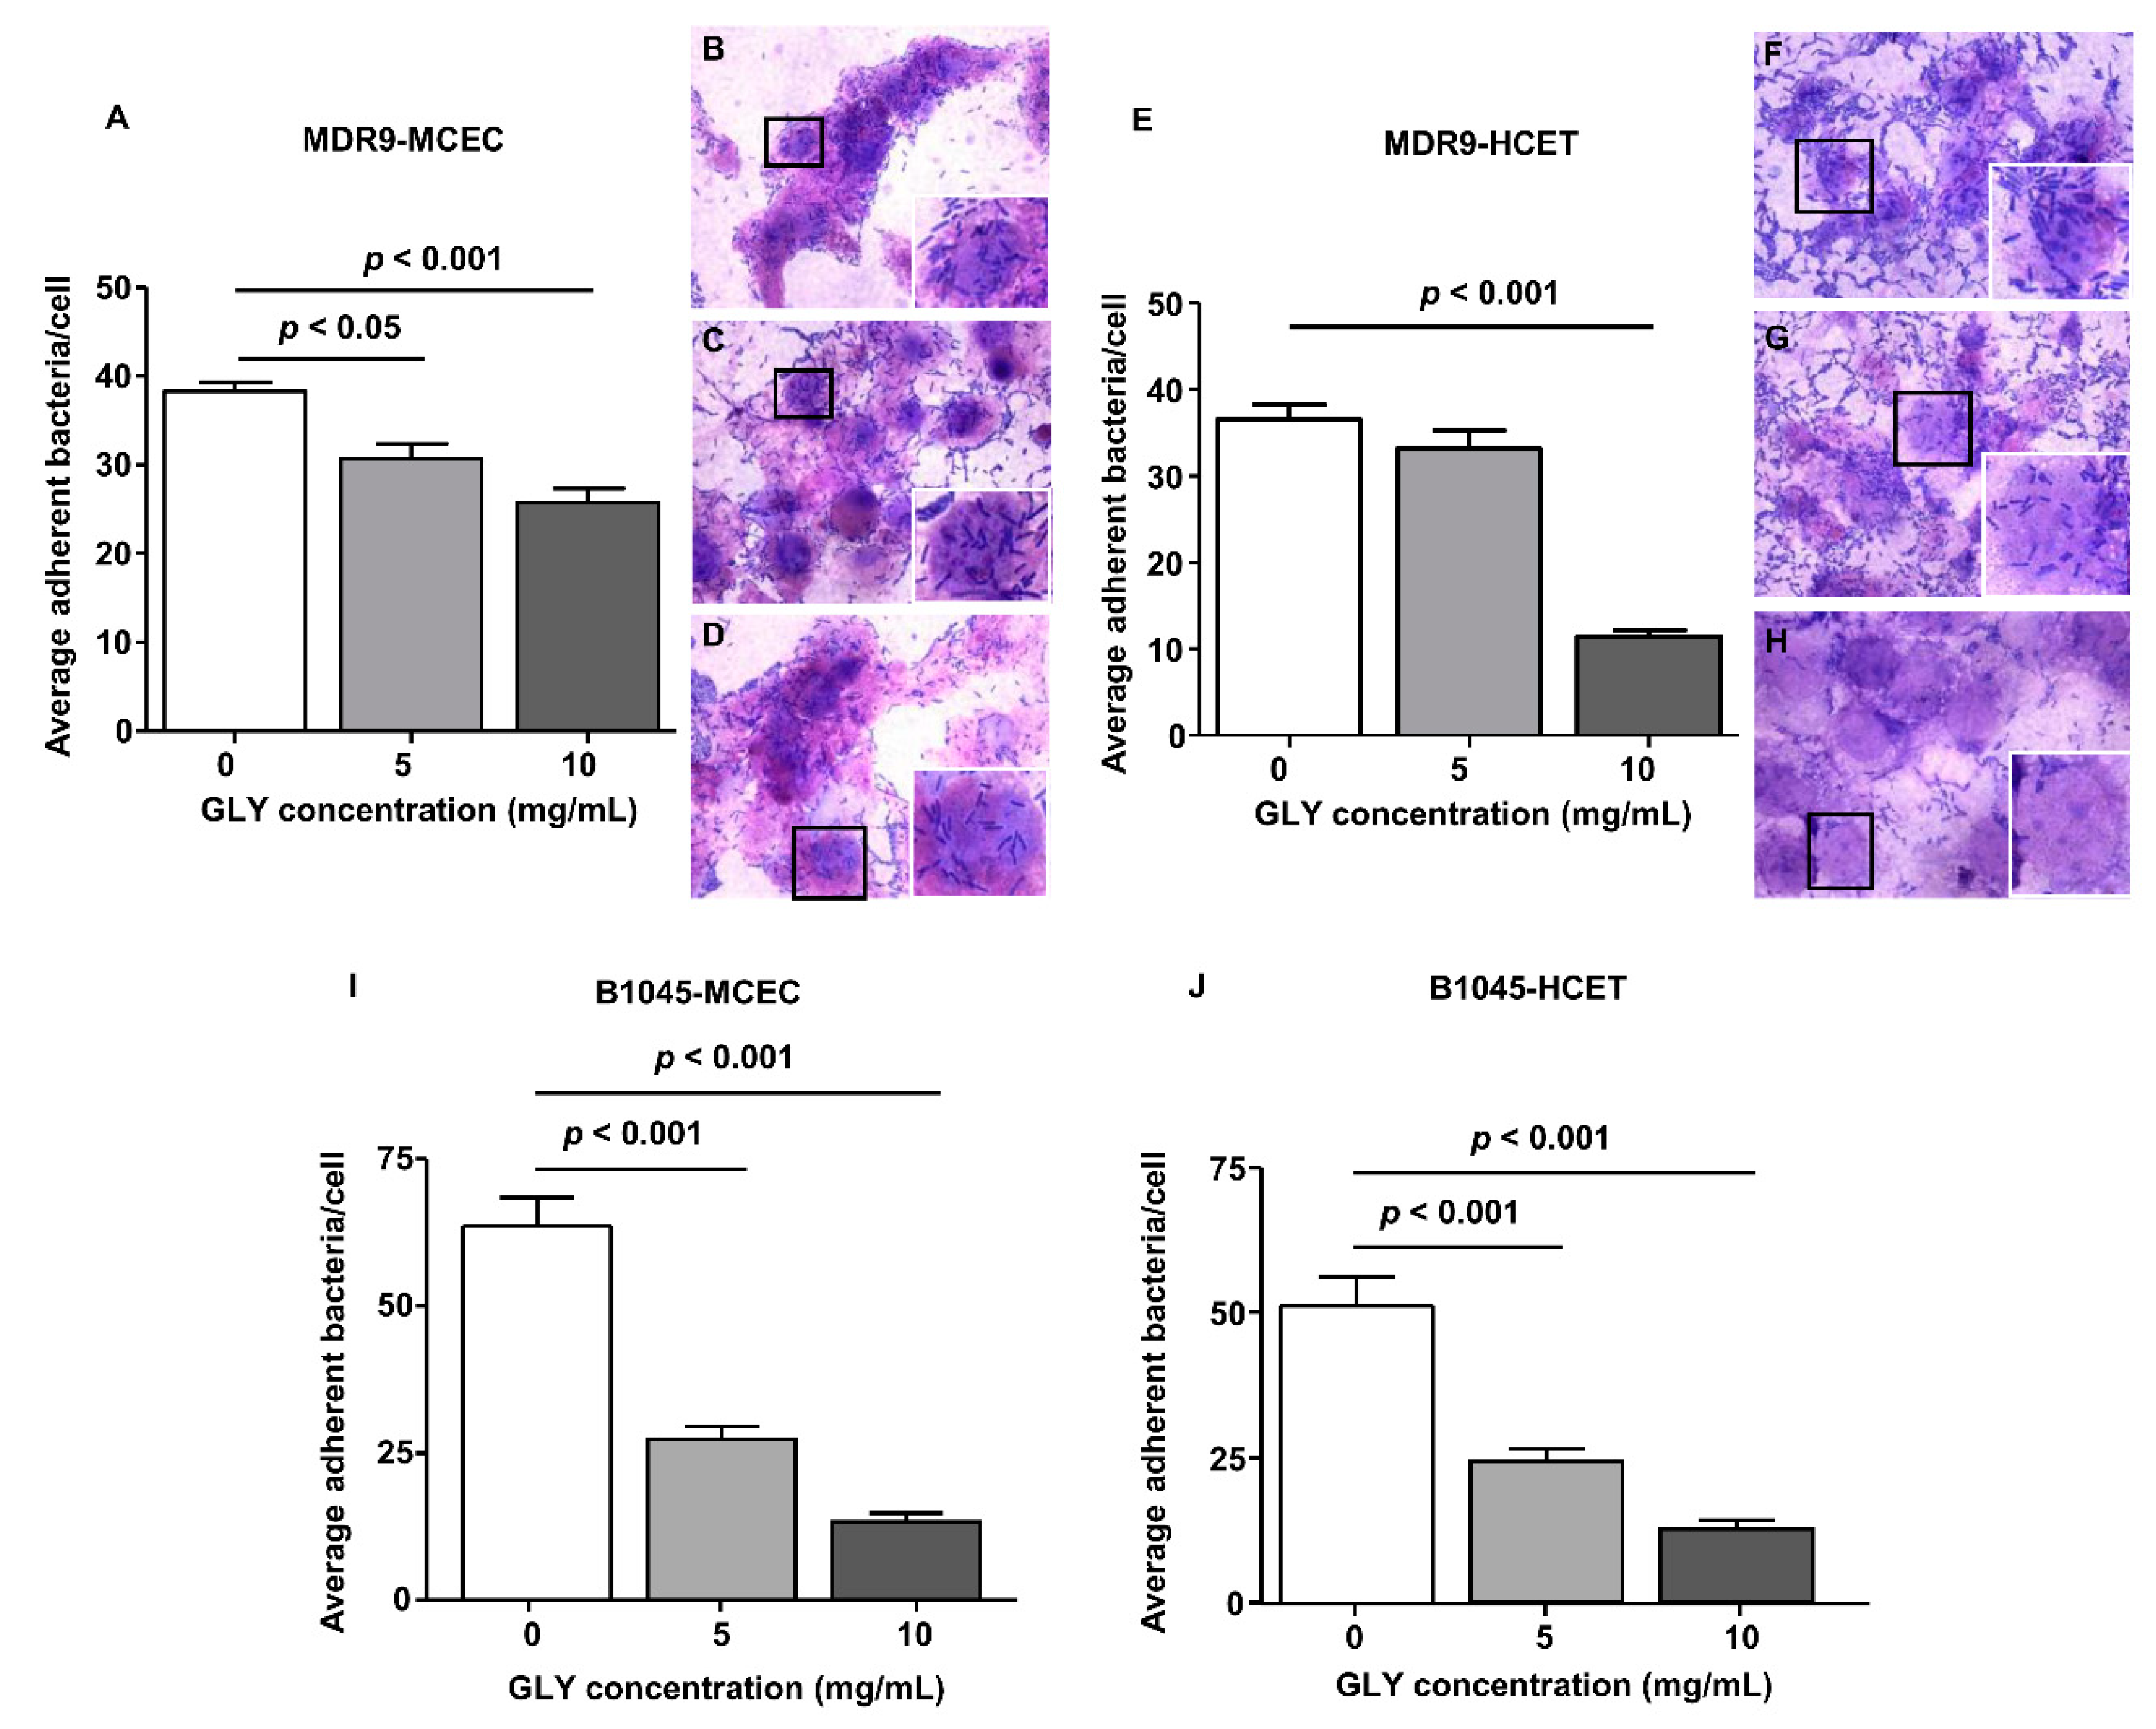
2.2. Bacterial Adherence to Mouse Corneal Epithelial Cells (MCEC) and Human Corneal Epithelial Cells (HCET)
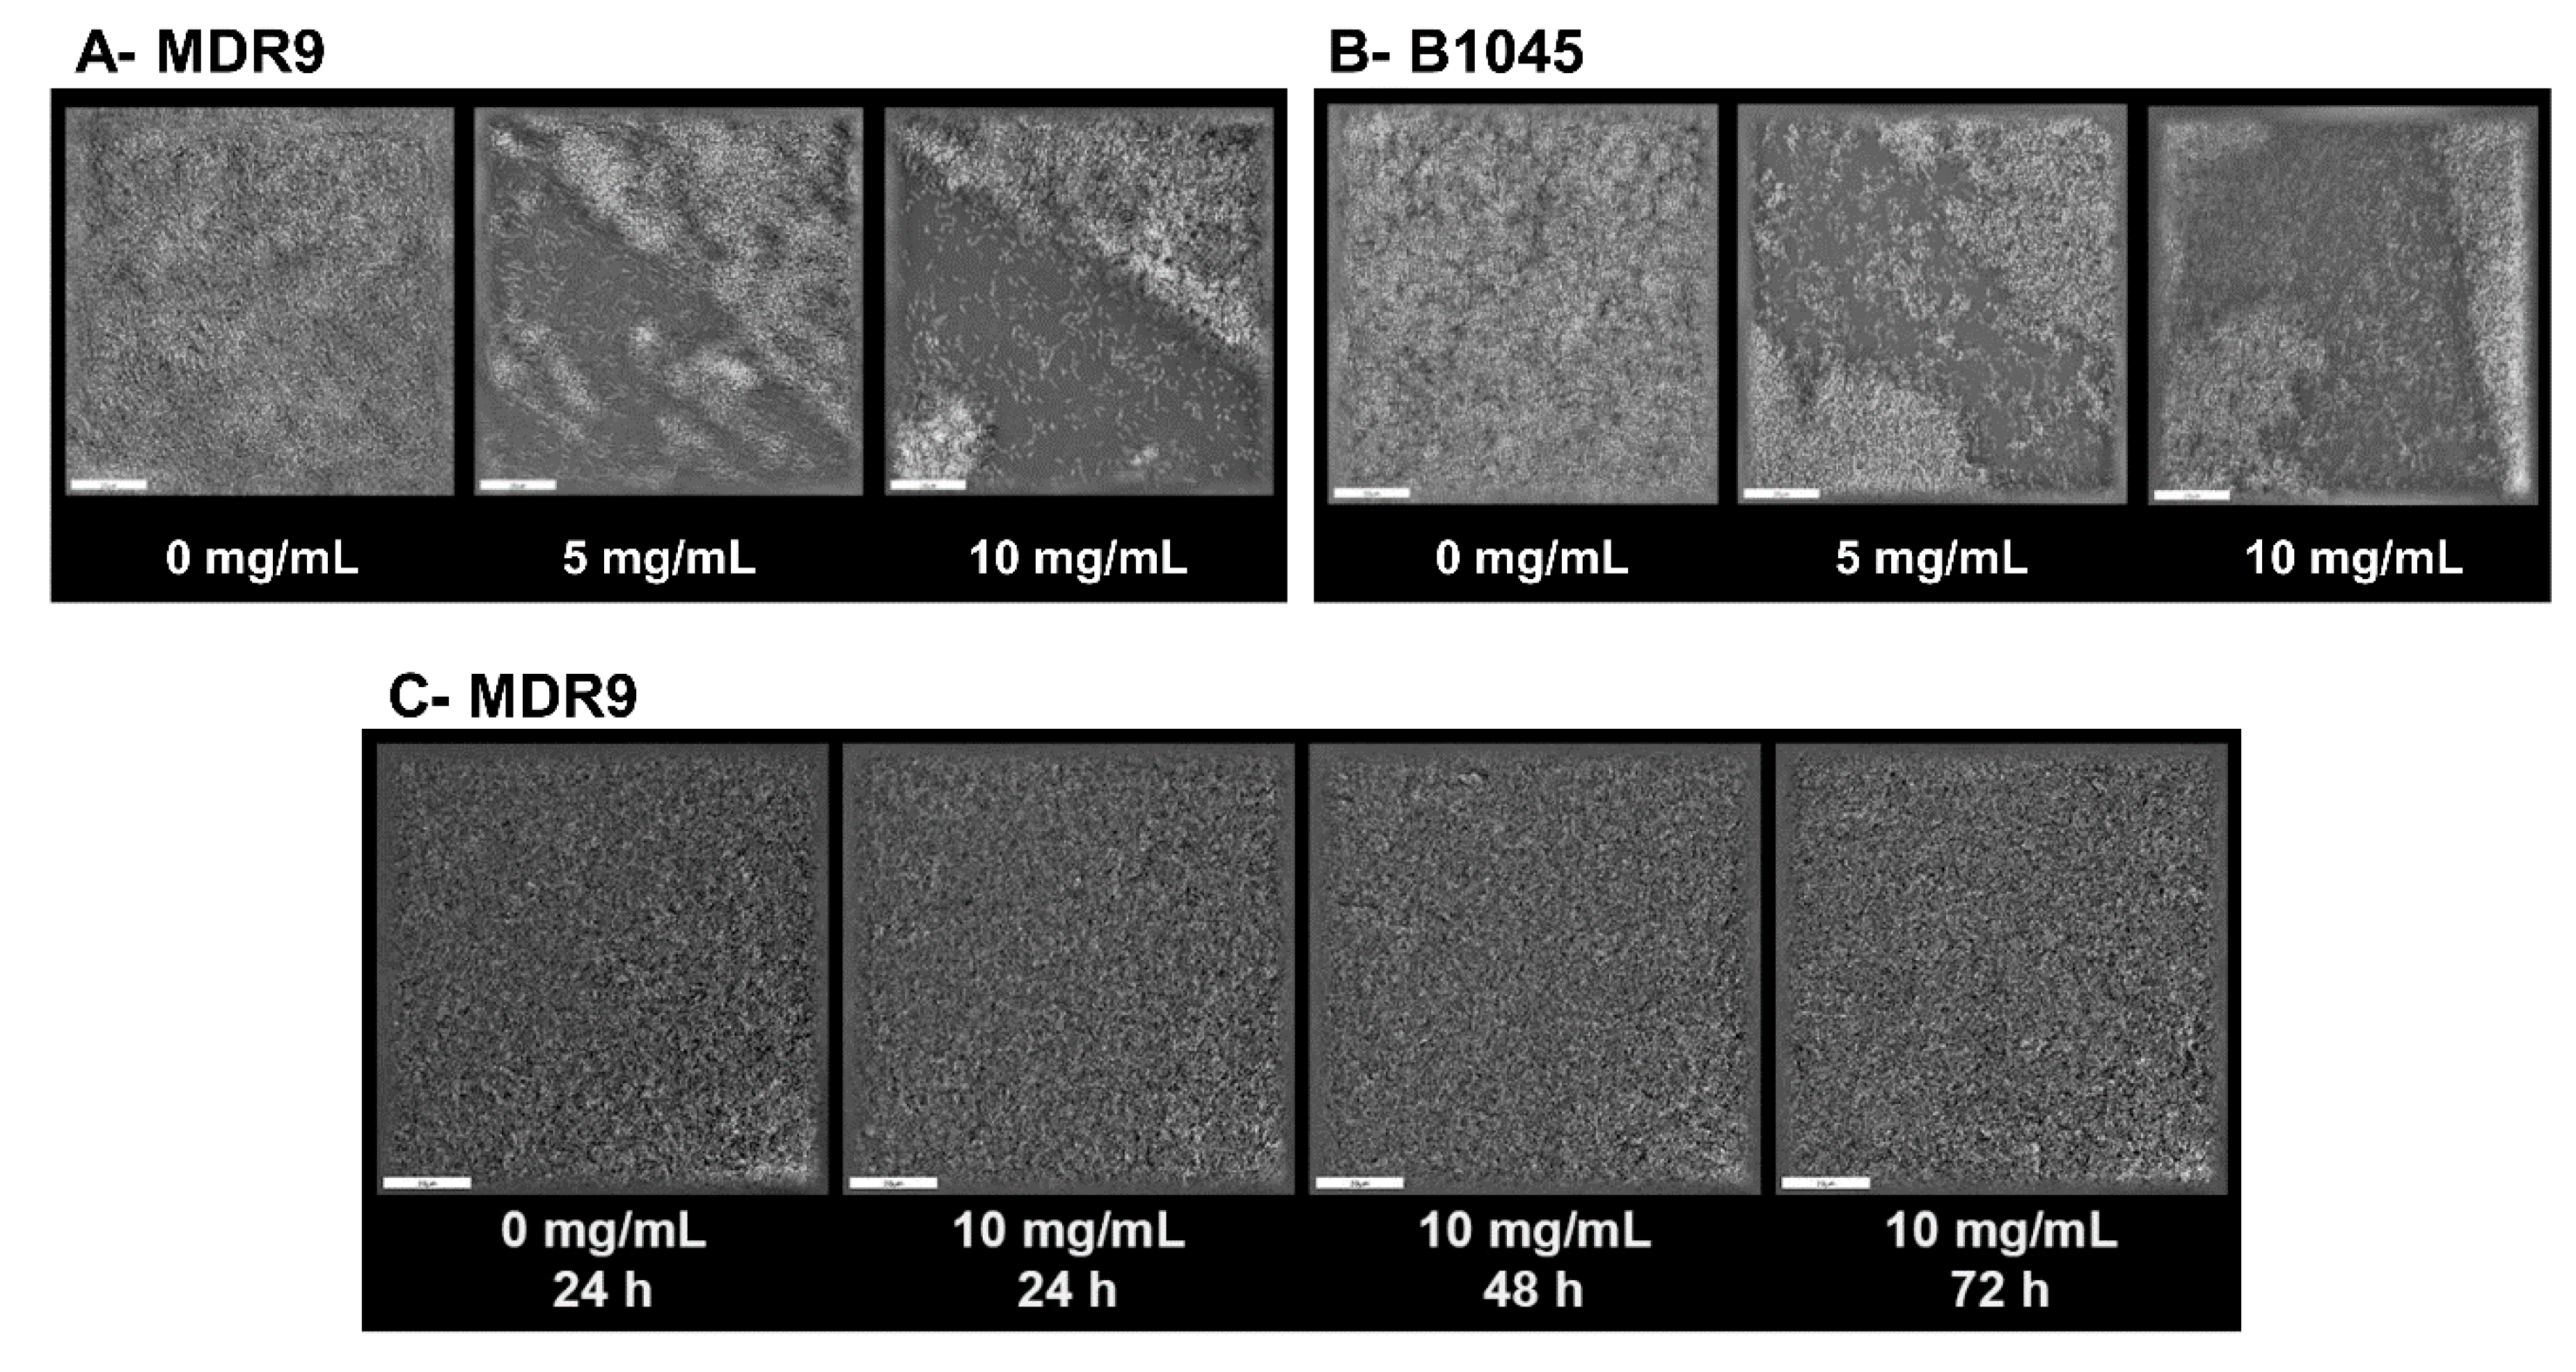
2.3. Biofilm and Dispersal with GLY
3. Discussion
4. Materials and Methods
4.1. Bacterial Culture
4.2. GLY Treatment For Proteomics
4.3. Proteomics
4.4. Bacterial Adherence Assay
4.5. Biofilm Dispersal by Glycyrrhizin
4.6. Statistical Analysis
Supplementary Materials
Author Contributions
Funding
Conflicts of Interest
References
- Li, C.; McClellan, S.A.; Barrett, R.; Hazlett, L.D. Interleukin 17 regulates Mer tyrosine kinase-positive cells in Pseudomonas aeruginosa keratitis. Investig. Ophthalmol. Vis. Sci. 2014, 55, 6886–6900. [Google Scholar] [CrossRef] [Green Version]
- Gadjeva, M.; Nagashima, J.; Zaidi, T.; Mitchell, R.A.; Pier, G.B. Inhibition of macrophage migration inhibitory factor ameliorates ocular Pseudomonas aeruginosa-induced keratitis. PLoS Pathog. 2010, 6, e1000826. [Google Scholar] [CrossRef]
- O’Brien, T.P.; Maguire, M.G.; Fink, N.E.; Alfonso, E.; McDonnell, P. Efficacy of ofloxacin vs. cefazolin and tobramycin in the therapy for bacterial keratitis. Report from the Bacterial Keratitis Study Research Group. Arch. Ophthalmol. 1995, 113, 1257–1265. [Google Scholar] [CrossRef]
- Antibiotic Resistance Threats in the United States, 2019; CDC: Atlanta, GA, USA, 2019.
- Ventola, C.L. The antibiotic resistance crisis. Part 1: Causes and threats. Pharm. Ther. 2015, 40, 277–283. [Google Scholar]
- Antibiotic Resistance Threats in the United States, 2013; CDC: Atlanta, GA, USA, 2013.
- Asl, M.N.; Hosseinzadeh, H. Review of pharmacological effects of Glycyrrhiza sp. and its bioactive compounds. Phytother. Res. 2008, 22, 709–724. [Google Scholar] [CrossRef]
- Ekanayaka, S.A.; McClellan, S.A.; Barrett, R.P.; Kharotia, S.; Hazlett, L.D. Glycyrrhizin reduces HMGB1 and bacterial load in Pseudomonas aeruginosa keratitis. Investig. Ophthalmol. Vis. Sci. 2016, 57, 5799–5809. [Google Scholar] [CrossRef] [Green Version]
- Ekanayaka, S.A.; McClellan, S.A.; Barrett, R.P.; Hazlett, L.D. Topical glycyrrhizin is therapeutic for Pseudomonas aeruginosa keratitis. J. Ocul. Pharmacol. Ther. 2018, 34, 239–249. [Google Scholar] [CrossRef]
- Wang, W.; Zhao, F.; Fang, Y.; Li, X.; Shen, L.; Cao, T.; Zhu, H. Glycyrrhizin protects against porcine endotoxemia through modulation of systemic inflammatory response. Crit. Care 2013, 17, R44. [Google Scholar] [CrossRef] [Green Version]
- Ni, Y.; Kuai, J.; Lu, Z.; Yang, G.; Fu, H.; Wang, J.; Tian, F.; Yan, X.; Zhao, Y.; Wang, Y.; et al. Glycyrrhizin treatment is associated with attenuation of lipopolysaccharide induced acute lung injury by inhibiting cyclooxygenase-2 and inducible nitric oxide synthase expression. J. Surg. Res. 2011, 165, e29–e35. [Google Scholar] [CrossRef]
- Gong, G.; Xiang, L.; Yuan, L.; Hu, L.; Wu, W.; Cai, L.; Yin, L.; Dong, H. Protective effect of glycyrrhizin, a direct HMGB1 inhibitor, on focal cerebral ischemia/reperfusion-induced inflammation, oxidative stress, and apoptosis in rats. PLoS ONE 2014, 9, e89450. [Google Scholar] [CrossRef] [Green Version]
- Arase, Y.; Ikeda, K.; Murashima, N.; Chayama, K.; Tsubota, A.; Koida, I.; Suzuki, Y.; Saitoh, S.; Kobayashi, M.; Kumada, H. The long term efficacy of glycyrrhizin in chronic hepatitis C patients. Cancer 1997, 79, 1494–1500. [Google Scholar] [CrossRef]
- Väremo, L.; Nielsen, J.; Nookaew, I. Enriching the gene set analysis of genome-wide data by incorporating directionality of gene expression and combining statistical hypotheses and methods. Nucleic Acids Res. 2013, 41, 4378–4391. [Google Scholar] [CrossRef]
- Szklarczyk, D.; Gable, A.L.; Lyon, D.; Junge, A.; Wyder, S.; Huerta-Cepas, J.; Simonovic, M.; Doncheva, N.T.; Morris, J.H.; Bork, P.; et al. STRING v11: Protein-protein association networks with increased coverage, supporting functional discovery in genome-wide experimental datasets. Nucleic Acids Res. 2019, 8, D607–D613. [Google Scholar] [CrossRef] [Green Version]
- Galle, M.; Carpentier, I.; Beyaert, R. Structure and function of the type III secretion system of Pseudomonas aeruginosa. Curr. Protein Pept. Sci. 2012, 13, 831–842. [Google Scholar] [CrossRef] [Green Version]
- Pachigolla, G.; Blomquist, P.; Cavanagh, H.D. Microbial keratitis pathogens and antibiotic susceptibilities: A 5-year review of cases at an urban county hospital in north Texas. Eye Contact Lens. 2007, 33, 45–49. [Google Scholar] [CrossRef]
- Liu, Y.; Xiang, J.; Liu, M.; Wang, S.; Lee, R.J.; Ding, H. Protective effects of glycyrrhizic acid by rectal treatment on a TNBS-induced rat colitis model. J. Pharm. Pharmacol. 2011, 63, 439–446. [Google Scholar] [CrossRef]
- Peng, X.; Ekanayaka, S.A.; McClellan, S.A.; Barrett, R.; Vistisen, K.; Hazlett, L.D. Characterization of three ocular clinical isolates of P. aeruginosa: Viability, biofilm formation, adherence, infectivity, and effects of glycyrrhizin. Pathogens 2017, 6, 52. [Google Scholar] [CrossRef]
- Peng, X.; Ekanayaka, S.A.; McClellan, S.A.; Barrett, R.P.; Vistisen, K.; Hazlett, L.D. Effects of glycyrrhizin on a drug resistant isolate of Pseudomonas aeruginosa. EC Opththalmol. 2018, 5, 265–280. [Google Scholar]
- Hazlett, L.D.; Ekanayaka, S.A.; McClellan, S.A.; Francis, R. Glycyrrhizin use for multi-drug resistant Pseudomonas aeruginosa: In vitro and in vivo studies. Investig. Ophthalmol. Vis. Sci. 2019, 60, 2978–2989. [Google Scholar] [CrossRef] [Green Version]
- Pang, Z.; Raudonis, R.; Glick, B.R.; Lin, T.-J.; Cheng, Z. Antibiotic resistance in Pseudomonas aeruginosa: Mechanisms and alternative therapeutic strategies. Biotechnol. Adv. 2019, 37, 177–192. [Google Scholar] [CrossRef]
- Zhao, W.-H.; Hu, Z.Q. β-lactamases identified in clinical isolates of Pseudomonas aeruginosa. Crit. Rev. Microbiol. 2010, 36, 245–258. [Google Scholar] [CrossRef]
- Paterson, D.L.; Bonomo, R.A. Extended-spectrum beta-lactamases: A clinical up-date. Clin. Microbiol. Rev. 2005, 18, 657–686. [Google Scholar] [CrossRef] [Green Version]
- Rawat, D.; Nair, D. Extended-pectrum beta-lactamases in gram negative bacteria. J. Glob. Infect. Dis. 2010, 2, 263–274. [Google Scholar] [CrossRef]
- Wolter, D.J.; Lister, P.D. Mechanisms of b-lactam resistance among Pseudomonas aeruginosa. Curr. Pharm. Des. 2013, 19, 209–222. [Google Scholar] [CrossRef]
- Sauer, K.; Camper, A.K.; Ehrlich, G.D.; Costerton, J.W.; Davies, D.G. Pseudomonas aeruginosa displays multiple phenotypes during development as a biofilm. J. Bacteriol. 2002, 184, 1140–1154. [Google Scholar] [CrossRef] [PubMed] [Green Version]
- Whiteley, M.; Bangera, M.G.; Bumgarner, R.E.; Parsek, M.R.; Teitzel, G.M.; Lory, S.; Greenberg, E.P. Gene expression in Pseudomonas aeruginosa biofilms. Nature 2001, 413, 860–864. [Google Scholar] [CrossRef]
- Franklin, M.J.; Nivens, D.E.; Weadge, J.T.; Howell, P.L. Biosynthesis of the Pseudomonas aeruginosa extracellular polysaccharides, alginate, Pel, and Psl. Front. Microbiol. 2011, 2, 167. [Google Scholar] [CrossRef] [Green Version]
- Colvin, K.M.; Irie, Y.; Tart, C.S.; Urbano, R.; Whitney, J.C.; Ryder, C.; Howell, P.L.; Wozniak, D.J.; Parsek, M.R. The Pel and Psl polysaccharides provide Pseudomonas aeruginosa structural redundancy within the biofilm matrix. Environ. Microbiol. 2012, 14, 1913–1928. [Google Scholar] [CrossRef] [Green Version]
- Jackson, K.D.; Starkey, M.; Kremer, S.; Parsek, M.R.; Wozniak, D.J. Identification of psl, a locus encoding a potential exopolysaccharide that is essential for Pseudomonas aeruginosa PAO1 biofilm formation. J. Bacteriol. 2004, 186, 4466–4475. [Google Scholar] [CrossRef] [Green Version]
- Ma, L.; Jackson, K.D.; Landry, R.M.; Parsek, M.R.; Wozniak, D.J. Analysis of Pseudomonas aeruginosa conditional Psl variants reveals roles for the Psl polysaccharide in adhesion and maintaining biofilm structure postattachment. J. Bacteriol. 2006, 188, 8213–8221. [Google Scholar] [CrossRef] [Green Version]
- Kirisits, M.J.; Prost, L.; Starkey, M.; Parsek, M.R. Characterization of colony morphology variants isolated from Pseudomonas aeruginosa biofilms. Appl. Environ. Microbiol. 2005, 71, 4809–4821. [Google Scholar] [CrossRef] [PubMed] [Green Version]
- Parkins, M.D.; Ceri, H.; Storey, D.G. Pseudomonas aeruginosa GacA, a factor in multihost virulence, is also essential for biofilm formation. Mol. Microbiol. 2001, 40, 1215–1226. [Google Scholar] [CrossRef] [PubMed]
- Hahn, H.P. The type 4 pilus is the major virulence-associated adhesin of Pseudomonas aeruginosa—A review. Gene 1997, 192, 99–108. [Google Scholar] [CrossRef]
- Hauser, A.R. The type III secretion system of Pseudomonas aeruginosa: Infection by injection. Nat. Rev. Microbiol. 2009, 7, 654–665. [Google Scholar] [CrossRef] [Green Version]
- Roy-Burman, A.; Savel, R.H.; Racine, S.; Swanson, B.L.; Revadigar, N.S.; Fujimoto, J.; Sawa, T.; Frank, D.W.; Wiener-Kronish, J.P. Type III protein secretion is associated with death in lower respiratory and systemic Pseudomonas aeruginosa infections. J. Infect. Dis. 2001, 183, 1767–1774. [Google Scholar] [CrossRef] [Green Version]
- Bröms, J.E.; Forslund, A.-L.; Forsberg, A.; Francis, M.S. PcrH of Pseudomonas aeruginosa is essential for secretion and assembly of the type III translocon. J. Infect. Dis. 2003, 188, 1909–1921. [Google Scholar] [CrossRef] [Green Version]
- Mueller, C.A.; Broz, P.; Cornelis, G.R. The type III secretion system tip complex and translocon. Mol. Microbiol. 2008, 68, 1085–1095. [Google Scholar] [CrossRef]
- Nanao, M.; Ricard-Blum, S.; DiGuilmi, A.M.; Lemaire, D.; Lascoux, D.; Chabert, J.; Attree, I.; Dessen, A. Type III secretion proteins PcrV and PcrG from Pseudomonas aeruginosa form a 1:1 complex through high affinity interactions. BCM Microbiol. 2003, 3, 21. [Google Scholar] [CrossRef] [Green Version]
- Sawa, T.; Yahr, T.L.; Ohara, M.; Kurahashi, K.; Gropper, M.A.; Weiner-Kronish, J.P.; Frank, D.W. Active and passive immunization with the Pseudomonas V antigen protects against type III intoxication and lung injury. Nat. Med. 1999, 5, 392–398. [Google Scholar] [CrossRef]
- Yang, H.; Shan, Z.; Kim, J.; Wu, W.; Lian, W.; Zeng, L.; Xing, L.; Jin, S. Regulatory role of PopN and its interacting partners in type III secretion of Pseudomonas aeruginosa. J. Bacteriol. 2007, 189, 2599–2609. [Google Scholar] [CrossRef] [Green Version]
- Dasgupta, N.; Lykken, G.L.; Wolfgang, M.C.; Yahr, T.L. A novel anti-anti-activator mechanism regulates expression of the Pseudomonas aeruginosa type III secretion system. Mol. Miocrobiol. 2004, 53, 297–308. [Google Scholar] [CrossRef] [PubMed]
- Yahr, T.L.; Frank, D.W. Transcriptional organization of the trans-regulatory locus which controls exoenzyme S synthesis in Pseudomonas aeruginosa. J. Bacteriol. 1994, 176, 3832–3838. [Google Scholar] [CrossRef] [Green Version]
- Brutinel, E.D.; Vakulskas, C.A.; Yahr, T.L. ExsD inhibits expression of the Pseudomonas aeruginosa type III secretion system by disrupting ExsA self-asssociation and DNA binding activity. J. Bacteriol. 2010, 192, 1479–1486. [Google Scholar] [CrossRef] [PubMed] [Green Version]
- Mitra, P.; Ghosh, G.; Hafeezunnisa, M.; Sen, R. Rho protein: Roles and mechanisms. Annu. Rev. Microbiol. 2017, 71, 687–709. [Google Scholar] [CrossRef] [PubMed]
- Hazlett, L.; Masinick, S.; Mezger, B.; Barrett, R.; Kurpakus, M.; Garrett, M. Ultrastructural immunohistological and biochemical characterization of cultured mouse corneal epithelial cells. Ophthalmic Res. 1996, 28, 50–56. [Google Scholar] [CrossRef] [PubMed]
- Stepanovic, S.; Vukovic, D.; Hola, V.; Di Bonaventura, G.; Djukic, S.; Cirkovic, I.; Ruzicka, F. Quantification of biofilm in microtiter plates: Overview of testing conditions and practical recommendations for assessment of biofilm production by staphylococci. APMIS 2007, 115, 891–899. [Google Scholar] [CrossRef]
- Namivandi-Zangeneh, R.; Kwan, R.J.; Nguyen, T.-K.; Yeow, J.; Byrne, F.L.; Oehlers, S.H.; Wong, E.H.H.; Boyer, C. The effect of polymer topology and chain length on the antimicrobial activity and hemocompatibility of amphiphilic ternary copolymers. Polym. Chem. 2018, 9, 1735–1744. [Google Scholar] [CrossRef]
- Ritchie, M.E.; Phipson, B.; Wu, D.; Hu, Y.; Law, C.W.; Shi, W.; Smyth, G.K. Limma powers differential expression analyses for RNA-sequencing and microarray studies. Nucleic Acids Res. 2015, 43, e47. [Google Scholar] [CrossRef]
- Storey, J.D.; Tibshirani, R. Statistical significance for genomewide studies. Proc. Natl. Acad. Sci. USA 2003, 100, 9440–9445. [Google Scholar] [CrossRef] [Green Version]


| Set Name | Proteins in Set | GLY vs. ctrl MDR9 | GLY vs. ctrl B1045 | MDR9 vs. B1045 |
|---|---|---|---|---|
| Antibiotic Resistance | 2 | * −5.12 | 0.38 | * 11.98 |
| Biofilms/Adherence | 17 | * −1.77 | 0.32 | −0.63 |
| Virulence/Quorum | 7 | −0.77 | 0.99 | −0.31 |
| Set ID | Description | Score * | FDR | Proteins in Set | Similar Pathways |
|---|---|---|---|---|---|
| CL:7881 | mixed, incl.Biosynthesis of siderophore group | ||||
| nonribosomal peptides, and Acetyl-coenzyme A | −5.86 | 3.07 × 10⁻⁶ | 8 | 15 | |
| transporter 1 | |||||
| CL:5839 | mixed, incl Bacterial secretion system, | ||||
| and Tir chaperone protein (CesT) family | −3.32 | 4.61 × 10⁻⁶ | 13 | 14 | |
| CL:126 | Ribosome | 1.28 | 6.91 × 10⁻⁶ | 48 | 17 |
| CL:1605 | Citrate cycle (TCA cycle) | 2.19 | 6.40 × 10⁻⁴ | 16 | 4 |
| CL:2538 | Quinone, and Thioredoxin-like [2Fe-2S] | ||||
| ferredoxin | 2.62 | 8.10 × 10⁻⁴ | 11 | 3 |
© 2020 by the authors. Licensee MDPI, Basel, Switzerland. This article is an open access article distributed under the terms and conditions of the Creative Commons Attribution (CC BY) license (http://creativecommons.org/licenses/by/4.0/).
Share and Cite
Carruthers, N.J.; McClellan, S.A.; Somayajulu, M.; Pitchaikannu, A.; Bessert, D.; Peng, X.; Huitsing, K.; Stemmer, P.M.; Hazlett, L.D. Effects of Glycyrrhizin on Multi-Drug Resistant Pseudomonas aeruginosa. Pathogens 2020, 9, 766. https://doi.org/10.3390/pathogens9090766
Carruthers NJ, McClellan SA, Somayajulu M, Pitchaikannu A, Bessert D, Peng X, Huitsing K, Stemmer PM, Hazlett LD. Effects of Glycyrrhizin on Multi-Drug Resistant Pseudomonas aeruginosa. Pathogens. 2020; 9(9):766. https://doi.org/10.3390/pathogens9090766
Chicago/Turabian StyleCarruthers, Nicholas J., Sharon A. McClellan, Mallika Somayajulu, Ahalya Pitchaikannu, Denise Bessert, Xudong Peng, Kylie Huitsing, Paul M. Stemmer, and Linda D. Hazlett. 2020. "Effects of Glycyrrhizin on Multi-Drug Resistant Pseudomonas aeruginosa" Pathogens 9, no. 9: 766. https://doi.org/10.3390/pathogens9090766
APA StyleCarruthers, N. J., McClellan, S. A., Somayajulu, M., Pitchaikannu, A., Bessert, D., Peng, X., Huitsing, K., Stemmer, P. M., & Hazlett, L. D. (2020). Effects of Glycyrrhizin on Multi-Drug Resistant Pseudomonas aeruginosa. Pathogens, 9(9), 766. https://doi.org/10.3390/pathogens9090766