1. Introduction
Cryptococcus neoformans is an opportunistic pathogen that is able to infect and survive long term in many different species. To accomplish extended survival, even in healthy hosts, it resides and replicates in macrophages and other macrophage-like immune cells. To gain additional insight into the pathways involved in intracellular replication of
C. neoformans, the serotype A strain H99W [
1] was serially passaged in the wax moth larvae
Galleria mellonella for 100
C. neoformans generations (15 passages).
Galleria mellonella is an increasingly useful invertebrate host for
C. neoformans. The waxworms are inexpensive, easy to work with, and contain phagocytic hemocytes which, similarly to mammalian macrophages and neutrophils, phagocytose and kill
C. neoformans [
2], likely through the production of high levels of reactive oxygen species (ROS) [
3]. Additionally, numerous
C. neoformans virulence factors are important in both
G. mellonella, as well as mammalian infections [
2], particularly the capsule, which has been shown to have numerous effects on the host immune response [
4]. We hypothesized that serial passage of
C. neoformans in
G. mellonella would result in a strain that would be adapted to the larval environment with selection pressures provided by the organismal environment and various aspects of the larval immune response, and thus be more resistant to ROS and/or have a higher level of intracellular replication.
To test these ideas, several experiments were undertaken including comparisons between the parent and adapted strain in in vitro growth medium containing Galleria hemolymph, fungal burden in Galleria larvae, fungal burden and killing in mouse and human macrophages, differential gene expression during infection in Galleria larvae, in vitro susceptibility to hydrogen peroxide, hydrogen peroxide production from Galleria hemocytes during infection, and histological features of the larval immune response.
Overall, these data suggested that strain P15′s adaptation involved reducing the hemocyte ROS response by increasing capsule shedding without blocking the entire immune response. However, this adaptation was not generally successful across species, as it was not protective in mouse or human macrophages. Thus, the use of serial passage experiments has led to an increased understanding of how
C. neoformans interacts with the
G. mellonella immune response and illustrates how it evades and/or disables specific components of the
G. mellonella ROS. These data have resulted in a better understanding of how this yeast evolves under selection and illustrates that, similar to in mice and humans [
4], capsule is a potent immune modulator in
G. mellonella.
3. Discussion
A number of invertebrate and non-mammalian vertebrate host models, such as zebrafish [
15,
16], worms [
17,
18], flies [
19,
20], amoebae [
21,
22] and moths [
2,
23], have been used to understand host-microbial interactions. These models have numerous benefits, such as reduced cost, ease of handling, less limitations on use, a more straightforward system, and often better genetic tools. Thus, these kinds of host models contribute greatly to understanding microbial pathogenesis. Serial passage of the pathogen,
C. neoformans, through a distinct host environment,
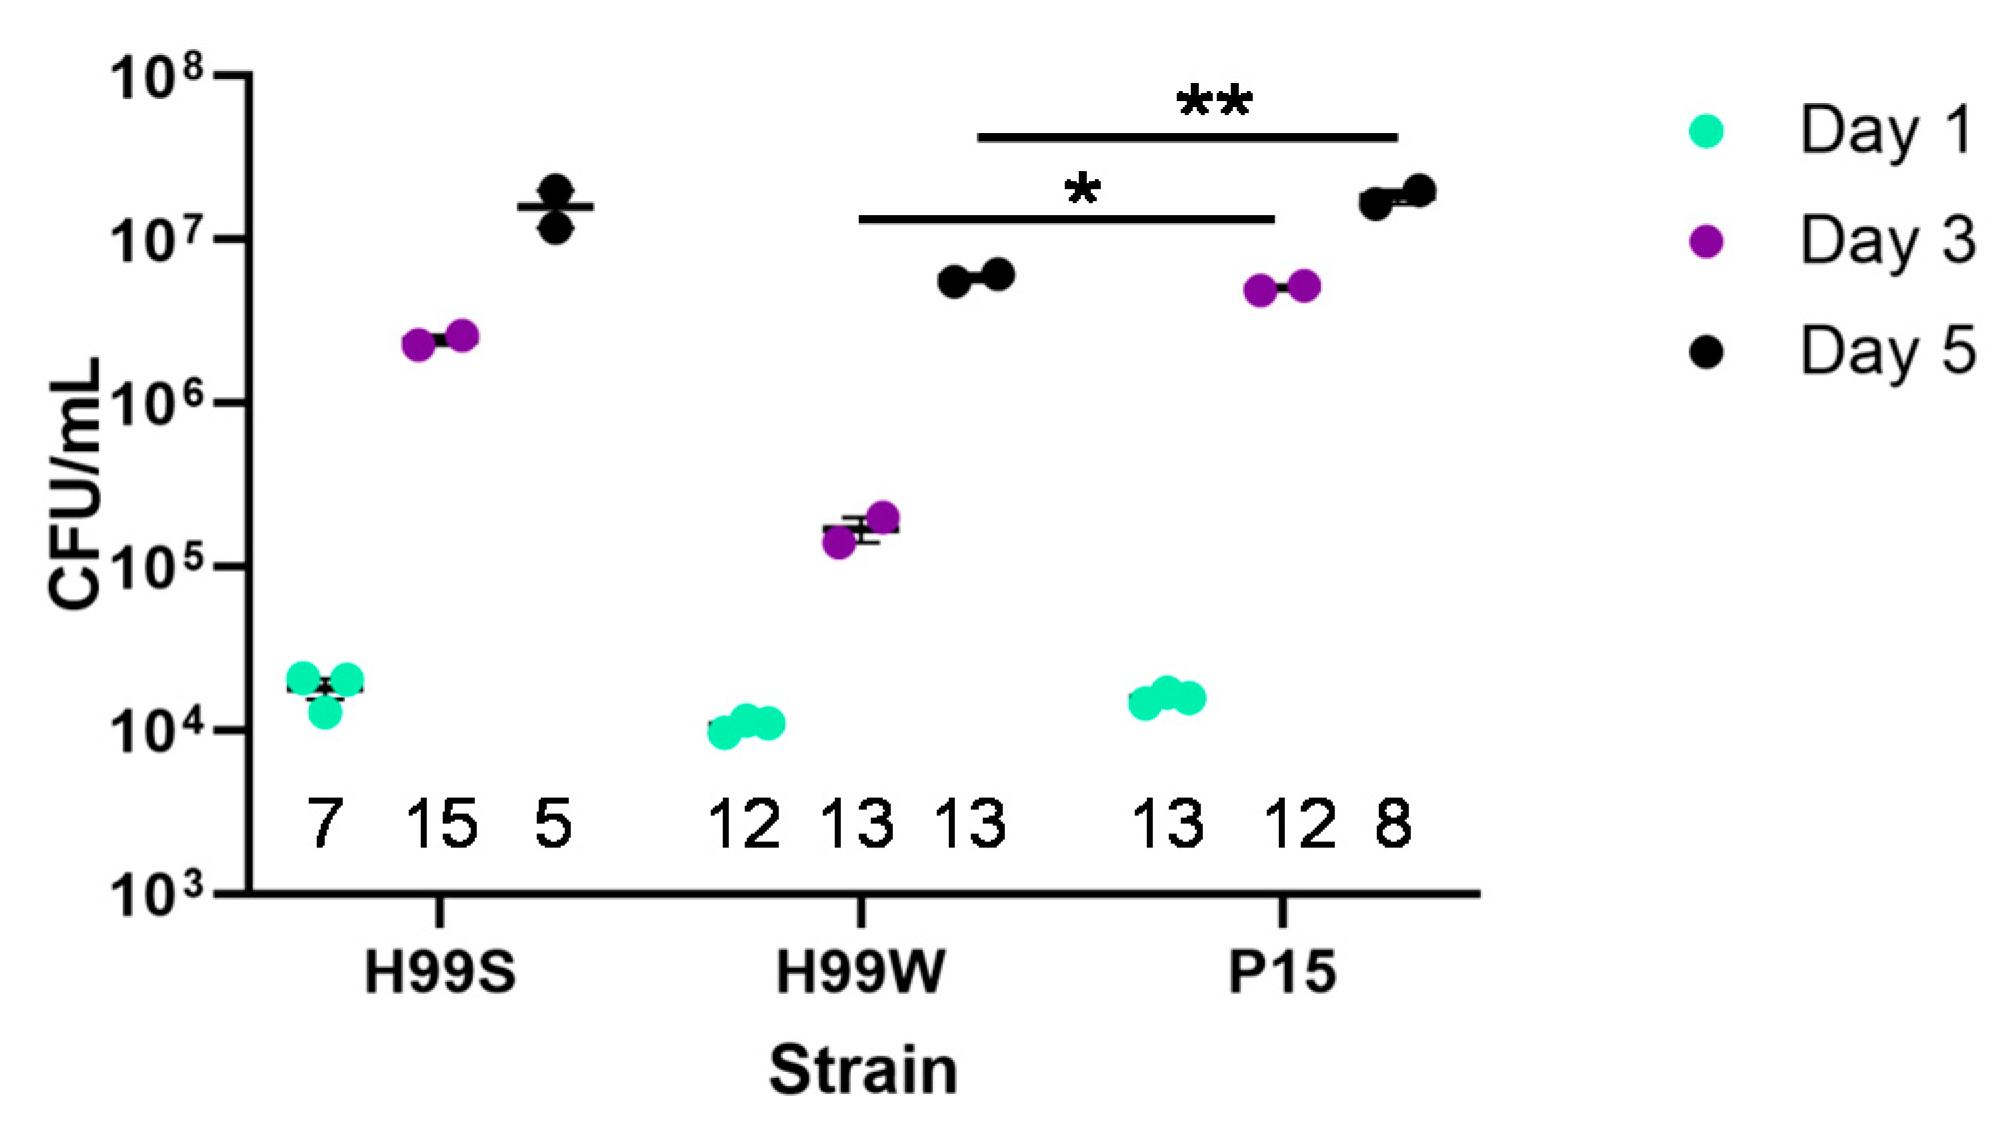
Galleria mellonella larvae, should result in adaptation of the pathogen to that environment. Since the passaged strain P15 showed increased growth in vitro in hemolymph-containing medium and had increased fungal burden in vivo at days 3 and 5, strain P15 successfully adapted to the
Galleria environment compared to the parent strain, H99W. Our original hypothesis was that the adapted strain would increase in virulence after passage because it is known that serial passage within a host increases virulence [
24]. We hypothesized that the increased virulence would be via an increased resistance to
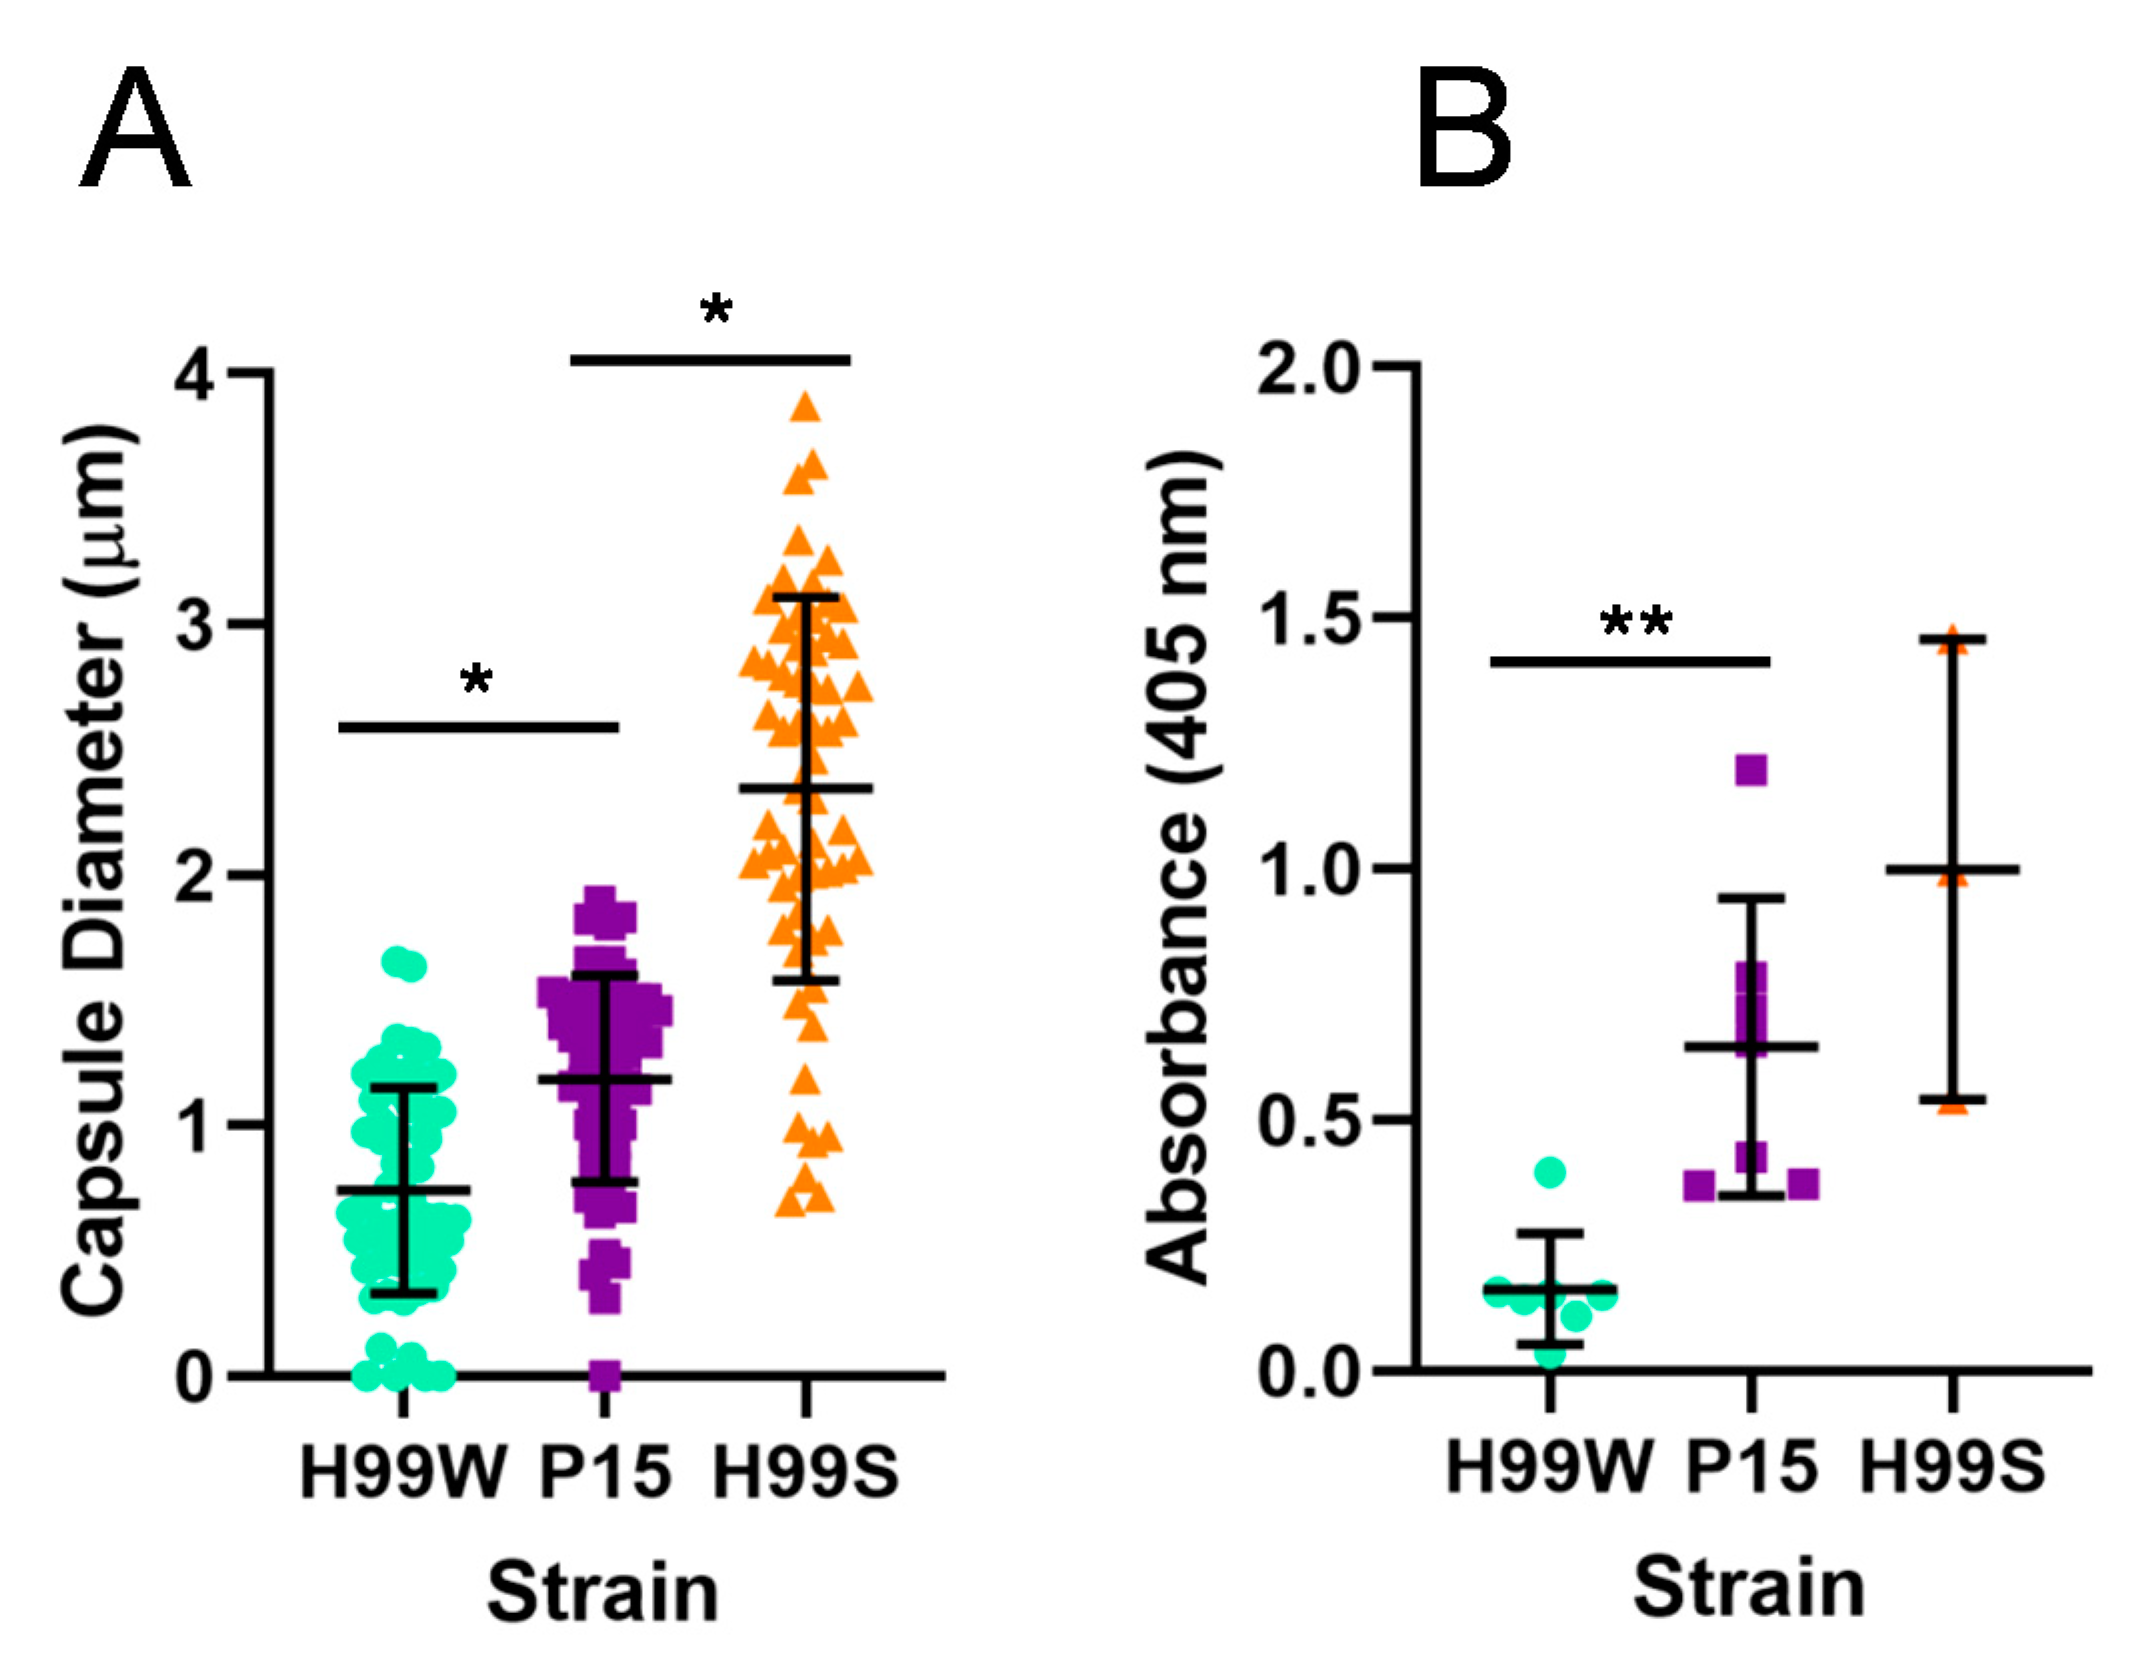
Galleria ROS, resulting in a higher level of intracellular replication. To begin to understand the process and mechanism of adaptation, virulence-related phenotypes were initially examined in P15 compared to the parent strain and the more virulent H99S strain, including capsule size and capsule shedding. As expected, the adapted strain had a larger capsule and also shed more capsule than the parent strain, consistent with its more virulent phenotype in
Galleria larvae. However, while strain P15 showed indications of adaptation to the
Galleria hemolymph environment, it did not show more or even equivalently virulent phenotypes in subsequent experiments. For example, P15 did not show the hypothesized increase in in vitro intracellular replication in mouse macrophages compared to the parent strain. Furthermore, strain P15 actually showed decreased survival in ex vivo human macrophages and a reduced ability to kill mouse macrophages in vitro.
To identify the molecular pathways responsible for these incongruent results, differential gene expression analyses of RNA from each strain grown in
Galleria was undertaken by microarray analysis. Of the ~6500 genes in the
C. neoformans genome, only 426 were changed between strains P15 and H99W. Of the 254 genes that were downregulated in strain P15 compared to strain H99W, the most downregulated genes were involved in metabolic processes and synthesis of secondary metabolites. The most upregulated genes were involved in basic cellular processes that can be regulated, particularly in a general stress response, such as the ribosome, spliceosome, and proteolysis [
25]. However, in the general stress response, these genes are usually downregulated, not upregulated. The lack of evidence for either a general or specific stress response, particularly since both hemocytes and macrophages are known to produce hydrogen peroxide to combat and destroy fungi, was surprising [
26,
27]. Since both mammalian macrophages and hemocytes are known to kill fungal pathogens using similar mechanisms that involve ROS [
26,
28], genes involved in preventing oxidative damage would be expected to be upregulated in P15 compared to the parent strain. In a closer examination of the differentially expressed genes, only one gene involved in the host’s response via ROS was upregulated. All other genes related to ROS generation were either not significantly different or down-regulated. To identify any significant protein-protein interactions, as well as a network of interacting genes, the search tool for the retrieval of interacting genes/proteins (STRING) database was used. While the initial group of proteins had significantly more interactions and were biologically connected, deeper investigation did not reveal any significant protein clusters.
Taken together, these results suggested that strain P15′s adaptation to
Galleria did not involve development of resistance to the host’s ROS response, but rather involved development of the ability to specifically subvert initiation of the ROS response in
Galleria, but not in mouse or human macrophages. To confirm the suspected, continued sensitivity of P15 to ROS and RNS, in vitro sensitivity to hydrogen peroxide and reactive nitrogen was measured. Incubation with hydrogen peroxide exposes the yeast to reactive OH groups via the Fenton reaction [
11], while incubation with sodium nitrite + succinic acid exposes the yeast to reactive NO groups [
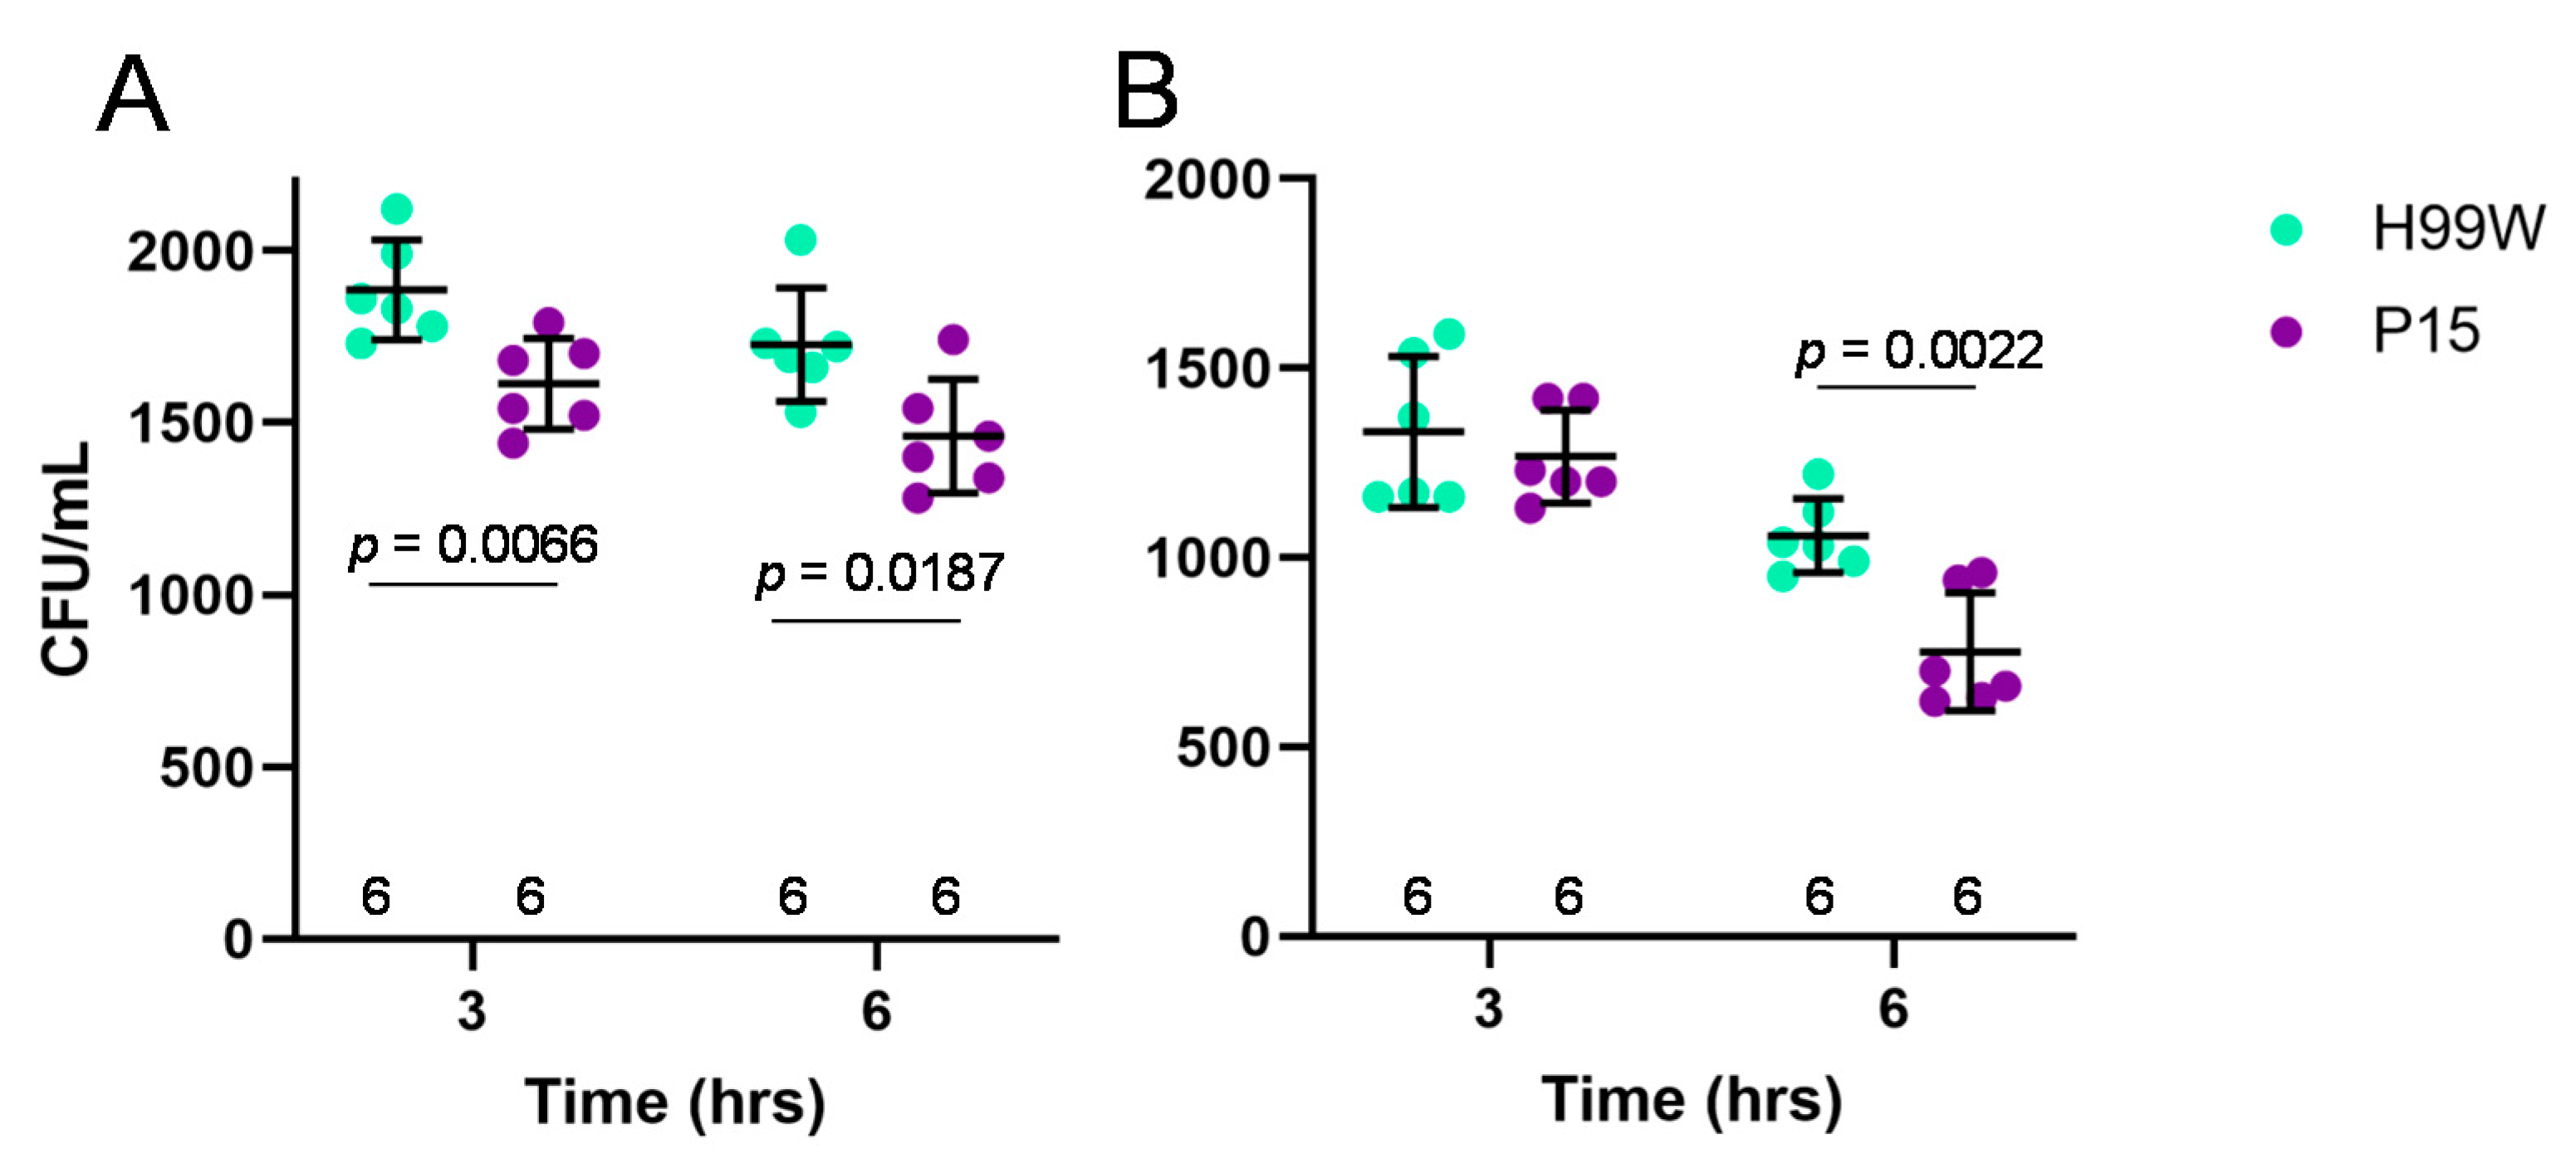
12]. Strain P15 was more susceptible to hydrogen peroxide than strain H99W at both 3 and 6 h of incubation. Since this result could be due to lack of a capsule, capsule was induced and the experiment was repeated. Again, strain P15 was more susceptible to hydrogen peroxide, but this time only after 6 h, suggesting that, as shown previously, the capsule protects the yeast against damage by ROS [
29].
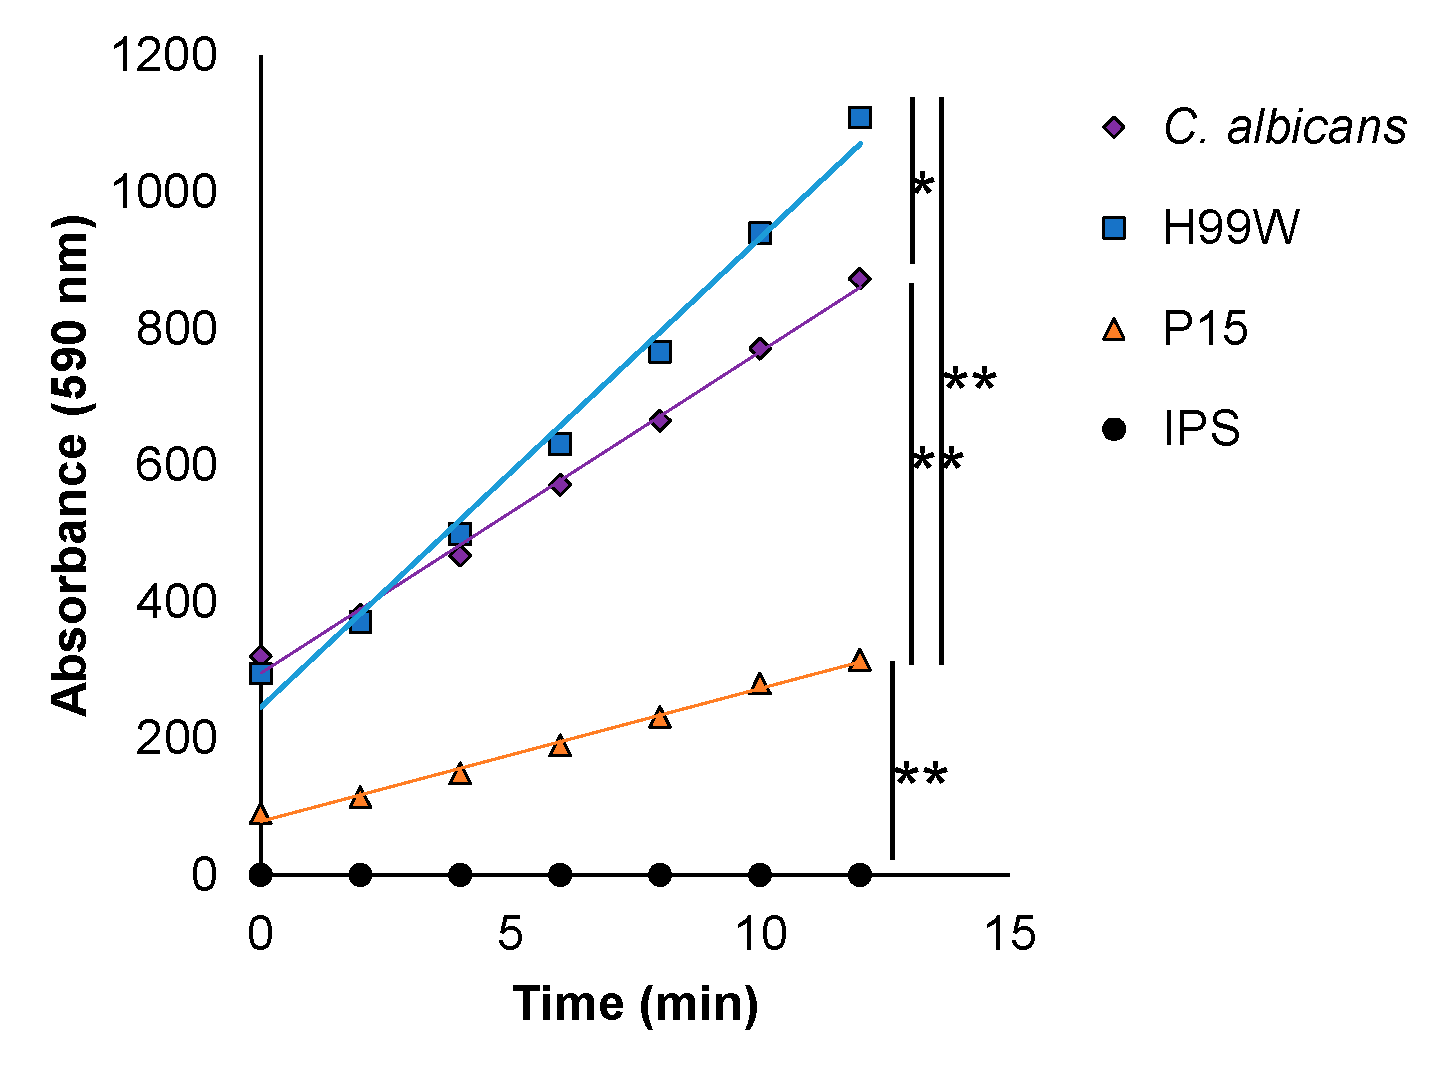
Along with continued sensitivity to hydrogen peroxide in vitro, this model of adaptation predicted that
Galleria infected with strain P15 would produce less hydrogen peroxide than those infected with the parent strain. Indeed, hemocytes isolated from
Galleria larvae infected with P15 produced significantly less hydrogen peroxide than those infected with either the parent strain H99W or the positive control,
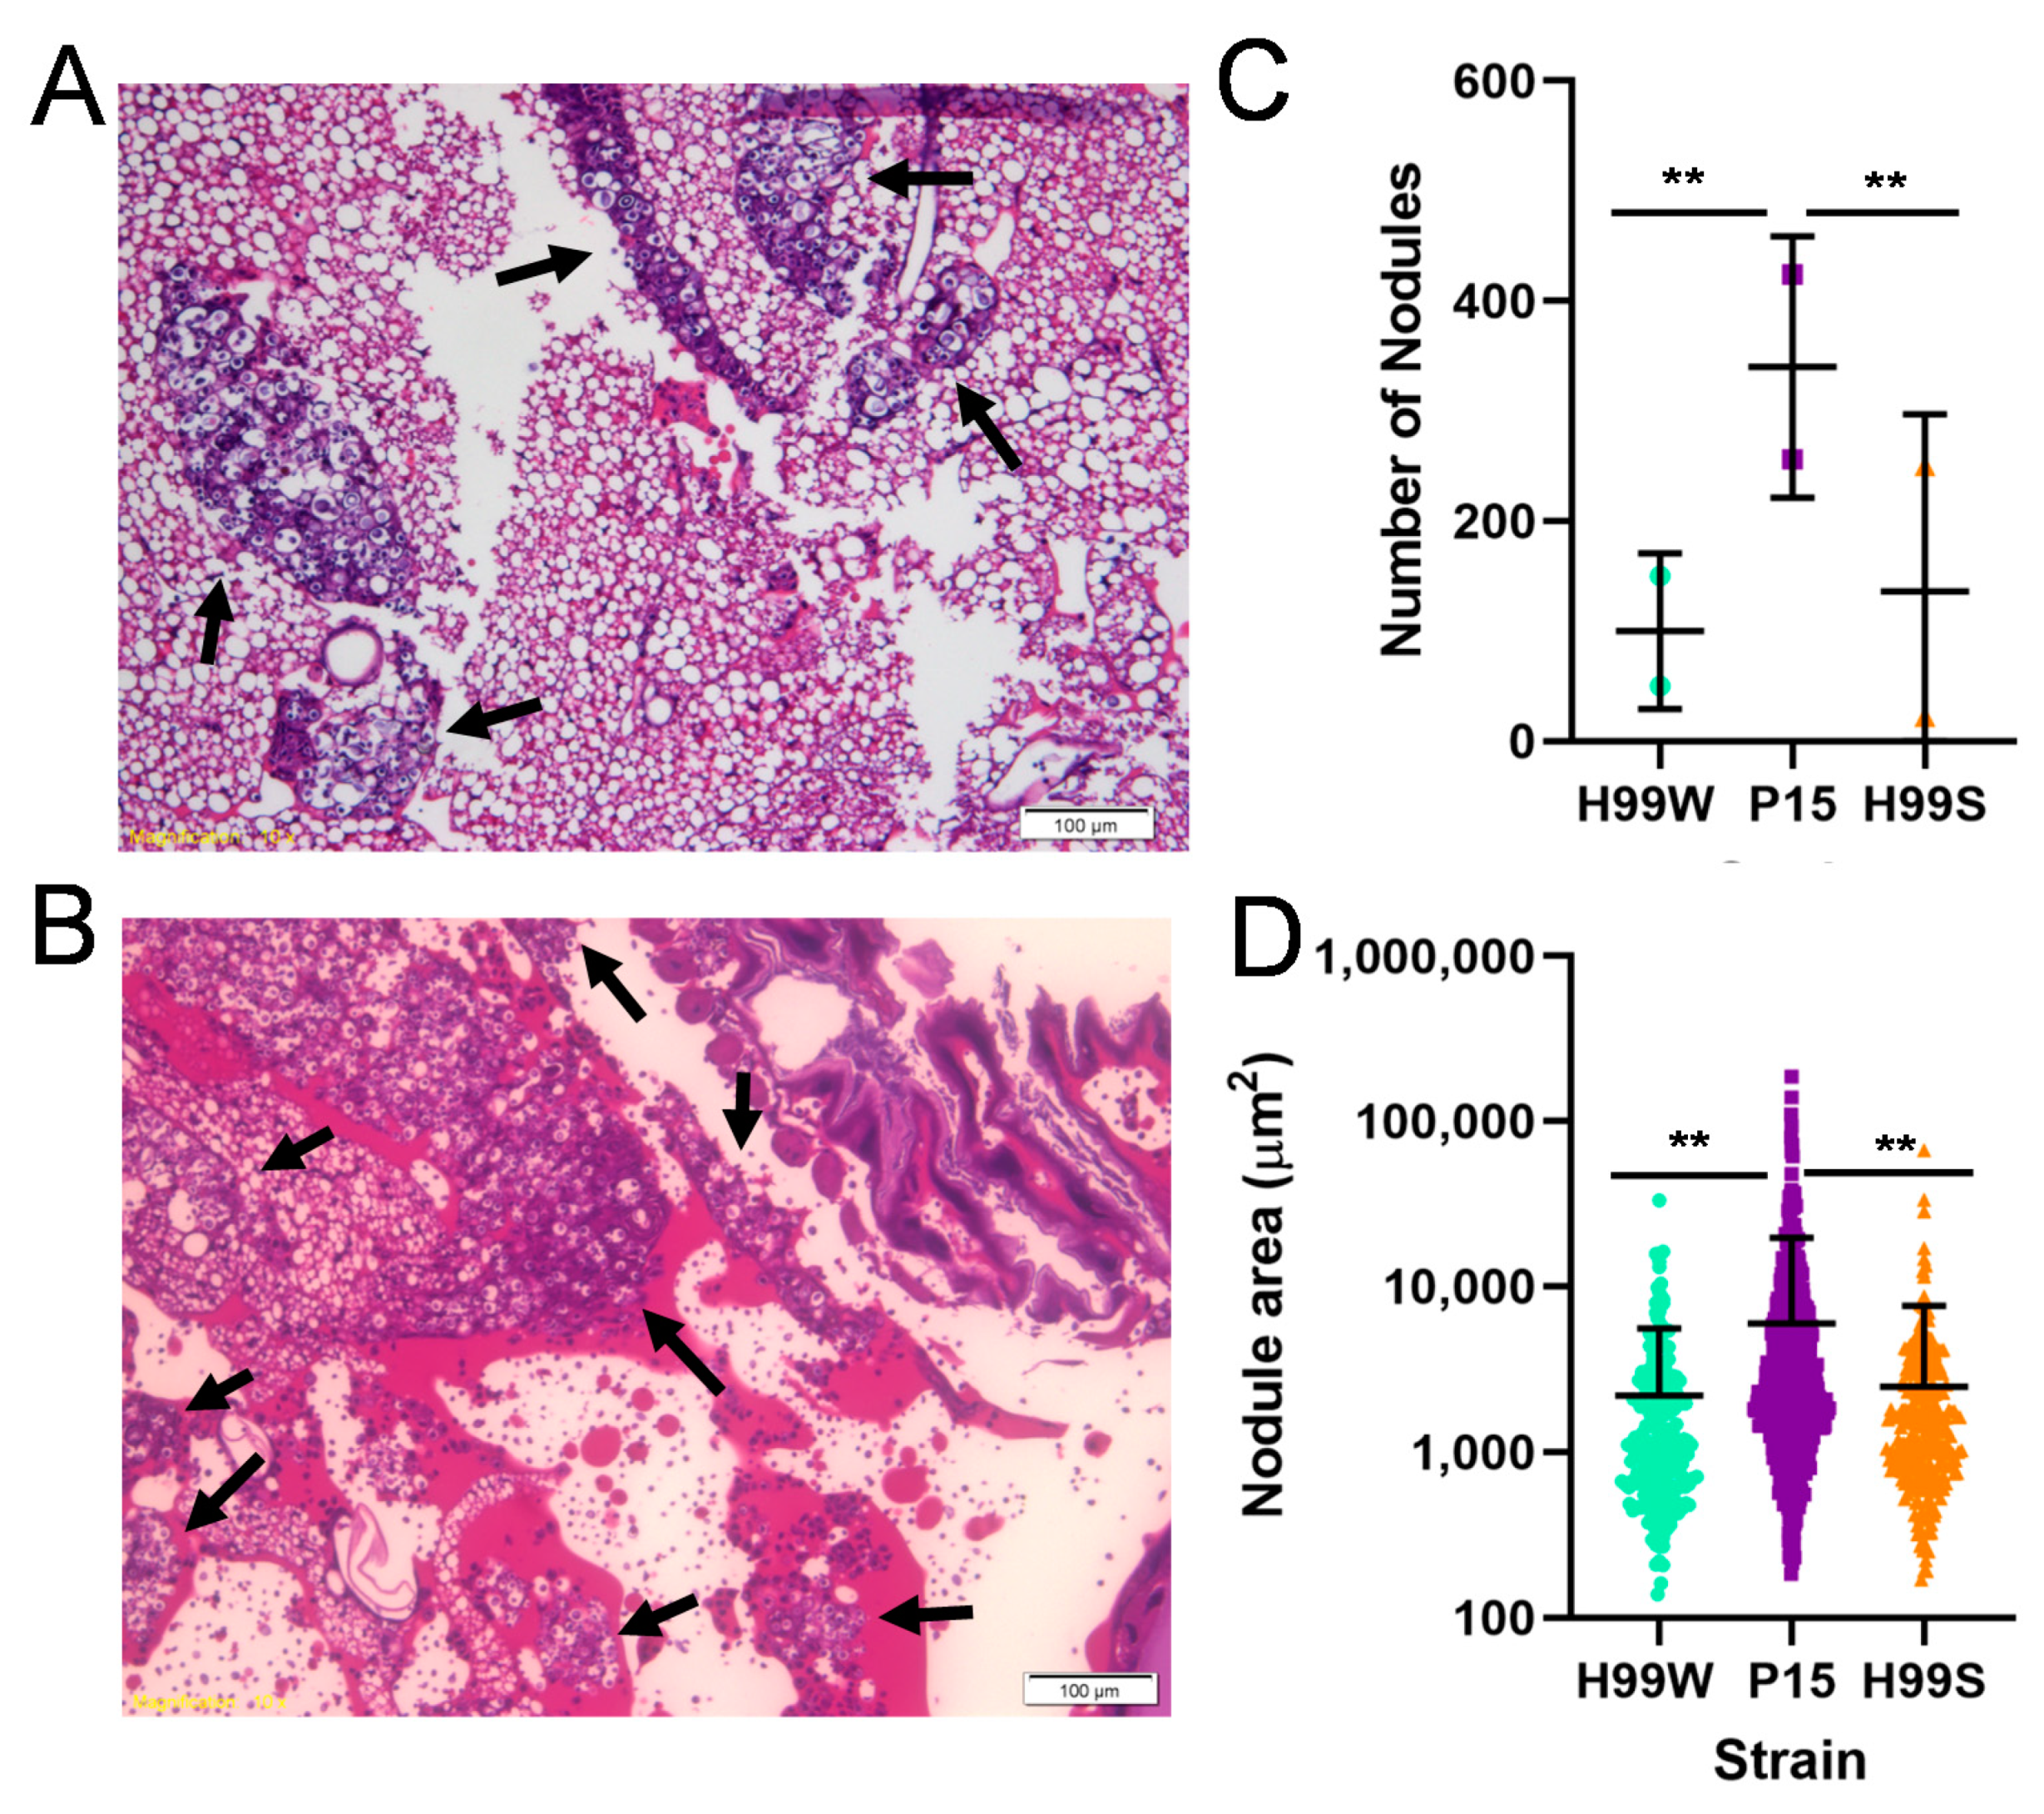
Candida albicans. However, P15 does not, in fact, have the ability to depress the entire immune response, as histological studies of larvae infected for two and five days indicate P15-infected larvae have significantly more and larger immune nodules at day 5, indicating that
Galleria actually have an enhanced immune response to P15 compared to H99W, but are unable to effectively produce ROS [
13], compared to larvae infected with the parent strain.
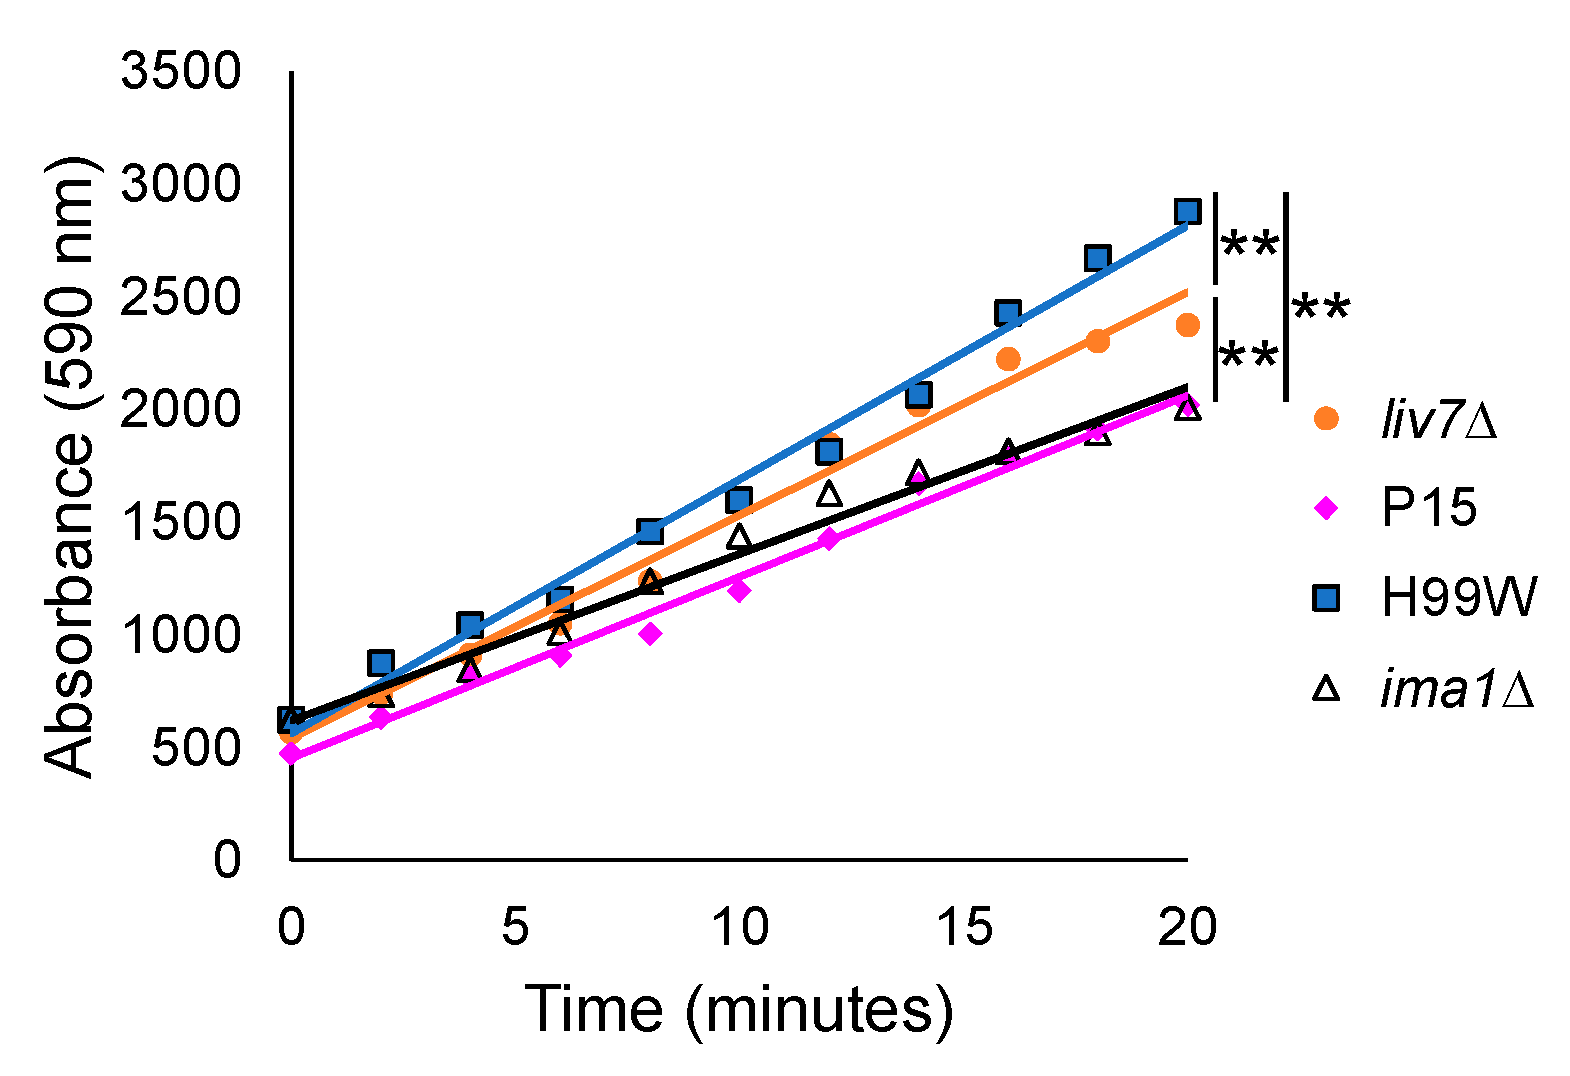
Finally, to gain a clearer understanding of how strain P15, which has a larger capsule and higher levels of capsule shedding than its parent strain, might reduce the
Galleria ROS response, we examined the ability of
C. neoformans mutant strains with different capsule shedding phenotypes to induce hydrogen peroxide production from hemocytes. Hemocytes from larvae infected with the
liv7∆ mutant, which sheds two-fold less capsule than H99S, induced more hydrogen peroxide than those infected with P15, while hemocytes from larvae infected with the
ima1∆ mutant, which sheds five- to ten-fold more capsule than H99S, induced less hydrogen peroxide than the parent strain, but equivalent amounts to P15. Both the
liv7∆ and
ima1∆ mutants have wildtype levels of surface-associated capsule [
14], suggesting that the amount of shed GXM was affecting hemocyte production of ROS.
In summary, these studies began with the hypothesis that a serially passaged strain, P15, would show increased resistance to ROS compared to its parent strain. However, strain P15 showed increased susceptibility to hydrogen peroxide in vitro, which was unexpected, as 100 generations of exposure to ROS may have increased the strain’s resistance or defense against
Galleria ROS. However, these data suggest that the fungus utilized another mechanism to adapt, by depressing the host’s ability to produce ROS, but not the host’s entire immune response. Furthermore, experiments using
C. neoformans mutants with variation in capsule shedding phenotypes provided further support that the mechanism P15 utilized in adapting to
Galleria was to increase capsule shedding, which allowed increased survival due to a reduction in hemocyte ROS production. However, this adaptation did not have the same effect on mouse or human macrophage ROS production, which is surprising given that the amount of shed GXM has been correlated with differences in virulence in mice [
30] and humans [
31]. This research highlights the use of serial passages to study host-pathogen relationships and has increased the understanding of how
C. neoformans may interact differently with
Galleria hemocytes compared to human and mouse macrophages.
4. Materials and Methods
4.1. Ethical Statement
The J774.16 cell line was obtained from Dr. Arturo Casadevall. The RAW264.7 cell line was provided by the American Type Culture Collection, Manassas, VA, USA.
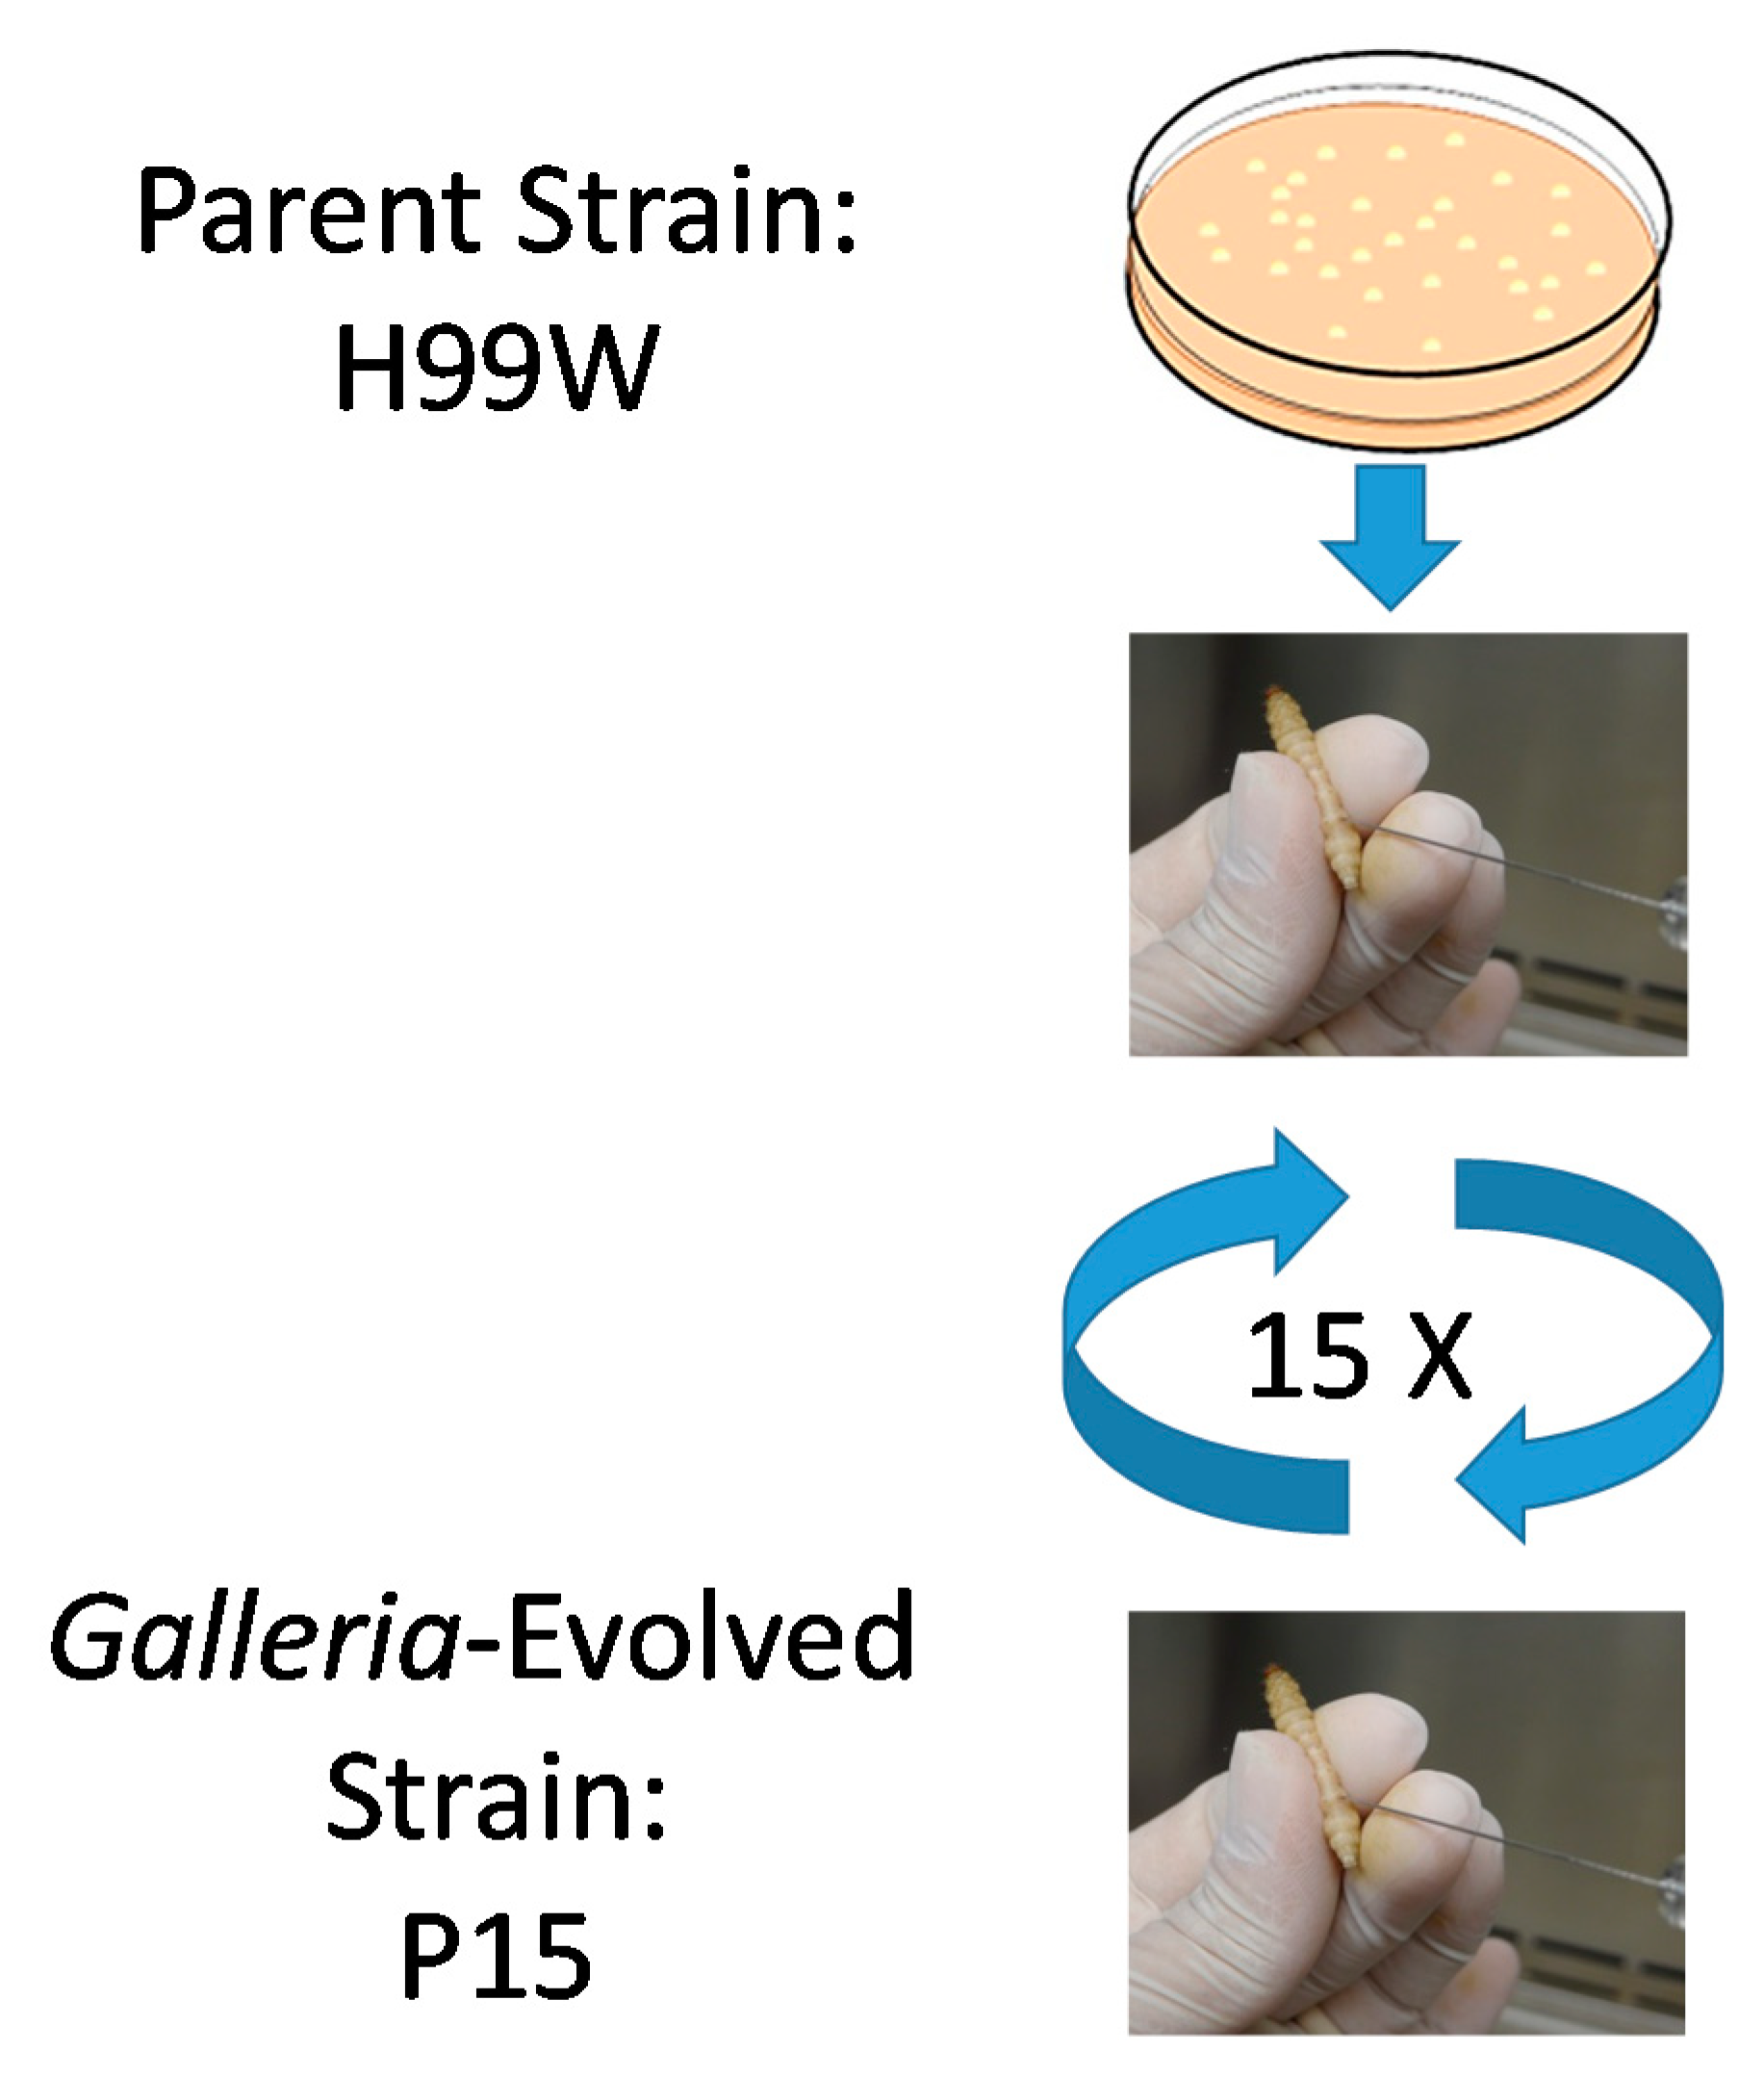
4.2. Passages
C. neoformans serotype A strain H99W was grown in yeast peptone dextrose (YPD) broth from frozen stock at 37 °C for two–three days and then washed three times with phosphate-buffered saline (PBS) and counted. H99W cells (1 × 10³ in 5 µL) were injected into the last left proleg of 15 larvae of the wax worm, Galleria mellonella and then larvae were incubated at 37 °C for three days. After three days, larvae were rinsed in 100% ethanol and the last left proleg was cut with scissors. Hemolymph was collected from each larva, diluted and serial dilutions were plated for CFU on YPD agar. Non-diluted hemolymph from each larva was pooled and counted. Penicillin/Streptomycin (10,000 U/mL, Invitrogen, catalog #15140122, Carlsbad, CA, USA) was added to the pooled hemolymph and 1 × 10³ cells in 5 µL were injected into 15 larvae for the next passage.
Passages were continued until 100 generations of C. neoformans had occurred within G. mellonella. The doubling time was calculated based on the CFU of the initial inoculum and the average CFU from the 15 larvae from each passage using the following equation: Time infected*(1/Ln(Final CFU/Initial CFU)). The number of generations was calculated by dividing the time infected by the calculated doubling time for each passage.
4.3. In Vitro Growth Curves
Cultures of H99S, H99W and Pl5 were started from frozen stock and grown in YPD for 24 h. Cells were washed with PBS three times, counted using a hemocytometer, and diluted to 5000 cells/mL for each strain. These cells were then added to hemolymph extracted from healthy Galleria, YPD, minimal media, or a solution of 1:1 ratio of minimal media:hemolymph. To prevent melanization, all media containing hemolymph also contained 3 mg of 1-phenly-2-thiourea (PTU) crystals. Since PTU crystals may affect growth, cells were grown in all medias containing hemolymph with and without crystals. Cultures were then placed in multi-well plates and growth was measured for 24 h using the BioScreen C growth curve machine (Growth Curves USA, Piscataway, NJ, USA) and absorbance at 600 nm. The growth curves were repeated three times. Due to the non-orbital rotation of the machine and to avoid settling of the cells, cells were manually re-suspended after the first 8 h and then every 10 h for the duration of the study. Doubling times were calculated using the following formula: Time × (0.693/(Ln × (final OD/initial OD))). This experiment was repeated three times.
4.4. In Vivo Galleria Fungal Burden
Cultures of H99S, H99W and Pl5 were started from frozen stock and grown in YPD until log-phase. Cells were washed with PBS three times and counted. Five µL of each cell suspension (2000 cells) was injected into the last pro-leg of fifteen Galleria larvae for each strain for each time point. Hemolymph was collected from remaining larvae at days 1, 3 and 5. Serial dilutions of hemolymph were plated on YPD plates for 24 h and then the most appropriate dilution was plated on an additional YPD plate. Plates were incubated for two days at 37 °C and colonies counted to determine fungal burden. Fungal burden was normalized to the number of larvae collected at each day. This experiment was repeated three times.
4.5. Capsule Size
Capsule size in vitro was measured as described in [
32,
33]. This experiment was repeated three times.
4.6. GXM Release
To determine if there was a difference in the release of capsular GXM into the medium, the capsules of all strains were induced in Dulbecco’s modified Eagle medium (DMEM) (as for measuring capsule size). The next day, a capture enzyme-linked immunosorbent assay was used to determine the concentration of GXM in the supernatant, as described previously [
34]. This experiment was repeated three times.
4.7. Mouse Macrophage Death and C. neoformans Intracellular Replication
To determine the susceptibility of macrophage-like J774.16 or RAW264.7 cells to killing by
C. neoformans and to measure how well strains H99W and P15 replicated in macrophages, strains were incubated in a 2:1 multiplicity of infection with macrophage-like J774.16 or RAW264.7 cells in DMEM for 1 h at 37 °C + 5% CO
2 (four wells per strain), washed with PBS, resuspended with DMEM and incubated for a further 18 h at 37 °C + 5% CO
2, as described in [
35]. The next day, cells were resuspended in 200 µL warm PBS containing 10 µg/mL propidium iodide and imaged as described in [
35].
To measure
C. neoformans intracellular replication, the saved media from the killing experiment (above) was combined with washes containing intracellular
C. neoformans, diluted, and plated on YPD, as described in [
35].
4.8. Isolation and Culture of Human Monocytes
Venous blood of healthy male and female volunteers was collected in accordance with the guidelines and approval of the Wright Center for Graduate Medical Education Institutional Review Board, Scranton, PA, USA. All blood donors were informed of the goals of the study and agreed by written consent prior to blood donation. Monocytes were isolated and cultured, as described in [
35].
4.9. Human Macrophage Death and C. neoformans Intracellular Replication
To determine the susceptibility of human ex vivo macrophages to killing by
C. neoformans and to measure how well strains H99W and P15 survived in human macrophages, macrophages were seeded into a 96-well plate (four wells per
C. neoformans isolate) in Roswell Park Memorial Institute (RPMI)-1640 media containing 10% human serum, and 100 ng/mL lipopolysaccharide at a density of 2 × 10
4 macrophages and incubated overnight at 37 °C with 5% CO
2. Macrophage death and
C. neoformans intracellular replication were determined as described in
Section 4.7 above and [
35].
4.10. Resistance to Hydrogen Peroxide
H99W and P15 were grown from frozen stocks in YPD at 37 °C for 2–3 days, washed three times with water and counted. To determine resistance to hydrogen peroxide and oxidative stress, strains were tested as described [
29]. Briefly, 2 × 10
3 cells were incubated with 0 or 0.5 mM hydrogen peroxide (Fisher, catalog #H325-100) for 3 or 6 h at 37 °C. At each time point, 100 µL of each sample was plated on YPD and grown at 37 °C for 2 days to determine CFU. Each condition was done in triplicate and the experiment was repeated twice. To determine how the induction of capsule affected resistance to hydrogen peroxide, capsule was induced as described above. After 18 h at 37 °C + 5% CO
2, cells were collected, washed three times with water and resistance to hydrogen peroxide was tested. This experiment was repeated twice.
4.11. Resistance to Nitrosative Stress
H99W and P15 were grown from frozen stocks in YPD at 37 °C for two–three days, washed three times with minimal media and counted. To determine resistance to nitrosative stress, strains were tested as described in [
36]. Briefly, 2 × 10
3 cells were incubated in minimal media alone or with 0.5 mM sodium nitrate (Sigma, catalog #S5506) and 25 mM succinic acid (Sigma, catalog #S9512) for 3 or 6 h at 37 °C. At each time point, 100 (3 h) or 50 (6 h) µL of each sample was plated on YPD and grown at 37 °C for 2 days to determine CFU. Each condition was done in triplicate and the experiment was repeated three times.
4.12. Microarray Analysis
The experimental design and the data for the microarray have been deposited in NCBI’s Gene Expression Omnibus [
37] and are accessible through GEO Series accession number GSE59582.
C. neoformans strains H99W and P15 were grown in YPD from frozen stock at 37 °C for two–three days and then washed three times with PBS and counted. H99W or P15 (1 ×10
3 cells in 5 µL) were injected into the last left proleg of 15 larvae of
G. mellonella for each strain. After three days of incubation at 37 °C, larvae were rinsed in 100% ethanol (Sigma, catalog #E7023) and the last left proleg was cut with scissors. Hemolymph was collected from each larva and pooled by strain. The pooled hemolymph was centrifuged to pellet the cryptococcal cells, the hemolymph was removed and > 1 × 10
7 cells were used to extract RNA using the RNeasy Kit (catalog # 75142, Qiagen, Hilden, Germany) with removal of genomic DNA (Message Clean Kit, catalog # M601, GenHunter, Nashville, TN, USA). Two different pools of RNA were analyzed at Washington University, using the
C. neoformans JEC21 genomic microarray, which was developed by the Cryptococcus Community Microarray Consortium with financial support from individual researchers and the Burroughs Wellcome Fund (
http://genome.wustl.edu/services/microarray/cryptococcus_neoformans), as described in [
38].
4.13. STRING Analysis
Protein interaction networks among the 400 differentially expressed genes identified by microarray analysis were investigated using STRING (ELIXIR, Cambridgeshire, UK, version 11.0). Four hundred genes were used as input and 325 genes were identified within the database. To visualize the interactions from the dataset as a whole, single nodes were hidden and the remaining nodes clustered using MCL, a Markov clustering algorithm embedded within STRING with the inflation parameter set to 3.
4.14. qRT-PCR
cDNA was made from both strains H99W and P15 from the two pools of RNA isolated from
G. mellonella and used for the microarray (Quantitech Reverse Transcription kit, catalog #205311, Qiagen). qRT-PCR was performed using SYBR Green (Applied Biosystems Foster City, CA, USA, catalog #4309155), cDNA, and primer in an ABI PRISM
® 7900HT Sequence Detection System (Applied Biosystems, Foster City, CA, USA). Each cDNA was amplified in quadruplicate, normalized with actin or glycerol-3-phosphate dehydrogenase and the fold change was determined [
39]. Fold change for P15 was relative to H99W. Real-time qRT-PCR was repeated twice.
4.15. Hemocyte Hydrogen Peroxide Production
H99W, P15 and
C. albicans (ATCC 90028) cultures were started from frozen stock and grown in YPD at 37 °C for 24 h (log-phase) prior to infection. Cells were washed with insect physiological saline (IPS), counted on a hemocytometer and diluted. Ten larvae per strain were infected with 2000 cells of H99W and P15 and 10,000 cells of
C. albicans by injecting 5 µL of each cell suspension into the last pro-leg of each larvae. For the experiments using the GXM shedding mutants’
liv7Δ and
ima1Δ, 10 larvae each were infected with 2000 cells of each strain. After 24 h of incubation, hemocytes were isolated from hemolymph by clipping a terminal leg and the hemolymph was removed by squeezing. Approximately 3 mg of PTU crystals were added to 1 mL of IPS to create a 1:200 dilution of PTU solution. One hundred microliters of the PTU solution was added to the extracted hemolymph from each strain infection to prevent melanization. Hemocytes were collected by centrifugation for 5 min at 400×
g, counted with Trypan Blue to differentiate between dead and living hemocytes and resuspended in IPS. Cells were used immediately in the ThermoFisher Scientific Hydrogen Peroxide Assay Kit (ThermoFisher Scientific, Waltham, MA, USA) to determine the relative levels of H
2O
2 in hemocytes [
40]. The assay was conducted by creating a 50 µM Amplex Red, 1 U/mL of Horse Radish Peroxidase (HRP) solution. Assays were performed in triplicate in a 96-well black plate. Each assay used 1000 cells per well in a total volume of 120 μL for each well. A SpectroMax M5 plate reader (Molecular Devices, San Jose, CA, USA) was used to monitor florescence every 2 min for 12–20 min with excitation at 560 nm and detection at 590 nm. All assays were normalized to cell counts for each strain. This experiment was repeated three times.
4.16. Histology
Two larvae were infected with 3000 cells of either H99W, P15, or H99S and incubated for two and five days at 37 °C. Larvae were then fixed in 4% paraformaldehyde at 4 °C for at least two days, bisected, sectioned, and stained with hematoxylin and eosin at the Translational Pathology Shared Resource of Vanderbilt University Medical Center. Images of each larva were captured using an Olympus BX60 microscope (Olympus Corporation, Tokyo, Japan) and the 10× objective. Nodule number and size were counted/measured using the center-most section of each larva.
4.17. Statistics
The in vivo Galleria fungal burden data was analyzed using analysis of variance (ANOVA) with simple contrasts. Capsule size and amount of GXM shed was analyzed using ANOVA. Intracellular replication of C. neoformans and macrophage killing were analyzed using the nonparametric Wilcoxon Rank Sums test, while resistance to hydrogen peroxide was analyzed using ANOVA with simple contrasts. The production of hydrogen peroxide by hemocytes was analyzed by linear regression and Tukey’s HSD for all pairwise comparisons. The number of nodules was analyzed using a chi-square test and differences in nodule size were analyzed using the nonparametric Wilcoxon Rank Sums test.


