Species, Sequence Types and Alleles: Dissecting Genetic Variation in Acanthamoeba


Abstract
1. Introduction
2. Species of Acanthamoeba
2.1. Species Pre-1980
2.2. Species 1980–2000
2.3. Species Post-2000
3. Sequence Types of Acanthamoeba
3.1. The Ribosomal Small Subunit rRNA Gene as a Focus of Study
3.2. The Development of the Concept of a “Sequence Type” in Acanthamoeba
3.3. Increase in the Number of Sequence Types
3.4. “Almost Complete” and Partial 18S rRNA Gene Sequences in the Study of Acanthamoeba
4. Alleles in the ASA.S1 Region of the Acanthamoeba 18S rRNA Gene
4.1. The Genesis of “Alleles” in Acanthamoeba
4.2. The Early Expansion of “Alleles” in Acanthamoeba Type T4
4.3. Enhancing the Concept of “Alleles” in Acanthamoeba in T4
4.4. Extending the Analysis of “Alleles” in Acanthamoeba T4 Post-2015
4.5. Frequency of “Alleles” in Acanthamoeba Sequence Type T4 Post-2015
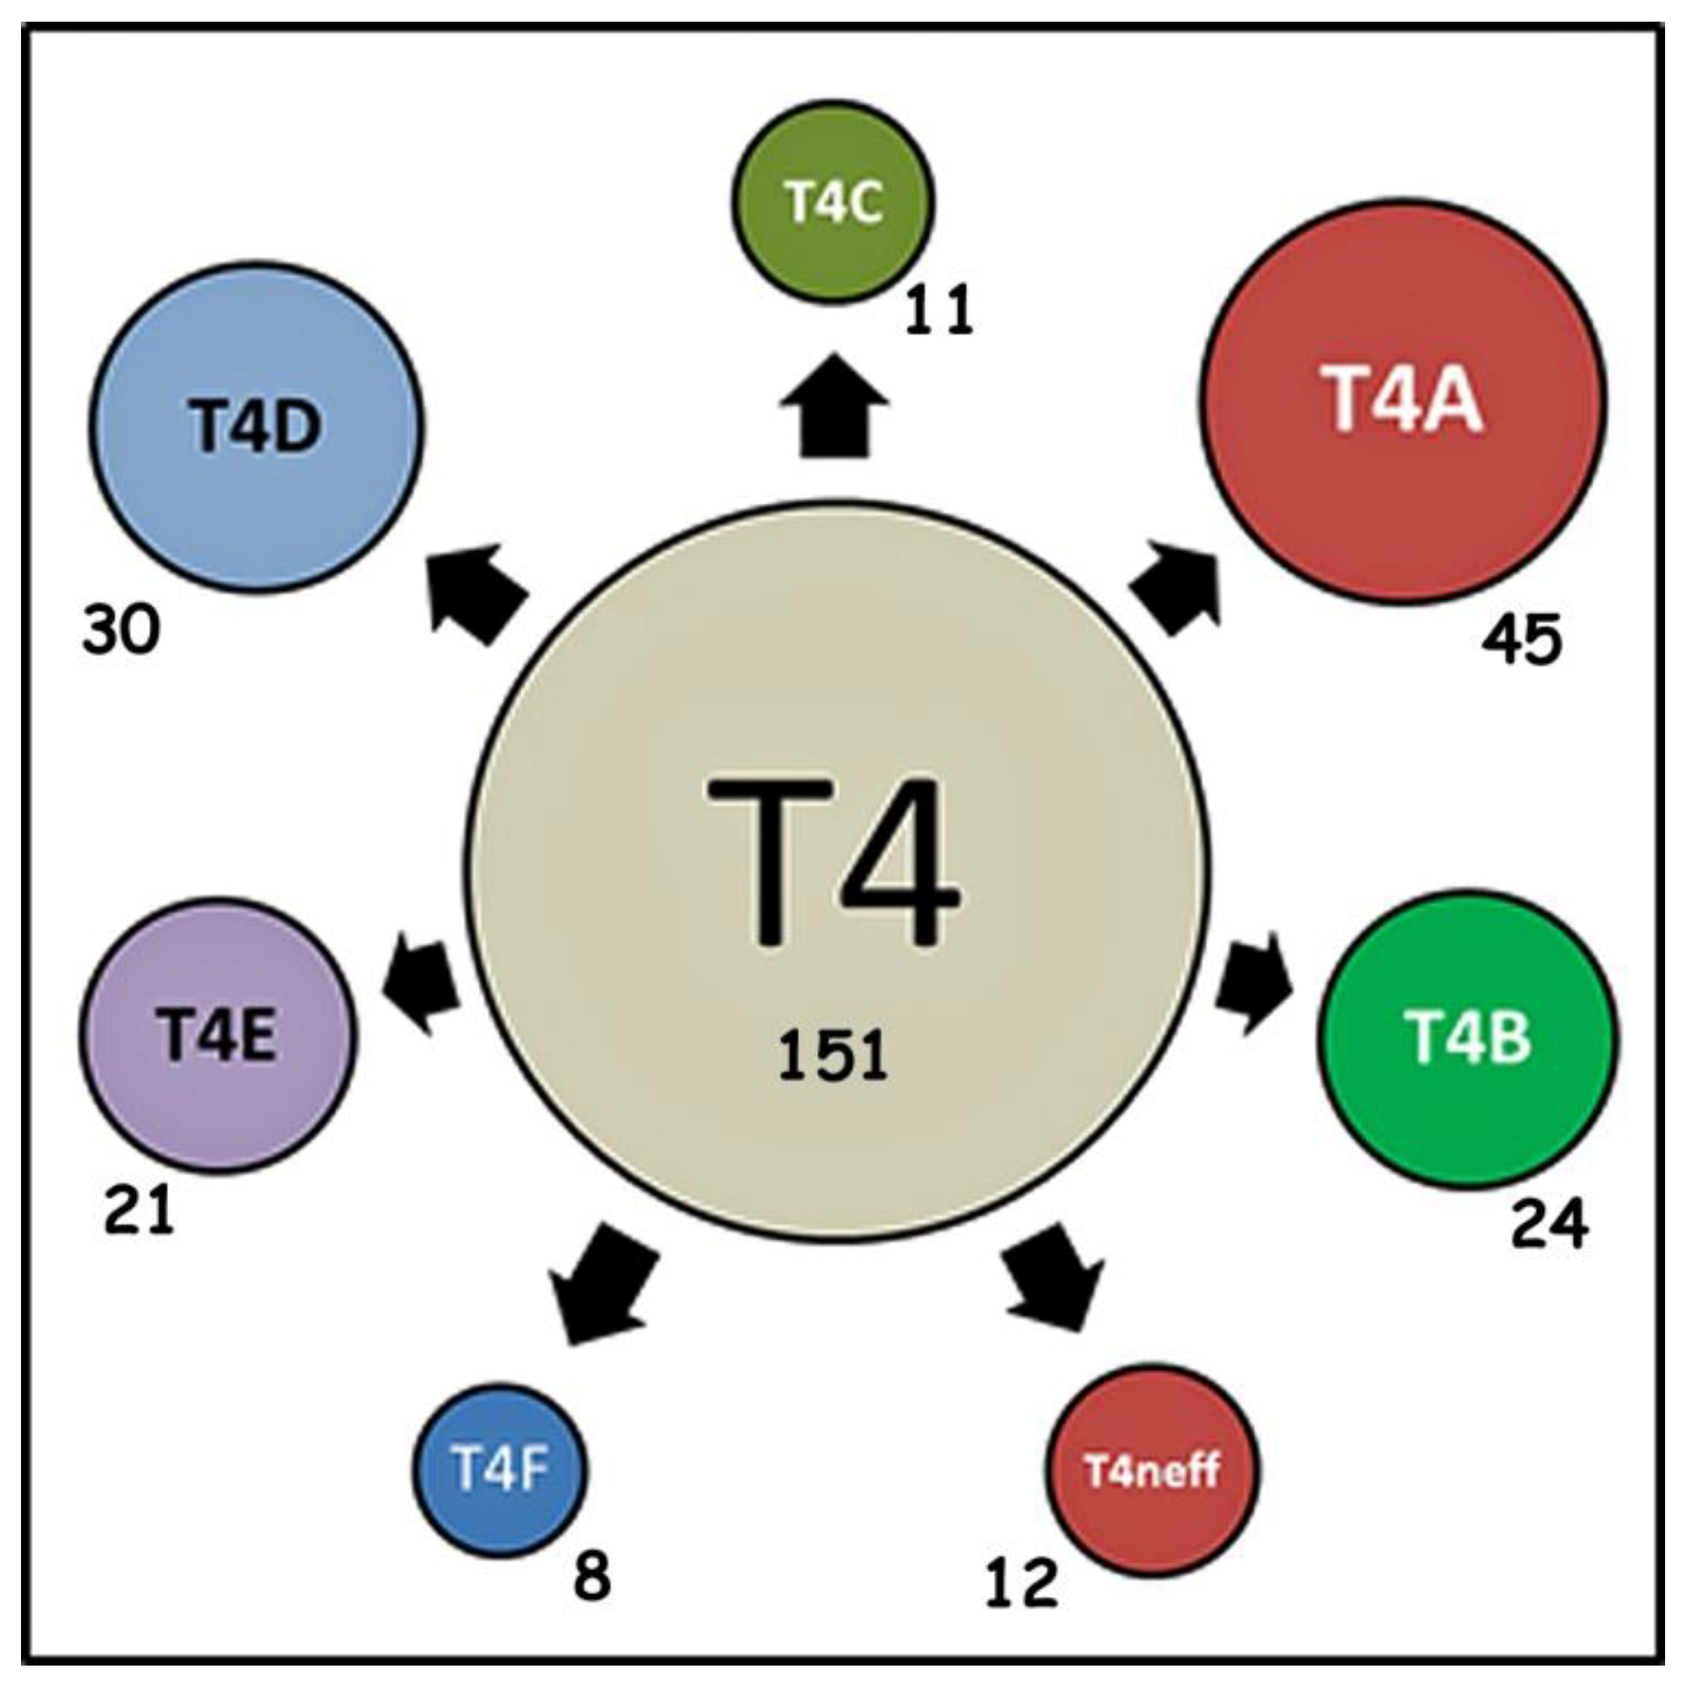
4.6. Occurrence of Specific “Alleles” in Subtypes of Acanthamoeba Sequence Type T4
5. Alleles in the ASA.S1 Region of the 18S rRNA Gene in Non-T4 Acanthamoeba Sequence Types
5.1. Alleles in Acanthamoeba Sequence Type T3
5.2. Alleles in Acanthamoeba Sequence Type T11
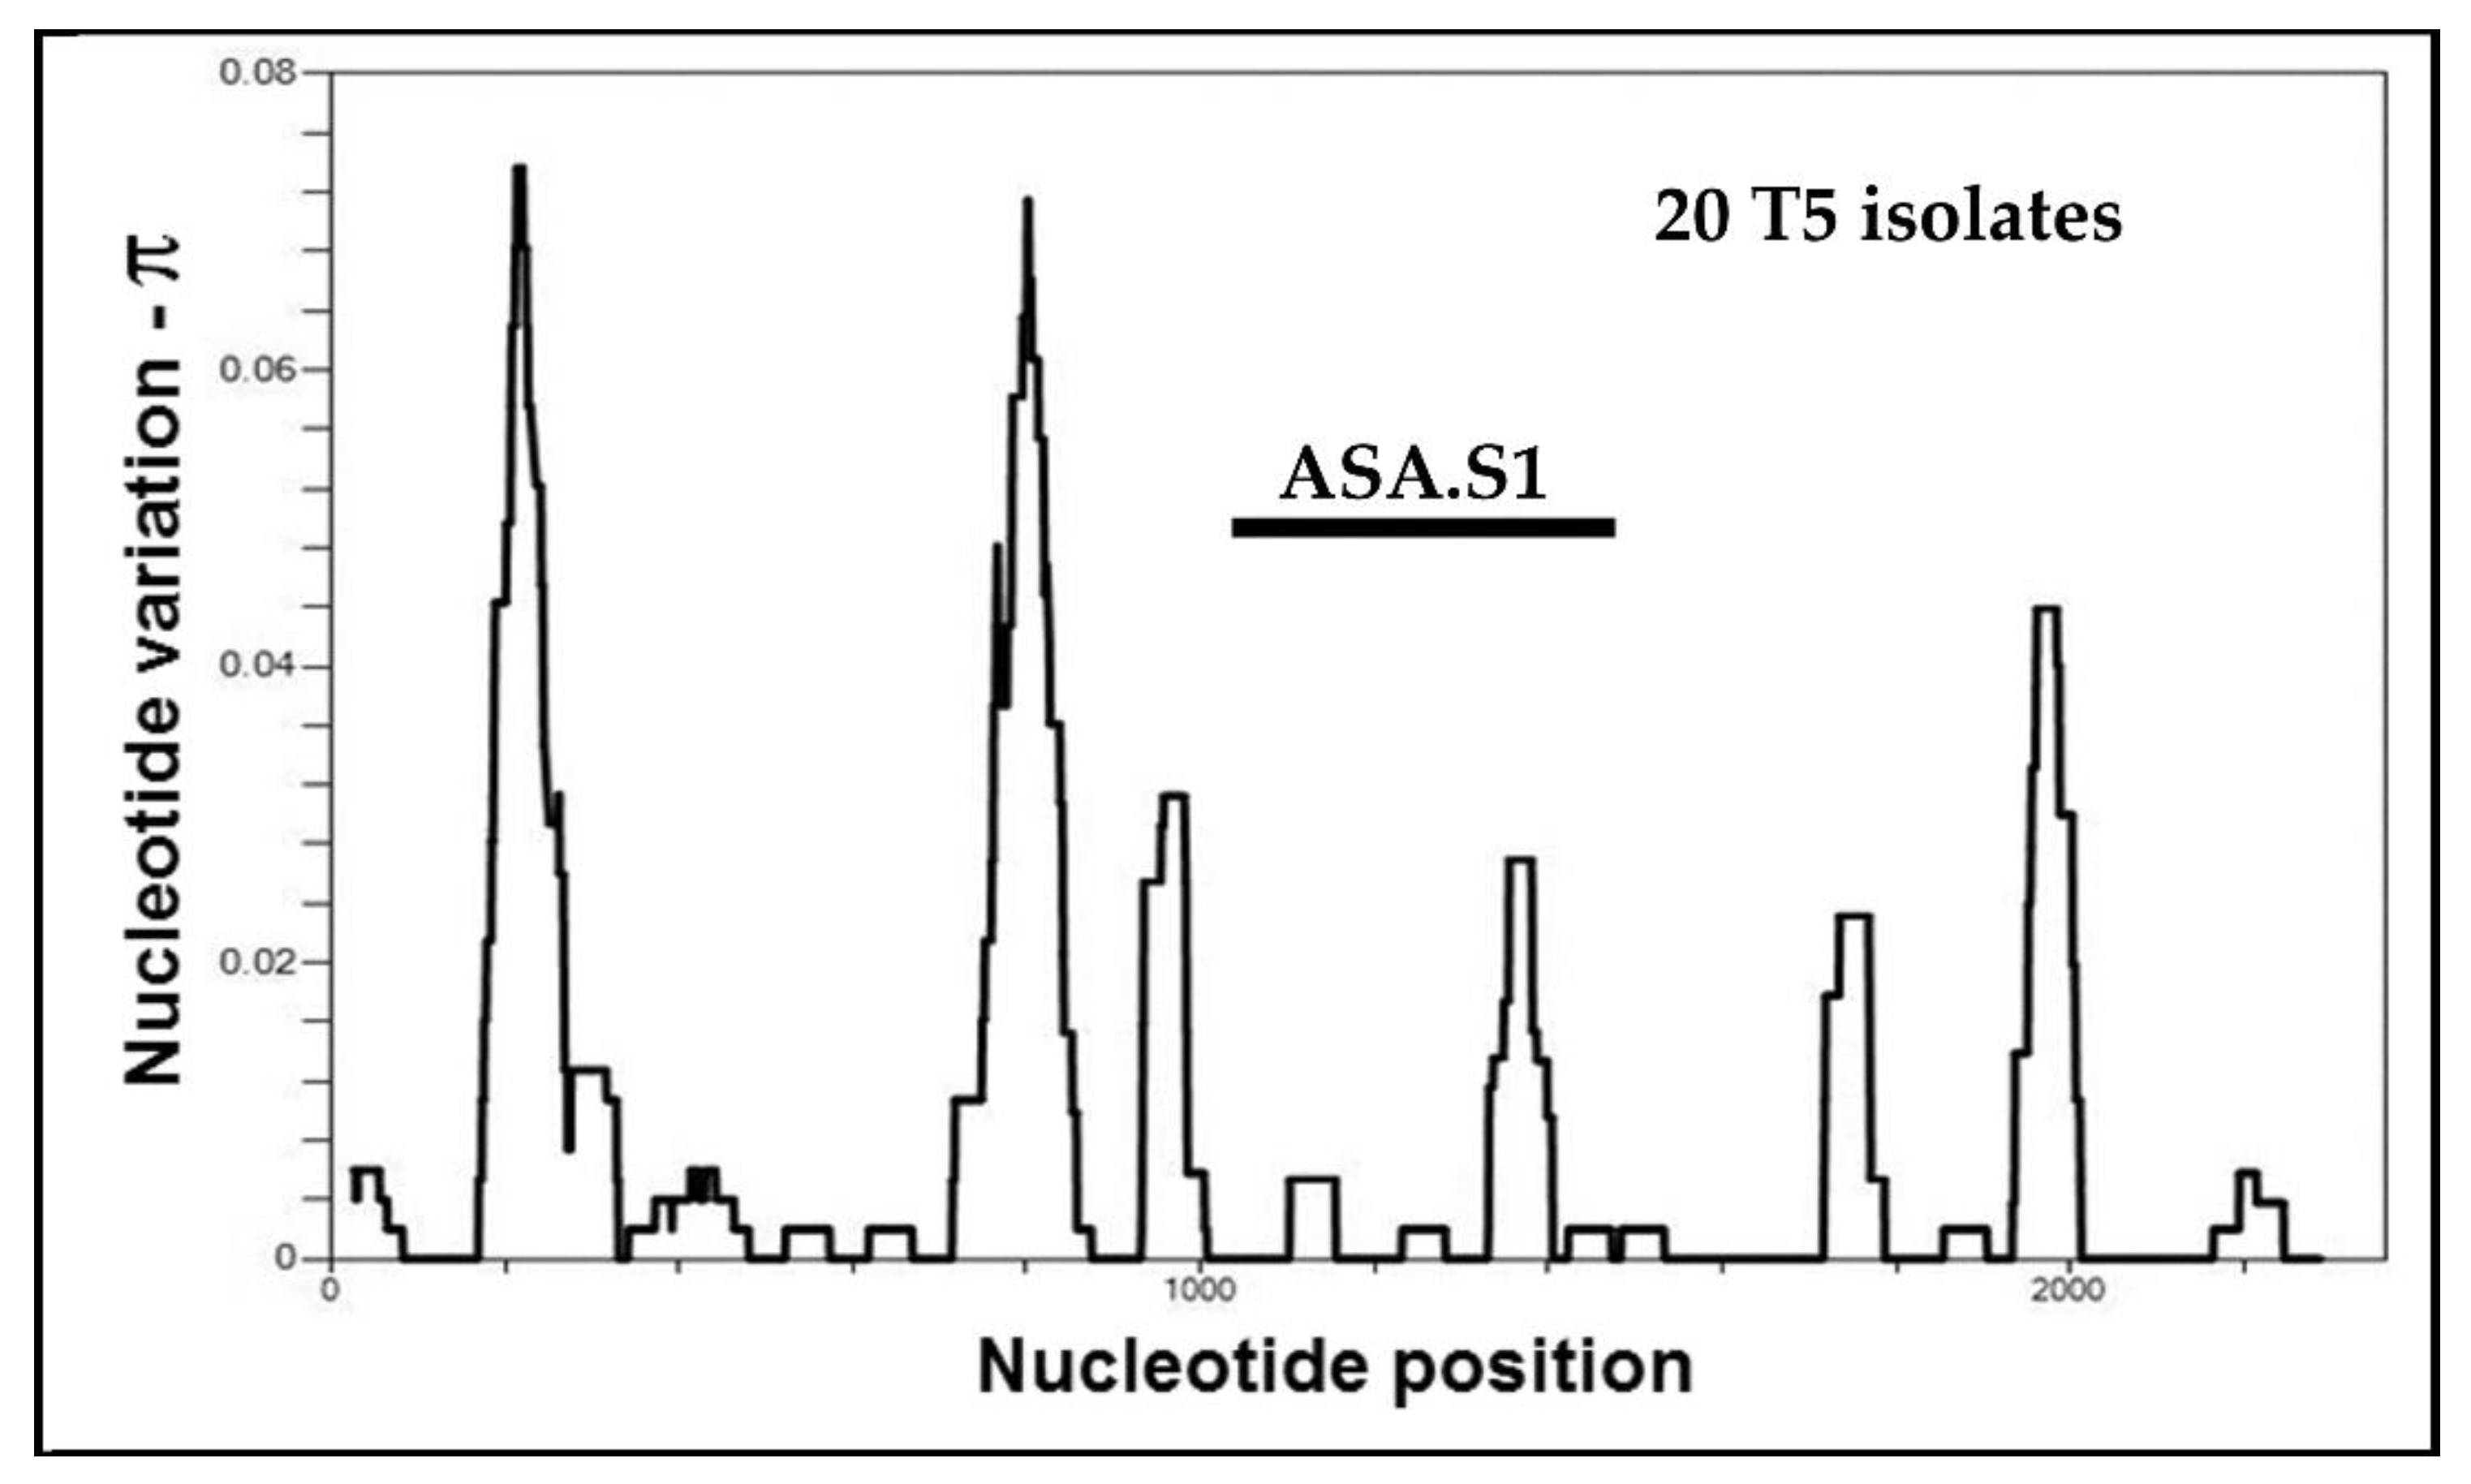
5.3. Alleles in Acanthamoeba Sequence Type T5
5.4. Alleles in Acanthamoeba Sequence Type T15
5.5. Alleles in Acanthamoeba Sequence Supergroup T2/6
6. What Do Alleles Mean for Our Understanding of the Biology of Acanthamoeba?
7. What Do Alleles Mean for Our Understanding of Species and Speciation in Acanthamoeba?
8. What Additional Approaches Are Available?
9. What Do We Do Next?
Supplementary Materials
Funding
Acknowledgments
Conflicts of Interest
References
- Castellani, A. An amoeba found in culture of yeast: Preliminary note. J. Trop Med. Hyg. 1930, 33, 160. [Google Scholar]
- Castellani, A. An amoeba growing in cultures of a yeast: Second note. J. Trop Med. Hyg. 1930, 33, 188–191. [Google Scholar]
- Castellani, A. An amoeba found in cultures of a yeast: Third note. J. Trop Med. Hyg. 1930, 33, 221–222. [Google Scholar]
- Castellani, A. An amoeba found in cultures of a yeast: Fourth note. J. Trop Med. Hyg. 1930, 33, 237. [Google Scholar]
- Douglas, M. Notes on the classification of the amoeba found by Castellani in cultures of a yeast-like fungus. J. Trop Med. Hyg. 1930, 33, 258–259. [Google Scholar]
- Volkonsky, M. Hartmannella castellani douglas et classification des Hartmannelles. Arch. Zool. Exp. Gen. Paris 1931, 72, 317–339. [Google Scholar]
- Singh, B.N. Nuclear division in nine species of small free-living amoebae and its bearing on the classification of the order Amoebida. Philos Trans. R. Soc. Lond. Ser. B Biol. Sci. 1952, 236, 405–461. [Google Scholar] [CrossRef]
- Page, F.C. Re-definition of genus Acanthamoeba with descriptions of 3 species. J. Protozool. 1967, 14, 709–724. [Google Scholar] [CrossRef]
- Pussard, M.; Pons, R. Morphologie de la paroi kystique et taxonomie du genre Acanthamoeba (protozoa, amoebida). Protistologica 1977, 13, 557–598. [Google Scholar]
- Adam, K.M.G. Comparative study of Hartmannellid amoebae. J. Protozool. 1964, 11, 423–430. [Google Scholar] [CrossRef]
- Adam, K.M.G. The growth of Acanthamoeba sp. in a chemically defined medium. J. Gen. Microbiol. 1959, 21, 519–529. [Google Scholar] [CrossRef]
- Willaert, E. Etude immuno-taxonomique des genres Naegleria et Acanthamoeba (protozoa: Amoebida). Acta Zool. Pathol. Antverp. 1976, 65, 1–239. [Google Scholar]
- Costas, M.; Griffiths, A.J. The suitability of starch-gel electrophoresis of esterases and acid-phosphatases for the study of Acanthamoeba taxonomy. Arch. Protistenkd. 1980, 123, 272–279. [Google Scholar] [CrossRef]
- Adam, K.M.G.; Blewett, D.A. Studies on the DNA of Acanthamoeba. Ann. Soc. Belg. Med. Trop 1974, 54, 163–169. [Google Scholar]
- Bogler, S.A.; Zarley, C.D.; Burianek, L.L.; Fuerst, P.A.; Byers, T.J. Interstrain mitochondrial DNA polymorphism detected in Acanthamoeba by restriction endonuclease analysis. Mol. Biochem. Parasitol. 1983, 8, 145–163. [Google Scholar] [CrossRef]
- Singh, B.N.; Das, S.R. Studies on pathogenic and non-pathogenic small free-living amoebae and the bearing of nuclear division on the classification of the order Amoebida. Phil. Trans. R. Soc. Lond. B Biol. Sci. 1970, 259, 435–476. [Google Scholar] [CrossRef]
- Page, F.C. Taxonomic criteria for limax amoebae, with descriptions of 3 new species of Hartmannella and 3 of Vahlkampfia. J. Protozool. 1967, 14, 499–521. [Google Scholar] [CrossRef] [PubMed]
- Puschkarew, B.M. Über die verbreitung der süsswasser-protozoen durch die luft. Arch. Protistenkd. B D 1913, 23, 323–362. [Google Scholar]
- Reich, K. Studien über die bodenprotozoen Palästinas. Arch. Protistenk. 1933, 79, 76–98. [Google Scholar]
- Ray, D.L.; Hayes, R.E. Hartmannella astronyxis: A new species of free-living ameba. cytology and life cycle. J. Morphol. 1954, 95, 159–188. [Google Scholar] [CrossRef]
- Pussard, M. Acanthamoeba comandoni n. sp., comparaison avec A. terricola. Rev. Ecol. Biol. Sci. 1964, 1, 587–610. [Google Scholar]
- Pussard, M. Cytologie d’une amibe terricole, Acanthamoeba terricola n. sp. Ann. Sci. Natur. Zool. 1964, 6, 565–600. [Google Scholar]
- Schmoller, H. Beschreibung einiger kulturamöben mariner herkunft. J. Protozool. 1964, 11, 497–502. [Google Scholar] [CrossRef] [PubMed]
- Sawyer, T.K. Acanthamoeba griffini, a new species of marine amoeba. J. Protozool. 1971, 18, 650–654. [Google Scholar] [CrossRef]
- Pussard, M. Comparaison morphologique de 4 souches d’Acanthamoeba du groupe astronyxis-comandoni. J. Protozool. 1972, 19, 557–563. [Google Scholar] [CrossRef]
- Molet, B.; Ermolieff-Braun, G. Description d’une amibe d’eau douce: Acanthamoeba lenticulata, sp. nov. (Amoebida). Protistologica 1976, 12, 571–576. [Google Scholar]
- Willaert, E.; Stevens, A.R.; Tyndall, R.L. Acanthamoeba royreba sp. n. from a human tumor cell culture. J. Protozool. 1978, 25, 1–14. [Google Scholar] [CrossRef]
- Lewis, E.J.; Sawyer, T.K. Acanthamoeba tubiashi N. sp., a new species of fresh-water Amoebida (Acanthamoebidae). Trans. Am. Microsc. Soc. 1979, 98, 543–549. [Google Scholar] [CrossRef]
- Hubby, J.L.; Lewontin, R.C. A molecular approach to study of genic heterozygosity in natural populations. I. number of alleles at different loci in Drosophila pseudoobscura. Genetics 1966, 54, 577–594. [Google Scholar]
- Lewontin, R.C.; Hubby, J.L. A molecular approach to the study of genic heterozygosity in natural populations. II. amount of variation and degree of heterozygosity in natural populations of Drosophila pseudoobscura. Genetics 1966, 54, 595–609. [Google Scholar]
- Harris, H. Enzyme polymorphisms in man. Proc. R. Soc. Lond. Ser. B Biol. Sci. 1966, 164, 298–310. [Google Scholar] [CrossRef]
- Harris, H.; Hopkinson, D.A. Average heterozygosity per locus in man—An estimate based on incidence of enzyme polymorphisms. Ann. Hum. Genet. 1972, 36, 9–20. [Google Scholar] [CrossRef] [PubMed]
- Fuerst, P.A.; Chakraborty, R.; Nei, M. Statistical studies on protein polymorphism in natural-populations. I. distribution of single locus heterozygosity. Genetics 1977, 86, 455–483. [Google Scholar]
- Prakash, S.; Lewontin, R.C.; Hubby, J.L. A molecular approach to study of genic heterozygosity in natural populations. 4. Patterns of genic variation in central, marginal and isolated populations of Drosophila pseudoobscura. Genetics 1969, 61, 841–858. [Google Scholar] [PubMed]
- Sage, R.D.; Selander, R.K. Trophic radiation through polymorphism in cichlid fishes. Proc. Natl. Acad. Sci. USA 1975, 72, 4669–4673. [Google Scholar] [CrossRef] [PubMed]
- Selander, R.K.; Hunt, W.G.; Yang, S.Y. Protein polymorphism and genic heterozygosity in 2 European subspecies of house mouse. Evolution 1969, 23, 379–390. [Google Scholar] [CrossRef]
- Byers, T.J.; Bogler, S.A.; Burianek, L.L. Analysis of mitochondrial DNA variation as an approach to systematic relationships in the genus Acanthamoeba. J. Protozool. 1983, 30, 198–203. [Google Scholar] [CrossRef]
- Kong, H.; Chung, D. PCR and RFLP variation of conserved region of small subunit ribosomal DNA among Acanthamoeba isolates assigned to either A. castellanii or A. polyphaga. Korean J. Parasitol. 1996, 34, 127–134. [Google Scholar] [CrossRef]
- Chung, D.; Yu, H.; Hwang, M.; Kim, T.; Kim, T.; Yun, H.; Kong, H. Subgenus classification of Acanthamoeba by riboprinting. Korean J. Parasitol. 1998, 36, 69–80. [Google Scholar] [CrossRef]
- Gunderson, J.H.; Sogin, M.L. Length variation in eukaryotic rRNAs: Small subunit rRNAs from the protists Acanthamoeba castellanii and Euglena gracilis. Gene 1986, 44, 63–70. [Google Scholar] [CrossRef]
- Moura, H.; Wallace, S.; Visvesvara, G.S. Acanthamoeba healyi n-sp and the isoenzyme and immunoblot profiles of Acanthamoeba spp, groups 1 and 3. J. Protozool. 1992, 39, 573–583. [Google Scholar] [CrossRef] [PubMed]
- Sawyer, T.K.; Nerad, T.A.; Visvesvara, G.S. Acanthamoeba jacobsi sp. n.(Protozoa: Acanthamoebidae) from sewage contaminated ocean sediments. J. Helminthol. Soc. Wash. 1992, 59, 223–226. [Google Scholar]
- Sawyer, T.K.; Nerad, T.A.; Lewis, E.J.; McLaughlin, S.M. Acanthamoeba stevensoni N-sp (Protozoa, Amebida) from sewage-contaminated shellfish beds in Raritan Bay, New-York. J. Eukaryot. Microbiol. 1993, 40, 742–746. [Google Scholar] [CrossRef]
- Nerad, T.A.; Sawyer, T.K.; Lewis, E.J.; McLaughlin, S.M. Acanthamoeba pearcei N-sp (Protozoa, Amebida) from sewage contaminated sediments. J. Eukaryot. Microbiol 1995, 42, 702–705. [Google Scholar] [CrossRef]
- Im, K.; Shin, H. Acanthamoeba sohi, n. sp., a pathogenic Korean isolate YM-4 from a freshwater fish. Korean J. Parasitol. 2003, 41, 181–188. [Google Scholar] [CrossRef]
- Qvarnstrom, Y.; Nerad, T.A.; Visvesvara, G.S. Characterization of a new pathogenic Acanthamoeba species, A. byersi n. sp., isolated from a human with fatal amoebic encephalitis. J. Eukaryot. Microbiol. 2013, 60, 626–633. [Google Scholar] [CrossRef]
- Corsaro, D.; Walochnik, J.; Köhsler, M.; Rott, M.B. Acanthamoeba misidentification and multiple labels: Redefining genotypes T16, T19, and T20 and proposal for Acanthamoeba micheli sp nov (genotype T19). Parasitol. Res. 2015, 114, 2481–2490. [Google Scholar] [CrossRef]
- Tice, A.K.; Shadwick, L.L.; Fiore-Donno, A.M.; Geisen, S.; Kang, S.; Schuler, G.A.; Spiegel, F.W.; Wilkinson, K.A.; Bonkowski, M.; Dumack, K.; et al. Expansion of the molecular and morphological diversity of Acanthamoebidae (Centramoebida, Amoebozoa) and identification of a novel life cycle type within the group. Biol. Direct 2016, 11, 69. [Google Scholar] [CrossRef]
- Pernin, P.; Pussard, M. Etude en microscopie photonique et electronique d’une amibe voisine du genre Acanthamoeba: Comandonia operculata n. gen., n. sp. (Amoebida, Acanthamoebidae). Protistologica 1979, 15, 87–102. [Google Scholar]
- Amaral Zettler, L.A.; Anderson, O.R.; Nerad, T.A.; Sogin, M.L. The phylogenetic position of Comandonia operculata and its implications for the taxonomy of the genus Acanthamoeba. In IXth International Meeting on the Biology and Pathogenicity of Free-living Amoebae Proceedings, Paris, France, 8–14 July 2001; Billot-Bonef, S., Cabanes, P.A., Marciano-Cabral, F., Pernin, P., Pringuez, E., Eds.; John Libbey Eurotext: Paris, French, 2001; pp. 235–242. [Google Scholar]
- Saiki, R.K.; Gelfand, D.H.; Stoffel, S.; Scharf, S.J.; Higuchi, R.; Horn, G.T.; Mullis, K.B.; Erlich, H.A. Primer-directed enzymatic amplification of DNA with a thermostable DNA polymerase. Science 1988, 239, 487–491. [Google Scholar] [CrossRef]
- Mullis, K.; Faloona, F.; Scharf, S.; Saiki, R.K.; Horn, G.T.; Erlich, H. Specific enzymatic amplification of DNA in vitro: The polymerase chain reaction. Proc. Cold Spring Harb. Symp. Quant. Biol. 1986, 51, 263–273. [Google Scholar] [CrossRef] [PubMed]
- Acanthamoeba and Free-Living Amoebae: The Molecular Analysis and Understanding of Acanthamoeba and Related Forms. 2015. Available online: https://u.osu.edu/acanthamoeba/ (accessed on 1 July 2020).
- Gonzalez, I.L.; Schmickel, R.D. The human 18S ribosomal RNA gene: Evolution and stability. Am. J. Hum. Genet. 1986, 38, 419–427. [Google Scholar] [PubMed]
- Stothard, D.R.; Schroeder-Diedrich, J.M.; Awwad, M.H.; Gast, R.J.; Ledee, D.R.; Rodriguez-Zaragoza, S.; Dean, C.L.; Fuerst, P.A.; Byers, T.J. The evolutionary history of the genus Acanthamoeba and the identification of eight new 18S rRNA gene sequence types. J. Eukaryot. Microbiol. 1998, 45, 45–54. [Google Scholar] [CrossRef] [PubMed]
- Johnson, A.M.; Fielke, R.; Christy, P.E.; Robinson, B.; Baverstock, P.R. Small subunit ribosomal RNA evolution in the genus Acanthamoeba. J. Gen. Micro 1990, 136, 1689–1698. [Google Scholar] [CrossRef]
- Gast, R.J. Analysis of the Population Structure of Acanthamoeba and the Development of Diagnostic Oligonucleotide Probes Based upon Nuclear Small Subunit Ribosomal RNA Gene Sequences. Ph.D. Thesis, The Ohio State University, Columbus, OH, USA, 1994. [Google Scholar]
- Gast, R.J.; Ledee, D.R.; Fuerst, P.A.; Byers, T.J. Subgenus systematics of Acanthamoeba: Four nuclear 18S rDNA sequence types. J. Eukaryot. Microbiol. 1996, 43, 498–504. [Google Scholar] [CrossRef] [PubMed]
- Fuerst, P.A.; Booton, G.C.; Crary, M. Phylogenetic analysis and the evolution of the 18S rRNA gene typing system of Acanthamoeba. J. Eukaryot. Microbiol. 2015, 62, 69–84. [Google Scholar] [CrossRef]
- Horn, M.; Fritsche, T.R.; Gautom, R.K.; Schleifer, K.; Wagner, M. Novel bacterial endosymbionts of Acanthamoeba spp. related to the Paramecium caudatum symbiont Caedibacter caryophilus. Environ. Microbiol. 1999, 1, 357–367. [Google Scholar] [CrossRef]
- Gast, R.J. Development of an Acanthamoeba-specific reverse dot-blot and the discovery of a new ribotype. J. Eukaryot. Microbiol. 2001, 48, 609–615. [Google Scholar]
- Hewett, M.K.; Robinson, B.S.; Monis, P.T.; Saint, C.P. Identification of a new acanthamoeba 18S rRNA gene sequence type, corresponding to the species Acanthamoeba jacobsi Sawyer, Nerad and Visvesvara, 1992 (Lobosea: Acanthamoebidae). Acta Protozool. 2003, 42, 325–329. [Google Scholar]
- Corsaro, D.; Köhsler, M.; Di Filippo, M.M.; Venditti, D.; Monno, R.; Di Cave, D.; Berrilli, F.; Walochnik, J. Update on Acanthamoeba jacobsi genotype T15, including full-length 18S rDNA molecular phylogeny. Parasitol. Res. 2017, 116, 1273–1284. [Google Scholar] [CrossRef]
- Corsaro, D.; Venditti, D. Phylogenetic evidence for a new genotype of Acanthamoeba (Amoebozoa, Acanthamoebida). Parasitol. Res. 2010, 107, 233–238. [Google Scholar] [CrossRef] [PubMed]
- Lanocha, N.; Kosik-Bogacka, D.; Maciejewska, A.; Sawczuk, M.; Wilk, A.; Kuzna-Grygiel, W. The occurrence Acanthamoeba (free living amoeba) in environmental and respiratory samples in Poland. Acta Protozool. 2009, 48, 271–279. [Google Scholar]
- Alves, J.M.P. Caracterização e Filogenia Moleculares de Acanthamoeba. Ph.D. Thesis, Universidade de São Paulo, São Paulo, Brazil, 2001. [Google Scholar]
- Nuprasert, W.; Putaporntip, C.; Pariyakanok, L.; Jongwutiwes, S. Identification of a novel T17 genotype of Acanthamoeba from environmental isolates and T10 genotype causing keratitis in Thailand. J. Clin. Microbiol. 2010, 48, 4636–4640. [Google Scholar] [CrossRef] [PubMed]
- Magnet, A.; Henriques-Gil, N.; Galván-Diaz, A.; Izquiedo, F.; Fenoy, S.; Del Aguila, C. Novel Acanthamoeba 18S rRNA gene sequence type from an environmental isolate. Parasitol. Res. 2014, 113, 2845–2850. [Google Scholar] [CrossRef] [PubMed]
- Visvesvara, G.S.; Booton, G.C.; Kelley, D.J.; Fuerst, P.; Sriram, R.; Finkelstein, A.; Garner, M.M. In vitro culture, serologic and molecular analysis of Acanthamoeba isolated from the liver of a keel-billed toucan (Ramphastos sulfuratus). Vet Parasitol. 2007, 143, 74–78. [Google Scholar] [CrossRef]
- Adamska, M. Molecular characterization of Acanthamoeba spp. occurring in water bodies and patients in Poland and redefinition of Polish T16 genotype. J. Eukaryot. Microbiol. 2016, 63, 262–270. [Google Scholar] [CrossRef]
- Schroeder, J.M.; Booton, G.C.; Hay, J.; Niszl, I.A.; Seal, D.V.; Markus, M.B.; Fuerst, P.A.; Byers, T.J. Use of subgenic 18S ribosomal DNA PCR and sequencing for genus and genotype identification of Acanthamoebae from humans with keratitis and from sewage sludge. J. Clin. Microbiol. 2001, 39, 1903–1911. [Google Scholar] [CrossRef]
- Booton, G.C.; Kelly, D.J.; Chu, Y.; Seal, D.V.; Houang, E.; Lam, D.; Byers, T.J.; Fuerst, P.A. 18S ribosomal DNA typing and tracking of Acanthamoeba species isolates from corneal scrape specimens, contact lenses, lens cases, and home water supplies of Acanthamoeba keratitis patients in hong kong. J. Clin. Microbiol. 2002, 40, 1621–1625. [Google Scholar] [CrossRef]
- Nei, M.; Li, W. Mathematical model for studying genetic variation in terms of restriction endonucleases. Proc. Natl. Acad. Sci. USA 1979, 76, 5269–5273. [Google Scholar] [CrossRef] [PubMed]
- Walochnik, J.; Obwaller, A.; Aspöck, H. Correlations between morphological, molecular biological, and physiological characteristics in clinical and nonclinical isolates of Acanthamoeba spp. Appl. Environ. Microbiol. 2000, 66, 4408–4413. [Google Scholar] [CrossRef] [PubMed]
- Ledee, D.R.; Iovieno, A.; Miller, D.; Mandal, N.; Diaz, M.; Fell, J.; Fini, M.E.; Alfonso, E.C. Molecular identification of T4 and T5 genotypes in isolates from Acanthamoeba keratitis patients. J. Clin. Microbiol. 2009, 47, 1458–1462. [Google Scholar] [CrossRef] [PubMed]
- Abe, N.; Kimata, I. Genotyping of Acanthamoeba isolates from corneal scrapings and contact lens cases of Acanthamoeba keratitis patients in Osaka, Japan. Jpn. J. Infect. Dis. 2010, 63, 299–301. [Google Scholar] [PubMed]
- Zhao, G.; Sun, S.; Zhao, J.; Xie, L. Genotyping of Acanthamoeba isolates and clinical characteristics of patients with Acanthamoeba keratitis in China. J. Med. Microbiol. 2010, 59, 462–466. [Google Scholar] [CrossRef]
- Duarte, J.L.; Furst, C.; Klisiowicz, D.R.; Klassen, G.; Costa, A.O. Morphological, genotypic, and physiological characterization of Acanthamoeba isolates from keratitis patients and the domestic environment in Vitoria, Espírito Santo, Brazil. Exp. Parasitol. 2013, 135, 9–14. [Google Scholar] [CrossRef]
- Magnet, A.; Fenoy, S.; Galván, A.L.; Izquierdo, F.; Rueda, C.; Fernandez Vadillo, C.; Del Aguila, C. A year long study of the presence of free living amoeba in Spain. Water Res. 2013, 47, 6966–6972. [Google Scholar] [CrossRef] [PubMed]
- Risler, A.; Coupat-Goutaland, B.; Pélandakis, M. Genotyping and phylogenetic analysis of Acanthamoeba isolates associated with keratitis. Parasitol. Res. 2013, 112, 3807–3816. [Google Scholar] [CrossRef] [PubMed]
- Altschul, S.F.; Gish, W.; Miller, W.; Myers, E.W.; Lipman, D.J. Basic local alignment search tool. J. Mol. Biol. 1990, 215, 403–410. [Google Scholar] [CrossRef]
- Alleles within Sequence Type T4. 2015. Available online: https://u.osu.edu/acanthamoeba/alleles-within-sequence-types/ (accessed on 1 July 2020).
- Byers, T.J. Molecular biology of DNA in Acanthamoeba, amoeba, Entamoeba, and Naegleria. Int. Rev. Cytol. 1986, 99, 311–341. [Google Scholar] [CrossRef] [PubMed]
- Byers, T.J.; Booton, G.C.; Stothard, D.R.; Gast, R.J.; Ledee, D.R.; Schroeder, J.M.; Awwad, M.H.; Fuerst, P.A. Studies of the phylogeny, systematics and pathogenicity of acanthamoeba using ribosomal and transfer RNA gene sequences. In IXth International Meeting on the Biology and Pathogenicity of Free-living Amoebae Proceedings, Paris, France, 8–14 July 2001; Billot-Bonef, S., Cabanes, P.A., Marciano-Cabral, F., Pernin, P., Pringuez, E., Eds.; John Libbey Eurotext: Paris, French, 2001; pp. 211–218. [Google Scholar]
- Dover, G. Molecular drive: A cohesive mode of species evolution. Nature 1982, 299, 111–117. [Google Scholar] [CrossRef]
- Elder, J.F., Jr.; Turner, B.J. Concerted evolution of repetitive DNA sequences in eukaryotes. Q Rev. Biol. 1995, 70, 297–320. [Google Scholar] [CrossRef]
- Naidoo, K.; Steenkamp, E.T.; Coetzee, M.P.; Wingfield, M.J.; Wingfield, B.D. Concerted evolution in the ribosomal RNA cistron. PLoS ONE 2013, 8, e59355. [Google Scholar] [CrossRef]
- Ledee, D.R.; Seal, D.V.; Byers, T.J. Confirmatory evidence from 18S rRNA gene analysis for in vivo development of propamidine resistance in a temporal series of Acanthamoeba ocular isolates from a patient. Antimicrob. Agents Chemother. 1998, 42, 2144–2145. [Google Scholar] [CrossRef]
- Fuerst, P.A. Insights from the DNA databases: Approaches to the phylogenetic structure of Acanthamoeba Exp. Parasitol. 2014, 145, S39–S45. [Google Scholar] [CrossRef]
- Alleles within Sequence Types T3 and T11. 2015. Available online: https://u.osu.edu/acanthamoeba/alleles-within-sequence-types-t3-and-t11/ (accessed on 1 July 2020).
- Chakraborty, R.; Fuerst, P.A.; Nei, M. Statistical studies on protein polymorphism in natural-populations. 3. Distribution of allele frequencies and the number of alleles per locus. Genetics 1980, 94, 1039–1063. [Google Scholar]
- Myers, S.; Fefferman, C.; Patterson, N. Can one learn history from the allelic spectrum? Theor. Popul. Biol. 2008, 73, 342–348. [Google Scholar] [CrossRef]
- Ragsdale, A.P.; Moreau, C.; Gravel, S. Genomic inference using diffusion models and the allele frequency spectrum. Curr. Opin. Genet. Dev. 2018, 53, 140–147. [Google Scholar] [CrossRef] [PubMed]
- Pool, J.E.; Hellmann, I.; Jensen, J.D.; Nielsen, R. Population genetic inference from genomic sequence variation. Genome Res. 2010, 20, 291–300. [Google Scholar] [CrossRef]
- Achaz, G. Frequency spectrum neutrality tests: One for all and all for one. Genetics 2009, 183, 249–258. [Google Scholar] [CrossRef] [PubMed]
- Bustamante, C.D.; Wakeley, J.; Sawyer, S.; Hartl, D.L. Directional selection and the site-frequency spectrum. Genetics 2001, 159, 1779–1788. [Google Scholar] [PubMed]
- Fu, Y. Statistical properties of segregating sites. Theor. Popul. Biol. 1995, 48, 172–197. [Google Scholar] [CrossRef] [PubMed]
- Nawa, N.; Tajima, F. Simple method for analyzing the pattern of DNA polymorphism and its application to SNP data of human. Genes. Genet. Syst. 2008, 83, 353–360. [Google Scholar] [CrossRef] [PubMed][Green Version]
- Boenigk, J.; Ereshefsky, M.; Hoef-Emden, K.; Mallet, J.; Bass, D. Concepts in protistology: Species definitions and boundaries. Eur. J. Protistol. 2012, 48, 96–102. [Google Scholar] [CrossRef] [PubMed]
- Leliaert, F.; Verbruggen, H.; Vanormelingen, P.; Steen, F.; López-Bautista, J.M.; Zuccarello, G.C.; De Clerck, O. DNA-based species delimitation in algae. Eur. J. Phycol. 2014, 49, 179–196. [Google Scholar] [CrossRef]
- Mayr, E. Systematics and the Origin of Species: From the Viewpoint of a Zoologist.; Columbia University Press: New York, NY, USA, 1942; p. 334. [Google Scholar]
- Hey, J. On the failure of modern species concepts. Trends Ecol. Evol. 2006, 21, 447–450. [Google Scholar] [CrossRef]
- Eldredge, N.; Cracraft, J. Phylogenetic Patterns and the Evolutionary Process; Columbia University Press: New York, NY, USA, 1980; p. 349. [Google Scholar]
- Maiden, M.; Bygraves, J.A.; Feil, E.; Morelli, G.; Russell, J.E.; Urwin, R.; Zhang, Q.; Zhou, J.J.; Zurth, K.; Caugant, D.A.; et al. Multilocus sequence typing: A portable approach to the identification of clones within populations of pathogenic microorganisms. Proc. Natl. Acad. Sci. USA 1998, 95, 3140–3145. [Google Scholar] [CrossRef]
- Urwin, R.; Maiden, M. Multi-locus sequence typing: A tool for global epidemiology. Trends Microbiol. 2003, 11, 479–487. [Google Scholar] [CrossRef]
- Tibayrenc, M.; Ayala, F.J. Is predominant clonal evolution a common evolutionary adaptation to parasitism in pathogenic parasitic protozoa, fungi, bacteria, and viruses? Adv. Parasitol. 2017, 97, 243–325. [Google Scholar] [CrossRef]
- Ledee, D.R.; Booton, G.C.; Awwad, M.H.; Sharma, S.; Aggarwal, R.K.; Niszl, I.A.; Markus, M.B.; Fuerst, P.A.; Byers, T.J. Advantages of using mitochondrial 16S rDNA sequences to classify clinical isolates of Acanthamoeba. Invest. Ophthalmol. Vis. Sci. 2003, 44, 1142–1149. [Google Scholar] [CrossRef]
- Malavin, S.; Shmakova, L. Isolates from ancient permafrost help to elucidate species boundaries in Acanthamoeba castellanii complex (Amoebozoa: Discosea). Eur. J. Protistol. 1256, 71, UNSP 125671. [Google Scholar] [CrossRef]
- Crary, M.J.; Lares-Villa, F.; Booton, G.; Joslin, C.; Tu, E.; Fuerst, P. Multilocus sequence typing of Acanthamoeba keratitis-associated clinical isolates from a Chicago outbreak. In Proceedings of the XIVth International Meeting on the Biology and Pathogenicity of Free-Living Amoebae, Montego Bay, Jamaica, 10 October 2011. Abstract P11. [Google Scholar]
- Crary, M.J. Genetic Variability and its Relationship to Acanthamoeba Pathogenesis. Ph.D. Thesis, The Ohio State University, Columbus, OH, USA, 2012. [Google Scholar]
- Chelkha, N.; Jardot, P.; Moussaoui, I.; Levasseur, A.; La Scola, B.; Colson, P. Core gene-based molecular detection and identification of Acanthamoeba species. Sci. Rep. 2020, 10, 1–9. [Google Scholar] [CrossRef]
- Hebert, P.D.N.; Cywinska, A.; Ball, S.L.; Dewaard, J.R. Biological identifications through DNA barcodes. R. Soc. Lond. Ser. B Biol. Sci. 2003, 270, 313–321. [Google Scholar] [CrossRef]
- Hebert, P.D.N.; Ratnasingham, S.; DeWaard, J.R. Barcoding animal life: Cytochrome c oxidase subunit 1 divergences among closely related species. Proc. R. Soc. B Biol. Sci. 2003, 270, S96–S99. [Google Scholar] [CrossRef]
- Hebert, P.D.N.; Stoeckle, M.Y.; Zemlak, T.S.; Francis, C.M. Identification of birds through DNA barcodes. Plos Biology 2004, 2, 1657–1663. [Google Scholar] [CrossRef] [PubMed]
- Pawlowski, J.; Audic, S.; Adl, S.; Bass, D.; Belbahri, L.; Berney, C.; Bowser, S.S.; Cepicka, I.; Decelle, J.; Dunthorn, M.; et al. CBOL protist working group: Barcoding eukaryotic richness beyond the animal, plant, and fungal kingdoms. PLoS Biol. 2012, 10, e1001419. [Google Scholar] [CrossRef] [PubMed]
- Del Chierico, F.; Di Cave, D.; Accardi, C.; Santoro, M.; Masotti, A.; D’Alfonso, R.; Berrilli, F.; Urbani, A.; Putignani, L. Identification and typing of free-living Acanthamoeba spp. by MALDI-TOF MS biotyper. Exp. Parasitol. 2016, 170, 82–89. [Google Scholar] [CrossRef] [PubMed]
- Megha, K.; Sharma, M.; Gupta, A.; Sehgal, R.; Khurana, S. Protein profiling of acanthamoeba species using MALDI-TOF MS for specific identification of Acanthamoeba genotype. Parasitol. Res. 2018, 117, 729–736. [Google Scholar] [CrossRef]


| Year | Species | Type Strain | Reference |
|---|---|---|---|
| 1913 | Acanthamoeba polyphaga | CCAP 1501/3A and ATCC 30871 (*) | [18] |
| 1930 | Acanthamoeba castellanii | CCAP 1501/10 and ATCC 30011 | [5] |
| 1933 | Acanthamoeba palestinensis | 1547/1 and ATCC 30870 | [19] |
| 1952 | Acanthamoeba rhysodes | CCAP 1534/3 and ATCC 30869 | [7] |
| 1954 | Acanthamoeba astronyxis | CCAP 1534/1 | [20] |
| 1964 | Acanthamoeba comandoni | CCAP 1501/5 and ATCC 30135 | [21] |
| 1964 | Acanthamoeba terricola | ATCC 30134 | [22] |
| 1964 | Acanthamoeba gigantea | None now existing | [23] |
| 1970 | Acanthamoeba culbertsoni | ATCC 30171 | [16] |
| 1971 | Acanthamoeba griffini | ATCC 30731 | [24] |
| 1972 | Acanthamoeba echinulata | ATCC 50239 | [25] |
| 1976 | Acanthamoeba lenticulata | ATCC 30841 | [26] |
| 1977 | Acanthamoeba royreba | ATCC 30884 | [27] |
| Species | Type Strain | Group |
|---|---|---|
| Acanthamoeba divionensis | ATCC 50238 | II |
| Acanthamoeba echinulata | ATCC 50239 (*) | I |
| Acanthamoeba lugdunensis | ATCC 50240 | II |
| Acanthamoeba mauritaniensis | ATCC 50253 | II |
| Acanthamoeba paradivionensis | ATCC 50251 | II |
| Acanthamoeba pustulosa | ATCC 50252 | III |
| Acanthamoeba quina | ATCC 50241 | II |
| Acanthamoeba triangularis | ATCC 50254 | II |
| Year | Species | Type Strain | Group | Reference |
|---|---|---|---|---|
| 1992 | Acanthamoeba healyi | CDC: 1283:V013 | III | [41] |
| 1992 | Acanthamoeba jacobsi | ATCC 30732 | III | [42] |
| 1993 | Acanthamoeba stevensoni | ATCC 50388 | II | [43] |
| 1995 | Acanthamoeba pearcei | ATCC 50435 | II | [44] |
| Year | Species | Type Strain | Group | Reference |
|---|---|---|---|---|
| 2003 | Acanthamoeba sohi | Acanthamoeba YM-4 (*) | II | [45] |
| 2013 | Acanthamoeba byersi | ATCC PRA-411 | I | [46] |
| 2015 | Acanthamoeba micheli | BRO2-T19 (**) | II | [47] |
| 2016 | Acanthamoeba pyriformis | CCAP 1501/19 | II or III | [48] |
| Allele Types | Total Observed | Allele Types | Total Observed | Allele Types | Total Observed | Allele Types | Total Observed |
|---|---|---|---|---|---|---|---|
| T4/01 | 59 | T4/11 | 2 | AKT4/22 | 244 | MT4/22 | 7 |
| T4/02 | 115 | T4/12 | 43 | AKT4/23 | 34 | MT4/23 | 15 |
| T4/03 | 11 | T4/13 | 118 | MT4/24 | 0 | ||
| T4/04 | 43 | T4/14 | 36 | ZT4/22 | 25 | MT4/25 | 29 |
| T4/05 | 1 | T4/15 | 1 | ZT4/23 | 2 | ||
| T4/06 | 155 | T4/16 | 79 | ZT4/24 | 71 | DT4/29 | 1 |
| T4/07 | 23 | T4/17 | 15 | ZT4/25 | 43 | ||
| T4/08 | 123 | T4/18 | 8 | ZT4/26 | 1 | RT4/31 | 72 |
| T4/09 | 50 | T4/19 | 2 | ZT4/27 | 1 | RT4/32 | 1 |
| T4/10 | 83 | T4/20 | 66 | ZT4/28 | 1 | RT4/33 | 48 |
| T4/21 | 78 | RT4/34 | 9 |
| Allele Types | Total Observed | Allele Types | Total Observed | Allele Types | Total Observed | Allele Types | Total Observed |
|---|---|---|---|---|---|---|---|
| OT4/39 | 182 | OT4/69 | 5 | OT4/99 | 2 | OT4/129 | 3 |
| OT4/40 | 59 | OT4/70 | 2 | OT4/100 | 2 | OT4/130 | 4 |
| OT4/41 | 21 | OT4/71 | 6 | OT4/101 | 2 | OT4/131 | 2 |
| OT4/42 | 3 | OT4/72 | 22 | OT4/102 | 2 | OT4/132 | 2 |
| OT4/43 | 16 | OT4/73 | 36 | OT4/103 | 22 | OT4/133 | 2 |
| OT4/44 | 4 | OT4/74 | 27 | OT4/104 | 2 | OT4/134 | 3 |
| OT4/45 | 6 | OT4/75 | 11 | OT4/105 | 5 | OT4/135 | 4 |
| OT4/46 | 8 | OT4/76 | 6 | OT4/106 | 3 | OT4/136 | 2 |
| OT4/47 | 23 | OT4/77 | 23 | OT4/107 | 6 | OT4/137 | 2 |
| OT4/48 | 113 | OT4/78 | 5 | OT4/108 | 5 | OT4/138 | 4 |
| OT4/49 | 9 | OT4/79 | 4 | OT4/109 | 5 | OT4/139 | 6 |
| OT4/50 | 37 | OT4/80 | 5 | OT4/110 | 2 | OT4/140 | 2 |
| OT4/51 | 25 | OT4/81 | 2 | OT4/111 | 2 | OT4/141 | 2 |
| OT4/52 | 8 | OT4/82 | 3 | OT4/112 | 2 | OT4/142 | 2 |
| OT4/53 | 13 | OT4/83 | 5 | OT4/113 | 6 | OT4/143 | 2 |
| OT4/54 | 37 | OT4/84 | 5 | OT4/114 | 2 | OT4/144 | 2 |
| OT4/55 | 4 | OT4/85 | 2 | OT4/115 | 2 | OT4/145 | 3 |
| OT4/56 | 86 | OT4/86 | 11 | OT4/116 | 5 | OT4/146 | 2 |
| OT4/57 | 2 | OT4/87 | 6 | OT4/117 | 2 | OT4/147 | 2 |
| OT4/58 | 12 | OT4/88 | 9 | OT4/118 | 2 | OT4/148 | 3 |
| OT4/59 | 3 | OT4/89 | 8 | OT4/119 | 2 | OT4/149 | 2 |
| OT4/60 | 2 | OT4/90 | 2 | OT4/120 | 6 | OT4/150 | 2 |
| OT4/61 | 2 | OT4/91 | 2 | OT4/121 | 3 | OT4/151 | 2 |
| OT4/62 | 36 | OT4/92 | 2 | OT4/122 | 2 | OT4/152 | 9 |
| OT4/63 | 8 | OT4/93 | 4 | OT4/123 | 7 | OT4/153 | 2 |
| OT4/64 | 6 | OT4/94 | 11 | OT4/124 | 4 | OT4/154 | 2 |
| OT4/65 | 11 | OT4/95 | 2 | OT4/125 | 3 | OT4/155 | 2 |
| OT4/66 | 17 | OT4/96 | 3 | OT4/126 | 2 | OT4/156 | 2 |
| OT4/67 | 9 | OT4/97 | 3 | OT4/127 | 4 | OT4/157 | 2 |
| OT4/68 | 12 | OT4/98 | 3 | OT4/128 | 2 | OT4/158 | 2 |
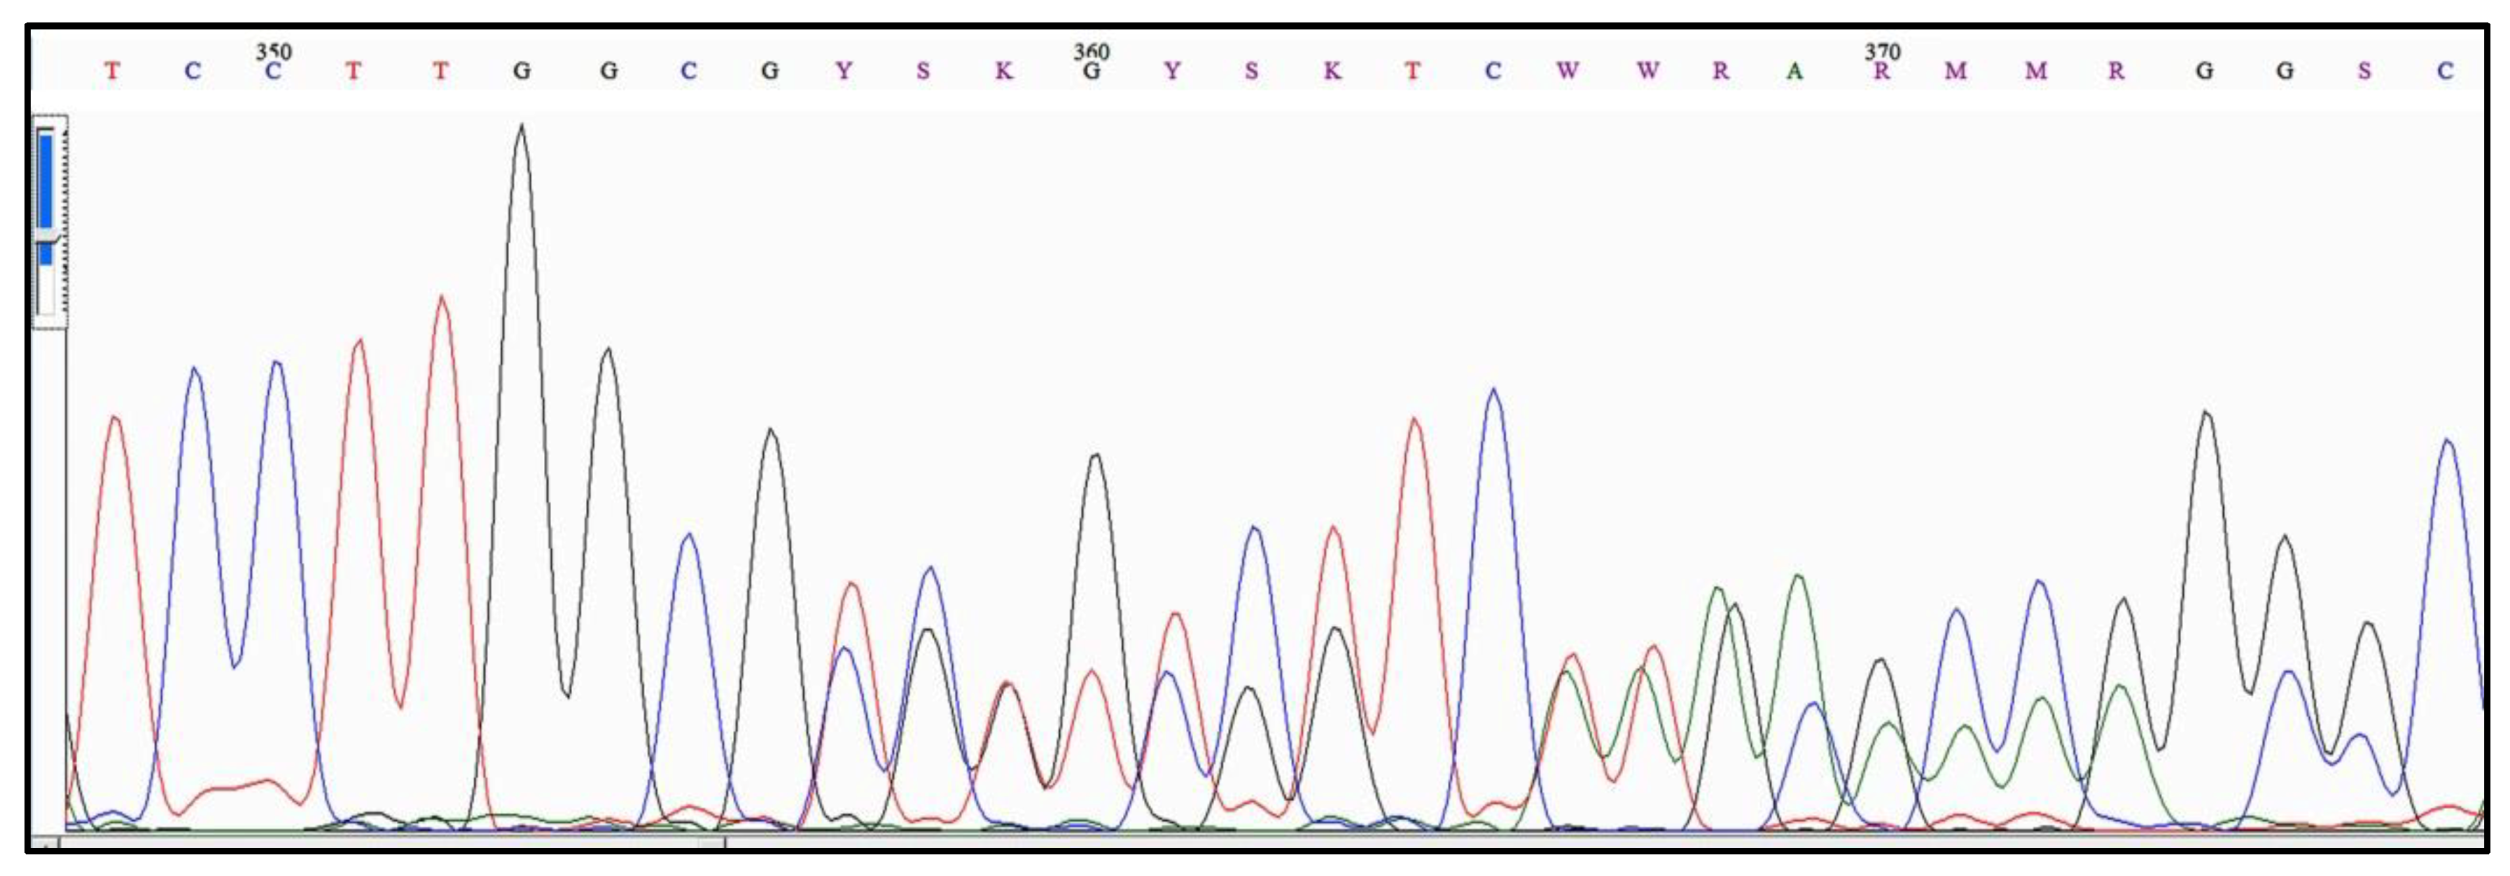
| DNA Read | TCCTTGGCGYSKGYSKTCWWRARMMRGGSC |
|---|---|
| Allele T4/18 | TCCTTGGCGTCGGTCTTCAAAAGCCGGCGC |
| Allele OT4/134 | TCCTTGGCGCGTTCGGTCTTGCAAAAGGCC |
| T4 Subtype | T4A | T4B | T4C | T4D | T4E | T4F | T4neff |
|---|---|---|---|---|---|---|---|
| Number of sequences | 133 | 96 | 53 | 33 | 14 | 64 | 12 |
| Number of alleles | 16 | 9 | 8 | 10 | 3 | 7 | 3 |
| Number of singletons | 16 | 1 | 3 | 0 | 0 | 5 | 1 |
| T4 Subtype | T4A | T4B | T4C | T4D | T4E | T4F | T4neff |
|---|---|---|---|---|---|---|---|
| sequences | 1204 | 513 | 353 | 475 | 266 | 121 | 198 |
| alleles | 45 | 24 | 11 | 30 | 21 | 8 | 12 |
| singletons | 112 | 55 | 34 | 40 | 19 | 14 | 25 |
| Allele Types | Total Observed | Allele Types | Total Observed | Allele Types | Total Observed |
|---|---|---|---|---|---|
| T3/01 | 21 | T3/06 | 2 | T3/11 | 2 |
| T3/02 | 1 | T3/07 | 2 | T3/12 | 22 |
| T3/03 | 101 | T3/08 | 2 | T3/13 | 2 |
| T3/04 | 72 | T3/09 | 2 | ||
| T3/05 | 1 | T3/10 | 2 |
| Allele Types | Total Observed | Allele Types | Total Observed | Allele Types | Total Observed |
|---|---|---|---|---|---|
| T11/01 | 14 | T11/06 | 11 | T11/11 | 12 |
| T11/02 | 10 | T11/07 | 1 | T11/12 | 4 |
| T11/03 | 9 | T11/08 | 2 | T11/13 | 2 |
| T11/04 | 13 | T11/09 | 3 | T11/14 | 2 |
| T11/05 | 1 | T11/10 | 2 |
| Allele Types | Total Observed | Allele Types | Total Observed | Allele Types | Total Observed |
|---|---|---|---|---|---|
| T5/01 | 74 | T5/06 | 8 | T5/11 | 2 |
| T5/02 | 127 | T5/07 | 2 | T5/12 | 2 |
| T5/03 | 51 | T5/08 | 3 | T5/13 | 2 |
| T5/04 | 3 | T5/09 | 2 | T5/14 | 12 |
| T5/05 | 10 | T5/10 | 2 | T5/15 | 3 |
| Allele Types | Total Observed | Allele Types | Total Observed | Allele Types | Total Observed |
|---|---|---|---|---|---|
| T15/01 | 72 | T15/05 | 2 | T15/09 | 2 |
| T15/02 | 16 | T15/06 | 6 | T15/10 | 9 |
| T15/03 | 2 | T15/07 | 2 | T15/11 | 9 |
| T15/04 | 3 | T15/08 | 2 |
| Subtype | T2 | T2/6A | T2/6B | T2/6C | T6 | Total |
|---|---|---|---|---|---|---|
| Number of isolates | 57 | 10 | 21 | 22 | 54 | 164 |
| Number of alleles shared by multiple isolates | 8 | 2 | 4 | 4 | 4 | 22 |
| Number of “complete” sequences | 17 | 2 | 7 | 4 | 8 | 38 |
| Number of shared allele in “complete sequences” | 4 | 1 | 4 | 2 | 0 | 11 |
| Number of singletons in “complete sequences” | 0 | 1 | 0 | 1 | 8 | 10 |
| Allele Types | Total Observed | Allele Types | Total Observed | Allele Types | Total Observed | Allele Types | Total Observed | Allele Types | Total Observed |
|---|---|---|---|---|---|---|---|---|---|
| T2/01 | 18 | T6/01 | 6 | T2-6A/01 | 3 | T2-6B/01 | 3 | T2-6C/01 | 8 |
| T2/02 | 2 | T6/02 | 23 | T2-6A/02 | 4 | T2-6B/02 | 3 | T2-6C/02 | 3 |
| T2/03 | 9 | T6/03 | 2 | T2-6B/03 | 2 | T2-6C/03 | 3 | ||
| T2/04 | 9 | T6/04 | 2 | T2-6B/04 | 4 | T2-6C/04 | 3 | ||
| T2/05 | 6 | ||||||||
| T2/06 | 2 | ||||||||
| T2/07 | 4 | ||||||||
| T2/08 | 2 |
© 2020 by the authors. Licensee MDPI, Basel, Switzerland. This article is an open access article distributed under the terms and conditions of the Creative Commons Attribution (CC BY) license (http://creativecommons.org/licenses/by/4.0/).
Share and Cite
Fuerst, P.A.; Booton, G.C. Species, Sequence Types and Alleles: Dissecting Genetic Variation in Acanthamoeba. Pathogens 2020, 9, 534. https://doi.org/10.3390/pathogens9070534
Fuerst PA, Booton GC. Species, Sequence Types and Alleles: Dissecting Genetic Variation in Acanthamoeba. Pathogens. 2020; 9(7):534. https://doi.org/10.3390/pathogens9070534
Chicago/Turabian StyleFuerst, Paul A., and Gregory C. Booton. 2020. "Species, Sequence Types and Alleles: Dissecting Genetic Variation in Acanthamoeba" Pathogens 9, no. 7: 534. https://doi.org/10.3390/pathogens9070534
APA StyleFuerst, P. A., & Booton, G. C. (2020). Species, Sequence Types and Alleles: Dissecting Genetic Variation in Acanthamoeba. Pathogens, 9(7), 534. https://doi.org/10.3390/pathogens9070534