Bayesian Analysis of Three Methods for Diagnosis of Cystic Echinococcosis in Sheep

 , , and
Abstract
:1. Introduction
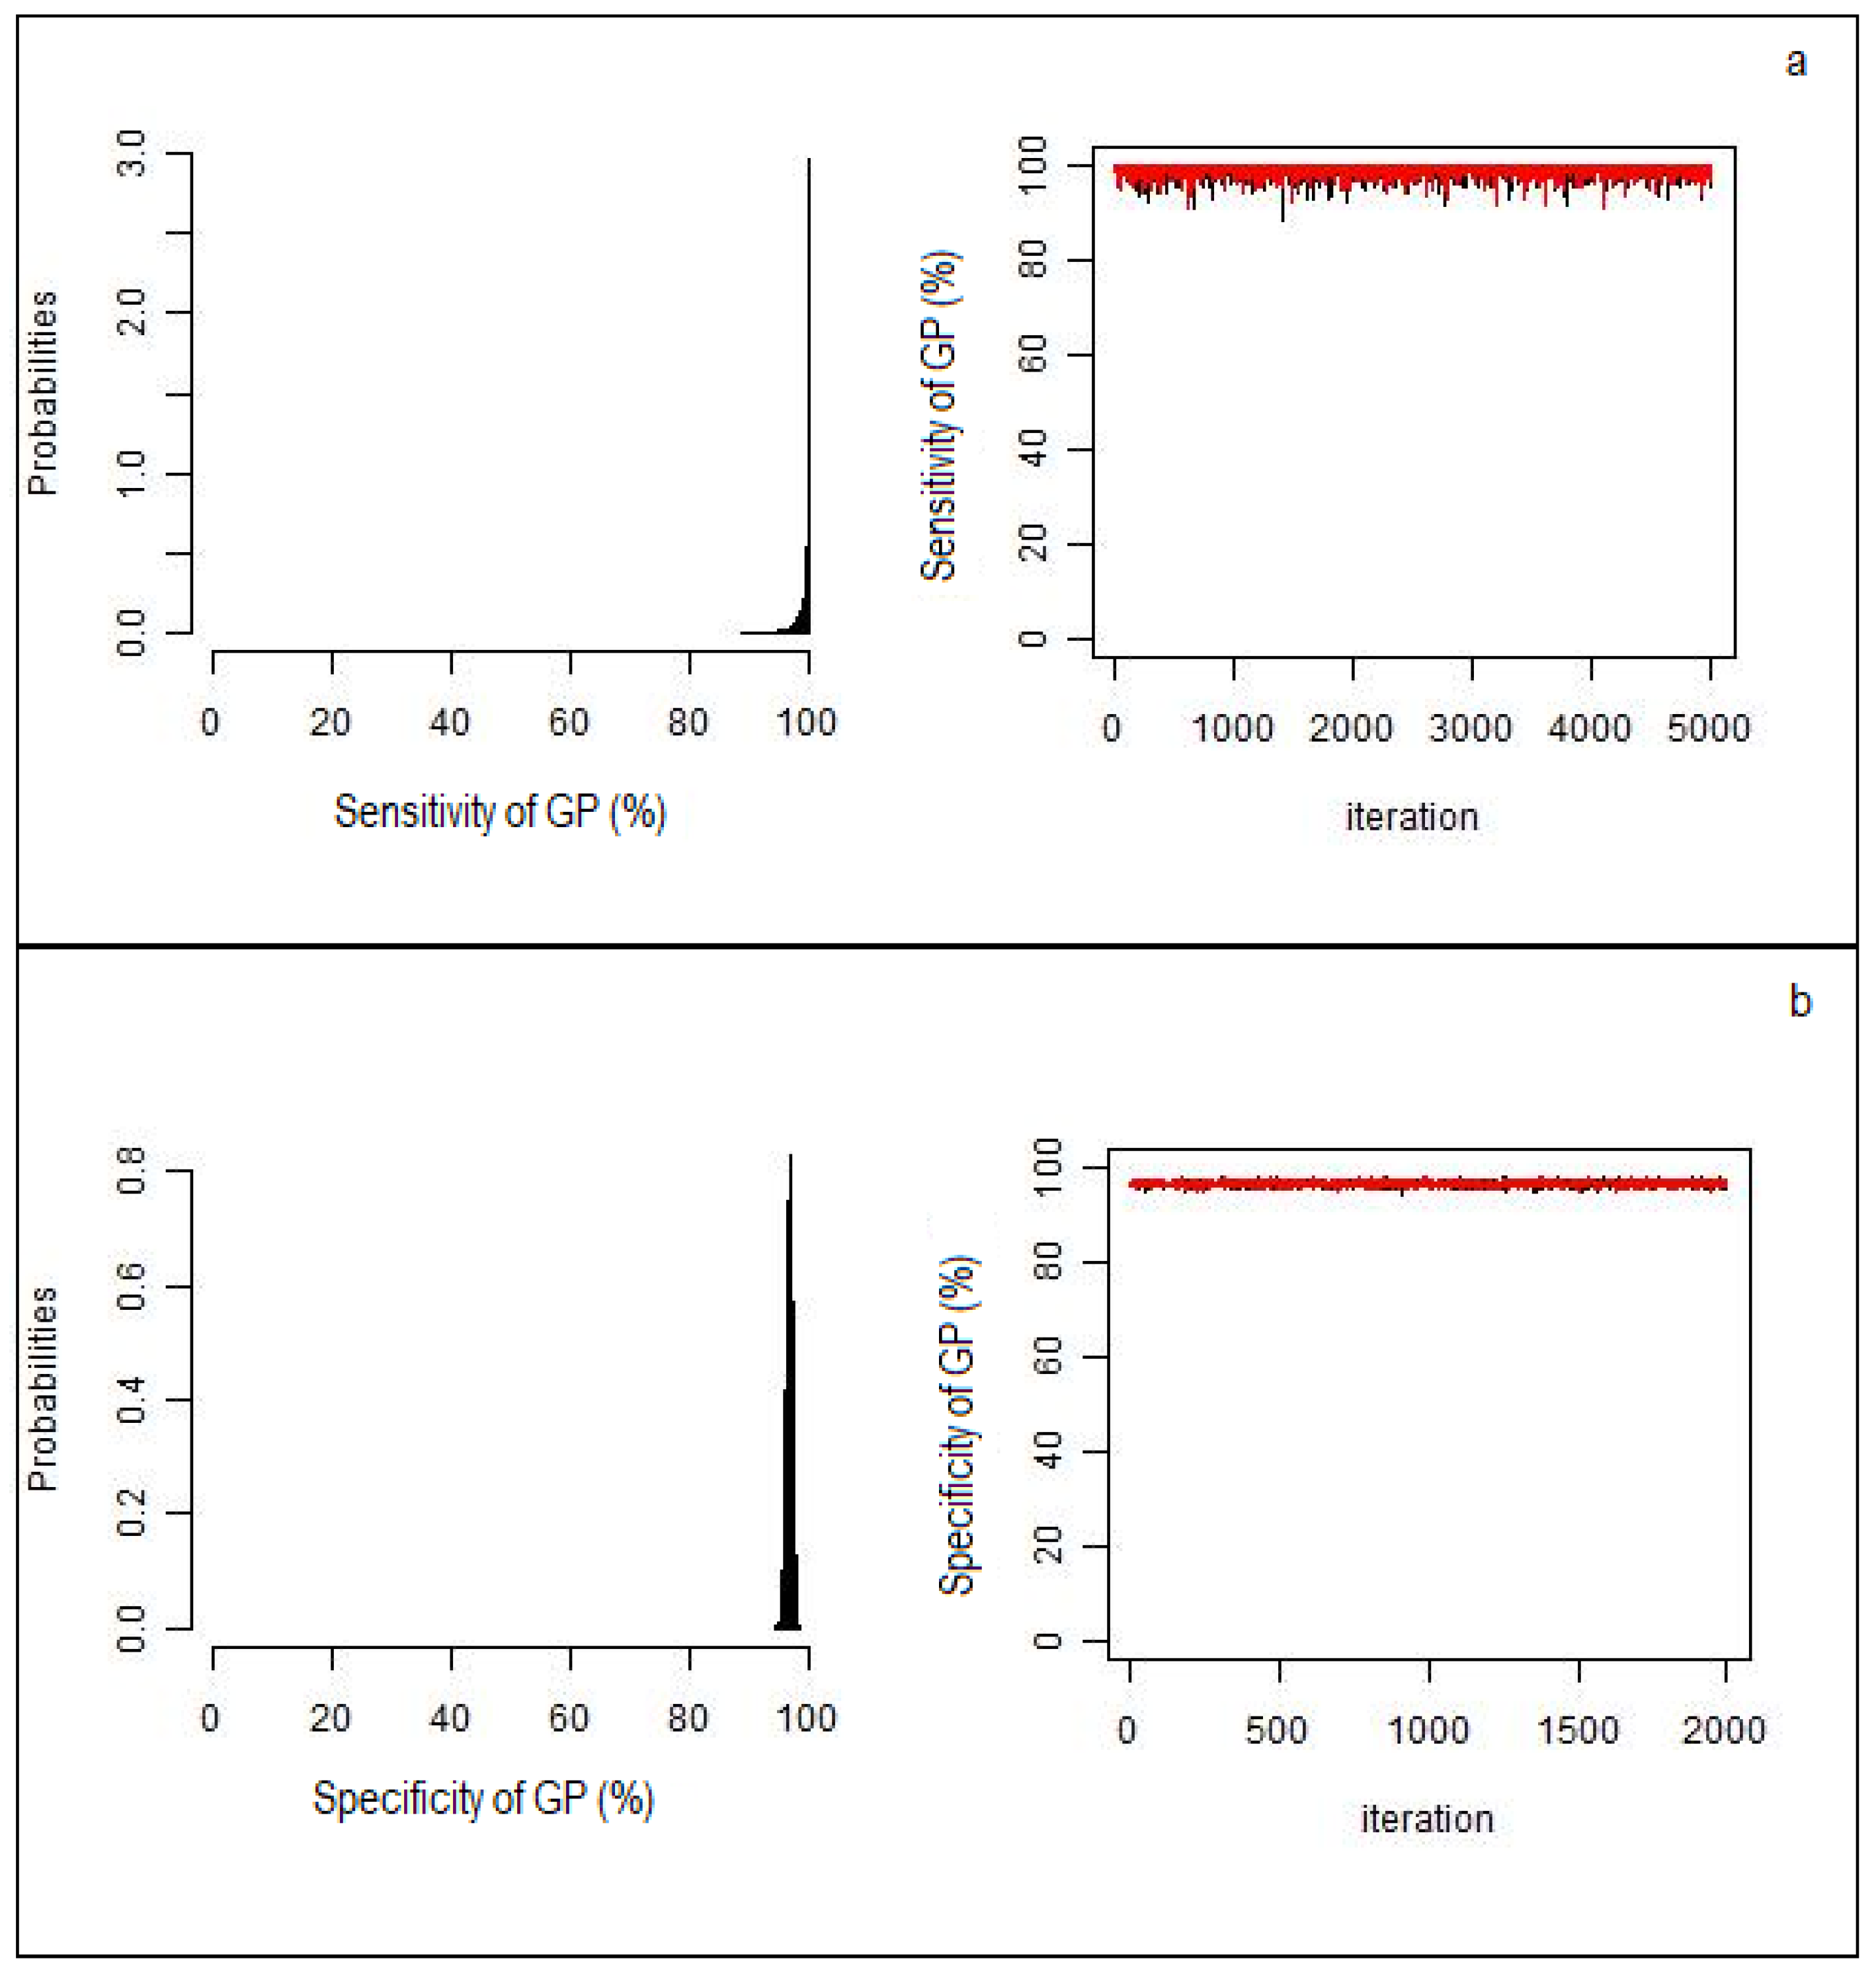
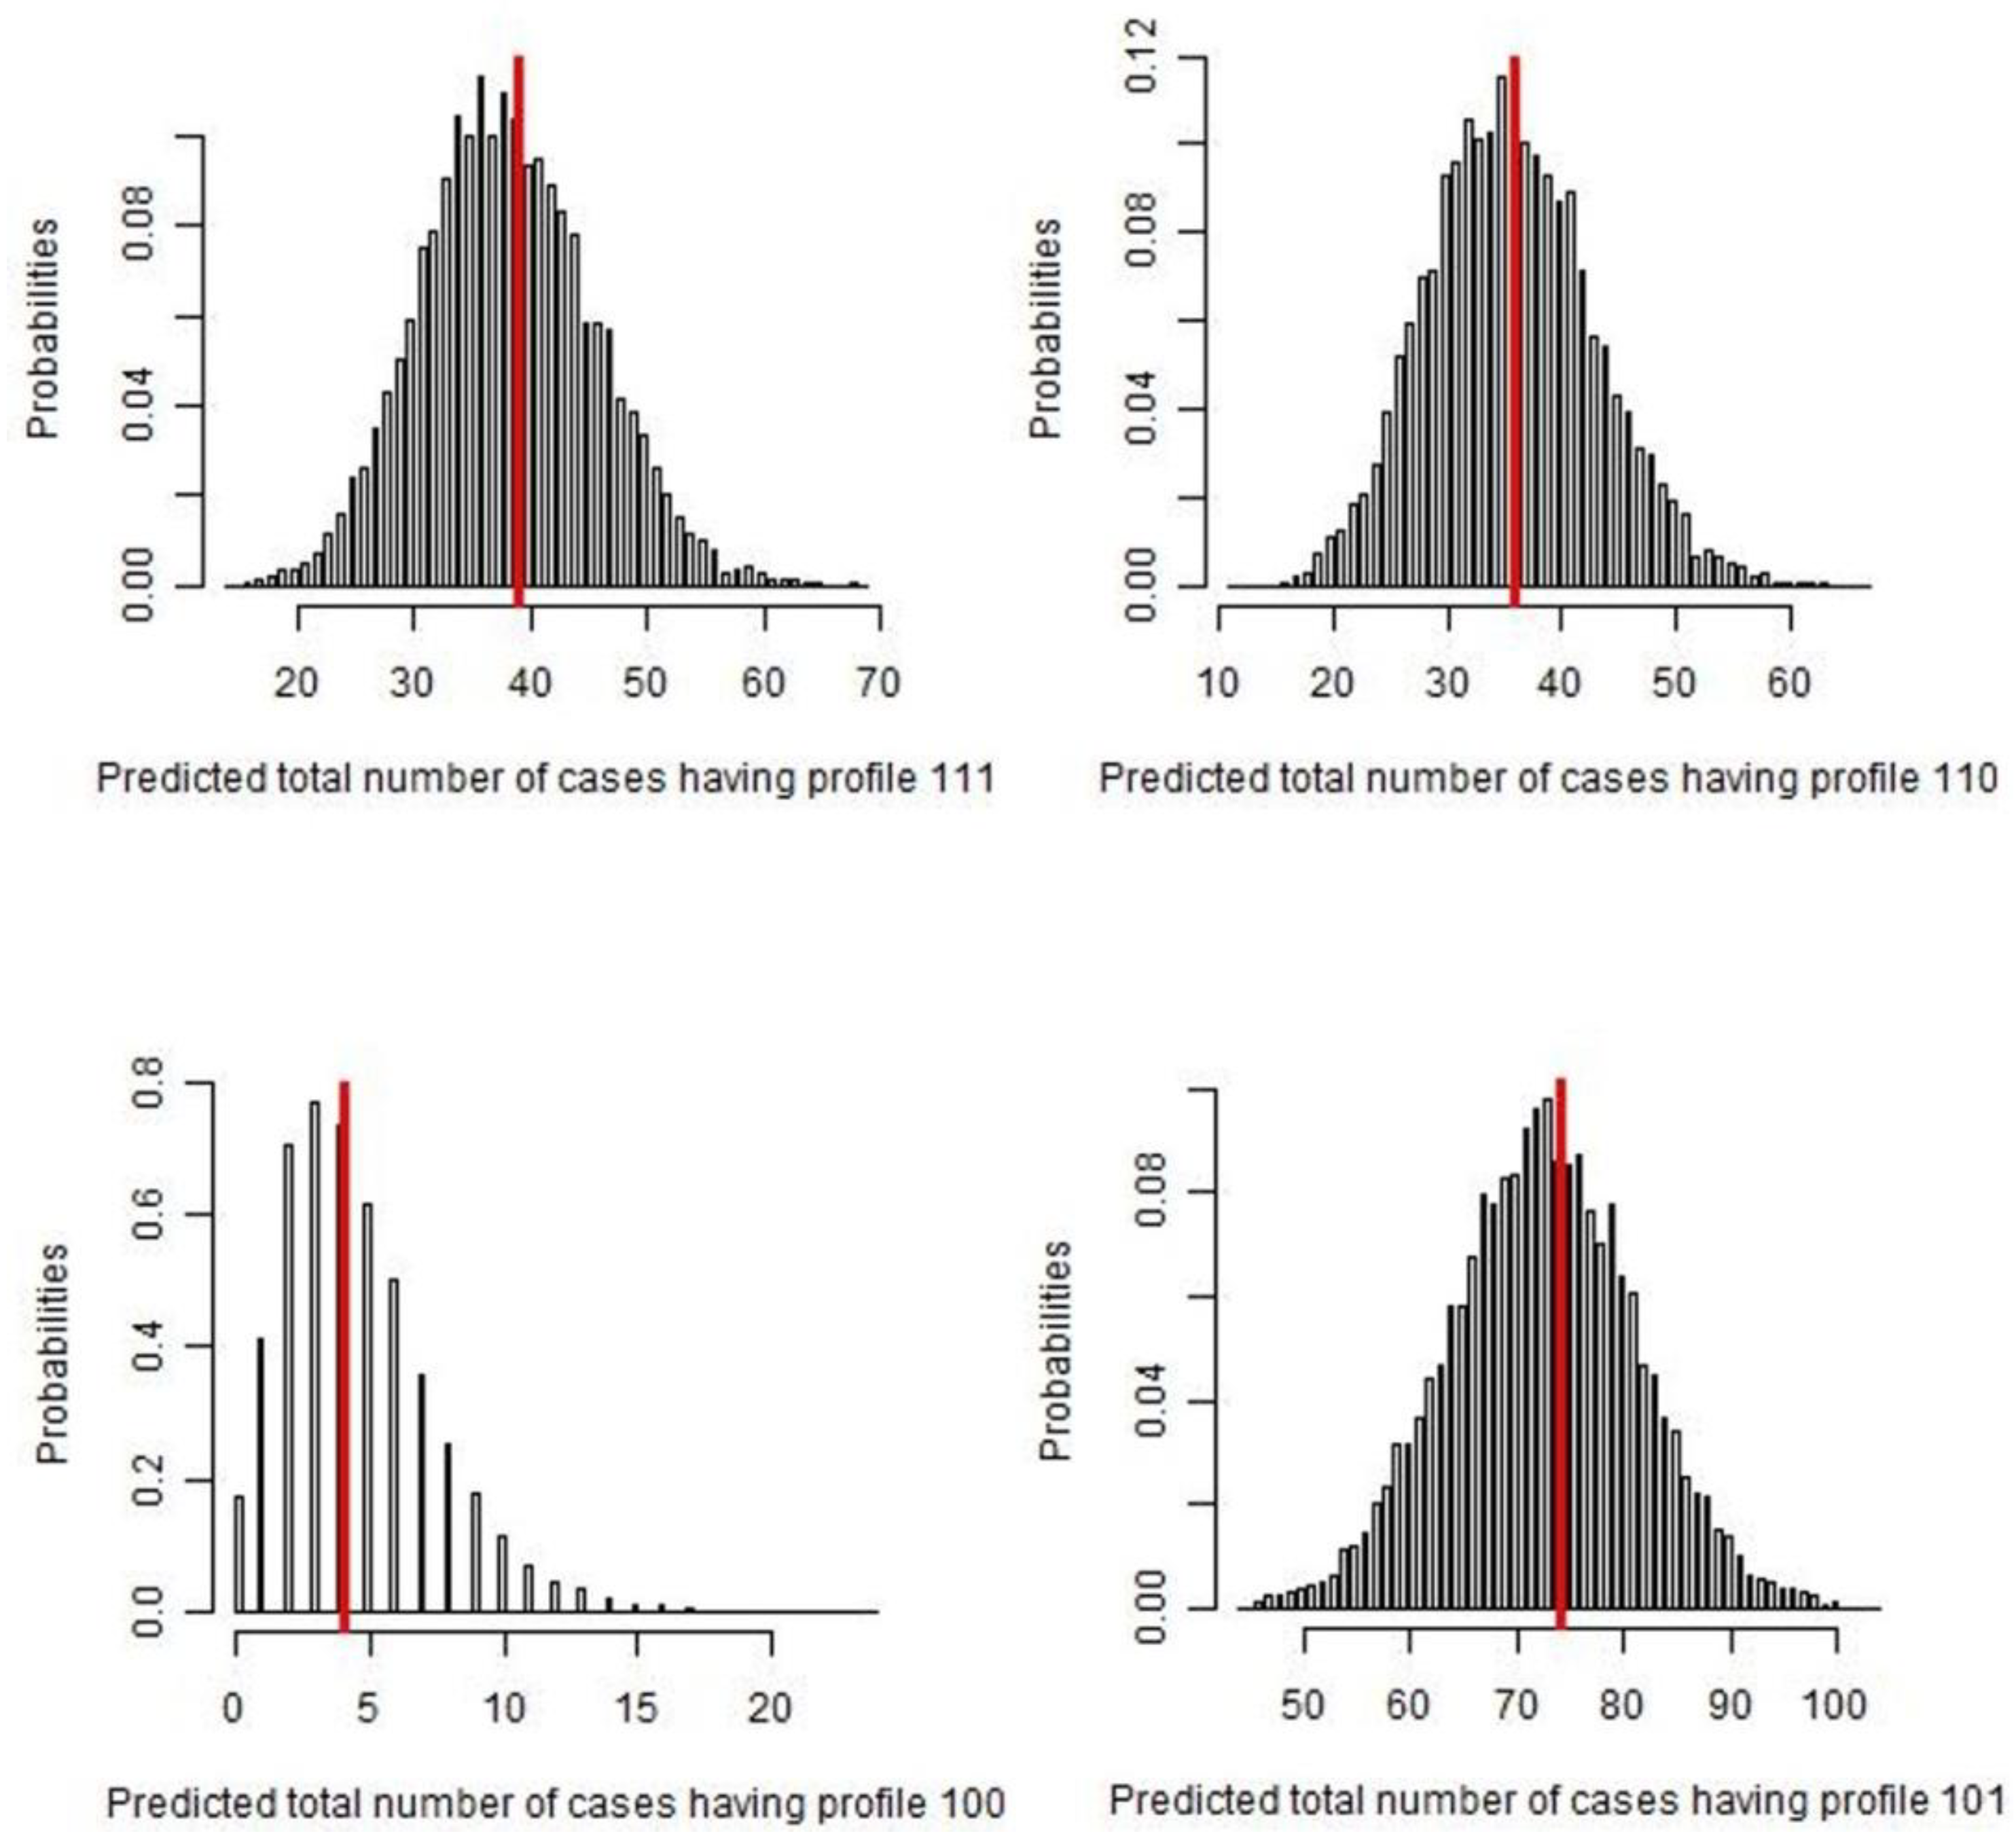
2. Results
3. Discussion
4. Materials and Methods
4.1. Sample Collection
4.2. Gross Pathology (GP)
4.3. Histopathology (H)
4.4. Molecular Analysis (MA)
4.5. Bayesian Latent Class Analysis
5. Conclusions
Author Contributions
Funding
Acknowledgments
Conflicts of Interest
References
- Deplazes, P.; Rinaldi, L.; Alvarez Rojas, C.A.; Torgerson, P.R.; Harandi, M.F.; Romig, T.; Antolova, D.; Schurer, J.M.; Lahmar, S.; Cringoli, G.; et al. Global distribution of alveolar and cystic echinococcosis. Adv. Parasitol. 2017, 95, 315–493. [Google Scholar] [PubMed] [Green Version]
- Schwabe, C.W. Current status of hydatid disease: A zoonosis of increasing importance. In The Biology of Echinococcus and Hydatid Disease; Thompson, R.C.A., Ed.; George Allen & Unwin: Crows Nest, NSW, Australia, 1986; pp. 81–113. [Google Scholar]
- Brunetti, E.; Kern, P.; Vuitton, D.A.W.P. Wrighting panel for the W.-I. Expert consensus for the diagnosis and treatment of cystic and alveolar echinococcosis in humans. Acta Trop. 2010, 114, 1–16. [Google Scholar] [CrossRef] [PubMed]
- Craig, P.; Mastin, A.; van Kesteren, F.; Boufana, B. Echinococcus granulosus: Epidemiology and state-of-the-art of diagnostics in animals. Vet. Parasitol. 2015, 213, 132–148. [Google Scholar] [CrossRef] [PubMed] [Green Version]
- McManus, D.P. Immunodiagnosis of sheep infections with Echinococcus granulosus: In 35 years where have we come? Parasite Immunol. 2014, 36, 125–130. [Google Scholar] [CrossRef] [PubMed]
- Dore, F.; Varcasia, A.; Pipia, A.P.; Sanna, G.; Pinna Parpaglia, M.L.; Corda, A.; Romig, T.; Scala, A. Ultrasound as a monitoring tool for cystic echinococcosis in sheep. Vet. Parasitol. 2014, 203, 59–64. [Google Scholar] [CrossRef]
- Lightowlers, M.W.; Jensen, O.; Fernandez, E.; Iriarte, J.A.; Woollard, D.J.; Gauci, C.G.; Jenkins, D.J.; Heath, D.D. Vaccination trials in Australia and Argentina confirm the effectiveness of the EG95 hydatid vaccine in sheep. Int. J. Parasitol. 1999, 29, 531–534. [Google Scholar] [CrossRef]
- Eckert, J.; Gemmell, M.A.; Meslin, F.-X.; Pawłowski, Z.S. World Health Organization World Organisation for Animal Health. In WHO/OIE Manual on Echinococcosis in Humans and Animals: A Public Health Problem of Global Concern; Eckert, J., Ed.; WHO: Geneva, Switzerland, 2001. [Google Scholar]
- Terrestrial Manual: OIE—World Organisation for Animal Health. Available online: https://www.oie.int/standard-setting/terrestrial-manual/ (accessed on 15 April 2020).
- Siles-Lucas, M.; Casulli, A.; Conraths, F.J.; Müller, N. Laboratory Diagnosis of Echinococcus spp. in human patients and infected animals. Adv. Parasitol. 2017, 96, 159–257. [Google Scholar] [CrossRef]
- Hui, S.L.; Walter, S.D. Estimating the error rates of diagnostic tests. Biometrics 1980, 36, 167–171. [Google Scholar] [CrossRef]
- Toft, N.; Jørgensen, E.; Søren, H. Diagnosing diagnostic tests: Evaluating the assumptions underlying the estimation of sensitivity and specificity in the absence of a gold standard. Prev. Vet. Med. 2005, 68, 19–33. [Google Scholar] [CrossRef]
- Rapsch, C.; Schweizer, G.; Grimm, F.; Kohler, L.; Bauer, C.; Deplazes, P.; Braun, U.; Torgerson, P.R. Estimating the true prevalence of Fasciola hepatica in cattle slaughtered in Switzerland in the absence of an absolute diagnostic test. Int. J. Parasitol. 2006, 36, 1153–1158. [Google Scholar] [CrossRef]
- Baughman, A.L.; Bisgard, K.M.; Cortese, M.M.; Thompson, W.W.; Sanden, G.N.; Strebel, P.M. Utility of composite reference standards and latent class analysis in evaluating the clinical accuracy of diagnostic tests for pertussis. Clin. Vaccine Immunol. 2008, 15, 106–114. [Google Scholar] [CrossRef] [PubMed] [Green Version]
- Limmathurotsakul, D.; Jamsen, K.; Arayawichanont, A.; Simpson, J.A.; White, L.J.; Lee, S.J.; Wuthiekanun, V.; Chantratita, N.; Cheng, A.; Day, N.P.J.; et al. Defining the true sensitivity of culture for the diagnosis of melioidosis using bayesian latent class models. PLoS ONE 2010, 5, e12485. [Google Scholar] [CrossRef] [PubMed]
- Hartnack, S.; Budke, C.M.; Craig, P.S.; Jiamin, Q.; Boufana, B.; Campos-Ponce, M.; Torgerson, P.R. Latent-class methods to evaluate diagnostics tests for echinococcus infections in dogs. PLoS Negl. Trop. Dis. 2013, 7, e2068. [Google Scholar] [CrossRef] [PubMed]
- Wahlströ, H.; Comin, A.; Deplazes, P. Detection of Echinococcus multilocularis by MC-PCR: Evaluation of diagnostic sensitivity and specificity without gold standard. Infect. Ecol. Epidemiol. 2016, 6, 30173. [Google Scholar] [CrossRef]
- Maas, M.; VanRoon, A.; Dam-Deisz, C.; Opsteegh, M.; Massolo, A.; Deksne, G.; Teunis, P.; van der Giessen, J. Evaluation by latent class analysis of a magnetic capture based DNAextraction followed by real-time qPCR as a new diagnostic method for detection of Echinococcus multilocularis in definitive hosts. Vet. Parasitol. 2016, 230, 20–24. [Google Scholar] [CrossRef]
- Otero-Abad, B.; Armua-Fernandez, M.T.; Deplazes, P.; Torgerson, P.R.; Hartnack, S. Latent class models for Echinococcus multilocularis diagnosis in foxes in Switzerland in the absence of a gold standard. Parasit. Vectors 2017, 10, 612. [Google Scholar] [CrossRef]
- Zhang, W.; McManus, D.P. Recent advances in the immunology and diagnosis of echinococcosis. FEMS Immunol. Med. Microbiol. 2006, 47, 24–41. [Google Scholar] [CrossRef] [Green Version]
- Gatti, A.; Alvarez, A.R.; Araya, D.; Mancini, S.; Herrero, E.; Santillan, G.; Larrieu, E. Ovine echinococcosis. Vet. Parasitol. 2007, 143, 112–121. [Google Scholar] [CrossRef]
- Joseph, L.; Gyorkos, T.W.; Coupal, L. Bayesian estimation of disease prevalence and the parameters of diagnostic tests in the absence of a gold standard. Am. J. Epidemiol. 1995, 141, 263–272. [Google Scholar] [CrossRef]
- Kul, O.; Yildiz, K. Multivesicular cysts in cattle: Characterisation of unusual hydatid cyst morphology caused by Echinococcus granulosus. Vet. Parasitol. 2010, 170, 162–166. [Google Scholar] [CrossRef]
- Singh, B.B.; Sharma, R.; Sharma, J.K.; Mahajan, V.; Gill, J.P.S. Histopathological changes associated with E. granulosus echinococcosis in food producing animals in Punjab (India). J. Parasit. Dis. 2016, 40, 997–1000. [Google Scholar] [CrossRef] [Green Version]
- Barnes, T.S.; Hinds, L.A.; Jenkins, D.J.; Bielefeldt-Ohmann, H.; Lightowlers, M.W.; Coleman, G.T. Comparative pathology of pulmonary hydatid cysts in macropods and sheep. J. Comp. Pathol. 2011, 144, 113–122. [Google Scholar] [CrossRef] [PubMed]
- Beigh, A.B.; Darzi, M.M.; Bashir, S.; Kashani, B.; Shah, A.; Shah, S.A. Gross and histopathological alterations associated with cystic echinococcosis in small ruminants. J. Parasit. Dis. 2017, 41, 1028–1033. [Google Scholar] [CrossRef] [PubMed]
- Zhang, W.; Li, J.; You, H.; Zhang, Z.; Turson, G.; Loukas, A.; McManus, D.P. Short report: Echinococcus granulosus from Xinjiang, PR CHINA: cDNAS encoding the EG95 vaccine antigen are expressed in different life cycle stages and are conserved in the oncosphere. Am. J. Trop. Med. Hyg. 2003, 68, 40–43. [Google Scholar] [CrossRef] [Green Version]
- Huang, L.; Appleton, J.A. Eosinophils in helminth infection: Defenders and dupes. Trends Parasitol. 2016, 32, 798–807. [Google Scholar] [CrossRef] [PubMed] [Green Version]
- Kidane, D.; Chae, W.J.; Czochor, J.; Eckert, K.A.; Glazer, P.M.; Bothwell, A.L.M.; Sweasy, J.B. Interplay between DNA repair and inflammation, and the link to cancer. Crit. Rev. Biochem. Mol. Biol. 2014, 49, 116–139. [Google Scholar] [CrossRef] [PubMed]
- Yamasaki, H.; Nagase, T.; Kiyoshige, Y.; Suzuki, M.; Nakaya, K.; Itoh, Y.; Sako, Y.; Nakao, M.; Ito, A. A case of intramuscular cysticercosis diagnosed definitively by mitochondrial DNA analysis of extremely calcified cysts. Parasitol. Int. 2006, 55, 127–130. [Google Scholar] [CrossRef]
- Figueiredo, B.N.S.; Libório, R.A.; Sato, M.; da Silva, C.F.; Pereira-Junior, R.A.; Chigusa, Y.; Kawai, S.; Sato, M.O. Occurrence of bovine cysticercosis in two regions of the state of Tocantins-Brazil and the importance of pathogen identification. Pathogens 2019, 8, 66. [Google Scholar] [CrossRef] [Green Version]
- Bonelli, P.; Giudici, S.D.; Peruzzu, A.; Piseddu, T.; Santucciu, C.; Masu, G.; Mastrandrea, S.; Delogu, M.L.; Masala, G. Genetic diversity of Echinococcus granulosus sensu stricto in Sardinia (Italy). Parasitol. Int. 2020, 77, 102120. [Google Scholar] [CrossRef]
- Box, E.P.; Hunter, W.G.; Hunter, J.S. Statistics for Experimenters: An Introduction to Design, Data Analysis, and Model Building; John Wiley & Sons: Hoboken, NJ, USA, 1978. [Google Scholar]
- Yeh, A. More accurate tests Ibr the statistical significance of result differences. In Proceedings of the 18th International Conference on Computational Linguistics (COLING 2000), Saarbrücken, Germany, 31 July–4 August 2000. [Google Scholar]
- Walter, S.D.; Irwig, L.M. Estimation of test error rates, disease prevalence and relative risk from misclassified data: A review. J. Clin. Epidemiol. 1988, 41, 923–937. [Google Scholar] [CrossRef]
- Qu, Y.; Tan, M.; Kutner, M.H. Random effects models in latent class analysis for evaluating accuracy of diagnostic. Biometrics 1996, 52, 797–810. [Google Scholar] [CrossRef] [PubMed]
- Plummer, M.; Stukalov, A.D.M. Bayesian Graphical Models Using MCMC. Available online: https://cran.r-project.org/web/packages/rjags/rjags.pdf (accessed on 27 July 2020).
- Brooks, S.P.; Gelman, A. General Methods for Monitoring Convergence of Iterative Simulations. J. Comput. Gr. Stat. 1998, 7, 434–455. [Google Scholar]

| Diagnostic Methods | Frequencies (Number of Samples) | ||
|---|---|---|---|
| GP | H | MA | |
| Positive | Positive | Positive | 39 |
| Positive | Negative | Positive | 2 |
| Positive | Positive | Negative | 36 |
| Negative | Positive | Positive | 0 |
| Positive | Negative | Negative | 4 |
| Negative | Negative | Positive | 1 * |
| Negative | Positive | Negative | 0 * |
| Negative | Negative | Negative | 74 * |
| Diagnostic Methods | Hydatid Cysts | |||
|---|---|---|---|---|
| Fertile | Non Fertile | Transitional | Inactive | |
| GP | 100 (16/16) | 100 (21/21) | 100 (22/22) | 95.6 (22/23) |
| H | 100 (16/16) | 95.2 (20/21) | 95.2 (21/22) | 82.6 (19/23) |
| MA | 100 (16/16) | 52.4 * (11/21) | 42.8 * (10/22) | 13 * (3/23) |
| Diagnostic Accuracy Measures | Diagnostic Methods | ||
|---|---|---|---|
| GP | H | MA | |
| Se | 99.7 (96.7–99.8) | 94.7 (87.3–99.2) | 51.8 (40.8–62.8) |
| Sp | 97.5 (90.3–99.8) | 1 § | 98.4 (93.8–99.9) |
| PPV | 97.6 (90.5–100) | 1 § | 97.2 (89.1–99.8) |
| NPV | 99.7 (96.5–100) | 94.8 (87.2–99.3) | 66.6 (56.9–74.7) |
© 2020 by the authors. Licensee MDPI, Basel, Switzerland. This article is an open access article distributed under the terms and conditions of the Creative Commons Attribution (CC BY) license (http://creativecommons.org/licenses/by/4.0/).
Share and Cite
Bonelli, P.; Loi, F.; Cancedda, M.G.; Peruzzu, A.; Antuofermo, E.; Pintore, E.; Piseddu, T.; Garippa, G.; Masala, G. Bayesian Analysis of Three Methods for Diagnosis of Cystic Echinococcosis in Sheep. Pathogens 2020, 9, 796. https://doi.org/10.3390/pathogens9100796
Bonelli P, Loi F, Cancedda MG, Peruzzu A, Antuofermo E, Pintore E, Piseddu T, Garippa G, Masala G. Bayesian Analysis of Three Methods for Diagnosis of Cystic Echinococcosis in Sheep. Pathogens. 2020; 9(10):796. https://doi.org/10.3390/pathogens9100796
Chicago/Turabian StyleBonelli, Piero, Federica Loi, Maria Giovanna Cancedda, Angela Peruzzu, Elisabetta Antuofermo, Elisabetta Pintore, Toni Piseddu, Giovanni Garippa, and Giovanna Masala. 2020. "Bayesian Analysis of Three Methods for Diagnosis of Cystic Echinococcosis in Sheep" Pathogens 9, no. 10: 796. https://doi.org/10.3390/pathogens9100796
APA StyleBonelli, P., Loi, F., Cancedda, M. G., Peruzzu, A., Antuofermo, E., Pintore, E., Piseddu, T., Garippa, G., & Masala, G. (2020). Bayesian Analysis of Three Methods for Diagnosis of Cystic Echinococcosis in Sheep. Pathogens, 9(10), 796. https://doi.org/10.3390/pathogens9100796