Article

Changes in Antioxidant System during Grain Development of Wheat (Triticum aestivum L.) and Relationship with Protein Composition under FHB Stress

1
Agricultural Institute Osijek, Osijek, Juzno Predgradje 17, 31000 Osijek, Croatia
2
Department of Food Technology, University Centre Koprivnica, University North, Trg dr. Žarka Dolinara 1, HR-48000 Koprivnica, Croatia
*
Author to whom correspondence should be addressed.
Pathogens 2020, 9(1), 17; https://doi.org/10.3390/pathogens9010017
Submission received: 11 November 2019 / Revised: 11 December 2019 / Accepted: 20 December 2019 / Published: 23 December 2019

Abstract

:
Fusarium head blight (FHB) is found in both temperate and semi-tropical regions and causes losses in wheat (Triticum aestivum L.) resulting in reduced yield, deteriorated grain quality, and contamination of the grains with mycotoxins, primarily deoxynivalenol (DON). In this study, we focused on the identification of protein components in Fusarium-inoculated and non-inoculated wheat samples along with the major antioxidant enzymes that Fusarium can encounter during FHB infection process in six winter wheat varieties when FHB symptoms started to occur. Our hypothesis was that wheat antioxidants and H2O2 may play a role against Fusarium infections, consequently preserving protein grain components. Results showed that in more resistant varieties (Olimpija and Vulkan) DON content of inoculated flour was less accumulated and thus the major gluten network was not significantly attacked by Fusarium spp. The maximum increase in guaiacol peroxidase (POD) activity in response to FHB treatment was detected in the FHB-resistant varieties Olimpija and Vulkan, while the lowest increase in H2O2 content was detected in the FHB-susceptible variety Golubica. A particular reduction in the content of both total glutenin and high-molecular-weight glutenin subunits was detected in susceptible wheat varieties after serious artificial infection, along with increased DON accumulation. The defense mechanism in wheat varieties differed, where resistant varieties’ protein composition depended on POD activity as a detoxification agent.

1. Introduction

Fusarium head blight (FHB) is one of the most dangerous fungal diseases of wheat. It can cause serious epidemics worldwide. Due to the importance of wheat product consumption, understanding the impact of Fusarium infestation on grain characteristics is essential. Fusarium infection leads to an incomplete accumulation of grain constituents through mechanical blocking of vascular bundles by mycelium [1] or impaired synthesis of grain components due to the presence of mycotoxins [2]. Although FHB results in quality reductions and yield losses, the major concern for human and animal consumption is the contamination of grains with harmful mycotoxins, including deoxynivalenol (DON), which is the most abundant out of the regulated mycotoxins. The European Union has established maximum levels for DON (Commission Regulation (EC) No. 1881/2006), where unprocessed wheat, cereal flour, bread, and wheat-based foods for infants and young children must not contain more than 1250, 750, 500, and 200 μg kg−1 of DON, respectively. DON is known to cause food refusal, vomiting, and depressed immune function resulting in poor weight gain [3]. Furthermore, DON can weaken the immune system of the plants giving the Fusarium spp. easier access to nutrients [4]. Usually Fusarium symptoms on plants and DON concentrations are very well correlated. The most effective measure to control FHB and reduce mycotoxin contamination is the improvement of resistance to disease and mycotoxin accumulation [5], together with appropriate agronomic practices. Two major types of resistance have been classified for wheat, which includes type I, resistance to initial infection [6], and type II, resistance to spread of symptoms [6]. Further types or components of FHB resistance have been described [7], including resistance to kernel infection, tolerance to yield loss, and resistance to mycotoxin accumulation.
Environmental stress affects plant development and triggers different morphological, physiological, biochemical, and molecular changes in plants. Cells can tolerate a small to moderate amount of oxidative stress by producing non-enzymatic antioxidant molecules and activating enzymes to counteract excess reactive oxygen species (ROS) [8] whose generation is one of the most common plant responses to different stresses [9]. ROS have a dual role as toxic compounds and regulators of antioxidant defense through the ascorbate–glutathione pathway (Halliwell–Asada cycle). Beside the enzymatic part of antioxidative defense, phenolics are considered to be the major contributors to the total antioxidant capacity of cereal grains [10,11] that could play a role in the inhibition of Fusarium species and reduction of fungal growth and mycotoxin accumulation.
FHB affects the grain protein content [12] by destroying starch granules, storage proteins, and cell walls and consequently decreases the quality of dough properties. Wheat grain quality is a complex trait determined by the total protein concentration and its composition. In grains, there are two groups of proteins, glutenins (GLU) and gliadins (GLI), which are also major components of gluten. These groups can also be separated based on their molecular weight (ω-, α-, and γ-gliadins; high-molecular-weight (HMW) and low-molecular-weight (LMW) glutenins). These two groups make up 80%–85% of total protein in mature wheat grains. The most important indicators for determining dough elasticity are the HMW glutenin subunits (HMW-GS), which are positively correlated with bread-making quality [13]. Both GLI and GLU can be considerably degraded by Fusarium infection [14].
Therefore, the aims of this study were (i) to determine enzymatic and non-enzymatic components of antioxidative defense in Fusarium-inoculated and non-inoculated ears of six wheat varieties when first FHB symptoms occurred and (ii) to evaluate the potential protective effects of antioxidant defense toward Fusarium and consequently DON accumulation and changes in protein components, which can be declared as novel FHB-resistant components [15].

2. Results and Discussion

In order to extend our knowledge about information on different antioxidant system alterations caused by infection with one of the most important wheat pathogens, we analyzed changes in the activity of antioxidant enzymes and non-enzymatic components involved in defense response when the first symptoms of FHB occurred. Furthermore, we focused specifically on the most toxic and widespread trichothecene DON, which could be the cause of wheat quality reduction by disrupting the normal function of mitochondria and generating ROS [16]. In addition, we tracked the changes in final protein composition in grains responsible for baking quality.

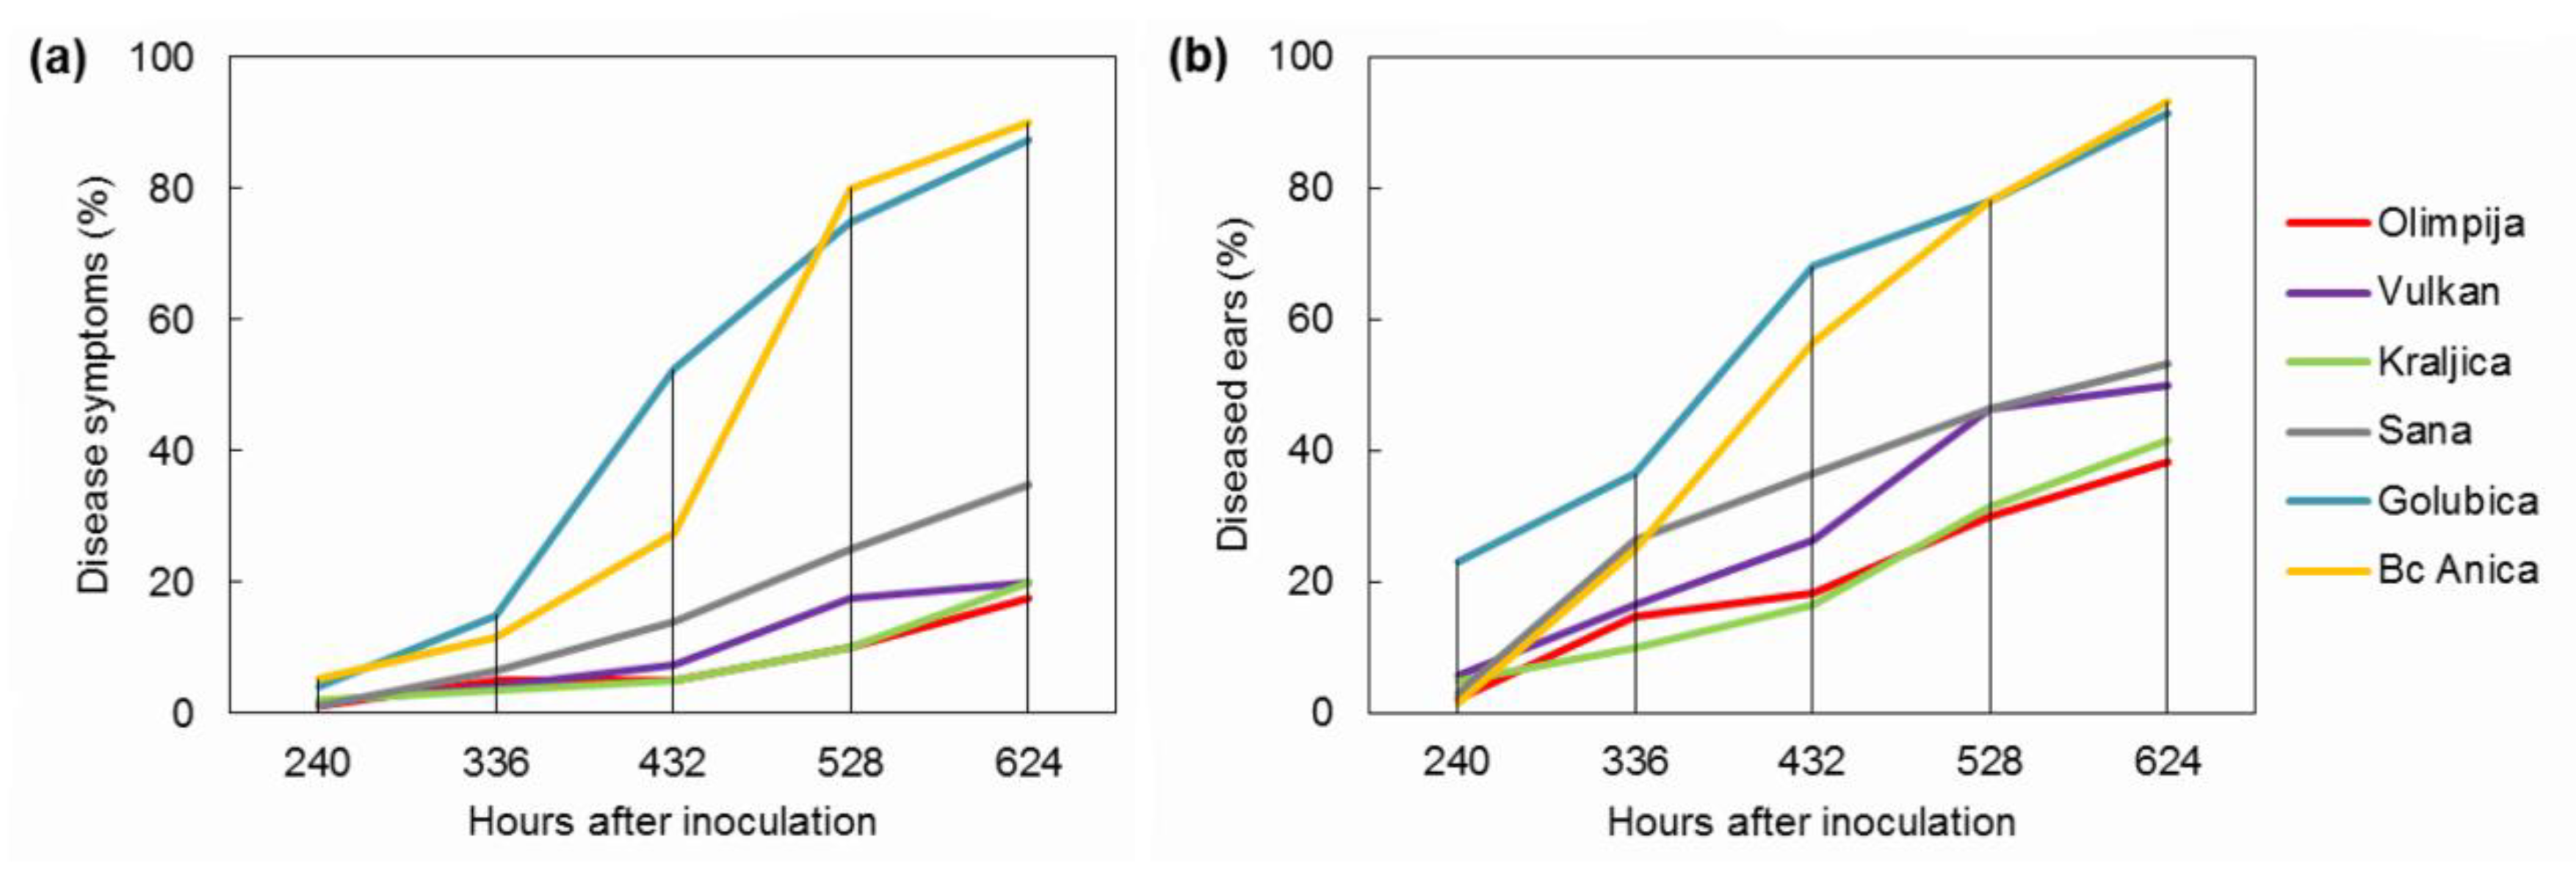
2.1. FHB Severity and Incidence

Disease symptoms for the calculation of the area under the disease progress curve (AUDPC) for general resistance started to increase at 10 days after infection (dai), when disease severity for varieties Olimpija, Vulkan, Kraljica, Sana, Golubica, and Bc Anica was 1.25%, 1.75%, 2.0%, 1.25%, 4.25%, and 5.25%, respectively. In the last assessment (624 h after inoculation, hai), the variety Bc Anica had up to 90% Fusarium symptoms (Figure 1a). In varieties Golubica and Bc Anica, AUDPC for disease severity was much higher (430.0 and 358.3, respectively), compared with varieties Olimpija and Kraljica, which had less sporulation on the inoculated ears (Table 1). The variety Olimpija had the lowest AUDPC for general resistance (72.5). Olimpija and Kraljica also showed the best resistance against pathogen penetration (AUDPC for type I resistance = 199.9 and 199.1, respectively). First symptoms of the initial infection were visible at 10 dai, when they started to increase up to 38.3% (Olimpija), 49.9% (Vulkan), 41.7% (Kraljica), 53.3% (Sana), 91.7% (Golubica), and 93.3% (Bc Anica) (Figure 1b). These data had already been published for Vulkan, Kraljica, Olimpija, and Golubica in the previous research of Spanic et al. [16], but the present study is used to make additional conclusions. No FHB symptoms were found in the non-inoculated plots. Although Olimpija showed the least FHB symptoms, Vulkan, as the resistant variety, had the lowest amount of DON (Table 1). This could be due to higher resistance to mycotoxin accumulation, a component of FHB resistance [7].

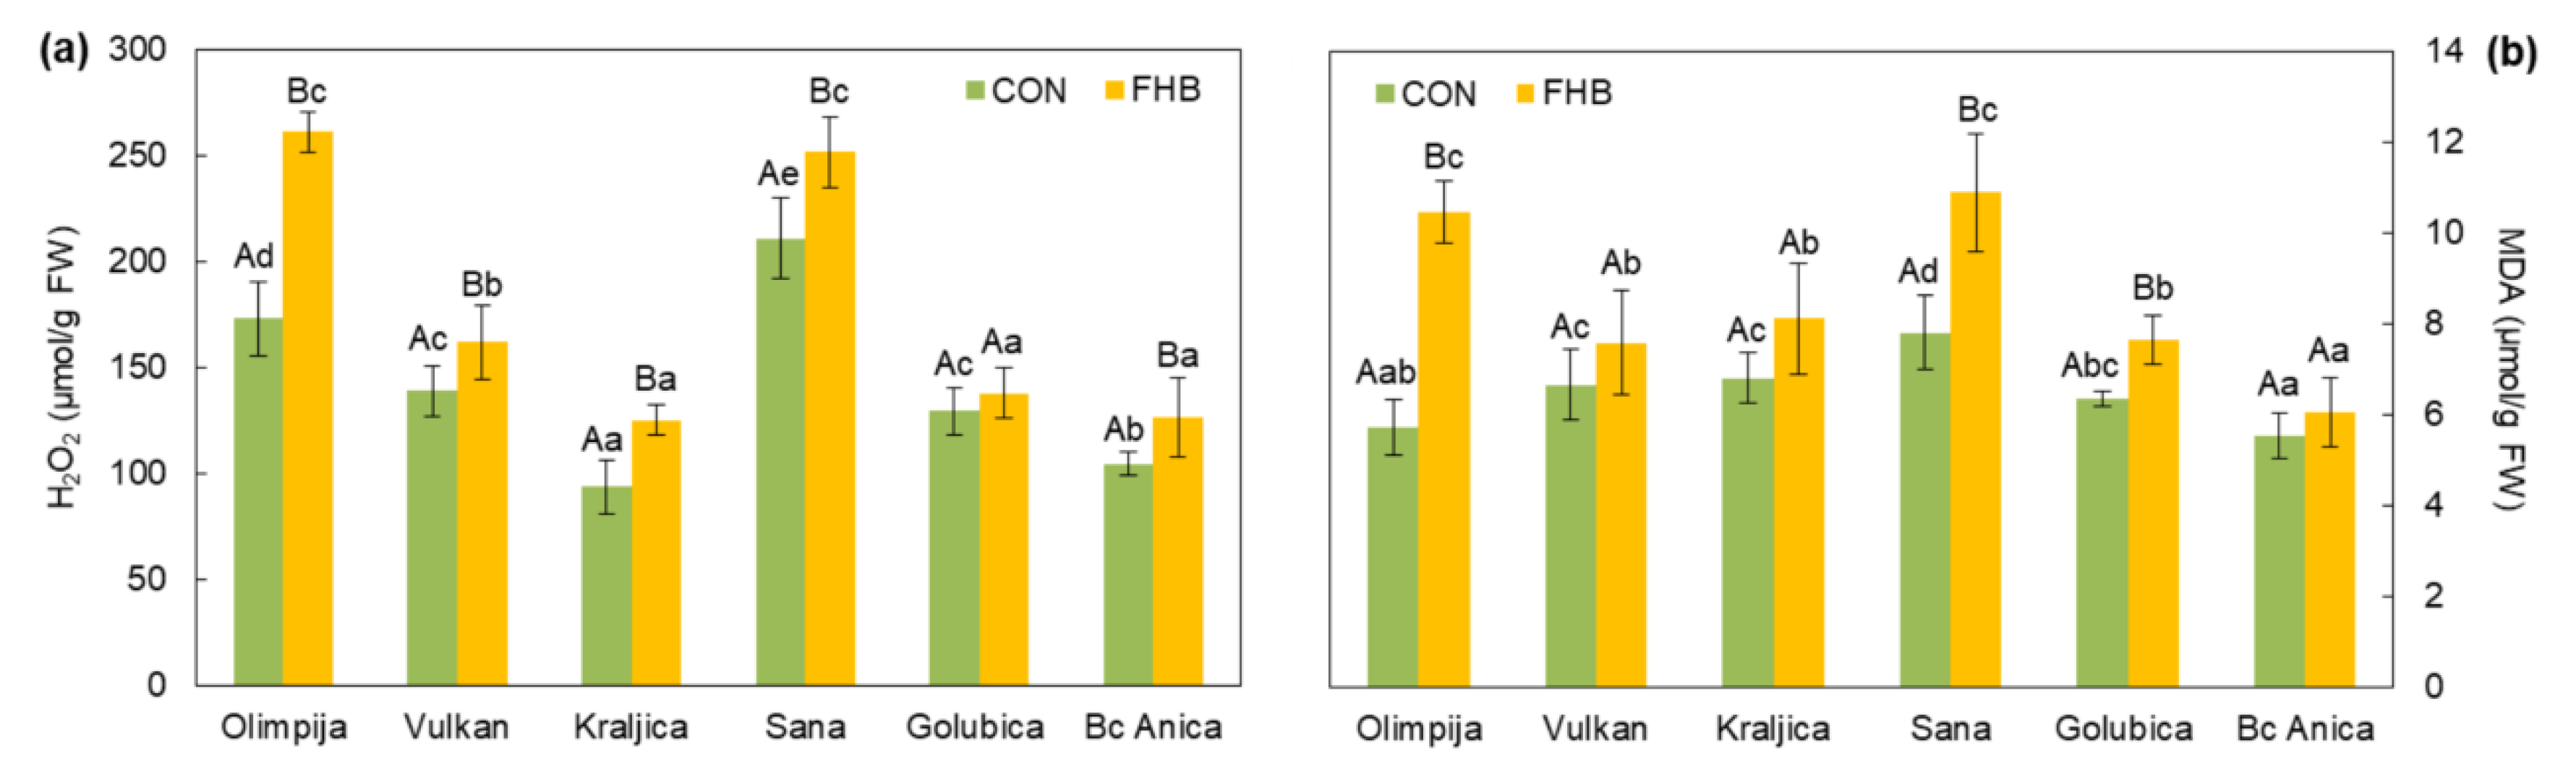
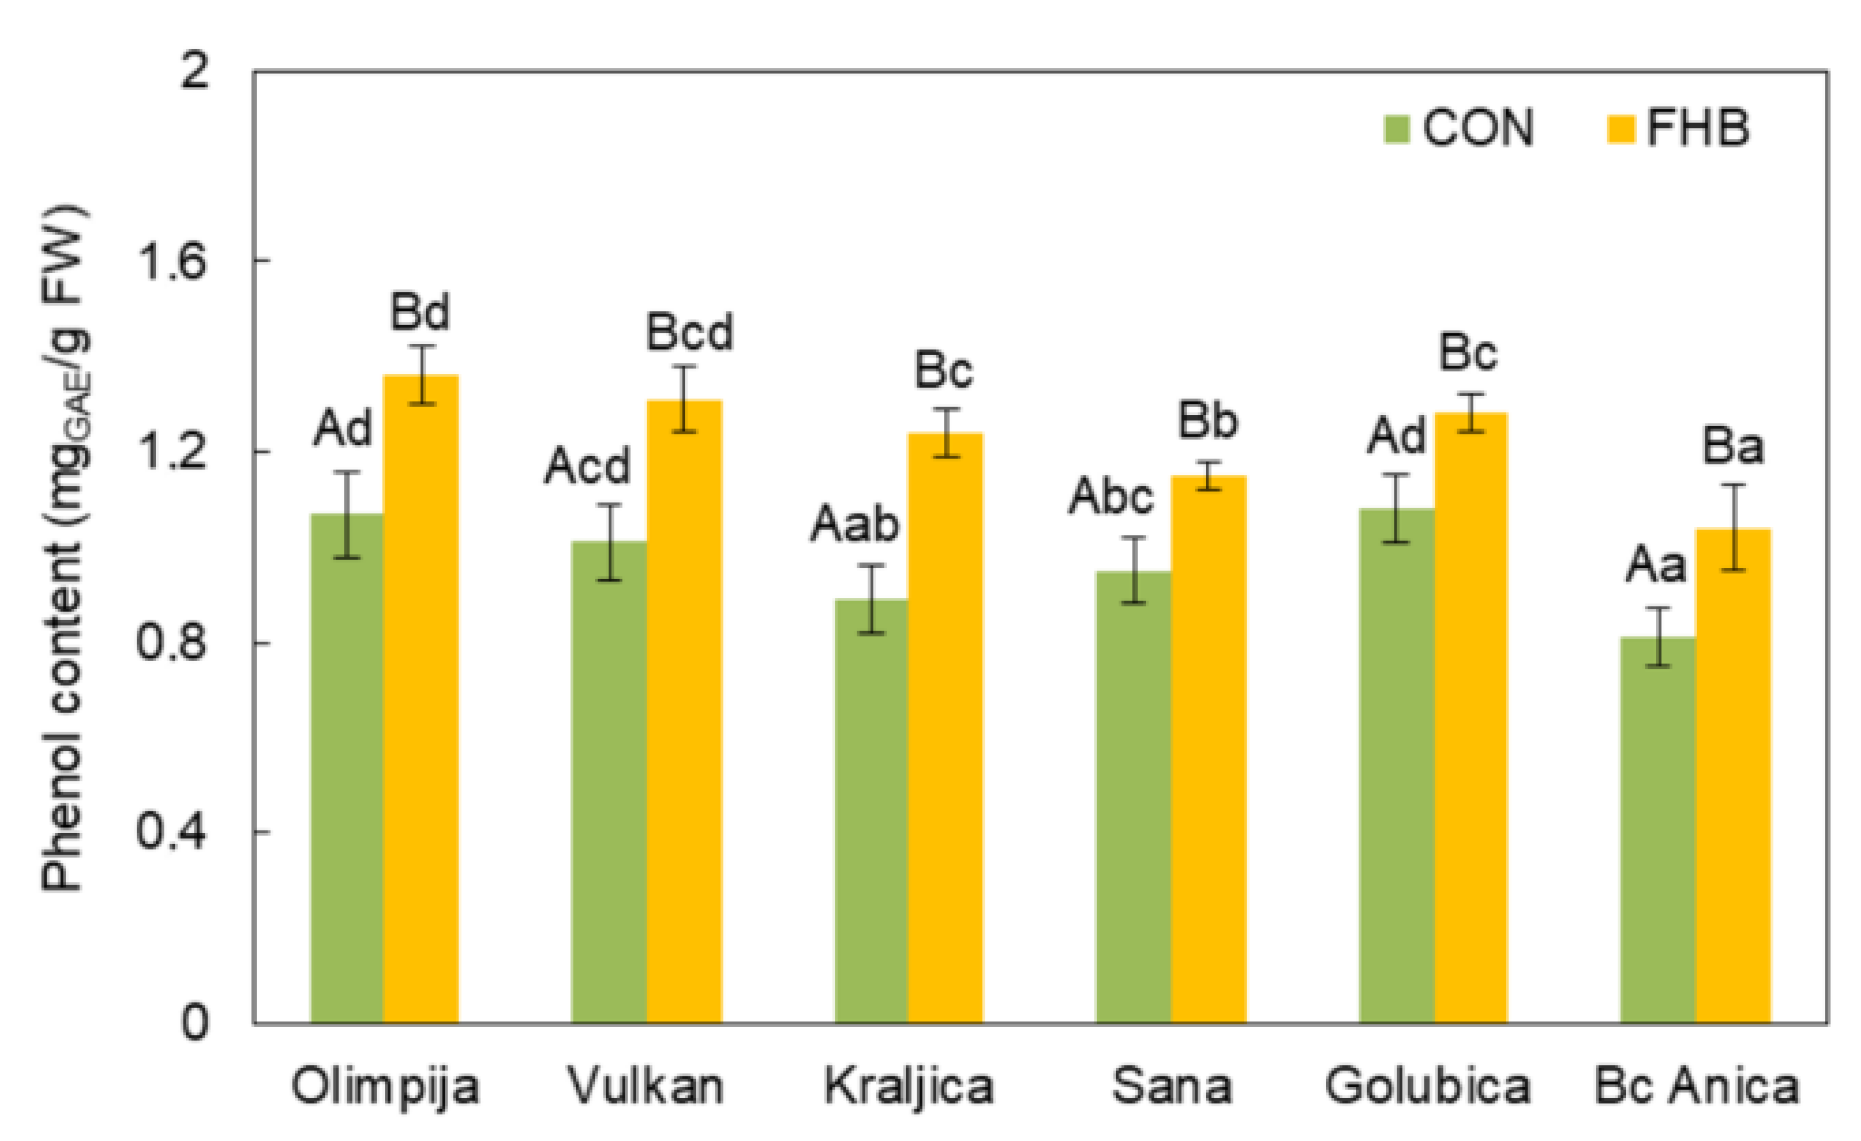
2.2. Enzymatic and Non-Enzymatic Components of Antioxidant Defense System

An analysis of variance revealed wide variations for the variety and treatment effects for guaiacol peroxidase (POD), ascorbate peroxidase (APX), catalase (CAT), and polyphenol oxidase (PPO) activity, as well as for hydrogen peroxide (H2O2), malondialdehyde (MDA), and phenol accumulation, except between varieties for CAT. Interactions were significant for all enzyme activities and non-enzymatic components parameters, except between variety by treatment interaction for phenols (Table 2).
In the present study, the varieties Olimpija, Vulkan, and Golubica had significantly lower CAT values in the inoculated plants, compared to non-inoculated plants (Figure 2).
The activity of APX increased with the appearance of symptoms in Kraljica, Golubica, and Bc Anica in inoculated plants, compared to non-inoculated plants, while APX activity declined in Olimpija in inoculated FHB plants, compared to non-inoculated plants (Figure 2).
An increase in POD activity, in response to Fusarium inoculation, compared to non-inoculated plants, was detected in all varieties, except Sana (Figure 2). During the stage of post-infection, inoculated ear tissues of the resistant variety Vulkan and the susceptible variety Golubica showed significantly higher PPO activity, compared to non-inoculated ears (Figure 2).
An increase in H2O2 was observed in both resistant and susceptible varieties, except Golubica, after Fusarium inoculation (Figure 3). In a study by Audenaert et al. [4], high DON concentrations were shown to trigger H2O2 evolution. DON was shown to be a virulence factor for Fusarium graminearum infecting wheat by promoting the spreading of the pathogen [17]. The highest H2O2 content among infected plants was found in the ears of the resistant variety Olimpija and the susceptible variety Sana. Peroxide accumulation in resistant Olimpija possibly occurred as an effect of the signaling role of H2O2, whereas in Sana H2O2 overload could be a consequence of deficient functioning of the antioxidant system. The activation of H2O2-mediated defense responses comprising phenols and peroxidases might come too late for susceptible varieties to protect itself against Fusarium in our research.
The susceptible varieties Sana and Golubica and resistant Olimpija showed significantly higher MDA content in inoculated ear tissues, compared to non-inoculated ears (Figure 3). Furthermore, we assumed that DON exposure increased peroxidation and decreased antioxidant activity in susceptible varieties, but in the resistant variety there was probably another mechanism which increased MDA. Yang et al. [18] had already reported about oxidative stress and its important role in the toxicity of trichothecenes. In Olimpija, smaller amount of DON could generate H2O2 that induced lipid peroxidation, which in turn leads to changes in membrane integrity, cellular redox signaling, and antioxidant status.
The decline in CAT activity was correlated with the increase of H2O2 in FHB-resistant varieties (Olimpija and Vulkan) after inoculation with Fusarium. This could be due to a connection with DON resistance, as Olimpija and Vulkan had the lowest amount of DON among other varieties. Mycotoxin contamination is also related to the capacity of plant tissues in reducing mycotoxin accumulation, where host metabolites are able to interfere with mycotoxin biosynthesis [19]. Previously, it was concluded that free phenolic acids are evidently involved in the DON resistance mechanism in maize, whereas their role toward fumonisin contamination was not elucidated under field conditions, implying that components other than phenolic acids may be responsible for this latter type of resistance [20]. In the present investigation, the AUDPC for general resistance showed significant and positive correlation with DON (Spearman’s ρ: 0.83, p < 0.05), where a strong positive correlation was observed with AUDPC for type I resistance (Spearman’s ρ: 0.94, p < 0.01) (Table 3). The selection for reduced FHB symptoms should lead to a correlated selection response in low DON content in grains [21].
On the other hand, Olimpija and Vulkan exhibited high POD activity indicating that POD in those genotypes had a major role in ROS detoxification providing FHB resistance. Similarly, an increase in POD activity was observed in the research of Lanubile et al. [22] in the resistant maize genotype, both for control and inoculated kernels which were inoculated with Fusarium proliferatum, Fusarium subglutinans, and Aspergillus flavus. Contrary to that research, a decrease in CAT was observed in the resistant varieties Olimpija and Vulkan. In a study by Hassanein et al. [23], it was concluded that the host cell under pathogenesis might accelerate the terminal respiratory pathway, which may lead to an increase in CAT activity.
Phenolics are considered to be the major contributors to the total antioxidant capacity of cereal grains. Moreover, it was concluded that they are the most important components in winter wheat resistance to fungal diseases [24]. In the current research, the varieties Golubica and Vulkan exhibited higher PPO activity in Fusarium-inoculated plants compared to non-inoculated plants, despite the presence of increased phenol content in the ears of inoculated plants in all varieties (Figure 4). The accumulation of phenols in the infected tissues might come from the surrounding healthy leaves in order to resist the advancement of the pathogen toward the healthy cells [25]. In addition, total phenols significantly increased in Fusarium-inoculated plants compared to non-inoculated controls, which is in accordance with the research of Hassanein et al. [23] where total phenols increased throughout the experimental period. In a previous research by Spanic et al. [26], it was concluded that FHB-resistant wheat varieties showed rapid induction of ascorbate peroxidase (APX) and polyphenol oxidase (PPO) activity in the early stages after infection (3 hai). This is in accordance with the research of Mohammadi and Kazemi [27] where a 3-fold increase in polyphenol oxidase activity was detected in the resistant wheat varieties after inoculation with F. graminearum compared with the non-inoculated controls. The most susceptible variety (Bc Anica) had the lowest amount of phenol content and PPO activity among other varieties, which indicated the poor effectiveness of non-enzymatic antioxidative components against pathogen attack. Due to the role of polyphenols as secondary plant metabolites that play a role in the protection of plants against pathogens, they were higher in varieties with better preserved protein quality (Olimpija, Vulkan, and Kraljica) (Figure 5). In a previous research by Boyacioǧlu and Hettiarachch [28], infection with F. graminearum decreased the proportion of water-extractable protein (albumin) and storage protein (glutenin) by 33% and 80%, respectively, in infected wheat.
In the current research, there was a significant increase in phenols, POD, and H2O2 for all wheat varieties in the Fusarium-inoculated group compared to non-inoculated plants, except for POD in Sana and H2O2 in Golubica. The lack of significant accumulation of H2O2 in inoculated Golubica plants, compared to non-inoculated plants, could be the reason for the strong decrease in protein quality and high FHB severity. In the research of Spanic et al. [26], it was concluded that in resistant wheat varieties, H2O2 level was higher in the inoculated ears compared to non-inoculated plants in the early stages of disease (24 hai). A similar result was previously reported by Sorahinobar et al. [29]. An increased amount of H2O2 could be toxic to pathogens and can lead to a hypersensitive response of plants resulting in cell death, which will prevent the further spread of pathogens. An increase in APX activity in Fusarium-inoculated Kraljica, Golubica, and Bc Anica plant varieties could not detoxify H2O2, which led to decreased glutenins and HMW subunits. In resistant Olimpija, APX activity decreased in inoculated plants compared to non-inoculated controls, which led us to the conclusion that overall H2O2 was removed by POD rather than APX.

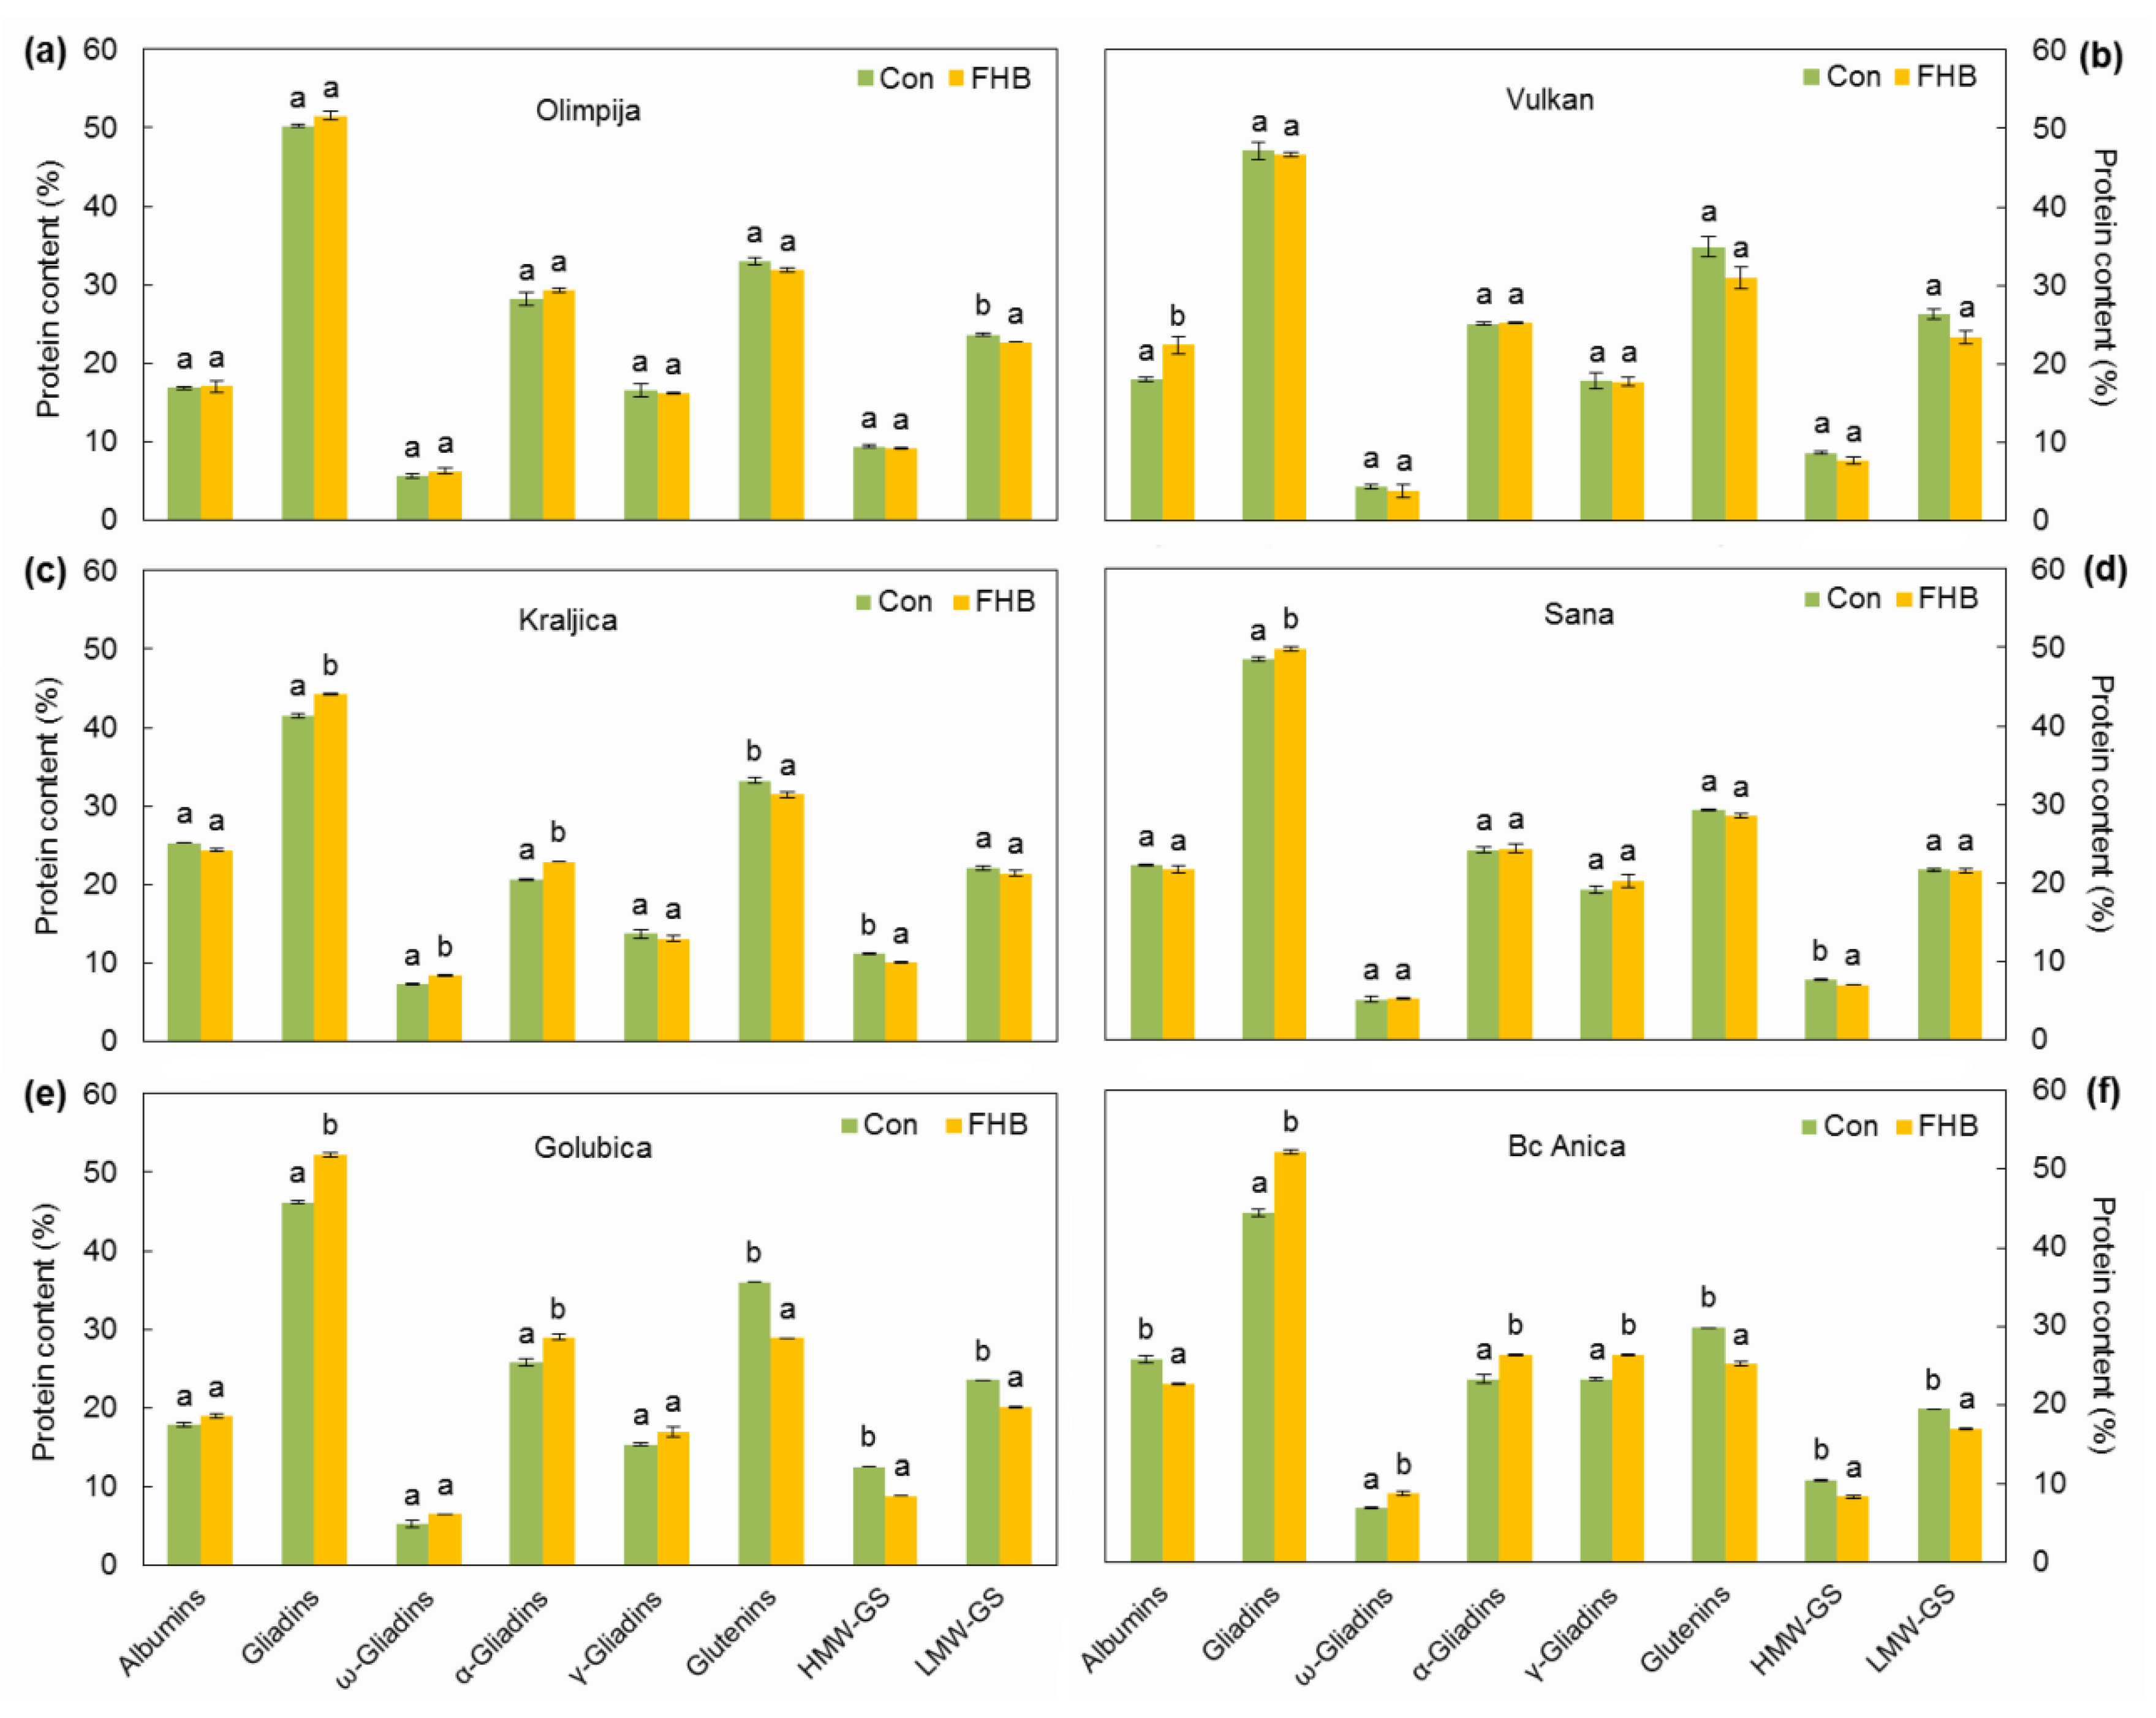
2.3. Protein Composition

Fusarium inoculations did not significantly change the proportion of albumins and globulins in the grain samples of four varieties (Olimpija, Kraljica, Sana, and Golubica), while the proportion was significantly increased up to 24.4% in Vulkan infected with Fusarium compared to non-inoculated plants, in contrast to Bc Anica which decreased the proportion of albumins and globulins up to 12.1% (Figure 5). Albumins and globulins varied from 16.6%–25.8% of total flour protein in both inoculated and non-inoculated plants. The data for protein components in the grain samples had already been published for Vulkan, Kraljica, Olimpija, and Golubica in a previous research [16], but the present study makes additional conclusions.
Gliadin level significantly increased in infected plants compared to non-inoculated plants in four varieties (Kraljica, Sana, Golubica, and Bc Anica). The total gliadin content ranged between 41.3% and 52.5% in both inoculated and non-inoculated plants. In infected Bc Anica plants, ω-, α-, and γ-gliadins were significantly increased compared to non-inoculated plants. A similar increase was observed in infected plants for ω- and α-gliadins in Kraljica and α-gliadins in Golubica (Figure 5). Within the gliadins, the most affected subfractions were ω-gliadins, which were increased up to 26.9% compared to non-inoculated plants. At the same time, there was one variety (Vulkan), in which a decrease of 12% in ω-gliadins was observed. α-Gliadins were increased in all varieties in infected plants compared to non-inoculated controls (up to 13.3%, Bc Anica). A non-significant increase in γ-gliadins was observed in Bc Anica (19.7%), Golubica (10.9%), and Sana (5.7%).
Fusarium infection had a significant effect on the percentage of glutenins, which showed a significant reduction of 5.4%, 15.6%, and 19.9% in Kraljica, Bc Anica, and Golubica, respectively, compared to non-inoculated controls, accompanied by a decrease in HMW subunits (9.9%, 20.3%, and 29.8%, respectively), including Sana (8.8%). These varieties had higher DON accumulation (Table 1). It was previously concluded that quality reduction was a result of contamination by trichothecene mycotoxins produced by Fusarium species [30]. LMW-GS subunits were not as largely affected as HMW-GS, but Olimpija, Golubica, and Bc Anica showed a significant decrease (4.1%, 14.6%, and 12.8%, respectively) (Figure 5).
Out of albumins and globulins, α-amylase/trypsin inhibitors, serpins, and purothionins may serve as nutrient reserves for embryo development or inhibitors of insects and pathogens prior to germination [31]. Golubica had the highest decrease in HMW-GS in the inoculated group, but at the same time, it had increased albumins and globulins post-infection. HMW-GS was also reduced in Bc Anica and Kraljica in the inoculated group. Due to this observation, we can hypothesize that albumins and globulins might play a defense role in FHB pathogen attack in the latter stages of plant maturity, which still needs to be investigated in the future. In wheat maturity, the rapid loss of water content may be due to a blockage of water in flow by lipid deposition in the chalaza. According to the increased MDA content in Sana, Golubica, and Olimpija, this blockage did not occur properly and APX activity was elevated in Golubica in the inoculated group compared to non-inoculated plants. In contrast, APX increased due to pathogen attack in Olimpija. Sana also had reduced HMW-GS due to unchanged POD activity and higher MDA content in Fusarium-infected ears compared to non-inoculated ears. Generally, the highest reduction after Fusarium inoculation among protein components was noticed in HMW-GS in Golubica (29.8%) and Bc Anica (20.3%) compared to non-inoculated controls, which is in accordance with the research of Eggert et al. [32], where gluten digestion by F. graminearum proteases showed a preference for glutenins compared to gliadins, whereas the HMW-GS subfraction was the most affected.
In contrast to gliadins which were increased in infected plants, the total glutenin content (particularly HMW-GS) was reduced in Fusarium-infected plants compared to non-inoculated controls in this investigation, which is in accordance with previous research [14]. Among protein types, in the current research, ω-gliadins were highly affected, which is slightly different from the results of research reported by Horvat et al. [14], where α-GLI was the highest affected protein type. Within the gliadins, the most affected subfractions were ω1.2-gliadins which were reduced by 45% and γ-gliadins which were reduced by 26%, compared to non-inoculated controls [32]. An influence on protein fractions, such as an increase in gliadin content and a reduction in glutenin content, has also been recorded [33]. Baking parameters stayed nearly unchanged, although Fusarium infection levels and DON contents were high [34]. The significant effect of disease on HMW-GS might be due to the poor or intermediate richness of these two components with sulfur-containing amino acids and abundance of glutamine and proline [31], which gives them an advantage in nitrogen storage, which could be a nutrient supply for the pathogen. Therefore, more HMW-GS could attract more pathogen biomass, resulting in a higher susceptibility of plants.
The list of resistance components must be completed with aspects of resilience of rheological properties, including protein composition as a baking-quality determinant [15], which was determined in the current research. In this study, some wheat varieties had good grain resistance to FHB, which may be due to the different antioxidant activities. FHB does not affect the grain biosynthesis processes, but impacts the transport of assimilates caused by changes in grain composition claiming that the resilience of rheological properties following FHB infection pressure is an additional component of grain resistance to the disease [15]. The breakdown of HMW-GS may explain the observed decrease in dough quality and baking performance after Fusarium infection of wheat [32]. The reduced glutenin content may be due to the degradation activity of Fusarium proteases [35].

3. Materials and Methods

3.1. Inoculum Production

The inoculum consisted of two different Fusarium species (1:1). Fusarium culmorum strain (IFA 104), DON chemotype and highly aggressive, was obtained from the Institute of Biotechnology in Plant Production, IFA-Tulln, Austria. F. graminearum was isolated from wheat kernels in a field in eastern Croatia. To produce macroconidia of F. culmorum, a mixture of wheat and oat grains (3:1 by volume) was used. The inoculum of F. graminearum was prepared by using the “bubble breeding” method with a liquid mung bean medium. Final concentration of conidial suspensions of both the strains was set to 1 × 10⁵ mL–1. Concentrated spore suspensions were diluted in 100 L of water before inoculation. For inoculation, 100 mL suspension per square meter was used.

3.2. Field Trials

The field trial was set up at the Agricultural Institute Osijek (45°32′N, 18°44′E) where the soil type is eutric cambisol. The average annual precipitation during the vegetation period in 2016/17 was 482 mm and the average annual temperature was 10 °C (Figure 6). The experimental plot area was 7.56 m2, where one treatment (non-inoculated and artificially inoculated) was replicated. Six winter wheat varieties (Table 4) were artificially inoculated during the flowering stage using a tractor back-sprayer in the late afternoon and repeated two days later (12 and 15 May 2017). To maintain moisture at ear level, water was sprayed a few times during the day with the tractor back-sprayer. For assessing disease severity, we calculated two parameters (general resistance, GR and type I resistance, T1). Disease assessment began with the appearance of the first symptoms 10 days after inoculation, followed by four consecutive scores at intervals of four days which were used to calculate the area under the disease progress curve (AUDPC). The percentage of bleached spikelets (disease intensity) per plot was estimated according to a linear scale (0%–100%). FHB intensity per plot was taken as a measure for general resistance. Disease incidence (percentage of diseased ears per plot) was used as a measure for type I resistance.

3.3. Enzyme Activity

For enzyme extraction, five replicates were taken from the non-inoculated and inoculated plants at the time when first symptoms of FHB were visible (25 May 2017), 10 days after inoculation. Each sample consisted of five ears. Ear tissue was ground into a fine powder with liquid nitrogen in the presence of polyvinylpyrrolidone (PVP) using a pestle and mortar. About 0.2 g of ear powder was extracted with 1 mL of 50 mM potassium phosphate buffer (pH 7.0) with 5 mM ascorbic acid and 0.1 mM EDTA. After centrifugation for 15 min at 14,000× g and 4 °C, re-extraction with 1 mL of the same buffer was performed and the joint supernatant of crude protein extract was taken for enzyme assays. The protein concentration was determined according to Bradford [36] using bovine serum albumin as a standard. All spectrophotometric analyses were performed on the spectrophotometer Specord 200 (Analytic Jenna), refrigerated centrifuge Universal 320R (Hettich), and thermomixer 5436 (Eppendorf).

Measurements of Enzyme Activities

Guaiacol peroxidase (POD; EC 1.11.1.7) activity was determined according to the method described by Siegel and Galston [37]. The reaction mixture consisted of 5 mM guaiacol and 5 mM hydrogen peroxide in 0.2 M phosphate buffer (pH 5.8). The enzymatic reaction was started by the addition of 25 µL of crude protein extract in 975 µL of reaction mixture. Guaiacol peroxidase activity was determined as an increase in absorbance at 470 nm over 2 min and expressed as U/mgproteins, where Unit present 1 µM guaiacol oxidized per minute. Ascorbate peroxidase (APX; EC 1.11.1.11) activity was determined according to Nakano and Asada [38]. The reaction mixture consisted of 955 µL 50 mM potassium phosphate buffer (pH 7.0) with 0.1 mM EDTA, 10 µL 25 mM ascorbic acid and 25 µL of crude protein extract. The enzymatic reaction was initialized by adding 10 µL of 12 mM H2O2 in reaction mixture and decrease in the absorbance at 290 nm was monitored over 2 min. Ascorbate peroxidase activity was expressed as U/mgprotein, where U (unit) represents 1 µM of oxidized ascorbate per minute. Catalase (CAT, EC 1.11.1.6) activity was measured by the method of Aebi [39] using a 950 µL reaction mixture consisting of 50 mM potassium phosphate buffer and 5 mM H2O2. The decrease in absorbance at 240 nm was monitored over 1 min after the initiation of reaction by 50 µL of crude protein extract. Catalase activity was expressed as unit (µM of H2O2 decomposed per minute) per mg protein (U/mgprotein). Polyphenol oxidase (PPO; EC 1.14.18.1) activity was determined as the rate of oxidation of pyrogallol to o-quinones at 40 °C [40]. The increase in absorbance was recorded at 430 nm during 2 min after the initiation of enzymatic reaction by the addition of 15 µL of crude protein extract to 2.2 mL of reaction mixture consisting of 2 mL of 100 mM potassium phosphate buffer (pH 7.0) and 0.2 mL of 100 mM pyrogallol. Polyphenol oxidase activity was expressed as U/mgprotein, where U (unit) represents 1 µM of pyrogallol oxidized per minute.

3.4. Determination of MDA Content and H2O2 Concentration

The determination of malondialdehyde (MDA) and H2O2 content was performed using the same homogenized tissues as for enzyme activity. The extraction with 2 mL of 0.1% trichloroacetic acid (TCA) was performed from 400 mg of powdered ear tissue. After 10 min, the homogenate was centrifuged (15 min, 12,000× g, 4 °C) and the supernatant was used for MDA and H2O2 content measurement. MDA, as the decomposition product of polyunsaturated fatty acids of biomembranes, was determined by the thiobarbituric acid (TBA) reaction [41]. The reaction mixture consisted of 0.5 mL supernatant and 1 mL of 0.5% TBA in 20% TCA and it was heated at 95 °C for 30 min and then quickly cooled in an ice bath. After centrifugation (15 min, 14,000× g, 4 °C), the absorbance of the supernatant was recorded against blank (0.5% TBA in 20% TCA) at 532 nm. Correction at 600 nm for non-specific turbidity was subtracted. MDA content was expressed as µmol per gram of fresh weight (µmol/g) using an extinction coefficient of 155 mM−1 cm−1. H2O2 concentration was quantified according to Velikova et al. [42]. The reaction mixture consisted of 0.5 mL of supernatant, 0.5 mL of 10 mM potassium phosphate buffer (pH 7.0), and 1 mL of 1 M potassium iodide (KI). After incubation for 20 min at room temperature in darkness, the absorbance of the reaction mixture was read at 390 nm. H2O2 content was determined using H2O2 as a standard and expressed as µmol per gram of fresh weight (µmol/g).

3.5. Determination of Phenol Content

The extraction of total phenol content was performed on 0.25 g of ear tissue powdered by liquid nitrogen in a mortar by addition of 2.5 mL of 96% ethanol. After extraction for 30 min in an ultrasound bath at 80 °C, the homogenate was centrifuged (15 min, 12,000× g, room temperature) and the supernatant was collected and used for total phenol determination by the modified Folin–Ciocalteu method [43]. In brief, 20 µL of supernatant was mixed with 1.58 mL of dH2O and 0.1 mL of Folin–Ciocalteu reagent (1:1; v/v diluted with water). After 5 min, 0.3 mL of sodium carbonate solution (20%; w/v diluted with water) was added. The homogenized reaction mixture was placed for 30 min in a dark place at room temperature, after which absorbance reading at 765 nm was taken in a spectrophotometer (Specord 200, Analytic Jenna). The content of total phenol (PHE) was expressed as mg of gallic acid equivalents (GAE) per gram based on a gallic acid calibration curve.

3.6. Protein Extraction and Characterization

The extraction of wheat proteins was done according to the stepwise quantitative procedure of Wieser et al. [44]. Whole meal flour (100 mg) was extracted stepwise with 0.4 M NaCl (albumins and globulins, AG), 50% 1-PrOH (GLI), and 50% 1-PrOH + 2 M urea + 0.05 M of Tris-HCl (pH = 7.5) + 1% DTT (GLU). Protein separation was carried out using the Perkin Elmer LC 200 chromatograph controlled by the TotalChrom software (Perkin Elmer Instruments, Waltham, USA) on a Discovery BIO Wide Pore C18 column (300 Å pore size, 5 μm particle size, 4.6 × 150 mm i.d.) (Sigma-Aldrich Chemie GmbH, Taufkirchen, Germany). The mobile phase consisted of millipore water with 1% trifluoroacetic acid (v/v) (A) and acetonitrile with 1% trifluoroacetic acid (v/v) (B). The column temperature was 50 °C and injection volume was 20 µL. The gradient elution profile was as follows: from 24%–54% B in 30 min, isocratic at 90% B for 5 min, returning to the initial conditions in 5 min, and column equilibration in 5 min. The flow rate was controlled at 1.0 mL/min. The peaks were detected at 210 nm with a photodiode array detector. The peak areas under AG, GLI, and GLU chromatograms were summed and used as a direct measure of total content of extractable wheat proteins and consequently, the proportions (%) of protein fractions and single protein types were calculated [44].

3.7. Deoxinivalenol (DON) Analyses

The determination of DON with the LC-MS/MS method in wheat grains in Fusarium-inoculated and non-inoculated samples was performed according to the method used by Spanic et al. [45,46]. 10 g of wheat grain was ground by IKA M20 (IKA, Staufen, Germany). DON was extracted with 40 mL of acetonitrile:water (84:16, v/v). The mixture was stirred for 3 min at high speed in a Waring LB10S blender (Waring, East Windsor, NJ, USA). The extract was filtered through Whatman No. 1 filter paper followed by a glass microfiber filter (934-AH). Following filtration, an solid-phase extraction (SPE) column purification was performed by the addition of 15 mL of extract to the SPE column (MultiSep 226 AflaZon+ Multifunctional Columns, RomerLabs, Tulln, Austria). After purification on SPE columns, an aliquot of 6 mL of clean-up solution was dried under a gentle stream of high purity nitrogen (5.0) (Messer, Osijek, Croatia) at 50 °C. The residue was re-dissolved in 400 µL of a mobile phase, transferred into vials, and 20 µL was injected into the LC-MS/MS system. A Perkin Elmer Series 2000 binary pump with auto sampler was combined with API 2000 triple quadrupole MS (SCIEX) for analysis. The Ascentis Express C-18 column was used for mycotoxin separation (150 × 2.1 mm; with 2.7 µm particle size). The column was heated to 45 °C, eluent A was 10 mM formic acid, and eluent B was 10 mM of formic acid in methanol (pH of both the eluents was set to 3.8 with ammonium hydroxide). The gradient started with 80% of eluent A, that was decreased to 50% within 10 min, followed by 20% in the next 5 min, and then to 0% until 16 min; 100% of eluent B was held for 10 min, followed by equilibration to starting conditions for 4 min. The flow rate was set to 200 µL min−1. The MS/MS analysis was performed by using an electrospray ionization (ESI) source in both (positive and negative) modes, in two separate runs. The ion spray voltage was set to −4500 V in the negative mode and 5500 V in the positive mode. Nitrogen was used as an ion source and a collision gas. Results were analyzed with the Analyst software version 1.4.2.

3.8. Statistical Analysis

Statistical analysis was done using analysis of variance (ANOVA) followed by Fisher’s LSD test (α = 0.05) and Spearman correlation coefficient by Statistica version 12.0 (Statsoft Inc., Tulsa, USA). The reported data for antioxidant and protein parameters represent the mean ± standard error (SE).

4. Conclusions

DON was able to induce plant H2O2 production in both FHB-resistant and FHB-susceptible wheat varieties, which induced increased lipid peroxidation in susceptible wheat varieties. A reduction in CAT activity during Fusarium inoculation in resistant varieties was observed in this study, accompanied by an increase in POD activity. The protein components responsible for wheat quality of Vulkan and Olimpija were unchanged in inoculated samples, which could be due to high POD activity through rapid removal of H2O2 and PPO activity which could participate in the detoxification of phenolic acids induced by the pathogen attack. Our results showed that, under higher pressure of FHB infestation, the content of glutenins decreased in more FHB-susceptible wheat varieties inoculated with Fusarium than in non-inoculated plants. FHB caused a reduction in glutenin and HMW glutenin subunits, which are indicators of bread-making quality, as a result of contamination by DON.

Author Contributions

Conceptualization, writing—original draft preparation, project administration, V.S.; formal analysis, investigation, writing—review and editing, M.V.V.; methodology, formal analysis, writing—review and editing, D.H.; formal analysis, investigation, writing—review and editing, B.S.; resources, writing—review and editing G.D.; supervision, writing—review and editing, Z.Z. All authors have read and agreed to the published version of the manuscript.

Funding

This research was funded in part by the Croatian Science Foundation (grant number HRZZ-UIP-2014-9188).

Acknowledgments

We would like to thank Tihana Marcek (dr.) and Kristina Lutrov (dipl.ing) for advices and technical assistance during this research.

Conflicts of Interest

The authors declare no conflicts of interest.

References

  1. Goswami, R.; Kistler, H. Heading for disaster: Fusarium graminearum on cereal crops. Mol. Plant Pathol. 2004, 5, 515–525. [Google Scholar] [CrossRef] [PubMed]
  2. Ribichich, K.F.; Lopez, S.E.; Vegetti, A.C. Histopathological Spikelet Changes Produced by Fusarium graminearum in Susceptible and Resistant Wheat Cultivars. Plant Dis. 2000, 84, 794–802. [Google Scholar] [CrossRef] [PubMed] [Green Version]
  3. World Health Organization. Deoxynivalenol. In WHO Food Additives Series 47. FAO Food and Nutrition Paper; World Health Organization: Anderlecht, Belgium, 2001; Volume 74, pp. 419–556. [Google Scholar]
  4. Audenaert, K.; Vanheule, A.; Höfte, M.; Haesaert, G. Deoxynivalenol: A Major Player in the Multifaceted Response of Fusarium to Its Environment. Toxins 2014, 6, 1–19. [Google Scholar] [CrossRef] [PubMed] [Green Version]
  5. Bai, G.; Shaner, G. Scab in wheat: Prospects for control. Plant Dis. 1994, 78, 760–766. [Google Scholar] [CrossRef]
  6. Schroeder, H.W.; Christensen, J.J. Factors affecting resistance of wheat to scab by Gibberella zeae. Phytopathology 1963, 53, 831–838. [Google Scholar]
  7. Mesterhazy, A. Types and components of resistance to Fusarium head blight. Plant Breed. 1995, 114, 377–386. [Google Scholar] [CrossRef]
  8. Halliwell, B.; Gutteridge, J.M.C. Free Radicals in Biology and Medicine, 4th ed.; Oxford University Press: Oxford, UK, 2007. [Google Scholar]
  9. Sewelam, N.; Kazan, K.; Schenk, P.M. Global Plant Stress Signaling: Reactive Oxygen Species at the Cross-Road. Front. Plant Sci. 2016, 7, 187. [Google Scholar] [CrossRef] [Green Version]
  10. Boutigny, A.-L.; Barreau, C.; Atanasova-Penichon, V.; Verdal-Bonnin, M.N.; Pinson-Gadais, L.; Richard-Forget, F. Ferulic acid, an efficient inhibitor of type B trichothecene biosynthesis and Tri gene expression in Fusarium liquid cultures. Mycol. Res. 2009, 113, 746–753. [Google Scholar] [CrossRef]
  11. Gorinstein, S.; Lojek, A.; Ciz, M.; Pawelzik, E.; Delgado-Licon, E.; Medina, O.J.; Moreno, M.; Arnao Salas, I.; Goshev, I. Comparison of composition and antioxidant capacity of some cereals and pseudocereals. Int. J. Food Sci. Technol. 2008, 43, 629–637. [Google Scholar] [CrossRef]
  12. Spanic, V.; Horvat, D.; Drezner, G.; Zdunic, Z. Changes in Protein Composition in the Grain and Malt after Fusarium Infection Dependently of Wheat Resistance. Pathogens 2019, 8, 112. [Google Scholar] [CrossRef] [Green Version]
  13. Anjum, F.M.; Khan, M.R.; Din, A.; Saeed, M.; Pasha, I.; Arshad, M.U. Wheat gluten: High molecular weight glutenin subunits-structure, genetics, and relation to dough elasticity. J. Food Sci. 2007, 72, 56–63. [Google Scholar] [CrossRef] [PubMed]
  14. Horvat, D.; Spanic, V.; Dvojkovic, K.; Simic, G.; Magdic, D.; Nevistic, A. The Influence of Fusarium Infection on Wheat (Triticum aestivum L.) Proteins Distribution and Baking Quality. Cereal Res. Commun. 2015, 43, 61–71. [Google Scholar] [CrossRef] [Green Version]
  15. Martin, C.T.; Schöneberg, T.; Vogelgsang, S.; Vincenti, J.; Bertossa, M.; Mauch-Mani, B.; Mascher, F. Factors of wheat grain resistance to Fusarium head blight. Phytopathol. Mediterr. 2017, 56, 154–166. [Google Scholar] [CrossRef]
  16. Wu, Q.; Wang, X.; Nepovimova, E.; Wang, Y.; Yang, H.; Li, L.; Zhang, X.; Kuca, K. Antioxidant agents against trichothecenes: New hints for oxidative stress treatment. Oncotarget 2017, 8, 110708–110726. [Google Scholar] [CrossRef] [Green Version]
  17. Jansen, C.; Von Wettstein, D.; Schäfer, W.; Kogel, K.H.; Felk, A.; Maier, F.J. Infection patterns in barley and wheat spikes inoculated with wild-type and trichodiene synthase gene disrupted Fusarium graminearum. Proc. Natl. Acad. Sci. USA 2005, 102, 16892–16897. [Google Scholar] [CrossRef] [Green Version]
  18. Yang, W.; Yu, M.; Fu, J.; Bao, W.; Wang, D.; Hao, L.; Yao, P.; Nüssler, A.K.; Yan, H.; Liu, L. Deoxynivalenol induced oxidative stress and genotoxicity in human peripheral blood lymphocytes. Food Chem. Toxicol. 2014, 64, 383–396. [Google Scholar] [CrossRef]
  19. Atanasova-Penichon, V.; Barreau, C.; Richard-Forget, F. Antioxidant Secondary Metabolites in Cereals: Potential Involvement in Resistance to Fusarium and Mycotoxin Accumulation. Front. Microbiol. 2016, 7, 566. [Google Scholar] [CrossRef] [Green Version]
  20. Giordano, D.; Beta, T.; Reyneri, A.; Blandino, M. Changes in the Phenolic Acid Content and Antioxidant Activity during Kernel Development of Corn (Zea mays L.) and Relationship with Mycotoxin Contamination. Cereal Chem. 2017, 94, 315–324. [Google Scholar] [CrossRef] [Green Version]
  21. Miedaner, T.; Heinrich, N.; Schneider, B.; Oettler, G.; Rohde, S.; Rabenstein, F. Estimation of deoxynivalenol (DON) content by symptom rating and exoantigen content for resistance selection in wheat and triticale. Euphytica 2004, 139, 123–132. [Google Scholar] [CrossRef]
  22. Lanubile, A.; Maschietto, V.; De Leonardis, S.; Battilani, P.; Paciolla, C.; Marocco, A. Defense Responses to Mycotoxin-Producing Fungi Fusarium proliferatum, F. subglutinans, and Aspergillus flavus in Kernels of Susceptible and Resistant Maize Genotypes. Mol. Plant Microbe Interact. 2015, 28, 546–557. [Google Scholar] [CrossRef] [Green Version]
  23. Hassanein, R.A.; Hashem, H.A.; Fahmy, A.H.; Ibrahim, A.S.; El Shihy, O.M.; Qaid, E.A. Protection Against Fusarium Head Blight: Important Defense Mechanisms Studied in Three Regenerated Egyptian Wheat Cultivars. J. Stress Physiol. Biochem. 2016, 12, 18–43. [Google Scholar]
  24. Kurasiak-Popowska, D.; Stuper-Szablewska, K.; Nawraca, J.; Tomkowiak, A.; Perkowski, J. Phenolic acid content in wheat grain (Triticum spp.) of different genotypes. Rev. Fac. Cienc. Agrar. UNCUYO 2016, 48, 1–7. [Google Scholar]
  25. Rajeswari, P. Role of Phenols and Antioxidant Enzymes in Biocontrol of Fusarium oxysporum Causing Fusarium Wilt of Arachis hypogeae. L (Groundnut). Int. J. Agric. Sci. Res. 2014, 4, 95–104. [Google Scholar]
  26. Spanic, V.; Viljevac Vuletic, M.; Abicic, I.; Marcek, T. Early response of wheat antioxidant system with special reference to Fusarium head blight stress. Plant Physiol. Biochem. 2017, 115, 34–43. [Google Scholar] [CrossRef]
  27. Mohammadi, M.; Kazemi, H. Changes in peroxidase and polyphenol oxidase activities in susceptible and resistant wheat heads inoculated with Fusarium graminearum and induced resistance. Plant Sci. 2002, 162, 491–498. [Google Scholar] [CrossRef]
  28. Boyacioǧlu, D.; Hettiarachchy, N.S. Changes in some biochemical components of wheat grain that was infected with Fusarium graminearum. J. Cereal Sci. 1995, 21, 57–62. [Google Scholar] [CrossRef]
  29. Sorahinobar, M.; Niknam, V.; Ebrahimzade, H.; Soltanloo, H. Differential antioxidative responses of susceptible and resistant wheat cultivars against Fusarium head blight. Int. J. Farming Allied Sci. 2015, 4, 239–243. [Google Scholar]
  30. Spanic, V.; Viljevac Vuletic, M.; Drezner, G.; Zdunic, Z.; Horvat, D. Performance Indices in Wheat Chlorophyll a Fluorescence and Protein Quality Influenced by FHB. Pathogens 2017, 6, 59. [Google Scholar] [CrossRef] [Green Version]
  31. Dupont, F.M.; Altenbach, S.B. Molecular and biochemical impacts of environmental factors on wheat grain development and protein yield. J. Cereal Sci. 2003, 38, 133–146. [Google Scholar] [CrossRef]
  32. Eggert, K.; Rawel, H.M.; Pawelzik, E. In vitro degradation of wheat gluten fractions by Fusarium graminearum proteases. Eur. Food Res. Technol. 2011, 233, 697–705. [Google Scholar] [CrossRef] [Green Version]
  33. Eggert, K.; Wieser, H.; Pawelzik, E. The influence of Fusarium infection and growing location on the quantitative protein composition of (part I) emmer (Triticum dicoccum). Eur. Food Res. Technol. 2010, 230, 837–847. [Google Scholar] [CrossRef] [Green Version]
  34. Prange, A.; Birzele, B.; Krämer, J.; Meier, A.; Modrow, H.; Köhler, P. Fusarium-inoculated wheat: Deoxynivalenol contents and baking quality in relation to infection time. Food Control 2005, 16, 739–745. [Google Scholar] [CrossRef]
  35. Wang, J.H.; Wieser, H.; Pawelzik, E.; Weinert, J.; Keutgen, J.; Wolf, G. Impact of the fungal protease produced by Fusarium culmorum on the protein quality and breadmaking properties of winter wheat. Eur. Food Res. Technol. 2005, 220, 552–559. [Google Scholar] [CrossRef]
  36. Bradford, M.M. A rapid and sensitive method for the quantitation of microgram quantities of protein utilizing the principle of protein-dye binding. Anal. Biochem. 1976, 72, 248–254. [Google Scholar] [CrossRef]
  37. Siegel, B.Z.; Galston, W. The isoperoxidases of Pisum sativum. Plant Physiol. 1967, 42, 221–226. [Google Scholar] [CrossRef] [PubMed] [Green Version]
  38. Nakano, Y.; Asada, K. Hydrogen peroxide is scavenged by ascorbate specific peroxidase in spinach chloroplasts. Plant Cell Physiol. 1981, 22, 867–880. [Google Scholar] [CrossRef]
  39. Aebi, H. Catalase in vitro. Method Enzym. 1984, 105, 121–126. [Google Scholar] [CrossRef]
  40. Raymond, J.; Rakariyatham, N.; Azanza, J. Purification and some properties of polyphenoloxidase from sunflower seeds. Phytochemistry 1993, 34, 927–931. [Google Scholar] [CrossRef]
  41. Verma, S.; Dubey, R.S. Leads toxicity induces lipid peroxidation and alters the activities of antioxidant enzymes in growing rice plants. Plant Sci. 2003, 164, 645–655. [Google Scholar] [CrossRef]
  42. Velikova, V.; Yordanov, I.; Edreva, A. Oxidative stress and some antioxidant systems in acid rain-treated bean plants: Protective role of exogenous polyamines. Plant Sci. 2000, 151, 59–66. [Google Scholar] [CrossRef]
  43. Singleton, V.L.; Rossi, J.A. Colorimetry of total phenolics with phosphomolybdic-phosphotungstic acid reagents. Am. J. Enol. Vitic. 1965, 16, 144–158. [Google Scholar]
  44. Wieser, H.; Antes, S.; Selmeier, W. Quantitative determination of gluten protein types in wheat flour by reverse-phase high preformance liquid chromatography. Cereal Chem. 1998, 75, 644–650. [Google Scholar] [CrossRef]
  45. Spanic, V.; Marcek, T.; Abicic, I.; Sarkanj, B. Effects of Fusarium Head Blight on Wheat Grain and Malt Infected by Fusarium culmorum. Toxins 2018, 10, 17. [Google Scholar] [CrossRef] [PubMed] [Green Version]
  46. Spanic, V.; Zdunic, Z.; Drezner, G.; Sarkanj, B. The Pressure of Fusarium Disease and Its Relation with Mycotoxins in the Wheat Grain and Malt. Toxins 2019, 11, 198. [Google Scholar] [CrossRef] [Green Version]
Figure 1. Disease symptoms for (a) general resistance and (b) diseased ears for type I resistance in inoculated plants for six wheat varieties.
Pathogens 09 00017 g001
Figure 2. CAT, APX, POD, and PPO activity in non-inoculated (CON) and inoculated (FHB) plants of six wheat varieties. Values are means of five replications ± standard error (SE). Capital letters indicate significantly different values (according to Fisher’s LSD test (p ≤ 0.05) in different treatments (non-inoculated and inoculated treatments). Lower case letters indicate significantly different values (according to Fisher’s LSD test (p ≤ 0.05) among different varieties under the same treatment.
Pathogens 09 00017 g002
Figure 3. H2O2 and MDA content in non-inoculated (CON) and inoculated (FHB) plants of six wheat varieties. Values are means of five replications ± standard error (SE). Capital letters indicate significantly different values according to Fisher’s LSD test (p ≤ 0.05) in different treatments (non-inoculated and inoculated treatments). Lower case letters indicate significantly different values according to Fisher’s LSD test (p ≤ 0.05) among different varieties under the same treatment.
Pathogens 09 00017 g003
Figure 4. Phenol content in non-inoculated (CON) and inoculated (FHB) plants of six wheat varieties. Values are means of five replications ± standard error (SE). Capital letters indicate significantly different values according to Fisher’s LSD test (p ≤ 0.05) in different treatments (non-inoculated and inoculated treatments). Lower case letters indicate significantly different values according to Fisher’s LSD test (p ≤ 0.05) among different varieties under the same treatment.
Pathogens 09 00017 g004
Figure 5. Percentage of albumins and globulins; gliadins; ω-, α-, and γ-gliadins; glutenins; high molecular weight (HMW)-glutenin subunits (GS), and low molecular weight (LMW)-GS in non-inoculated (CON) and inoculated (FHB) samples. Letters indicate significantly different values according to Fisher’s LSD test (p ≤ 0.05) in different treatments (non-inoculated and inoculated treatments) for each variety and each protein composition.
Pathogens 09 00017 g005
Figure 6. Rainfall and average temperatures during the vegetation season 2016/2017 at Osijek.
Pathogens 09 00017 g006
Table 1. Area under the disease progress curve (AUDPC) for general resistance and type I resistance (initial infection) to Fusarium head blight (FHB) and deoxynivalenol (DON) accumulation for six wheat varieties.
VarietyAUDPC for General ResistanceAUDPC for Type I ResistanceResistance/SusceptibilityDON
µg kg−1
Kraljica75.5199.1R1424
Olimpija72.5199.9R588
Vulkan90.8280.8R755
Sana145.3333.3MS2205
Golubica430.0647.5S3308
Bc Anica358.3471.6S2299
R, resistant; MS, moderately susceptible; S, susceptible; DON, deoxynivalenol.
Table 2. Analysis of variance for different enzymatic and non-enzymatic antioxidative components.
DfMS
Source of VariationPODAPXCATPPOMDAH2O2ProteinsPhenols
Variety (V)564.60 ***0.6070 ***43.45 ns0.33974 ***14.066 ***27,360 ***9.591 ***0.11683 ***
Treatment (T)1229.67 ***0.4950 ***437.51 ***0.15504 ***58.885 ***18,891 ***13.039 ***1.04280 ***
V*T58.57 ***0.3092 ***76.18 **0.05877 ***6.549 ***1950 ***4.850 ***0.00831 ns
Error481.830.041518.330.008010.6731950.7740.00435
***,**,* = significant at p < 0.001, 0.01, and 0.05, respectively; ns = not significant (p > 0.05). POD, guaiacol peroxidase; APX, ascorbate peroxidase; CAT, catalase; PPO, polyphenol oxidase; MDA, malondialdehyde; H2O2, hydrogen peroxide; Df, degrees of freedom; MS, mean sum of squares.
Table 3. Correlation analysis between AUDPC for general resistance, AUDPC for type I resistance, and DON accumulation in the grains of six wheat varieties.
AUDPC for GRAUDPC for T1DON Accumulation
AUDPC for GR1
AUDPC for T10.94 **1
DON Accumulation0.83 *0.771
**, Significant at 0.01; *, significant at 0.05; GR, general resistance; T1, initial (type I) resistance.
Table 4. Origin and year of release of six investigated winter wheat varieties.
VarietiesOriginYear of Release
KraljicaHR, AIO2010
OlimpijaHR, AIO2009
VulkanHR, AIO2009
SanaHR, BC1983
Bc AnicaHR, BC2010
GolubicaHR, AIO1997
HR, Croatia; AIO, Agricultural Institute Osijek; Bc, BC Institute.

