Abstract
Tanker water is used extensively for drinking as well as domestic purposes in the Kathmandu Valley of Nepal. This study aimed to investigate water quality in terms of microbial contamination and determine sources of fecal pollution within these waters. Thirty-one samples from 17 tanker filling stations (TFSs) and 30 water tanker (WT) samples were collected during the dry and wet seasons of 2016. Escherichia coli was detected in 52% of the 31 TFS samples and even more frequently in WT samples. Of the six pathogenic viruses tested, enteroviruses, noroviruses of genogroup II (NoVs-GII), human adenoviruses (HAdVs), and group A rotaviruses were detected using quantitative PCR (qPCR) at 10, five, four, and two TFSs, respectively, whereas Aichi virus 1 and NoVs-GI were not detected at any sites. Index viruses, such as pepper mild mottle virus and tobacco mosaic virus, were detected using qPCR in 77% and 95% out of 22 samples, respectively, all of which were positive for at least one of the tested pathogenic viruses. At least one of the four human-associated markers tested (i.e., BacHum, HAdVs, and JC and BK polyomaviruses) was detected using qPCR in 39% of TFS samples. Ruminant-associated markers were detected at three stations, and pig- and chicken-associated markers were found at one station each of the suburbs. These findings indicate that water supplied by TFSs is generally of poor quality and should be improved, and proper management of WTs should be implemented.
1. Introduction
Kathmandu, the capital city of Nepal, faces a severe scarcity of water in terms of both quality and quantity [1,2,3,4]. Kathmandu Upatyaka Khanepani Limited (KUKL), the sole organization responsible for supplying piped water into the valley, can only supply 111 million liters per day (MLD) and 71 MLD in wet and dry seasons, respectively, while the actual demand approaches 377 MLD [4]. Therefore, to meet daily requirements for domestic water, households in the valley are compelled to employ alternative water sources [5]. Commonly used alternative water sources include groundwater (e.g., shallow dug and deep tube wells, and stone spouts), jar water, tanker water, and surface water sources, such as springs and rivers. Tanker water is a major component of the valley’s water market [6], as is so in other countries, such as Bangladesh, Indonesia, Pakistan, the Philippines, and Thailand [7]. Water tankers play an important role in transporting large volumes of water abstracted from ground and surface sources to communities and households lacking the infrastructure or that are deprived of water sources [6,8,9,10]. The sources of tanker water in the valley range from surface water to shallow or deep borings, whereas the treatment procedures usually applied by TFSs vary from aeration, sedimentation and filtration (generally by pressurized sand filters), to use of bleaching powders [6]. The number of tanker water consumers has been gradually increasing and has increased rapidly following the Gorkha Earthquake of 2015 [5]. Currently, 22% of households are using tanker water, of which 18%, 60%, 97%, and 95% use it for drinking, cooking, bathing, and laundry, respectively [5].
A previous study [11] reported the detection of fecal indicator bacteria and pathogens as well as ruminant fecal markers in tanker water supplied to a household. A recent study showed that 77% of tanker water samples collected in the valley exceeded the Nepal Drinking Water Quality Standard guideline for total coliform count [12]. Such findings have indicated possible public health risks associated with using tanker water.
Viruses such as pepper mild mottle virus (PMMoV) and tobacco mosaic virus (TMV) have been proposed as potential indicators of pathogenic viruses [13]. Pathogenic viruses, including Aichi virus 1 (AiV-1), human adenoviruses (HAdVs), enteroviruses (EVs), noroviruses of genogroups I and II (NoVs-GII), and group A rotaviruses (RVAs), have been studied to estimate the concentration of pathogenic viruses in various water sources [13,14]. However, data regarding tanker water are limited. Thus, there is a need to investigate microbial contamination and sources of fecal pollution in TFS samples and water distributed by WTs.
Prevention of potential disease outbreaks can be achieved by identifying sources of fecal contamination and formulating appropriate pollution mitigation strategies. Sources of fecal contamination can be identified by the application of a technique called microbial source tracking (MST), which accurately and reliably identifies the hosts responsible for fecal pollution [15,16]. Host-associated Bacteroidales assays—BacHum (human-associated) [17], BacR (ruminant-associated) [18], and Pig2Bac (pig-associated) [19] and mitochondrial DNA (mtDNA) markers (bovine-, dog-, and pig-associated) [20,21], as well as viral markers specific for humans (HAdVs) [22], JC and BK polyomaviruses (JCPyVs and BKPyVs) [23], chicken (chicken parvoviruses (ChkPVs) [24], and pig (porcine adenoviruses (PoAdVs) [25])—are commonly used for source tracking.
Based on this background, the current study aimed to assess the prevalence and abundance of pathogenic viruses and indicators of pathogens in order to identify sources of fecal contamination in TFSs and WT samples in the Kathmandu Valley.
2. Results
2.1. Detection of Fecal Indicator Bacteria and Index Viruses
Table 1 shows the positive ratios and concentration ranges of fecal indicator bacteria and index viruses (PMMoV and TMV) within water samples from TFSs and WTs. Escherichia coli and total coliforms were detected in 52% and 87% of 31 TFS samples, respectively, and were more frequent in WT samples. The mean concentration of E. coli in WT samples was 0.37 log greater than that in TFS samples, although the difference was not significant (independent t-test; p > 0.05). PMMoV and TMV were detected in 71% and 90% out of 31 TFS samples, respectively, whereas in WT samples, PMMoV and TMV were detected in 73% and 97% out of 30 samples, respectively. Of the 22 samples that were positive for at least one pathogenic virus, PMMoV and TMV were detected in 77% and 95% of samples, respectively. The E. coli concentrations were 0.0–4.0 and 0.0–3.5 log most probable number (MPN)/100 mL in TFSs and WT samples, respectively. Similarly, out of the two index viruses tested, TMV was detected with the highest concentration (6.3 log copies/L) in WT samples, whereas PMMoV was detected with the lowest concentration (1.7 log copies/L) in TFS samples. E. coli was detected in 44% (7/16) and 60% (9/15) of TFS samples during the dry and wet seasons, respectively, whereas it was detected in 65% (11/17) and 77% (10/13) of WT samples during the dry and wet seasons, respectively. Although the difference was not significant, the mean concentration of E. coli in WT samples during the wet season was 0.78 log greater than that within the dry season (independent t-test; p > 0.05).

Table 1.
Positive ratios and concentrations of fecal indicator bacteria and index viruses in tanker filling station and water tanker samples.
Figure 1 shows the E. coli concentration of water samples in the corresponding TFSs and WTs (27 pairs). In most cases, the E. coli concentration of WT samples was greater than that of corresponding TFS samples, although the mean concentrations did not differ significantly between WT (0.8 ± 1.6 log MPN/100 mL) and TFS samples (0.5 ± 1.8 log MPN/100 mL) (paired t-test, p > 0.05). Forty-six percent (6/13) of E. coli-negative TFS samples were positive for E. coli in the corresponding WT samples.
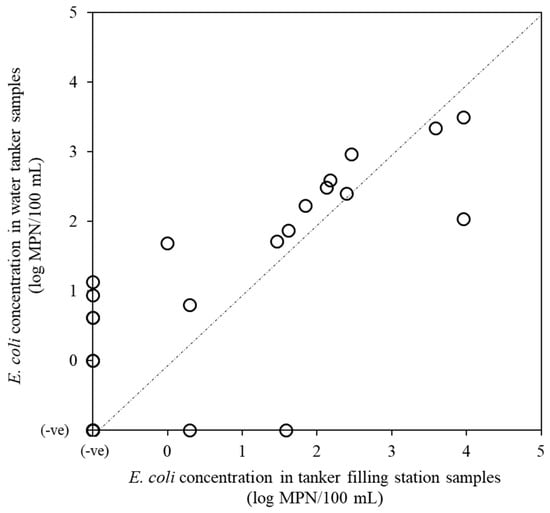
Figure 1.
E. coli concentrations in tanker filling station and water tanker samples.
Chlorine is a widely used disinfectant employed within water treatment procedures in the valley. We examined the relationship between the E. coli-positive ratio and the concentrations of free and combined chlorine within TFS samples. Figure 2 shows the positive ratios of E. coli in water samples from TFSs in different categories of free (Figure 2a) and combined (Figure 2b) chlorine concentrations. The positive ratios of E. coli gradually decreased with an increase in free and combined chlorine concentrations, except for the category of 0.00–0.05 mg/L free chlorine. The concentration of total chlorine in this category was 0.01–0.59 mg/L. When water samples were divided into three categories based on total chlorine concentration, the positive ratios of E. coli were 60% (6/10), 64% (7/11), and 30% (3/10) for 0.01–0.04, 0.05–0.34, and 0.35–1.42 mg/L of chlorine concentration, respectively.
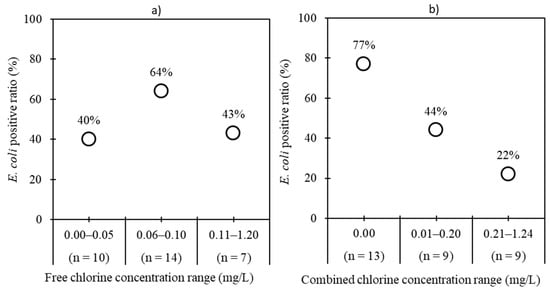
Figure 2.
E. coli concentrations plotted against (a) free chlorine concentration categories and (b) combined chlorine concentration categories in tanker filling station samples.
2.2. Detection of Pathogenic Viruses
Table 2 shows the results of testing for six pathogenic viruses—AiV-1, EVs, HAdVs, NoVs-GI and GII, and RVAs—analyzed for TFS and WT samples. Of the 17 TFSs, EVs, NoVs-GII, HAdVs, and RVAs were detected at 10, five four, and two TFSs, respectively. Between two and four pathogenic viruses were detected at six TFSs. Among all the pathogenic viruses tested, EVs were the most prevalent viruses in TFS samples, with a positive ratio of 35% (11/31), followed by NoVs-GII (23%, 7/31), HAdVs (13%, 4/31), and RVAs (6%, 2/31). On the other hand, NoVs-GII were most frequently detected in WT samples (20%, 6/30), followed by EVs (13%, 4/30), RVAs (10%, 3/30), and HAdVs (7%, 2/30). The detection frequency of EVs was significantly higher in TFS samples (35%, 11/31) than in WT samples (13%, 4/30) (χ2-test; p < 0.05). However, no significant differences in the detection frequencies of NoVs-GII (χ2-test; p > 0.05), HAdVs, and RVAs (fisher exact-test; p > 0.05) between TFS and WT samples were observed. At least one pathogenic virus was detected in 45% (14/31) of TFS samples and 27% (8/30) of WT samples. Furthermore, NoVs-GII were detected at two TFSs continuously during both seasons. However, AiV-1 and NoVs-GI were undetected in any of the sampled TFSs and WTs.
Table 2.
Positive ratios and concentrations of pathogenic viruses in tanker filling station and water tanker samples.
2.3. Detection of Host-Associated Fecal Markers
Microbial source tracking was conducted for TFS samples using previously validated host-associated Bacteroidales [26], mtDNA, and viral markers. Table 3 shows the results of the detection of fecal markers in the TFS samples. The frequency of at least one human-associated marker (39%, 12/31) detection was significantly higher than ruminant-associated marker (14%, 3/22) (χ2-test; p < 0.05). Chicken- and pig-associated markers were detected in 3% (1/31) and 5% (1/22) of TFS samples, respectively. Dog-associated markers were not detected in any of the TFS samples. At least one human- and ruminant-associated markers were detected at 10 and 3 out of 17 TFSs tested, respectively. Human- and animal-mixed fecal contamination was observed at two TFSs. For one TFS, contaminations from all the tested hosts were judged, with the exception of dog. Animal-associated fecal markers were detected at three TFSs, all of which were located in the peri-urban area where agriculture and livestock farming are common. At least one pathogenic virus was detected in 69% (9/13) and 33% (6/18) of samples that tested positive and negative for fecal markers, respectively. At least one fecal marker was detected at nine (75%) out of 12 TFSs within which pathogenic viruses were detected. In addition, human-associated fecal markers were continuously detected at two TFSs during both seasons.
Table 3.
Detection of fecal-source markers in tanker filling station samples.
3. Discussion
Fifty-two percent (16/31) of TFS samples were contaminated with E. coli, indicating poor performance of the treatment plants. E. coli detection in 70% (21/30) of WT samples with concentrations higher than the World Health Organization (WHO) guideline values for drinking water (<1 MPN/100 mL) indicated the unsuitability of this tanker water for drinking purposes [27]. When the relationship between E. coli detection and free or combined chlorine concentrations was examined, there was a decreasing trend in the positive ratios of E. coli as the concentrations of free and combined chlorine increased. However, there was a low positive ratio of E. coli in the category 0.00–0.05 mg/L of free chlorine, which could be due to the presence of combined chlorine. This result suggested that chlorine application could be a useful measure for lowering the concentration of E. coli in WTs. Although the difference was not significant, the concentrations of E. coli in WT samples were higher compared with their corresponding TFS samples. E. coli was detected in 46% (6/13) of WT samples that were negative for the corresponding TFSs. These results indicated that tankers are not disinfected and/or cleaned regularly. A similar result was obtained in Lebanon, where eight tankers had higher concentrations of fecal coliforms than their water sources [28].
High positive ratios for the potential indicators of pathogenic viruses, PMMoV and TMV, in TFS and WT samples indicated that other water-transmitted viral pathogens, such as astroviruses and hepatitis A and E viruses, could be present, for which testing was not performed in this study. Group A rotaviruses, which are the major causative agent of gastroenteritis in Nepal [29,30,31], were detected in 10% (3/30) of WT samples. Previous studies have reported the detection of pathogenic viruses—such as AiV-1, EVs, HAdVs, NoVs-GI, NoVs-GII, and RVAs—in groundwater and river water in the valley, which are the major sources of tanker water [1,13,14,32,33]. A tap water sample supplied by a tanker in the valley was found to be contaminated with pathogens, including HAdVs and Vibrio cholerae, further indicating the unsuitability of tanker water for drinking purposes [11]. In addition, NoVs-GI and HAdVs were also detected in two and one samples, respectively, out of five water tankers sampled in the valley, and enteric viruses were found to be responsible for gastroenteritis in children suffering from diarrhea [33]. A previous study reported a high risk of diarrheal infections for consumers of raw vegetables washed with tanker water or other water sources in the valley [34]. High positive ratios of fecal indicator bacteria and pathogenic viruses in TFS samples show that the employed treatment systems were not sufficient to eliminate the pathogens tested.
When the possible sources of such pathogenic viruses and fecal indicator bacteria in these water samples were analyzed by an MST technique, 39% (12/31) and 14% (3/22) of water samples were judged to be contaminated with human and ruminant feces, respectively. The detection of ruminant fecal markers has been previously reported in tanker water [11]. This could be due to the use of groundwater and surface water by the TFSs, in which human and animal fecal contaminations have been reported [11,35,36]. A previous study reported the possible transmission of enteric viruses from feces to children consuming water from sources contaminated by these viruses [33]. The detection of pathogenic viruses and fecal markers in the same sample indicated that these viruses might have originated from the feces of humans and animals. The detection of the animal fecal markers, mostly in samples originating from the peri-urban areas of the valley, could be due to the land use pattern of those areas where agriculture and farming are commonly practiced [35]. In Cambodia, animals were found to be responsible for the fecal pollution of water sources in agricultural areas [37], and livestock ownership is significantly associated with water contamination in Ghana and Bangladesh [38]. These results indicate a high risk to public health, which requires immediate action for control and prevention of possible disease outbreaks.
Groundwater, a major source for tanker water in Nepal [6,9], is contaminated by human and animal feces [26,35]. Despite an effort to ban on the implementation of deep tube wells within a 200 m distance of riverbanks, some TFSs are still found near riverbanks. Mixing of river water with nearby groundwater has been previously reported [39]. These reasons may contribute to the poor microbial quality of tanker water. This study showed that an increase in the concentrations of free and combined chlorine was associated with decreased concentrations of E. coli in WT samples, suggesting that chlorine application could be one of the measures used to lower the concentration of E. coli in WTs.
In conclusion, this study reports that the water supplied to the TFSs and WTs to the public are contaminated with fecal indicator bacteria and pathogenic viruses. This study also highlighted the use of host-associated Bacteroidales, mtDNA, and viral genetic markers to identify the sources of fecal pollution. The major source of microbial contamination was judged to be human feces, indicating that better infrastructure and management practices should be implemented. The increased microbial contamination present in WTs compared with that of TFS samples suggests the importance of regular cleaning and disinfection of the WTs.
4. Materials and Methods
4.1. Collection of Water Samples
Altogether, 31 TFS water samples were collected from 17 TFSs during the dry (March; n = 16) and wet (August; n = 15) seasons of 2016, and from 30 WTs during the dry (n = 17) and wet (n = 13) seasons of the same year. The water supplied by the tanker water treatment plants or TFSs to the tankers or the vehicles that carry water are referred to as TFS samples, and the water distributed by these vehicles to the public are referred to as WT samples. Water samples were collected in two 100 mL and five 1 L plastic bottles, which were washed with pure water prior to autoclaving, for each of the TFS and WT samples. Chlorine concentrations of WT samples were measured using a portable water analyzer colorimeter (HACH, Loveland, Co, USA). All samples were stored cold, transported to the laboratory, kept at 4 °C, and processed within 4 h.
4.2. Detection of Total Coliforms and E. coli
Total coliforms and E. coli were determined by the MPN method using a Colilert reagent (IDEXX Laboratories, Westbrook, CA, USA), as described previously [14,40].
4.3. Concentration and Extraction of Bacterial, mtDNA, and Viral Markers and Viruses
Bacterial and mtDNA were extracted using a CicaGeneus DNA Extraction Reagent (Kanto Chemical, Tokyo, Japan), as previously described [26,35]. Briefly, 100 mL of a water sample was filtered using a disposable filter unit preset with a nitrocellulose membrane (diameter, 47 mm; pore size, 0.22 µm; Nalgene, Tokyo, Japan). The filter membrane was transferred into a 50 mL tube and 5 mL of Tris–EDTA buffer (pH 7.4) was added. The resuspended sample was processed after repeated shaking and mixing by vortexing. A final volume of 300 μL of DNA extract was obtained by processing 160 µL of the resuspended sample with 20 µL of Buffer A and 200 µL of Buffer B.
An electronegative membrane-vortex method [41] was used as described previously with some modifications for virus concentration of the water samples [13,14,36]. Briefly, for the concentration step, 50 mL of 2.5 mol/L MgCl2 was added to the 5 L water sample and filtered using a mixed cellulose-ester membrane (pore size, 0.8 µm; diameter, 90 mm; Merck Millipore, Billerica, MA, USA). Filter membrane was removed from the filter holder and vigorous vortexing of the membrane was performed with elution buffer in a 50 mL plastic tube to recover an eluate (~15 mL), as mentioned previously [13,14]. Subsequently, the eluate was centrifuged at 2000 × g for 10 min at 4 °C, followed by filtration of supernatant using a disposable membrane filter unit (pore size, 0.45 µm; diameter, 25 mm; Advantec, Tokyo, Japan). Finally, the filtrate was further concentrated using a Centriprep YM-50 ultrafiltration device (Merck Millipore) to obtain a virus concentrate, following the manufacturer’s protocol. Viral DNA was extracted using a QIAamp DNA Mini Kit (QIAGEN, Hilden, Germany) from 200 µL of viral concentrate to obtain 200 µL of DNA extract. Similarly, a QIAamp Viral RNA Mini Kit (QIAGEN) was used to obtain a 60 µL RNA extract from 140 µL of viral concentrate, following the manufacturer’s protocol. Both DNA and RNA extractions were performed using a QIAcube automated platform (QIAGEN). Thirty microliters of viral RNA was subjected to reverse transcription using a High-Capacity cDNA Reverse Transcription Kit (Applied Biosystems, Foster City, CA, USA) to obtain 60 µL of cDNA.
4.4. Detection of Viruses and Fecal Markers
The effect of qPCR inhibition was evaluated in this study as recommended elsewhere [42]. Porcine teschovirus (PoTeVs), as a control, was inoculated into DNA extract and recovered by qPCR. For quantitative PCR (qPCR), 2.5 µL of template DNA/cDNA was added to a mixture of 22.5 µL containing 12.5 µL Probe qPCR Mix (Takara Bio, Kusatsu, Japan), 7.0 µL PCR-grade water, 1.0 µL each of 10 pmol/µL forward and reverse primers, and 1.0 µL of the 5 pmol/µL TaqMan (MGB) probe. Table 4 shows the sequences of primers and probes used in this study. For the quantification of genomes, a Thermal Cycler Dice Real Time System TP800 (Takara Bio) was used. The thermal cycle conditions for all the tested assays (BacHum [17], BacR [18], Pig2Bac [19], Bovine- and Swine-mtDNA [20], Dog-mtDNA [21], AiV-1 [43], BKPyVs and JCPyVs [44], ChkPVs [24], and PoAdVs [25]) were as follows: 95 °C for 30 s, followed by 45 cycles at 95 °C for 5 s, and 60 °C for 30 s, except for EVs [45,46], PMMoV [47,48], RVAs [49], and TMV [50] (60 °C for 60 s), HAdVs [51], NoVs-GI, and NoVs-GII [52] (58 °C for 30 s), and PoTeVs [53] (56 °C for 30 s). For the determination of the genome copy number of each virus, a standard curve was plotted using six 10-fold serial dilutions of artificially synthesized plasmid DNA containing the amplification region. The amplification efficiencies of standard curves ranged from 78% to 123%. The calculated mean efficiency of process control was 141 ± 32% (n = 30), suggesting that there was no inhibition during qPCR.
Table 4.
Primer and probe sequences used in this study.
In all qPCR runs, unknown and standard samples and negative controls were run in duplicate. A negative control was included in every run. The sample was judged positive if the respective marker was detected in at least one of the two wells with the threshold cycle value of ≤40.
4.5. Statistical Analysis
An independent t-test was used for the comparison of the E. coli concentrations between WT and TFS samples and for comparing the concentrations of E. coli in WT samples between dry and wet seasons. In addition, a paired t-test was used to compare the concentrations of E. coli between WT and corresponding TFS water samples. The detection frequencies of pathogenic viruses in TFS and WT samples were compared using χ2 and Fisher Exact tests. Similarly, the χ2 test was used for the comparison of the detection frequencies of human- and ruminant-associated markers in TFS samples. For negative samples, the one-tenth value of the limit of detection (1 MPN/100 mL for E. coli) was used. For statistical analyses, SPSS version 23 (IBM Corporation, Armonk, USA) was used, and values were considered significant at p < 0.05.
Author Contributions
B.M. conceived the design of the study, processed the samples, analyzed the results, and prepared a draft of the manuscript. R.G.S, S.T., D.B., and O.T. processed the samples. J.B.S. conceived the design of the study. E.H. conceived the design of the study, checked the analyzed results, and corrected the draft of the manuscript.
Funding
This study was supported by the Science and Technology Research Partnership for Sustainable Development (SATREPS) project entitled ‘Hydro-microbiological approach for the water security in Kathmandu Valley, Nepal’, and the Japan Society for the Promotion of Science (JSPS) through a Grant-in-Aid for Scientific Research (B) (grant number JP17H03332) and the Fund for the Promotion of Joint International Research (Fostering Joint International Research (B)) (grant number JP18KK0297).
Conflicts of Interest
The authors declare no conflict of interest.
References
- Haramoto, E.; Yamada, K.; Nishida, K. Prevalence of protozoa, viruses, coliphages and indicator bacteria in groundwater and river water in the Kathmandu Valley, Nepal. Trans. R. Soc. Trop. Med. Hyg. 2011, 105, 711–716. [Google Scholar] [CrossRef] [PubMed]
- Shrestha, S.; Malla, S.S.; Aihara, Y.; Kondo, N.; Nishida, K. Water Quality at supply source and point of use in Kathmandu Valley. JWET 2013, 11, 331–340. [Google Scholar] [CrossRef]
- Guragai, B.; Takizawa, S.; Hashimoto, T.; Oguma, K. Effects of inequality of supply hours on consumers’ coping strategies and perceptions of intermittent water supply in Kathmandu Valley, Nepal. Sci. Total Environ. 2017, 599–600, 431–441. [Google Scholar] [CrossRef] [PubMed]
- KUKL. KUKL 9th Annual Report; Kathmandu Upatyaka Khanepani Limited: Kathmandu, Nepal, 2017. [Google Scholar]
- Shrestha, S.; Aihara, Y.; Bhattarai, A.P.; Bista, N.; Rajbhandari, S.; Kondo, N.; Kazama, F.; Nishida, K.; Shindo, J. Dynamics of domestic water consumption in the urban area of the Kathmandu Valley: Situation analysis pre and post 2015 Gorkha Earthquake. Water 2017, 9, 222. [Google Scholar] [CrossRef]
- Dongol, R.; Kansakar, L.K.; Bajimaya, S.; Maharjan, S.; Shrestha, D. Overview of water markets in the Kathmandu Valley. In Kathmandu Valley Groundwater Outlook; Shrestha, S., Pradhananga, D., Pandey, V.P., Eds.; SEN: Kathmandu, Nepal; CREEW: Kathmandu, Nepal; ICRE-UY: Yamanashi, Japan; Asian Institute of Technology: Pathum Thani, Thailand, 2012; pp. 100–111. ISBN 978-9937-2-4442-8. [Google Scholar]
- Kejjlen, M.; Mcgranahan, G. Informal Water Vendors and the Urban Poor Human Settlements Discussion Paper Series; International Institute for Environment and Development: London, UK, 2006. [Google Scholar]
- World Health Organization (WHO); United Nations Children’s Fund (UNICEF). Core Questions on Drinking-water and Sanitation for Household Surveys; WHO: Geneva, Switzerland; UNICEF: Geneva, Switzerland, 2006; p. 125. [Google Scholar]
- Pandey, V.P.; Chapagain, S.K.; Shrestha, D.; Shrestha, S.; Kazama, F. Groundwater Markets for Domestic Water Use in Kathmandu Valley: An Analysis of Its Characteristics, Impacts and Regulations. Available online: https://www.academia.edu/11198401/Groundwater_markets_for_domestic_water_use_in_Kathmandu_Valley_an_analysis_of_its_characteristics_impacts_and_regulations (accessed on 13 May 2019).
- Shrestha, D. State and Services of Private Water Tanker Operation in Kathmandu. Unpublished M.Sc. Thesis, Nepal Engineering College, Pokhara University, Changunarayan, Nepal, 2011. [Google Scholar]
- Haramoto, E. Detection of waterborne protozoa, viruses, and bacteria in groundwater and other water samples in the Kathmandu Valley, Nepal. IOP Conf. Ser. Earth Environ. Sci. 2018, 120, 012004. [Google Scholar] [CrossRef]
- Maharjan, S.; Joshi, T.P.; Shrestha, S.J. Poor quality of treated water in Kathmandu: Comparison with Nepal drinking water quality standards. Tribhuvan Univ. J. Microbiol. 2018, 5, 83–88. [Google Scholar] [CrossRef]
- Shrestha, S.; Shrestha, S.; Shindo, J.; Sherchand, J.B.; Haramoto, E. Virological quality of irrigation water sources and pepper mild mottle virus and tobacco mosaic virus as index of pathogenic virus contamination level. Food Environ. Virol. 2018, 10, 107–120. [Google Scholar] [CrossRef] [PubMed]
- Tandukar, S.; Sherchand, J.B.; Bhandari, D.; Sherchan, S.; Malla, B.; Ghaju Shrestha, R.; Haramoto, E. Presence of human enteric viruses, protozoa, and indicators of pathogens in the Bagmati River, Nepal. Pathogens 2018, 7, 38. [Google Scholar] [CrossRef]
- Harwood, V.J.; Staley, C.; Badgley, B.D.; Borges, K.; Korajkic, A. Microbial source tracking markers for detection of fecal contamination in environmental waters: Relationships between pathogens and human health outcomes. FEMS. Microbiol. Rev. 2014, 38, 1–40. [Google Scholar] [CrossRef]
- Haramoto, E.; Osada, R. Assessment and application of host-specific Bacteroidales genetic markers for microbial source tracking of river water in Japan. PLoS ONE 2018, 13, e0207727. [Google Scholar] [CrossRef]
- Kildare, B.J.; Leutenegger, C.M.; McSwain, B.S.; Bambic, D.G.; Rajal, V.B.; Wuertz, S. 16S rRNA-based assays for quantitative detection of universal, human-, cow-, and dog-specific fecal Bacteroidales: A Bayesian approach. Water Res. 2007, 41, 3701–3715. [Google Scholar] [CrossRef] [PubMed]
- Reischer, G.H.; Kasper, D.C.; Steinborn, R.; Mach, R.L.; Farnleitner, A.H. Quantitative PCR method for sensitive detection of ruminant fecal pollution in freshwater and evaluation of this method in alpine karstic regions. Appl. Environ. Microbiol. 2006, 72, 5610–5614. [Google Scholar] [CrossRef] [PubMed]
- Mieszkin, S.; Furet, J.P.; Corthier, G.; Gourmelon, M. Estimation of pig fecal contamination in a river catchment by real-time PCR using two Pig-Specific Bacteroidales 16S rRNA genetic markers. Appl. Environ. Microbiol. 2009, 75, 3045–3054. [Google Scholar] [CrossRef] [PubMed]
- Caldwell, J.M.; Raley, M.E.; Levine, J.F. Mitochondrial multiplex real-time PCR as a source tracking method in fecal-contaminated effluents. Environ. Sci. Technol. 2007, 41, 3277–3283. [Google Scholar] [CrossRef] [PubMed]
- Caldwell, J.M.; Levine, J.F. Domestic wastewater influent profiling using mitochondrial real-time PCR for source tracking animal contamination. J. Microbiol. Methods 2009, 77, 17–22. [Google Scholar] [CrossRef] [PubMed]
- Fong, T.T.; Lipp, E.K. Enteric viruses of humans and animals in aquatic environments: Health risks, detection, and potential water quality assessment tools. Microbiol. Mol. Biol. Rev. 2005, 69, 357–371. [Google Scholar] [CrossRef] [PubMed]
- Albinana-Gimenez, N.; Clemente-Casares, P.; Bofill-Mas, S.; Hundesa, A.; Ribas, F.; Girones, R. Distribution of human polyomaviruses, adenoviruses, and hepatitis E virus in the environment and in a drinking-water treatment plant. Environ. Sci. Technol. 2006, 40, 7416–7422. [Google Scholar] [CrossRef] [PubMed]
- Carratalà, A.; Rusinol, M.; Hundesa, A.; Biarnes, M.; Rodriguez-Manzano, J.; Vantarakis, A.; Kern, A.; Suñen, E.; Girones, R.; Bofill-Mas, S. A novel tool for specific detection and quantification of chicken/turkey parvoviruses to trace poultry fecal contamination in the environment. App. Environ. Microbiol. 2012, 78, 7496–7499. [Google Scholar] [CrossRef] [PubMed]
- Hundesa, A.; Maluquer de Motes, C.; Albinana-Gimenez, N.; Rodriguez-Manzano, J.; Bofill-Mas, S.; Suñen, E.; Rosina Girones, R. Development of a qPCR assay for the quantification of porcine adenoviruses as an MST tool for swine fecal contamination in the environment. J. Virol. Methods 2009, 158, 130–135. [Google Scholar] [CrossRef] [PubMed]
- Malla, B.; Ghaju Shrestha, R.; Tandukar, S.; Bhandari, D.; Inoue, D.; Sei, K.; Tanaka, Y.; Sherchand, J.B.; Haramoto, E. Validation of host-specific Bacteroidales quantitative PCR assays and their application to microbial source tracking of drinking water sources in the Kathmandu Valley, Nepal. J. Appl. Microbiol. 2018, 125, 609–619. [Google Scholar] [CrossRef] [PubMed]
- World Health Organization (WHO). Guidelines for Drinking-Water Quality, 4th ed.; WHO: Geneva, Switzerland, 2011. [Google Scholar]
- Constantine, K.; Massoud, M.; Alameddine, I.; El-Fadel, M. The role of water tankers market in water stressed semi-arid urban areas: Implications on water quality and economic burden. J. Environ. Manag. 2017, 188, 85–94. [Google Scholar] [CrossRef] [PubMed]
- Kurokawa, M.; Ono, K.; Nukina, M.; Itoh, M.; Thapa, U.; Rai, S.K. Detection of diarrheagenic viruses from diarrheal fecal samples collected from children in Kathmandu, Nepal. Nepal Med. Coll. J. 2004, 6, 17–23. [Google Scholar] [PubMed]
- Sherchand, J.B.; Schluter, W.W.; Sherchan, J.B.; Tandukar, S.; Dhakwa, J.R.; Choudhary, G.R.; Mahaseth, C. Prevalence of group A genotype human rotavirus among children with diarrhoea in Nepal, 2009–2011. WHO South-East Asia J. Public Health 2012, 1, 432–440. [Google Scholar] [CrossRef] [PubMed]
- Ansari, S.; Sherchand, J.B.; Rijal, B.P.; Parajuli, K.; Mishra, S.K.; Dahal, R.K.; Shrestha, S.; Tandukar, S.; Chaudhary, R.; Kattel, H.P.; et al. Characterization of rotavirus causing acute diarrhoea in children in Kathmandu, Nepal, showing the dominance of serotype G12. J. Med. Microbiol. 2013, 62, 114–120. [Google Scholar] [CrossRef] [PubMed]
- Haramoto, E.; Kitajima, M. Quantification and genotyping of aichi virus 1 in water samples in the Kathmandu Valley, Nepal. Food Environ. Virol. 2017, 9, 350–353. [Google Scholar] [CrossRef] [PubMed]
- Tandukar, S.; Sherchand, J.B.; Karki, S.; Malla, B.; Ghaju Shrestha, R.; Bhandari, D.; Thakali, O.; Haramoto, E. Co-Infection by Waterborne Enteric Viruses in Children with Gastroenteritis in Nepal. Healthcare 2019, 7, 9. [Google Scholar] [CrossRef]
- Shrestha, S.; Haramoto, E.; Shindo, J. Assessing the infection risk of enteropathogens from consumption of raw vegetables washed with contaminated water in Kathmandu Valley, Nepal. J. Appl. Microbiol. 2017, 123, 1321–1334. [Google Scholar] [CrossRef]
- Malla, B.; Ghaju Shrestha, R.; Tandukar, S.; Bhandari, D.; Inoue, D.; Sei, K.; Tanaka, Y.; Sherchand, J.B.; Haramoto, E. Identification of human and animal fecal contamination in drinking water sources in the Kathmandu Valley, Nepal, using host-associated Bacteroidales quantitative PCR assays. Water 2018, 10, 1796. [Google Scholar] [CrossRef]
- Malla, B.; Ghaju Shrestha, R.; Tandukar, S.; Sherchand, J.B.; Haramoto, E. Performance evaluation of human-specific viral markers and application of pepper mild mottle virus and crAssphage to environmental water samples as fecal pollution markers in the Kathmandu Valley, Nepal. Food Environ. Virol. 2019. [Google Scholar] [CrossRef]
- Uy, D.; Haka, S.; Huya, C.; Srey, M.; Chunhieng, T.; Phoeurng, S.; Nasir, H.M.; Fredricks, D. Comparison of tube-well and dug-well groundwater in the arsenic polluted areas in Cambodia. In Southeast Asian Water Environment 4; Fukusi, K., Kurisu, F., Oguma, K., Furumai, H., Fontanos, P., Eds.; International Water Association Publishing: London, UK, 2010. [Google Scholar]
- Ferguson, A.S.; Mailloux, B.J.; Ahmed, K.M.; Van Geen, A.; McKay, L.D.; Culligan, P.J. Hand-pumps as reservoirs for microbial contamination of well water. J. Water Health 2011, 9, 708–717. [Google Scholar] [CrossRef]
- Bajracharya, R.; Nakamura, T.; Shakya, B.M.; Kei, N.; Shrestha, S.D.; Tamrakar, N.K. Identification of river water and groundwater interaction at central part of the Kathmandu valley, Nepal using stable isotope tracers. Int. J. Adv. Sci. Tech. Res. 2018, 8, 29–41. [Google Scholar] [CrossRef]
- Ghaju Shrestha, R.; Tanaka, Y.; Malla, B.; Bhandari, D.; Tandukar, S.; Inoue, D.; Sei, K.; Sherchand, J.B.; Haramoto, E. Next-generation sequencing identification of pathogenic bacterial genes and their relationship with fecal indicator bacteria in different water sources in the Kathmandu Valley, Nepal. Sci. Total Environ 2017, 601–602, 278–284. [Google Scholar] [CrossRef] [PubMed]
- Haramoto, E.; Katayama, H.; Asami, M.; Akiba, M. Development of a novel method for simultaneous concentration of viruses and protozoa from a single water sample. J. Virol. Methods 2012, 182, 62–69. [Google Scholar] [CrossRef] [PubMed]
- Haramoto, E.; Kitajima, M.; Hata, A.; Torrey, J.R.; Masago, Y.; Sano, D.; Katayama, H. A review on recent progress in the detection methods and prevalence of human enteric viruses in water. Water Res. 2018, 135, 168–186. [Google Scholar] [CrossRef] [PubMed]
- Kitajima, M.; Hata, A.; Yamashita, T.; Haramoto, E.; Minagawa, H.; Katayama, H. Development of a reverse transcription-quantitative PCR system for detection and genotyping of aichi viruses in clinical and environmental samples. Appl. Environ. Microbiol. 2013, 79, 3952–3958. [Google Scholar] [CrossRef] [PubMed]
- Pal, A.; Sirota, L.; Maudru, T.; Peden, K.; Lewis, A.M. Realtime, quantitative PCR assays for the detection of virus-specific DNA in samples with mixed populations of polyomaviruses. J. Virol. Methods 2006, 135, 32–42. [Google Scholar] [CrossRef] [PubMed]
- Shieh, Y.S.; Wait, D.; Tai, L.; Sobsey, M.D. Methods to remove inhibitors in sewage and other fecal wastes for enterovirus detection by the polymerase chain reaction. J. Virol. Methods 1995, 54, 51–66. [Google Scholar] [CrossRef]
- Katayama, H.; Shimasaki, A.; Ohgaki, S. Development of a virus concentration method and its application to detection of enterovirus and norwalk virus from coastal seawater. Appl. Environ. Microbiol. 2002, 68, 1033–1039. [Google Scholar] [CrossRef]
- Zhang, T.; Breitbart, M.; Lee, W.H.; Run, J.-Q.; Wei, C.L.; Soh, S.W.L.; Hibberd, M.L.; Liu, E.T.; Rohwer, F.; Ruan, Y. RNA viral community in human feces: Prevalence of plant pathogenic viruses. PLoS Biol. 2005, 4, 108–118. [Google Scholar] [CrossRef]
- Haramoto, E.; Kitajima, M.; Kishida, N.; Konno, Y.; Katayama, H.; Asami, M.; Akiba, M. Occurrence of pepper mild mottle virus in drinking water sources in Japan. Appl. Environ. Microbiol. 2013, 79, 7413–7418. [Google Scholar] [CrossRef]
- Jothikumar, N.; Kang, G.; Hill, V.R. Broadly reactive TaqMan assay for real-time RT-PCR detection of rotavirus in clinical and environmental samples. J. Virol. Methods 2009, 155, 126–131. [Google Scholar] [CrossRef] [PubMed]
- Balique, F.; Colson, P.; Barry, A.O.; Nappez, C.; Ferretti, A.; Al Moussawi, K.; Ngounga, T.; Lepidi, H.; Ghigo, E.; Mege, J.-L.; et al. Tobacco mosaic virus in the lungs of mice following intra-tracheal inoculation. PLoS ONE 2013, 8, e54993. [Google Scholar] [CrossRef] [PubMed]
- Heim, A.; Ebnet, C.; Harste, G.; Pring-Åkerblom, P. Rapid and quantitative detection of human adenovirus DNA by real-time PCR. J. Med. Virol. 2003, 70, 228–239. [Google Scholar] [CrossRef] [PubMed]
- Kageyama, T.; Kojima, S.; Shinohara, M.; Uchida, K.; Fukushi, S.; Hoshino, F.B.; Takeda, N.; Katayama, K. Broadly reactive and highly sensitive assay for Norwalk-like viruses based on real-time quantitative reverse transcription-PCR. J. Clin. Microbiol. 2003, 41, 1548–1557. [Google Scholar] [CrossRef] [PubMed]
- Jimenez-Clavero, M.A.; Fernadez, C.; Ortiz, J.A.; Pro, J.; Carbonell, G.; Tarazona, J.V.; Roblas, N.; Ley, V. Teschoviruses as indicators of porcine fecal contamination of surface water. App. Environ. Microbiol. 2003, 69, 6311–6315. [Google Scholar] [CrossRef] [PubMed]


© 2019 by the authors. Licensee MDPI, Basel, Switzerland. This article is an open access article distributed under the terms and conditions of the Creative Commons Attribution (CC BY) license (http://creativecommons.org/licenses/by/4.0/).