Epidemiological Trends, Statistical Correlations, and Forecasting of Notifiable Infectious Diseases in South Korea, 2001–2024: A Regression and Time Series Analysis with Projections to 2028


Abstract
1. Introduction
2. Materials and Methods
2.1. Data Sources
2.2. Statistical Analysis
3. Results
3.1. Long-Term Trend in Total Notifications
3.2. Class-Specific Trends and Objectively Estimated Structural Break
3.3. Inter-Class Associations: Distinguishing Genuine Associations from Shared Co-Trending
3.4. Age-Stratified Class 1 Burden
3.5. Time-Series Forecasting of the Pre-COVID Trajectory
3.6. Regional Heterogeneity in Incidence Rates
4. Discussion
4.1. Public Health Prevention Applications
4.2. Strengths and Limitations
5. Conclusions
Supplementary Materials
Author Contributions
Funding
Institutional Review Board Statement
Informed Consent Statement
Data Availability Statement
Conflicts of Interest
References
- Korea Disease Control and Prevention Agency (KDCA). Infectious Disease Statistics System. Available online: https://dportal.kdca.go.kr (accessed on 20 June 2026).
- Infectious Disease Control and Prevention Act, Republic of Korea. Act No. 19219. 2023. Available online: https://www.law.go.kr (accessed on 20 June 2026).
- Chang, T.; Cho, S.; Yoo, D.; Min, K.D. Trends in nationally notifiable infectious diseases in humans and animals during COVID-19 pandemic, South Korea. Emerg. Infect. Dis. 2024, 30, 1154–1163. [Google Scholar] [CrossRef] [Scilit] [PubMed]
- World Health Organization. World Health Statistics 2024: Monitoring Health for the SDGs, Sustainable Development Goals; WHO: Geneva, Switzerland, 2024; Available online: https://www.who.int/publications/i/item/9789240094703 (accessed on 20 June 2026).
- Cheng, V.C.C.; Wong, S.C.; To, K.K.W.; Ho, P.L.; Yuen, K.Y. Preparedness and proactive infection control measures against the emerging novel coronavirus in China. J. Hosp. Infect. 2020, 104, 254–255. [Google Scholar] [CrossRef] [Scilit] [PubMed]
- Baker, M.G.; Kvalsvig, A.; Verrall, A.J. New Zealand’s COVID-19 elimination strategy. Med. J. Aust. 2020, 213, 198–200.e1. [Google Scholar] [CrossRef] [Scilit] [PubMed]
- Yoo, H.S.; Park, O.; Park, H.K.; Lee, E.G.; Jeong, E.K.; Lee, J.K.; Cho, S.I. Timeliness of national notifiable diseases surveillance system in Korea: A cross-sectional study. BMC Public Health 2009, 9, 93. [Google Scholar] [CrossRef] [Scilit] [PubMed]
- Kim, S.; Kim, J.; Choi, B.Y.; Park, B. Trends in gastrointestinal infections before and during non-pharmaceutical interventions in Korea in comparison with the United States. Epidemiol. Health 2022, 44, e2022011. [Google Scholar] [CrossRef] [Scilit] [PubMed]
- Park, J.Y.; Cho, S.Y.; Lee, J.; Lee, I.; Park, W.H.; Jeong, S.; Kim, S.; Lee, S.; Kim, J.; Park, O. Development and utilization of a rapid and accurate epidemic investigation support system for COVID-19. Osong Public Health Res. Perspect. 2020, 11, 118–127. [Google Scholar] [CrossRef] [Scilit] [PubMed]
- Jang, J.H.; Lee, J.H.; Je, M.K.; Cho, M.J.; Bae, Y.M.; Son, H.S.; Ahn, I. Correlations between the incidence of national notifiable infectious diseases and public open data, including meteorological factors and medical facility resources. J. Prev. Med. Public Health 2015, 48, 203–215. [Google Scholar] [CrossRef] [Scilit] [PubMed]
- Kim, S.O.; Kim, S.S. Recent (2011–2017) foodborne outbreak cases in the Republic of Korea compared to the United States: A review. Food Sci. Biotechnol. 2021, 30, 185–194. [Google Scholar] [CrossRef] [Scilit] [PubMed]
- Korea Disease Control and Prevention Agency (KDCA). 2023 Annual Report on Vaccination Coverage in Korea; KDCA: Cheongju, Republic of Korea, 2024. Available online: https://kdca.go.kr (accessed on 20 June 2026).
- Bai, J.; Perron, P. Computation and analysis of multiple structural change models. J. Appl. Econom. 2003, 18, 1–22. [Google Scholar] [CrossRef] [Scilit]
- Hyndman, R.J.; Athanasopoulos, G. Forecasting: Principles and Practice, 3rd ed.; OTexts: Melbourne, Australia, 2021; Available online: https://otexts.com/fpp3 (accessed on 20 June 2026).
- Bates, J.M.; Granger, C.W.J. The combination of forecasts. J. Oper. Res. Soc. 1969, 20, 451–468. [Google Scholar] [CrossRef] [Scilit]



| Year | Class 1 | Class 2 | Class 3 | Class 4 | Total | Rate * | YoY % | Note |
|---|---|---|---|---|---|---|---|---|
| Four-group system (gun), 2001–2019—Class 1: gastrointestinal; Class 2: respiratory/vaccine-preventable; Class 3: zoonotic/vector-borne/monitored; Class 4: emerging/imported | ||||||||
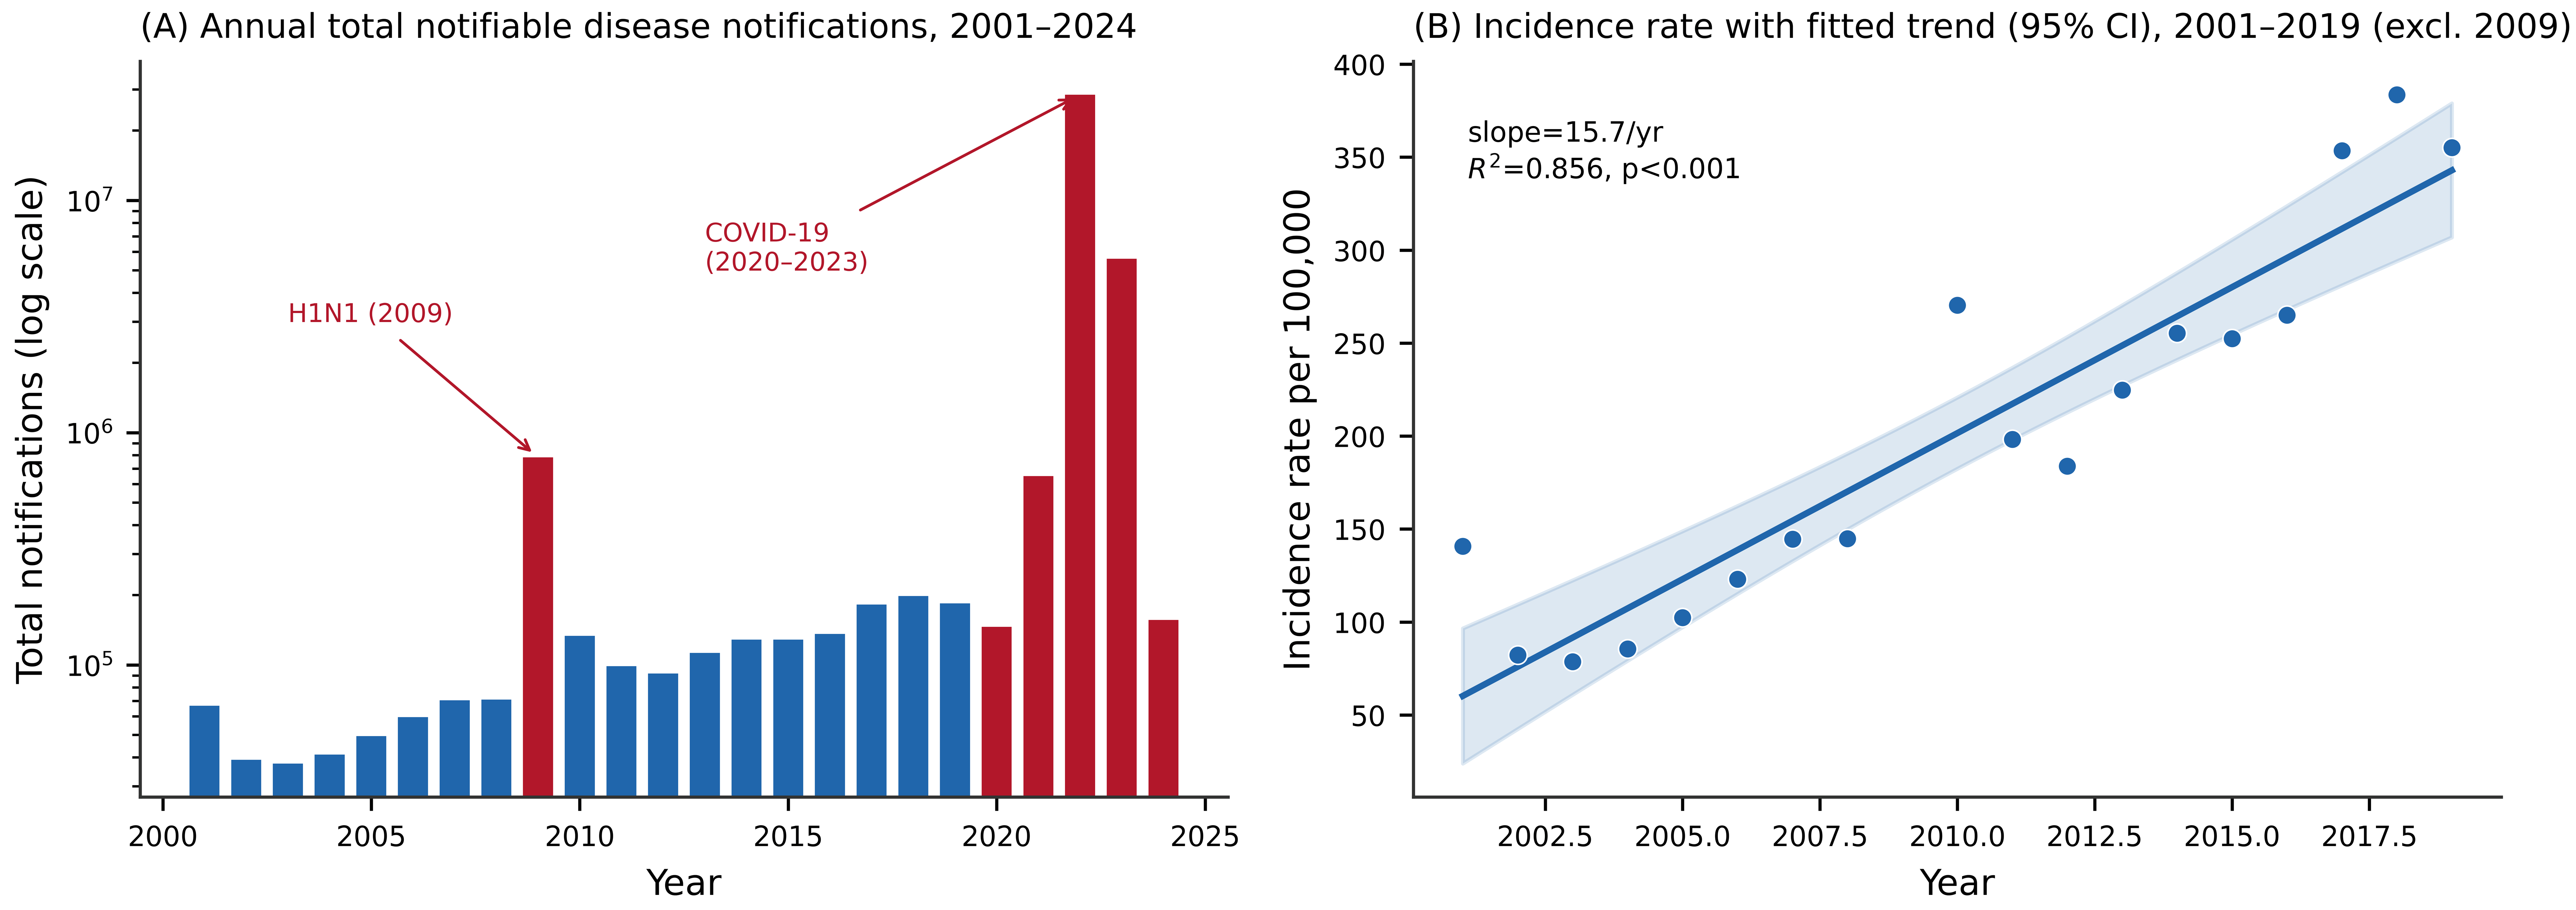
| 2001 | 1537 | 24,874 | 40,298 | 6 | 66,715 | 140.7 | ||
| 2002 | 1413 | 881 | 36,801 | 10 | 39,105 | 82.2 | −41.4% | |
| 2003 | 1457 | 1573 | 34,614 | 17 | 37,661 | 78.6 | −3.7% | |
| 2004 | 834 | 1787 | 38,508 | 21 | 41,150 | 85.6 | +9.3% | |
| 2005 | 597 | 3844 | 44,990 | 36 | 49,467 | 102.4 | +20.2% | |
| 2006 | 681 | 13,189 | 45,753 | 42 | 59,665 | 123.0 | +20.6% | |
| 2007 | 447 | 25,099 | 44,759 | 111 | 70,416 | 144.6 | +18.0% | |
| 2008 | 504 | 27,454 | 42,912 | 71 | 70,941 | 144.8 | +0.7% | |
| 2009 | 446 | 31,738 | 43,585 | 706,985 | 782,754 | 1591.0 | +1003.4% | H1N1 |
| 2010 | 480 | 30,718 | 45,372 | 56,989 | 133,559 | 270.4 | −82.9% | |
| 2011 | 5970 | 44,275 | 48,388 | 84 | 98,717 | 198.2 | −26.1% | |
| 2012 | 1532 | 38,306 | 51,907 | 163 | 91,908 | 183.8 | −6.9% | |
| 2013 | 1435 | 57,969 | 53,124 | 314 | 112,842 | 224.8 | +22.8% | |
| 2014 | 1816 | 74,477 | 52,128 | 245 | 128,666 | 255.3 | +14.0% | |
| 2015 | 2128 | 73,957 | 52,050 | 561 | 128,696 | 252.3 | +0.0% | |
| 2016 | 5077 | 72,127 | 58,161 | 616 | 135,981 | 265.1 | +5.7% | |
| 2017 | 4875 | 98,308 | 78,271 | 588 | 182,042 | 353.5 | +33.9% | |
| 2018 | 3011 | 117,811 | 76,486 | 613 | 197,921 | 383.6 | +8.7% | |
| 2019 | 18,045 | 100,513 | 65,055 | 709 | 184,322 | 355.1 | −6.9% | |
| Four-grade system (geup), 2020–2024—reorganized by response level; NOT comparable to the group system above. Class labels denote grades (Grades 1–4) | ||||||||
| 2020 | 60,723 | 66,835 | 18,404 | — | 145,962 | 281.8 | −20.8% | COVID onset (Grade 1) |
| 2021 | 569,943 | 62,277 | 18,023 | — | 650,243 | 1257.7 | +345.5% | COVID peak (Grade 1) |
| 2022 | 0 | 28,483,417 | 16,674 | — | 28,500,091 | 55,232.7 | +4283.0% | COVID reclass. to Grade 2 |
| 2023 | 1 | 5,594,550 | 15,687 | — | 5,610,238 | 10,914.9 | −80.3% | COVID decline |
| 2024 | 0 | 138,174 | 18,076 | — | 156,250 | 305.2 | −97.2% | Post-COVID |
| Series/Pair | OLS Slope | SE | 95% CI | R2 | p |
|---|---|---|---|---|---|
| Total (excl. 2009) | 8344 | 821 | 6603 to 10,084 | 0.866 | <0.001 |
| Total (incl. 2009) | 7133 | 6862 | −7343 to 21,610 | 0.060 | 0.313 |
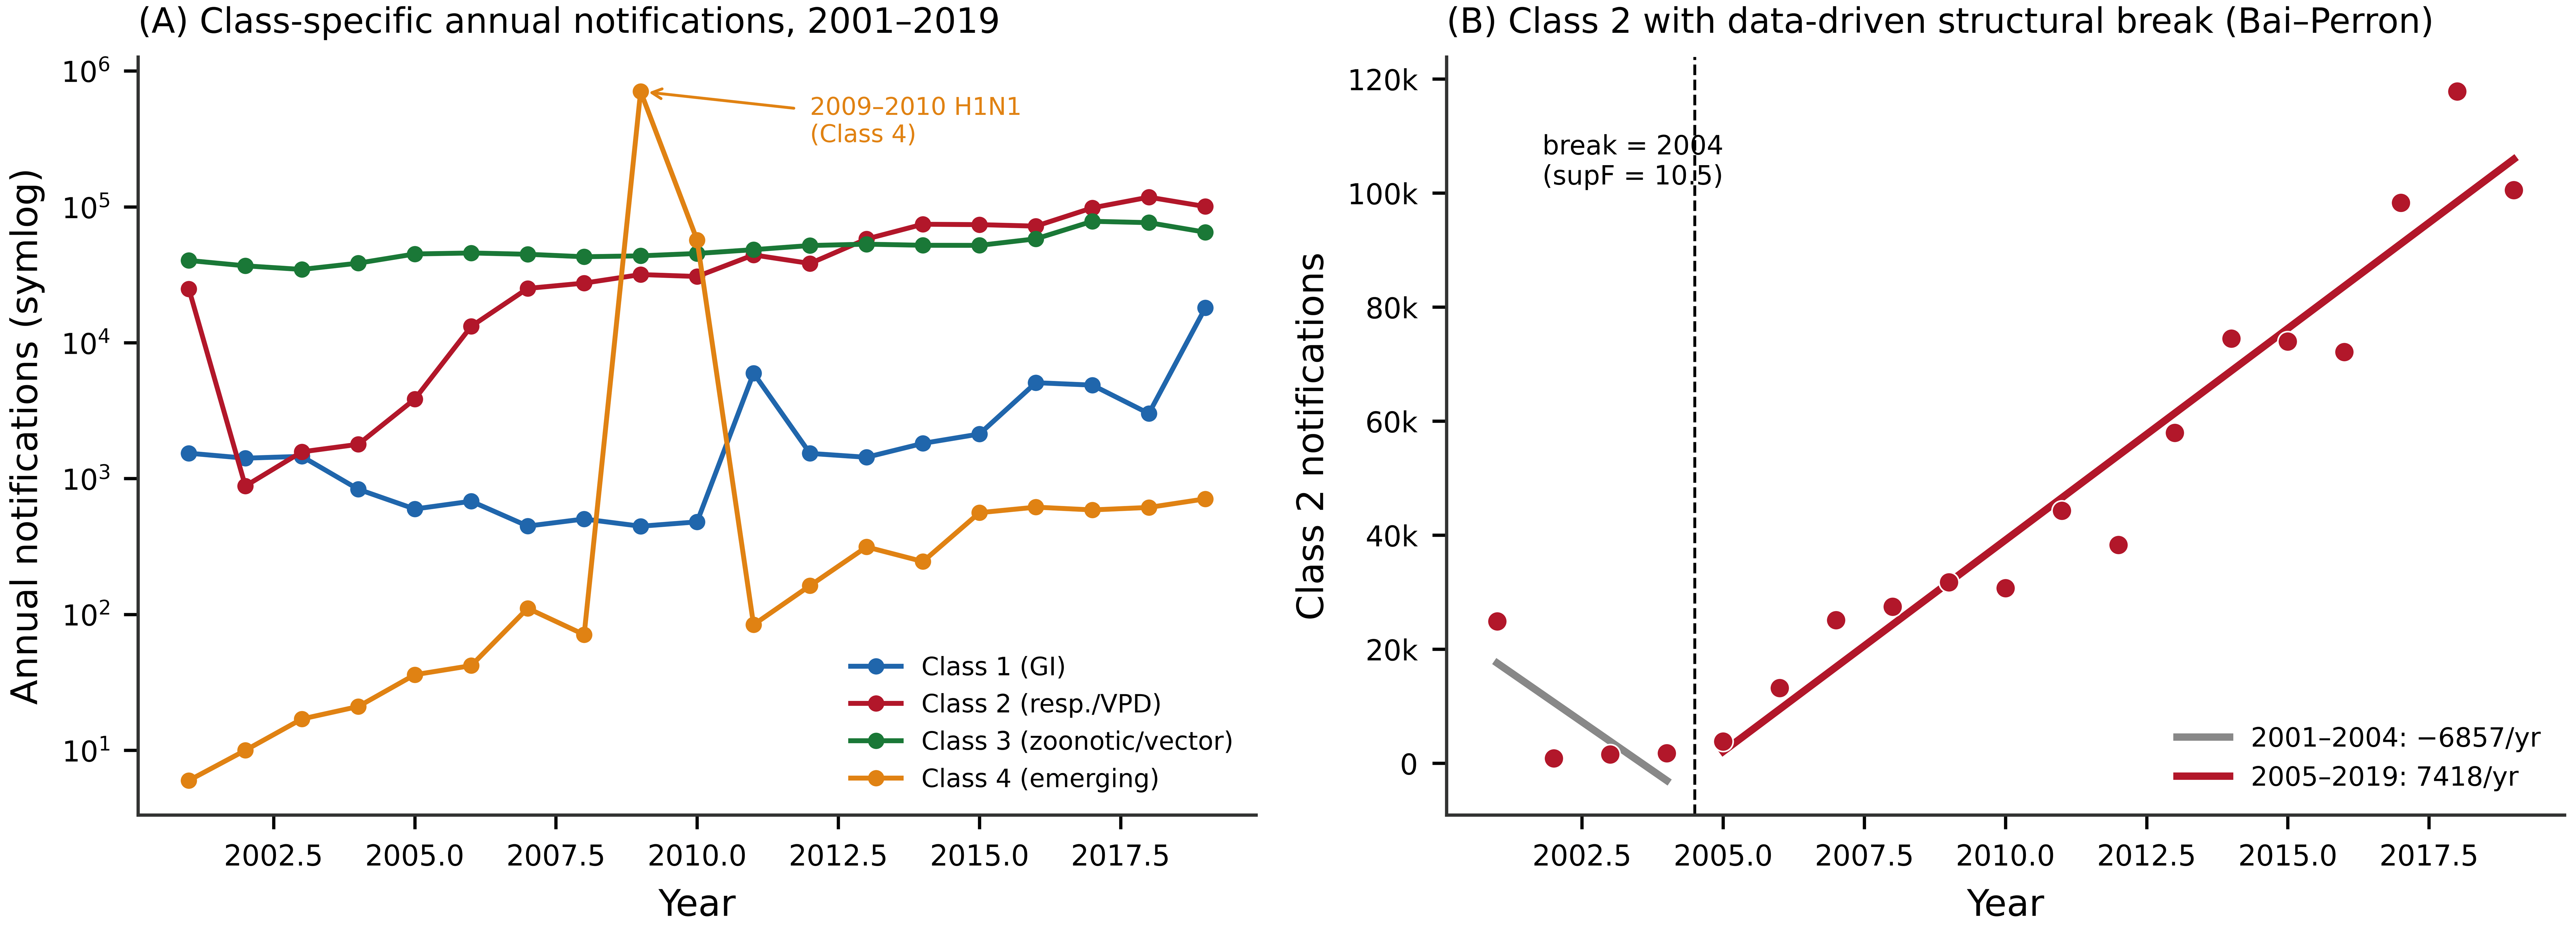
| Class 1 (gastrointestinal) | 410 | 144 | 105 to 714 | 0.322 | 0.011 |
| Class 2 (respiratory/VPD) | 6042 | 552 | 4877 to 7207 | 0.876 | <0.001 |
| Class 3 (zoonotic/monitored) | 1882 | 253 | 1348 to 2416 | 0.765 | <0.001 |
| Class 4 (excl. 2009–2010) | 40 | 5 | 30 to 50 | 0.837 | <0.001 |
| Class 2, early (2001–2004) | −6857 | 4221 | −25,018 to 11,304 | 0.569 | 0.246 |
| Class 2, growth (2005–2019) | 7418 | 538 | 6256 to 8580 | 0.936 | <0.001 |
| Negative-binomial APC (%/year) and inter-class correlations | |||||
| APC Total (excl. 2009) | 8.9% | — | 0.3 to 18.2 | — | 0.042 |
| APC Class 1 | 12.6% | — | 3.7 to 22.2 | — | 0.005 |
| APC Class 2 | 17.2% | — | 8.0 to 27.3 | — | <0.001 |
| APC Class 3 (NS) | 3.7% | — | −4.5 to 12.6 | — | 0.384 |
| APC Class 4 (excl. pandemic) | 28.9% | — | 18.6 to 40.1 | — | <0.001 |
| Pair (raw/partial/detrended) | Pearson r | p | Partial r (p) | Detrended r (p) | |
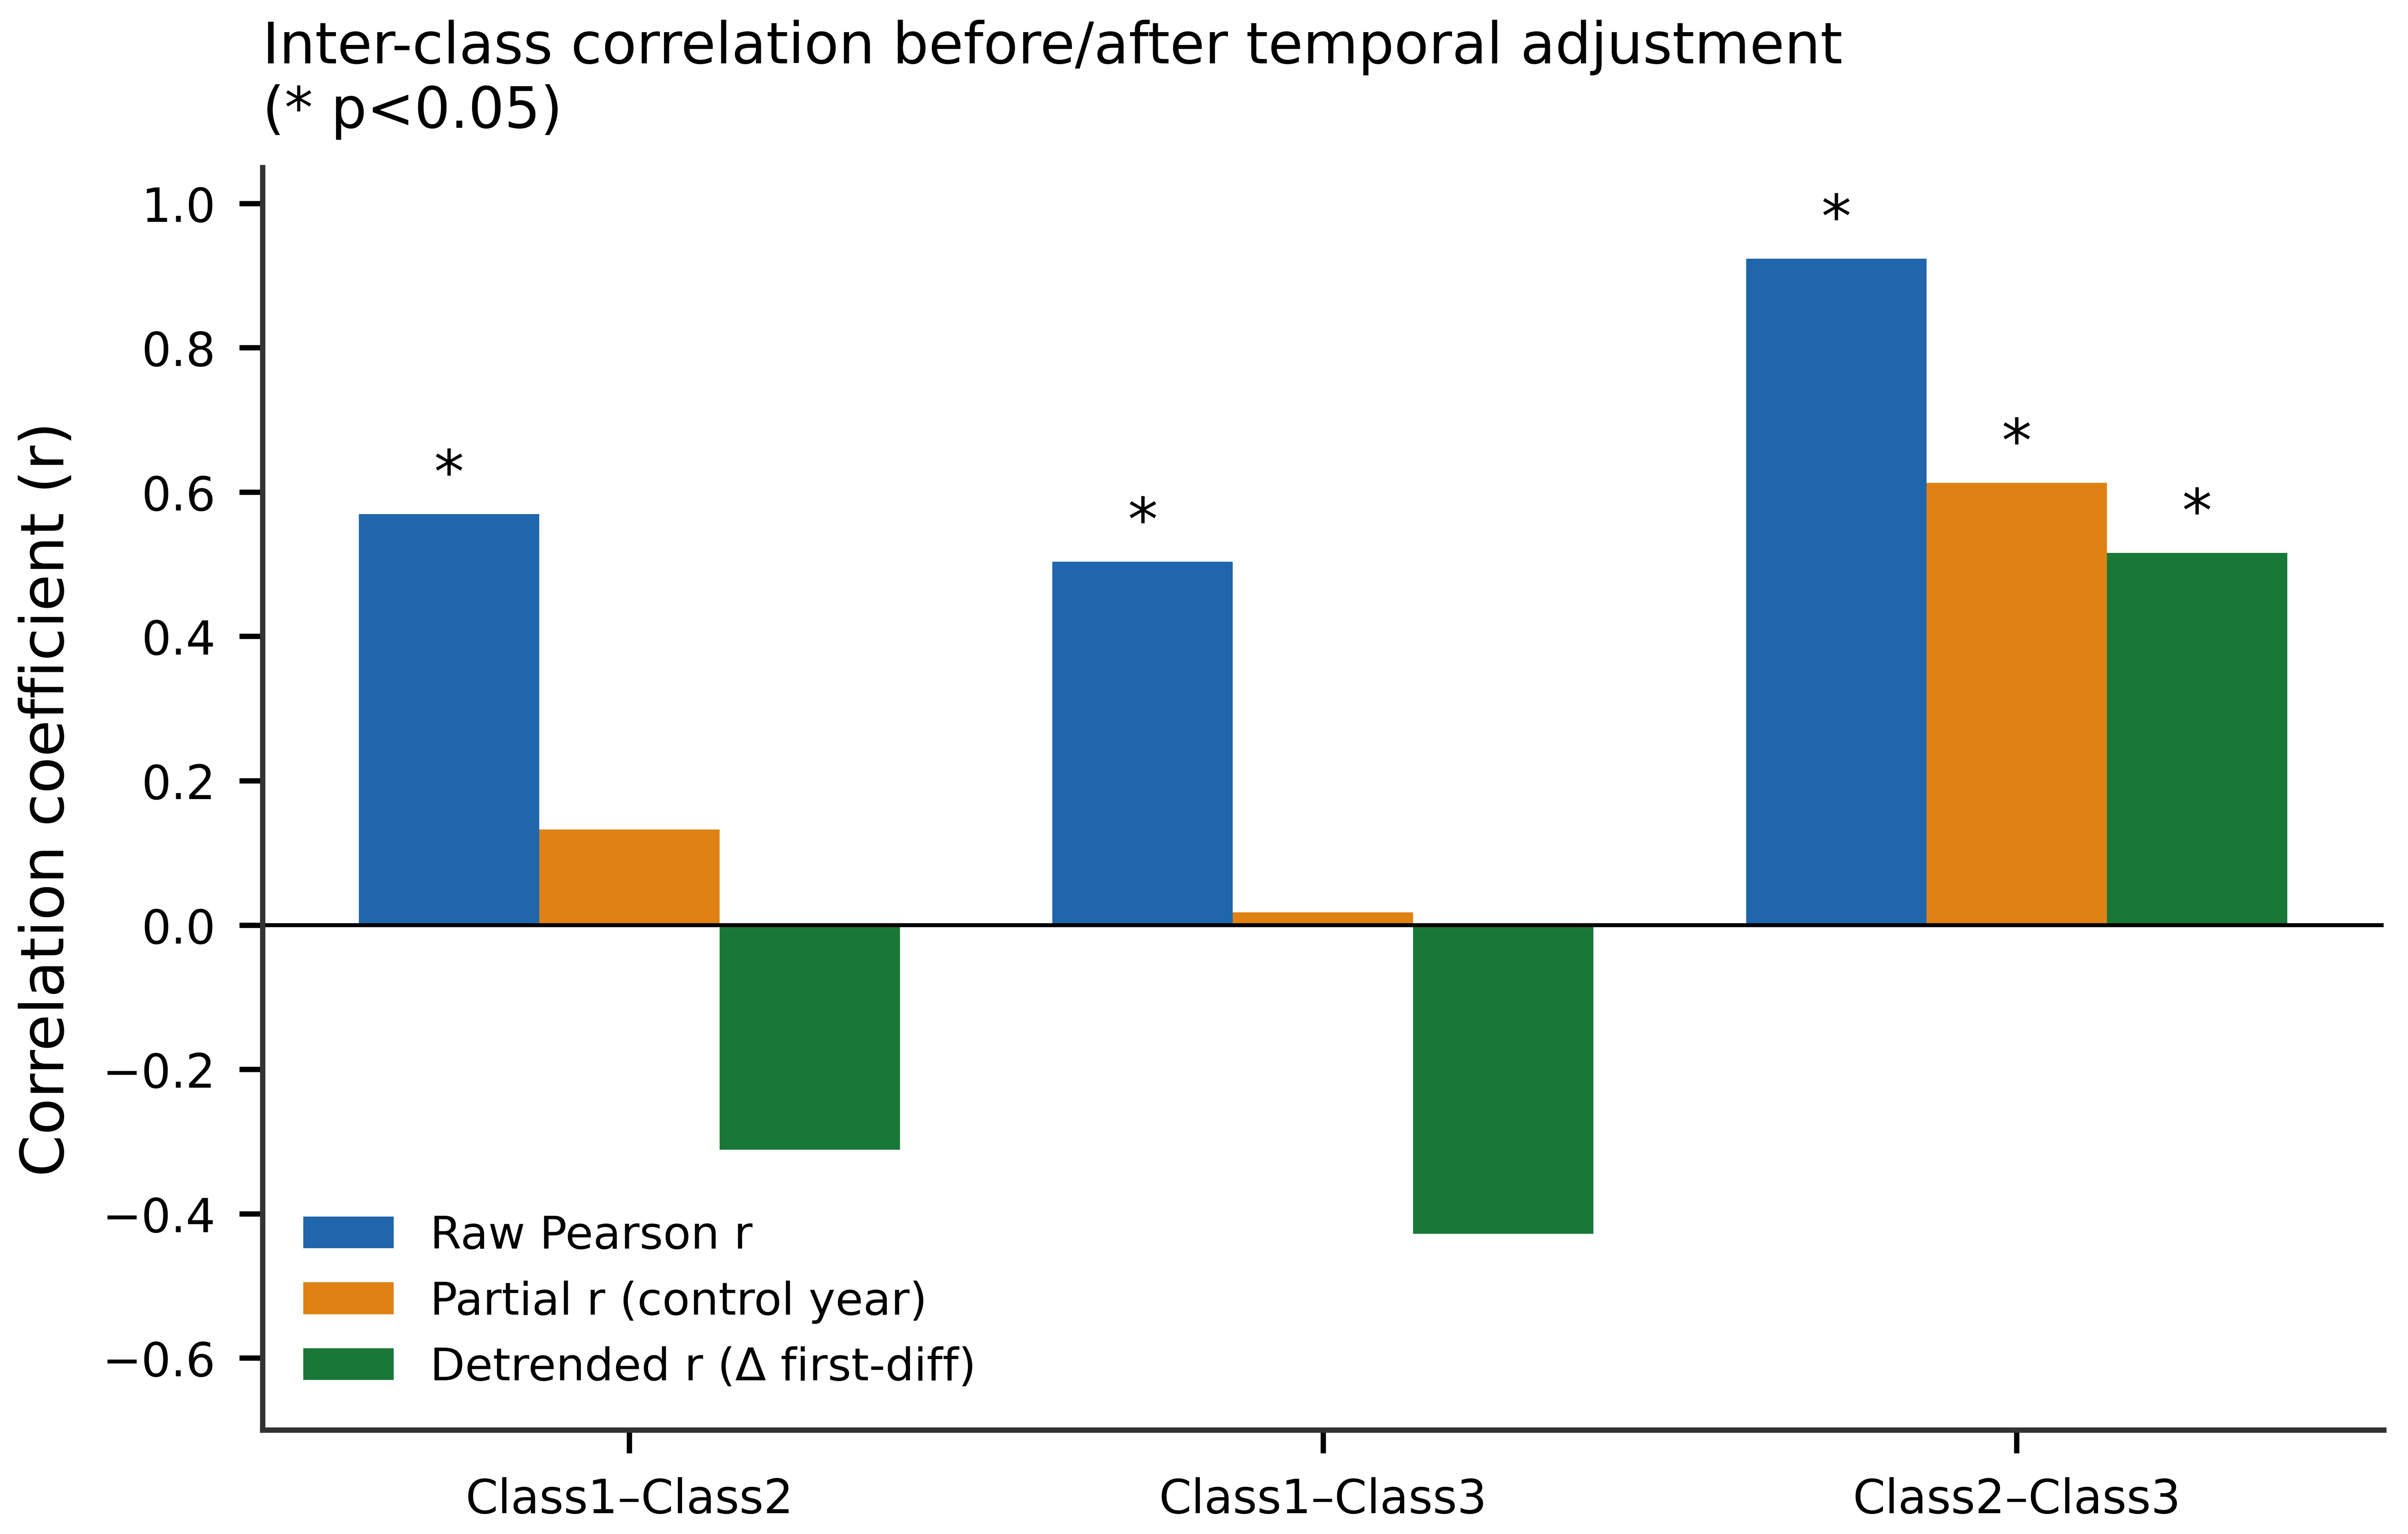
| Class 1–Class 2 (spurious) | 0.569 | 0.011 | 0.13 (0.589) | −0.31 (0.208) | |
| Class 1–Class 3 (spurious) | 0.503 | 0.028 | 0.02 (0.943) | −0.43 (0.076) | |
| Class 2–Class 3 (genuine) | 0.923 | <0.001 | 0.61 (0.005) | 0.52 (0.029) | |
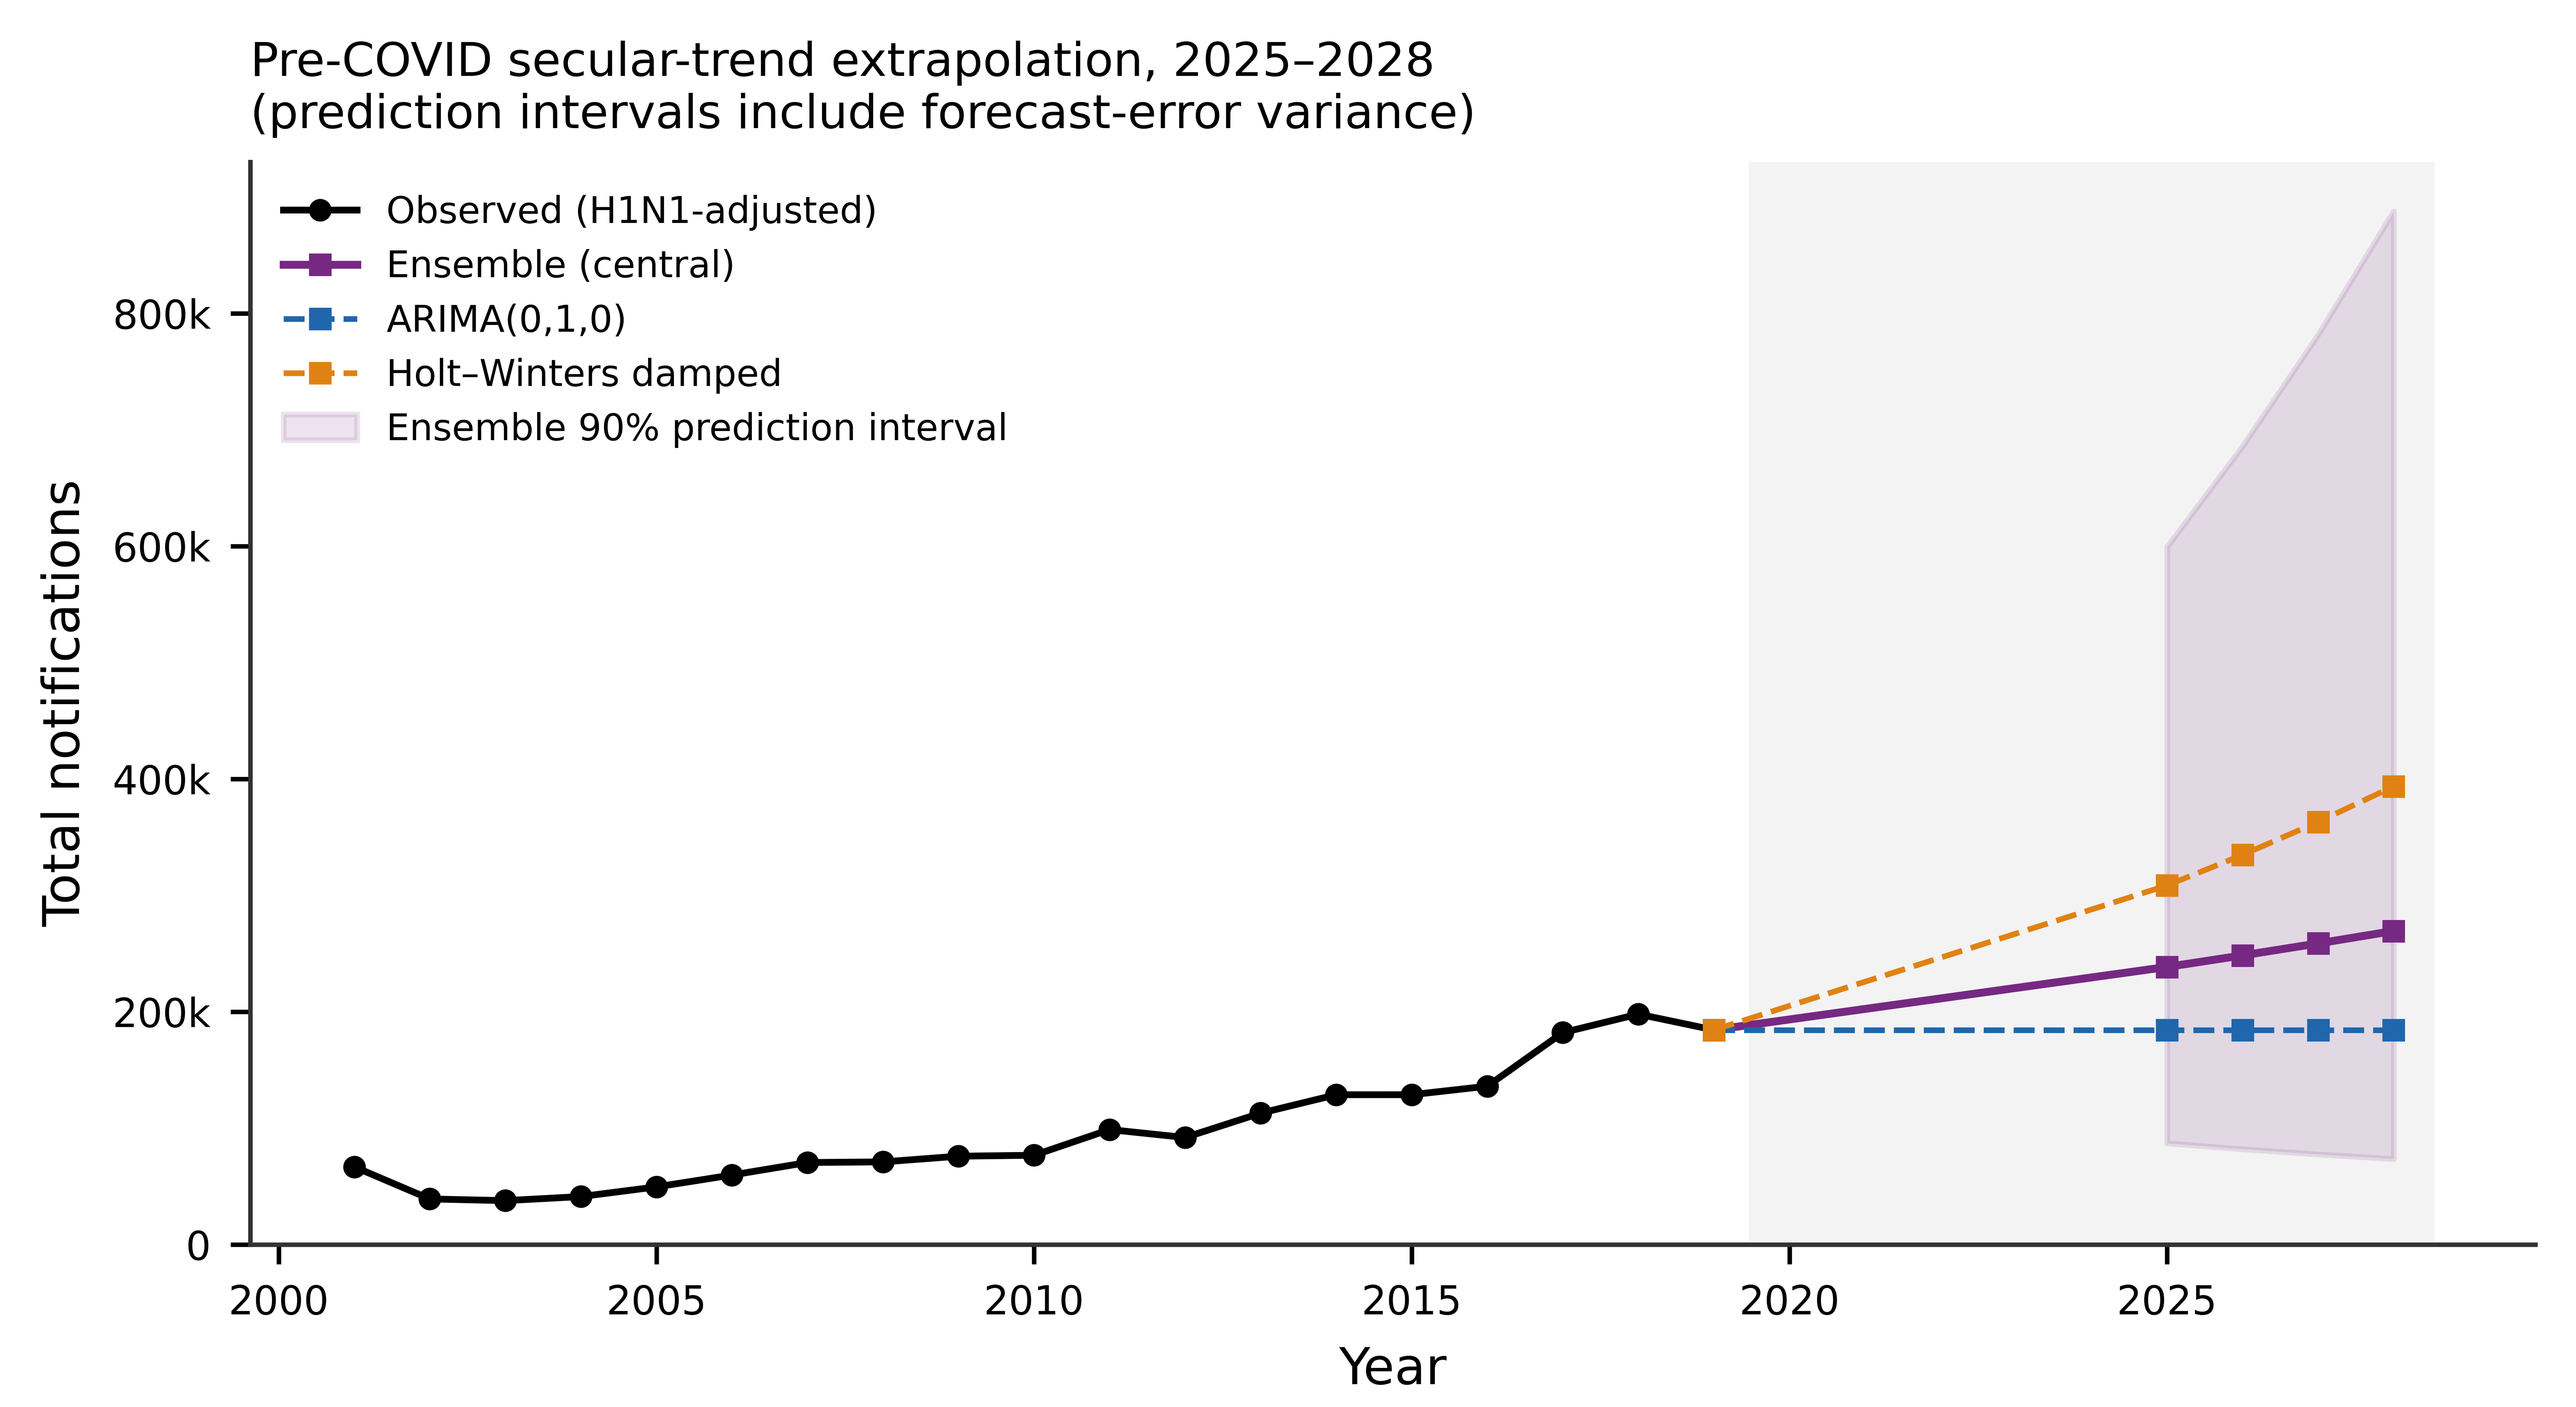
| Year | ARIMA(0,1,0) | Holt–Winters (Damped) | Ensemble (90% PI) |
|---|---|---|---|
| 2025 | 184,322 | 308,535 | 238,474 (87,036–599,331) |
| 2026 | 184,322 | 334,771 | 248,406 (81,957–685,829) |
| 2027 | 184,322 | 363,090 | 258,700 (77,497–781,606) |
| 2028 | 184,322 | 393,646 | 269,365 (73,529–887,721) |
Disclaimer/Publisher’s Note: The statements, opinions and data contained in all publications are solely those of the individual author(s) and contributor(s) and not of MDPI and/or the editor(s). MDPI and/or the editor(s) disclaim responsibility for any injury to people or property resulting from any ideas, methods, instructions or products referred to in the content. |
© 2026 by the authors. Licensee MDPI, Basel, Switzerland. This article is an open access article distributed under the terms and conditions of the Creative Commons Attribution (CC BY) license.
Share and Cite
Jung, H.; Jung, M. Epidemiological Trends, Statistical Correlations, and Forecasting of Notifiable Infectious Diseases in South Korea, 2001–2024: A Regression and Time Series Analysis with Projections to 2028. Pathogens 2026, 15, 780. https://doi.org/10.3390/pathogens15080780
Jung H, Jung M. Epidemiological Trends, Statistical Correlations, and Forecasting of Notifiable Infectious Diseases in South Korea, 2001–2024: A Regression and Time Series Analysis with Projections to 2028. Pathogens. 2026; 15(8):780. https://doi.org/10.3390/pathogens15080780
Chicago/Turabian StyleJung, Hyeran, and Minsun Jung. 2026. "Epidemiological Trends, Statistical Correlations, and Forecasting of Notifiable Infectious Diseases in South Korea, 2001–2024: A Regression and Time Series Analysis with Projections to 2028" Pathogens 15, no. 8: 780. https://doi.org/10.3390/pathogens15080780
APA StyleJung, H., & Jung, M. (2026). Epidemiological Trends, Statistical Correlations, and Forecasting of Notifiable Infectious Diseases in South Korea, 2001–2024: A Regression and Time Series Analysis with Projections to 2028. Pathogens, 15(8), 780. https://doi.org/10.3390/pathogens15080780