Abstract
(1) Background: As a prominent zoonotic parasitic disease, fascioliasis threatens the sustainable development of animal husbandry and public health. Current research focuses mainly on individual species (parasite or intermediate host), neglecting systematic evaluation of the transmission chain and exposure risks to animal husbandry. Thus, comprehensive studies are urgently needed, especially in the ecologically fragile alpine region of the Qinghai-Tibet Plateau; (2) Methods: Distribution data of Radix spp. and Fasciola hepatica in the Qinghai-Tibet Plateau and adjacent areas were gathered to establish a potential distribution model, which was overlaid on a map of livestock farming in the region; (3) Results: The key environmental factors influencing Radix spp. distribution were temperature seasonality (21.4%), elevation (16.4%), and mean temperature of the driest quarter (14.7%). For F. hepatica, the main factors were elevation (41.3%), human footprint index (30.5%), and Precipitation of the driest month (12.1%), with all AUC values exceeding 0.9. Both species exhibited extensive suitable habitats in Qinghai and Tibet, with higher F. hepatica transmission risk in Qinghai than Tibet; (4) Conclusions: The significant transmission risk and its impacts on the livestock industry in the Qinghai-Tibet Plateau highlight the need for proactive prevention and control measures. This study provides a scientific foundation for targeted alpine diseases control, establishes an interdisciplinary risk assessment framework, fills gaps in high-altitude eco-epidemiology, and offers insights for ecological conservation of the plateau.
1. Introduction
The Lymnaeidae family (Mollusca, Gastropoda, Pulmonata, Basommatophora), commonly known as pond snail [1], has a global distribution. In China, three genera are identified: Lymnaea, Radix, and Galba. These snails serve as intermediate hosts for numerous humans and livestock parasites, causing parasitic diseases that threaten public health and incur significant economic losses [2]. Fascioliasis, a zoonotic disease caused by species of the Fasciola genus, primarily infects herbivores like cattle and sheep, occasionally damaging human hepatobiliary systems. Fasciola species belongs to Platyhelmintha, Trematoda, Digenea, and Fasciolidae, with Fasciola hepatica and Fasciola gigantica being most detrimental to human and animal health [3]. F. hepatica infects approximately 20 million people worldwide, posing major public health challenges [4]. In China, fascioliasis is endemic in pastoral regions such as Inner Mongolia, Qinghai, and Ningxia [5]. Lymnaeidae snails are crucial for completing the F. hepatica life cycle, with at least 20 species acting as potential vectors [6]. Radix spp. are the most abundant and widely distributed in China [7]. For example, Radix cucunorica was identified as the primary intermediate host of F. hepatica in the Gannan pastoral region [8], while Radix spp. dominate in Qinghai and Tibet [9,10]. These snails exhibit remarkable adaptability, thriving in diverse habitats from thermal spring habitats to aquatic systems at altitudes over 3000 m [11]. Suitable snail habitats are essential for Fasciola development, making Lymnaeidae distribution patterns critical for understanding fascioliasis spread.
The niche model integrates species distribution data with environmental datasets, employing algorithms to determine ecological requirements. It projects findings across temporal and spatial scales to predict actual and potential species distributions [12]. This approach is widely utilized to investigate interplay between infectious diseases spread and environmental variables, enabling assessment of transmission dynamics and risks [13]. Recently, it has been adapted to forecast transmission risks posed by key hosts or vectors, categorizing parasitic diseases based on potential distribution likelihood [14]. For example, niche models have evaluated climate change impacts on Oncomelania hupensis (a Schistosoma mansoni vector in Hubei Province), predicting parasite transmission risk [15,16]. Similarly, they identified S. mansoni risk areas using the intermediate host Biomphalaria straminea distribution data [17]. International researchers have also used intermediate hosts distributions to predict epidemic risks for Plasmodium knowlesi and canine leishmaniosis [18,19,20].
Additionally, niche models aid in assessing vector habitat adaptability. Certain studies have used these models to evaluate suitable habitats for Pomacea canaliculata (a key intermediate host for Angiostrongylus cantonensis), clarifying correlation between vector distribution and environmental factors [21,22]. Building on this, our research pioneers the use of ecological niche models (ENMs) to assess transmission risks of F. hepatica and its intermediate host Radix spp., evaluating their potential geographic ranges and infection risk. Among modeling instruments, the MaxEnt model is favored for its exceptional precision, user-friendliness, and concise output [23,24]. The receiver operating characteristic (ROC) curve’s area under the curve (AUC) possesses significant benefits, providing threshold-independent evaluation, which has driven its extensive adoption in model assessment [25]. Thus, with a strong correlation between vectors and environmental conditions, MaxEnt enables invaluable predictions of species distribution under changing conditions, guiding targeted control strategies.
High-altitude regions are highly sensitive to global climate change. The Qinghai-Tibet Plateau, known as the world’s highest plateau, possesses a unique natural environment and complex topography. These characteristics foster rich biodiversity and vector species proliferation [26]. Climate factors significantly influence vector spatio-temporal pattern and pathogens survival [27]. The plateau is projected to experience continued warming and increased moisture [28].
Drawing distribution data of Radix spp. and F. hepatica in the Qinghai-Tibet Plateau and adjacent areas, we correlated environmental factors with their prevalence. Integrating local animal husbandry practices, the model identified high-risk zones. These findings provide a scientific basis for parasitic diseases control, laying groundwork to curb diseases spread on the plateau.
2. Materials and Methods
2.1. Species Distribution Data Collection
Distribution data for Radix spp. and F. hepatica in the Qinghai-Tibet Plateau and adjacent regions were collected by referencing the Global Biodiversity Information Facility (GBIF) database (http://data.gbif.org/welcome.html; accessed on 16 August 2024), relevant literature, and publications. Specifically, GBIF was searched for “Radix spp.” and “Fasciola hepatica” with filters: “in China”, “1980 to present”, “including coordinates”, and “present”. Record details were checked to verify classification consistency. Additionally, CNKI was searched for “Lymnaeidae” and “F. hepatica”, with original data selected based on morphological and molecular identification of “Radix spp.” and “F. hepatica”. Where latitude and longitude were not provided, Google Earth supplemented the information. This yielded 243 distribution records for Radix spp. (refer to Table S1) and 96 for F. hepatica were compiled (refer to Table S2). The ENMtools was applied to eliminate duplicate and over-fitting data points, mitigating sampling bias. Refined datasets 226 of Radix spp. and 79 of F. hepatica records were utilized for modeling. The MaxEnt is particularly appropriate for small sample datasets (where n ≥ 15) and performs optimally with approximately around 120 samples [29,30], ensuring robust results from this study’s dataset.
2.2. Relevant Environment Variables Collection and Filtering
Following an extensive literature review, a detailed analysis of the biological attributes of Radix spp. was conducted. Table 1 below describes the definitions and sources of these datasets. Utilizing coordinate data on the distribution of Radix spp. and F. hepatica across the Qinghai-Tibet Plateau and adjacent regions, corresponding environmental variable data were meticulously extracted. Notably, the complexity of the Maxent model significantly impacts its transferability; higher complexity tends to negatively impact model performance [31,32]. Complicated models often overfit species distribution data within the modeling domain, compromising predictive accuracy, leading to substantial deviations from actual conditions and yielding unreliable results [33].

Table 1.
Environmental variables and sources.
To address this, the environmental variables were extracted using a mask in ArcGIS 10.8 software, referencing China’s standard administrative division map (Review No. GS (2024) 0650). Subsequently, the SDMToolbox was engaged to perform a correlation analysis on variables, and variables with a Pearson correlation coefficient < 0.9 was selected for model inclusion.
2.3. Analytical Tools and Methods
In this study, ENM was used to map distributional origins. The ENM was developed via the maximum entropy model (MaxEnt) implemented through the software available at http://www.cs.princeton.edu (accessed on 9 March 2023). Comparative evaluations of diverse algorithmic models suggest that MaxEnt, which incorporates machine learning concepts and the maximum entropy algorithm, provides more accurate forecasts. This method is deemed the most effective for species distribution modeling [29,30]. For model construction, 75% of the data were allocated to training, with the remaining 25% reserved for validation.
2.4. Model Parameter Tuning Using the ENMeval Package
The complexity of the MaxEnt model significantly influences its transferability. Highly complex models overfit species distribution data during training, reducing predictive accuracy when transferred and leading to simulations that deviate from reality and compromise reliability. MaxEnt model complexity depends on its Regularization Multiplier (RM) and Feature Combination (FC), which includes five features: linear-L, quadratic-Q, hinge-H, product-P, and threshold-T. Feature combination selection relates to the number of species distribution points. The ENMeval package evaluates model complexity by analyzing MaxEnt’s corrected Akaike information criterion correction (AICc) across diverse parameter settings. AIC measures overfitting propensity, favoring models with the lowest values [34]. Parameter tuning via ENMeval shows that lower-complexity models exhibit better spatial transferability and more accurate predictions of species potential distributions [33].
2.5. Model Accuracy Verification
The Area Under Curve (AUC), a widely utilized research metric, evaluates model accuracy [35]. Ranging from 0 to 1, an AUC of 0.5 to 0.7 indicates moderate accuracy and potential reliability issues. A score of 0.7 to 0.9 suggests higher accuracy but requires careful examination, while 0.9 to 1 indicates high accuracy and considerable dependability. Conversely, an AUC of 0.5 indicates random prediction [36].
2.6. Analyze the Impact of Environmental Variables
The pivotal environmental variables and their distinct impacts on Radix spp. and F. hepatica occurrences were meticulously assessed utilizing the jackknife method. Following this analysis, the potential habitats for Radix spp. and F. hepatica were identified through an examination of the response curve derived from MaxEnt.
2.7. Possibility of Predicting the Distribution of Radix spp. and Fasciola hepatica
In ArcGIS 10.8, the MaxEnt output results were utilized to visualize. Using Jenks’ natural breaks classification, we reclassified risk values into four levels: high-risk, medium-risk, low-risk, and non-risk areas. An ascending gradient indicates an increased likelihood of Radix spp. and F. hepatica distribution. This method optimally groups values by iteratively comparing within-group and between-group mean differences. In transmission risk assessment, it objectively characterizes probability distributions while minimizing human-induced errors [37], making it widely used in vector-borne diseases risk assessment [38]. Additionally, the ArcGIS 10.8 software’s toolset was utilized to calculate the area of each risk area.
2.8. Livestock Impact Assessment
The previously mentioned results were superimposed upon the distribution map of the Qinghai-Tibet Plateau, as illustrated in Figure 1 [39]. In light of these derived insights, an analysis of the implications for animal husbandry within the region was conducted.
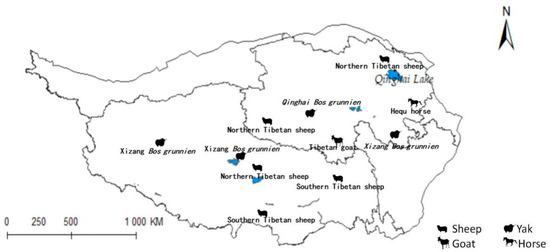
Figure 1.
Distribution map of animal husbandry on Qinghai-Tibet Plateau.
3. Results
3.1. Distribution of Radix spp. and Fasciola hepatica in Qinghai-Tinbet Plateau and Surrounding Areas
Yang indicates that in limpets studies, the high plasticity of the shell morphology of this group and the long-standing controversy have made species identification both crucial and challenging. The study concluded that there are species of the Radix genus in the Qinghai region, such as R. lagotis and R. cucunorica; in the Tibet region, the records include R. auricularia, R. ovata, R. lagotis, and R. cucunorica of the Radix genus, and Galba truncatula of the Galba genus [7]. Following this, this study collected Radix distribution data based on the article’s classification criteria. After meticulous sorting, we obtained distribution records for Radix spp. (see Supplementary Table S1) and F. hepatica (see Supplementary Table S2). Removing duplicate and overfitted data points, the remaining dataset was employed to delineate their comprehensive distribution across the Qinghai-Tibet Plateau and adjacent regions, as depicted in Figure 2. And it also summarized its distribution situation in the more widely-populated regions of Qinghai and Tibet (Table 2).
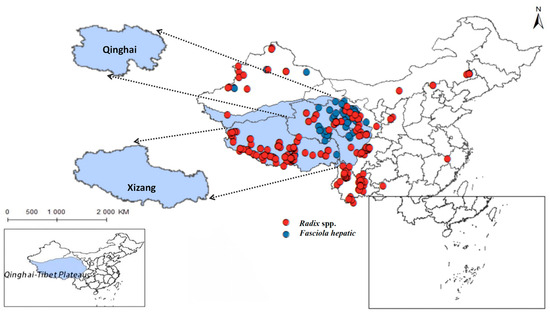
Figure 2.
Distribution records of Radix spp. and Fasciola hepatica on the Qinghai-Tibetan Plateau and neighboring areas.
Table 2.
Distribution records of Radix spp. and Fasciola hepatica on the Qinghai-Tibetan Plateau and neighboring areas.
The findings indicated that Radix spp. snails mainly concentrate in the southwest and northeast of the Qinghai-Tibetan Plateau, particularly in the Xizang Autonomous Region and Qinghai Province, with a notably higher density in the former. In contrast, F. hepatica is predominantly encountered in the east of the Qinghai-Tibet Plateau, with the widest distribution in the northeast of Qinghai Province.
3.2. Environmental Factor Screening of Distribution Prediction Model
In ArcGIS 10.8, a suite of environmental factors, namely Bio1–19, Elev, Hii, and Hfp underwent initial processing. Correlation analysis results are shown in Figure 3A,B.
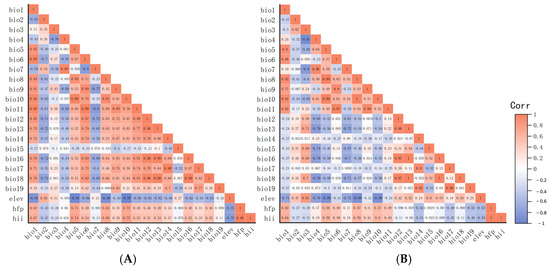
Figure 3.
Correlation analyses of environmental factors. (A) Correlation analysis of environmental factors of Radix spp. (B) Correlation analysis of environmental factors of Fasciola hepatica. Note: Matrices represented by dark orange and dark blue colors indicate environmental variables with absolute correlation coefficients exceeding 0.9. It is recommended to select one of each highly correlated pair for removal.
The correlation coefficient strength reflected interrelation among variables. First, variables prone to over-fitting (including Bio8, Bio9, Bio18, and Bio19) were excluded. Furthermore, variables with an absolute value of the correlation coefficient exceeding 0.9 and other variables (shown in dark red and dark blue, respectively, in Figure 3) were excluded. Ultimately, for Radix spp., selected variables (Bio1, 2, 3, 4, 5, 7, 12, 14, 15, Elev, and Hfp) construct the potential distribution model (Figure 3A). For F. hepatica, the model used Bio1, 2, 3, 6, 12, 14, 15, Elev, and Hfp (Figure 3B).
3.3. Model Parameter Tuning Using the ENMeval Package
The ENMeval package was meticulously evaluated, with the outcomes presented in Figure 4. The Radix spp. potential distribution model exhibits optimal complexity using parameters RM 0.5 and the FC LQHPT, yielding an AICc of 0 (Figure 4A). For F. hepatica, the preferred parameters were RM 1.5 and FC LQH, also giving an AICc value of 0 (Figure 4B). These parameters promote lower model overfitting and reduce prediction errors during modeling.
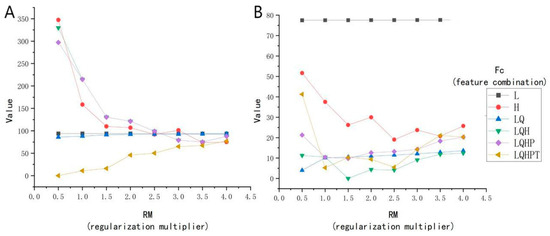
Figure 4.
Correlation analyses of environmental factors. (A) The Radix spp. model of ENMeval packet is used to optimize the results. (B) The Fasciola hepatica model of ENMeval packet is used to optimize the results. Note: L represents linear; Q represents quadratic; H represents hinge; P represents product; and T represents threshold.
3.4. Evaluation of Distributed Prediction Models
As illustrated in Figure 5, the AUC for the Radix spp. distribution model was 0.932 (Figure 5A), while the F. hepatica model achieved an AUC of 0.962 (Figure 5B). Both values exceed the random distribution (AUC = 0.5) benchmark and the 0.9 threshold, indicating high prediction accuracy and reliability. Furthermore, the models also effectively outlined a well-defined potential habitat zone in the study area.
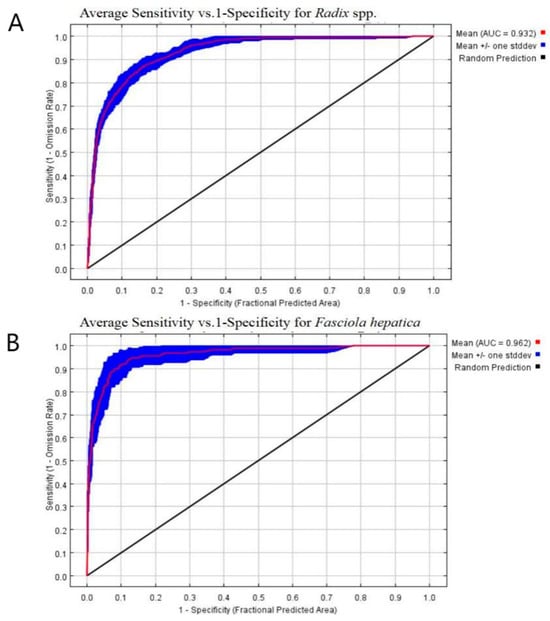
Figure 5.
ROC curve analyses. (A) The ROC curve analysis of Radix spp. (B) The ROC curve. analysis of Fasciola hepatica.
3.5. Importance Analysis of Environmental Variables
Before obtaining final results, MaxEnt evaluated environment variables’ relative importance and contribution to facilitate variable selection (Figure 6). As shown in Table 3, key factors for Radix spp. distribution were temperature seasonality (Bio4, contribution rate 21.4%), elevation (Elev, contribution rate 16.4%), and mean temperature of the driest quarter (Bio9, contribution rate 14.7%). For F. hepatica, the most significant variables were elevation (Elev, contributing a proportion of 41.3%), human footprint index (Hfp, 30.5%), and precipitation of the driest month (Bio14, 12.1%) (Table 4). Figure 6 shows the snail model performed best with Elev alone but deteriorated significantly without Hfp (Figure 6A). Similarly, the F. hepatica model was optimized with Elev, but accuracy dropped most when Hfp was excluded (Figure 6B), highlighting elevation and human footprint index as critical for both models.
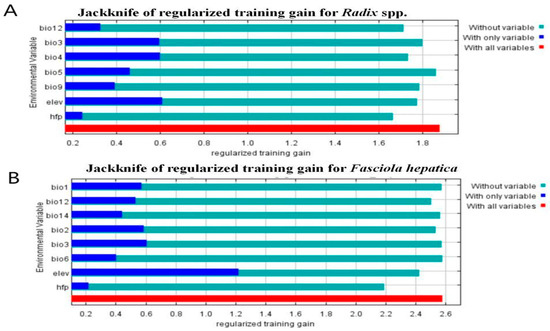
Figure 6.
Jackknife test results of the environmental factors affecting the distribution of Radix spp. and Fasciola hepatica. (A) Jackknife test results of the environmental factors affecting the distribution of Radix spp. (B) Jackknife test results of the environmental factors affecting the distribution of Fasciola hepatica.
Table 3.
Contribution and importance ranking of modeling variables of Radix spp. (%).
Table 4.
Contribution and importance ranking of modeling variables of Fasciola hepatica (%).
Response curve in Figure 7 indicates Radix spp. had the highest occurrence probability at a bio4 value of 375 (Figure 7A) and an elevation of 4727.2 m (Figure 7B), increasing gradually from sea level to this altitude before declining.
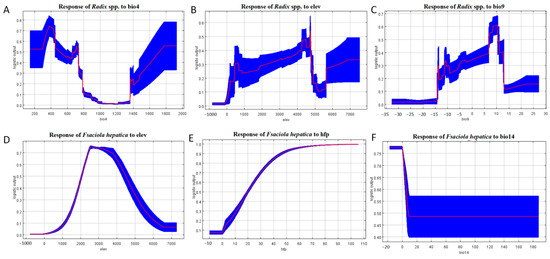
Figure 7.
Response curves of the main environmental factors affecting the distribution of Radix spp. and Fasciola hepatica. (A) Response of Radix spp. to Bio 4. (B) Response of Radix spp. to elevation. (C) Response of Radix spp. to Bio 9. (D) Response of Fasciola hepatica to elevation. (E) Response of Fasciola hepatica to human footprint index. (F) Response of Fasciola hepatica to Bio 14. Note: bio4 represents temperature Seasonality, elev represents elevation, bio9 represents mean temperature of the driest quarter, hfp represents human footprint index, and bio 14 represents precipitation of the driest month. The red line in the figure represents the average value, and the blue block shows the range of this value in the results of ten simulations.
The response curve of Bio9 illustrates that the highest occurrence probability for Radix spp. at 10 °C, decreasing with rising isothermality values. Conversely, the relationship becomes inverse when temperatures exceed 10 °C (Figure 7C). Survival probability increases within 0 to 2571.4 m elevation and decreases above this threshold (Figure 7D). For the human footprint index, F. hepatica presence probability is negligible at index zero, increasing with index elevation (Figure 7E). Furthermore, Bio14 is crucial for F. hepatica distribution, with occurrence peaking at −17.5 to 0 mm and then decreasing negatively (Figure 7F). Collectively, these results define the environmental characteristics of suitable habitats for F. hepatica and its intermediate host, Radix spp.
3.6. Prediction of Communication Risk
Ultimately, the models for Radix spp. and F. hepatica were extrapolated to the Qinghai-Tibet Plateau, reclassifying MaxEnt results into four risk categories. Radix spp. risk values were divided into high risk (0.50~1), medium-risk (0.25~0.49), low-risk (0.11~0.24), and non-risk (0~0.10). Similarly, F. hepatica risk zones were demarcated into high risk (0.51~1), medium risk (0.26~0.50), low risk (0.11~0.25), and non-risk (0~0.10). Results showed relatively suitable regions in the south, center, and east of the Qinghai-Tibet Plateau (Figure 8), widely covering Qinghai, Tibet, Xinjiang, Yunnan, Gansu, and Sichuan provinces. Tibet had the highest occurrence probability.
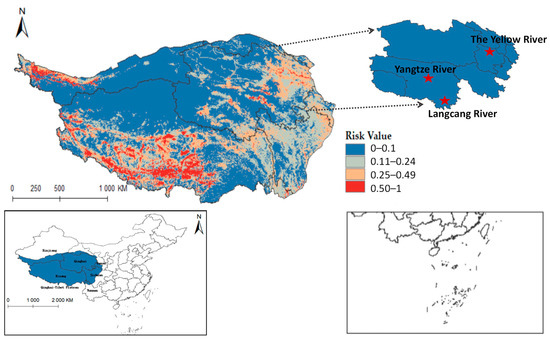
Figure 8.
Potential distribution of Radix spp. in the Qinghai-Tibet Plateau region.
Furthermore, integrating the Qinghai-Tibet Plateau river system on the distribution map reveals that Radix spp. suitable habitats mainly cluster near riverine systems (see Figure A1). These habitats exhibit high adaptability in the upper reaches of the Yellow River, Yangtze River, and Lancang River in Qinghai Province. Using ArcGis 10.8 to quantify each suitable area, the Qinghai-Tibet Plateau has the following characteristics: high-risk area encompasses 14.1602 × 10⁴ km2, the medium-risk area covers 33.5264 × 10⁴ km2, the low-risk area extends over 58.0277 × 10⁴ km2, and the non-risk area spans 146.3503 × 10⁴ km2. These data suggest an elevated transmission risk of Radix spp. in the Tibet region.
Figure 9 shows that F. hepatica primarily concentrates in the east and north of the Qinghai-Tibet Plateau, with higher suitability in eastern and central Qinghai Province. Overlaying hydrological systems on the distribution map highlights its suitable habitats along riverine corridors (see Figure A2), particularly in Qinghai’s Sanjiangyuan region, the source area of the Yangtze River, the Yellow River, and the Lancang River. Quantified habitat areas on the plateau are as follows: 8.5757 × 10⁴ km2 in the highly suitable category, 15.9835 × 10⁴ km2 in the medium risk category, 32.4845 × 10⁴ km2 in the low-risk area, and 195.021 × 10⁴ km2 in the non-risk area. These findings suggest higher F. hepatica transmission risk in Qinghai.
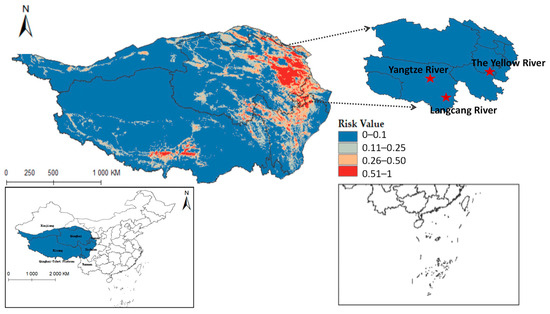
Figure 9.
Predicted distribution of Fasciola hepatica in Qinghai-Tibet Plateau.
3.7. Evaluation of the Impact of Radix spp. And Fasciola hepatica on Animal Husbandry in Qinghai-Tibet Plateau
The projected distribution maps of Radix spp. and F. hepatica were superimposed upon the Qinghai-Tibet Plateau’s livestock distribution map (Figure 10 and Figure 11). Figure 10 depicts grazing areas of Hequ horse and Tibetan goat in Qinghai Province overlapping with zones for Radix spp.—the primary intermediate host for F. hepatica—indicating elevated transmission risk. Specifically, model projections show that the Tibetan goats in the Yushu Tibetan Autonomous Prefecture and Hequ horses in Huangnan, Hainan Tibetan Autonomous Prefectures, and Haidong region are more susceptible to Radix spp. transmission. In Tibet, Radix spp. distribution threatens the Xizang Bos grunnien in the southern Naqu. The high Radix spp. prevalence in Changdu impacts Southern Tibetan sheep husbandry, while their presence in Lasha severely affects Northern Tibetan sheep breeding. These also harm the economies of the Southern Tibetan sheep and Xizang Bos grunnien husbandry in Shannan and Ali regions.
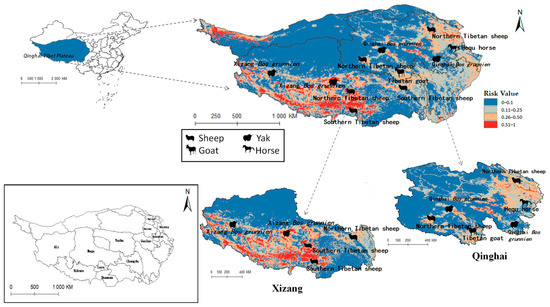
Figure 10.
Distribution of animal husbandry in high-risk areas of Radix spp.
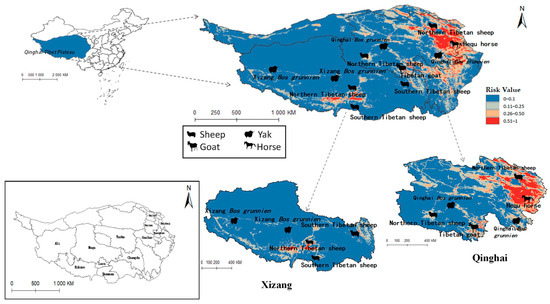
Figure 11.
Distribution of animal husbandry in high-risk areas of Fasciola hepatica.
Figure 11 similarly indicates Northern Tibetan sheep and Hequ horses overlapping with high-risk zones for F. hepatica infestation. In Qinghai province, Hequ horses in the Huangnan, Hainan Tibetan Autonomous Prefecture, and in Haidong City, along with North of Tibet sheep in the Haibei Tibetan Autonomous Prefecture, face elevated F. hepatica transmission risk. In Tibet, the Northern and Southern Tibetan sheep in Lasa and Shannan regions are under significant parasitic threat.
Table 5 indicates that Radix spp. pose considerable risks to Hequ horses and Tibetan goats breeding in Qinghai, as well as to Xizang Bos grunniens and Southern Tibetan sheep husbanry. Concurrently, F. hepatica threatens North Tibetan Tibet sheep, Hequ horse, and Tibetan goats in Qinghai, with Southern Tibetan sheep in Tibet being particularly vulnerable.
Table 5.
Affected animal husbandry situation.
3.8. Distribution Results of Other Important Trematoda
As carriers of fascioliasis and clonorchiasis, Fasciola gigantica and other digenean parasites use Lymnaeidae as key intermediate hosts. Through meticulous data sorting, we have acquired the nationwide distribution data for 44 records on fascioliasis caused by F. gigantica (see Supplementary Table S3) and 114 records on infections by several species of Digenea trematodes (see Supplementary Table S4). As depicted in Figure 12, these parasites are mainly distributed in southern and central China, with sporadic records in the Qinghai-Tibet Plateau and adjacent regions. Due to limited local distribution data, this study does not model the plateau, indicating fascioliasis as the predominant trematode disease there. Previous studies reported intermediate-shaped trematodes in Yunnan and Guangxi [40,41] and Qinghai’s Yushu area [42]. However, incomplete research on Qinghai’s intermediate-shaped trematodes mean that the potential impacts cannot be ruled out, limiting this study’s scope.
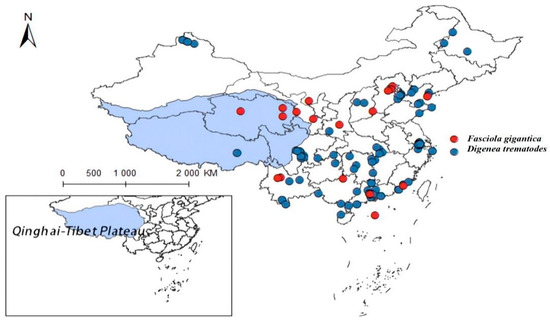
Figure 12.
Distribution records of Fasciola gigantica and Digenean trematodes in China.
3.9. Distribution Results of Other Important Lymnaeidae
Using the same methodology, 33 records regarding the distribution of the genus Galba were systematically compiled (see Supplementary Table S5), as shown in Figure 13. The genus Galba is predominantly distributed in Guangxi Province, with sparse records in Tibet and near absence in Qinghai. Previous studies suggested that dominant snail species suppress others [9]. In Qinghai, Radix cucunorica’s ecological dominance may explain the limited Galba presence. This highlights the importance of controlling Radix spp. for disease prevention.
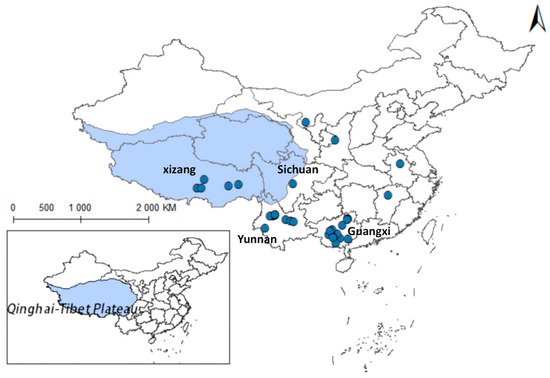
Figure 13.
Distribution records of Galba spp. in China.
4. Discussion
The results revealed that the high-risk areas for Radix spp. predominantly lie in south-central Tibet, while those for F. hepatica primarily concentrate in the eastern Qinghai Province. These findings align with earlier research [43]. Notably, the non-overlapping high-risk areas of two species suggest high vector efficiency of Radix spp. in Qinghai Province, consistent with previous epidemiological studies in the region [10,44,45]. Additionally, the key variables influencing Radix spp. distribution were temperature seasonality (Bio4), elevation (Elev), and mean temperature of the driest quarter (Bio9). For F. hepatica, the principal determinants were elevation (Elev), human footprint index (Hfp), and precipitation of the driest month (Bio14). Thus, elevation, human activities, and temperature were pivotal environmental factors for both species. Furthermore, the Tibetan goat, the northern Tibetan sheep, Xizang Bos grunniens, Qinghai Bos grunniens, and Southern Tibetan sheep face higher transmission risks from both Radix spp. and F. hepatica. This finding validates the direct relationship between grazing practices and F. hepatica distribution patterns.
The propagation of the fascioliasis epidemic is primarily dictated by the spatial distribution of freshwater snails, which act as intermediate hosts, favoring their geographical range, environmental circumstances, and grazing patterns [46]. The Lymnaeidae family regroups the principal intermediate hosts for Fasciola spp. These hosts favor habitats rich in nutrients and replete with aquatic flora, and are often found crawling on the substratum of water bodies, amidst rocks, or along the shoreline, surrounded by aquatic plants. They are also capable of enduring periods of aridity [47]. Radix spp., in particular, are prevalent and possess an average lifespan of approximately a year [48]. Radix spp. exhibit a robust adaptability to varying pH levels, flourishing from 5.8 to 9.9, with an optimal pH spectrum between 7.0 and 9.6 [49]. Research has noted the presence of Radix spp. even in hypersaline water bodies of northern Tibet, and this species markedly prefers fresh medium salinity environments [50].
Additionally, Radix spp. stand out among gastropods for their ability to thrive in extreme cold and tolerate icy waters [51,52]. Thus, Fasciola transmission depends on a complex interplay of factors, including climate, topography, elevation, and socioeconomic influences [53]. In summary, this study shows that distribution of Radix spp. and F. hepatica is markedly influenced by variables such as elevation, temperature, and human interventions. Notably, their distributions overlap significantly (Figure 2). However, F. hepatica prevalence does not fully align with its distribution, indicating that not all snails carry the parasite. Tibet has an average altitude above 4000 m and low temperatures. Plateau low temperatures may delay parasites development in snails. Factors like low water temperature can also prevent parasite life cycle from completion in some snail habitats. In contrast, Qinghai has an average altitude of about 3000 m, where high-risk snail distributions in warmer areas better suit F. hepatica’s life cycle needs. Previous research typically defined high altitude as below 3000 m [54], but this model extends F. hepatica’s suitable habitat to 6000 m. This discrepancy may result from recent Qinghai-Tibetan Plateau warming and increased humidity, which have likely enabled host snails to migrate to higher altitudes. Recent studies have documented high F. hepatica infection rates in Qinghai’s Wulan County (with altitudes reaching 5031 m) and Xinhai County (with altitudes reaching 5305 m) [10,55], highlighting the need for comprehensive large-scale studies within Qinghai-Tibet Plateau.
5. Conclusions
In the current investigation, the MaxEnt model was employed to predict the potential distribution of Radix spp. and F. hepatica on the Qinghai-Tibet Plateau and identify their risk areas. The local Centers for Disease Control and Prevention (CDC) should therefore enhance vigilance and implement preventive strategies. For instance, a proactive monitoring strategy should be adopted, triggering interventions when F. hepatica infection rate exceeds 0.6 to prevent widespread outbreak. Long-term surveillance could track snail migration patterns under climate change by monitoring the upward expansion of suitable habitats at higher altitudes. Such endeavors are paramount for exploring the Lymnaeidae family, enabling precise targeting of snail populations for sampling and reducing research time and costs. Moreover, the insights from this distributional analysis can guide targeted prevention and control of fascioliasis across the Qinghai-Tibet Plateau, ultimately alleviating livestock industry losses and preserving public health security. Notably, while fascioliasis research is relatively abundant, Lymnaeidae studies on the Qinghai-Tibet Plateau remain scarce, highlighting a significant gap in intermediate host investigation. Future sampling can align with our identified areas to enable comprehensive analysis of Lymnaeidae in this region.
The distribution point data in this study were derived from historical documents and limited field investigations, leading to sparse distribution records. Thus, predictions may contain deviations. In the future, systematic field monitoring should be jointly conducted with disease control and animal husbandry departments to fill data gaps. Additionally, the living environments of Radix and F. hepatica are complex, with their transmission process affected by various factors (such as water quality, water system distribution, etc.). A closer examination reveals that in assessing the impact on the livestock industry, the lack of species-level precise spatial distribution data for livestock forces reliance on general losses across regions and livestock species, significantly limiting analysis depth and refinement, and maintaining the understanding of industry impacts at a macroscopic and preliminary level. To address these limitations and enhance research reliability and application value, future work should urgently collaborate with professional institutions (such as disease control centers and livestock veterinary stations) to design and implement systematic on-site monitoring plans for filling data gaps. Meanwhile, obtaining high-resolution, species-specific livestock geographic information data will be the key to deepening impact assessments and formulating targeted risk management strategies.
Supplementary Materials
The following supporting information can be downloaded at: https://www.mdpi.com/article/10.3390/pathogens14070647/s1, Table S1: Distribution records of Radix spp. on the Qinghai-Tibetan Plateau and neighboring areas; Table S2: Distribution records of Fasciola hepatica on the Qinghai-Tibetan Plateau and neighboring areas; Table S3: Distribution records of Fasciola gigantica on the Qinghai-Tibetan Plateau and neighboring areas; Table S4: Distribution records of Digenetic trematode on the Qinghai-Tibetan Plateau and neighboring areas; Table S5: Distribution records of Galba spp. on the Qinghai-Tibetan Plateau and neighboring areas.
Author Contributions
L.X., Y.G. and Z.L. (Zengkui Li) designed the study. L.X., Z.L. (Zhongqiu Li), M.G. and M.K. executed the study and validated the data. P.W. and W.L. performed the data analysis. L.X. wrote the manuscript, with review and significant input from D.L., L.Y., Y.L. and Z.L. (Zengkui Li). All authors have read and agreed to the published version of the manuscript.
Funding
This research was funded by Research and Demonstration of Intelligent Assessment Technologies for Vector-borne Disease Transmission Risks in the Sanjiangyuan National Park (2025ZY031), and Technology Innovation Support Program, NIPD, China CDC (TF2024012).
Institutional Review Board Statement
The animal study was approved by the institutional Animal Care and Use Committee of Qinghai University. The study was conducted in accordance with the local legislation and institutional requirements.
Data Availability Statement
Species distribution points used in the construction of the ecological niche model are from existing survey records, specimen records, and relevant databases accumulated over time, such as the Global Biodiversity Information Facility (GBIF; https://www.gbif.org/ accessed on 9 May 2025).
Acknowledgments
We are profoundly indebted to the efforts of all scholars who have contributed to this domain, thereby providing a solid foundation upon which our research can be edified.
Conflicts of Interest
The authors declare no conflicts of interest. The funders had no role in the design of the study; in the collection, analyses, or interpretation of data; in the writing of the manuscript; or in the decision to publish the results.
Abbreviations
The following abbreviations are used in this manuscript:
| MaxEnt | Maximum Entropy model |
| AUC | receiver operating characteristic (ROC) curve’s area under the curve |
| GBIF | Global biodiversity information exchange database |
| RM | Regularization multiplier |
| FC | Feature combination |
| AIC | Akaike information criterion correction |
Appendix A

Figure A1.
Radix spp. Potential distribution in Qinghai-Tibet Plateau region (Shown water).
Figure A1.
Radix spp. Potential distribution in Qinghai-Tibet Plateau region (Shown water).


Figure A2.
Fasciola hepatica Potential distribution in Qinghai-Tibet Plateau region (Shown water).
Figure A2.
Fasciola hepatica Potential distribution in Qinghai-Tibet Plateau region (Shown water).

References
- Dayrat, B.; Conrad, M.; Balayan, S.; White, T.R.; Albrecht, C.; Golding, R.; Gomes, S.R.; Harasewych, M.G.; de Frias, M.A. Phylogenetic relationships and evolution of pulmonate gastropods (Mollusca): New insights from increased taxon sampling. Mol. Phylogenet. Evol. 2011, 59, 425–437. [Google Scholar] [CrossRef]
- Kaplan, R.M. Fasciola hepatica: A review of the economic impact in cattle and considerations for control. Vet. Ther. 2001, 2, 40–50. [Google Scholar] [PubMed]
- Gu, Y.; Shen, Y.; Mao, X. Research on pathogenic factors of Fascioliasis. Chin. J. Anim. Infect. Dis. 2000, 2, 55–59. [Google Scholar]
- Gayo, V.; Mera, Y.; Sierra, R. With IAEA Support, Latin America Controls Liver Fluke (Fasciola hepatica) in Livestock and Humans; FAO/IAEA Program; IAEA: Vienna, Austria, 2010. [Google Scholar]
- Xu, H.; Zhu, R.; Zhao, H. Research progress in diagnosis and control of Fascioliasis. Chin. J. Anim. Infect. Dis. 2000, 4, 49–51. [Google Scholar]
- Hurtrez-Boussès, S.; Meunier, C.; Durand, P.; Renaud, F. Dynamics of host-parasite interactions: The example of population biology of the Fasciola hepatica. Microbes Infect. 2001, 3, 841–849. [Google Scholar] [CrossRef]
- Yang, L. Classification and Phylogeny of Lymnaeidae. Master’s Thesis, Nanchang University, Nanchang, China, 2019. [Google Scholar]
- Li, G.; Jin, J.; Cai, X.; Duan, Z. Investigation on the species of intermediate hosts of Fasciola hepatica in Gannan Pastoral Area. Chin. Vet. Sci. 1988, 9, 23–27. [Google Scholar] [CrossRef]
- Zhou, L. Serological Investigation on Fasciolopsis buski in Tibetan yaks and Tibetan sheep in the Qinghai-Tibet Plateau and Identification of Oncomelania hupensis in Tibet. Master’s Thesis, Xizang University, Lasa, China, 2020. [Google Scholar]
- Zhao, C.; Guo, M.; Li, W.; Chen, G.; Kang, M. Investigation of Fasciola hepatica infection in Tibetan sheep in some areas of Qinghai Province. Anim. Husb. Vet. Med. 2016, 48, 134–136. [Google Scholar]
- Liu, Y.; Wang, Y. The morphology and habits of Lymnaeidae. Biol. Bull. 1965, 3, 8–12. [Google Scholar]
- Zhu, G.; Liu, G.; Bu, W.; Gao, Y. Ecological niche modeling and its application in Biodiversity Conservation. Biodivers. Sci. 2013, 21, 90–98. [Google Scholar] [CrossRef]
- Lin, X.; Xiao, H.; Tian, H. Applications of ecological niche models in risk predictions of infectious diseases. Chin.Prev. Med. 2013, 47, 294–296. [Google Scholar] [CrossRef]
- Hu, X.; Xia, S.; Guo, Y.; Hao, Y.; Xue, J.; Lv, S.; Xu, J.; Li, S. Ecological niche modeling and its applications in research on transmission risks of parasitic diseases. Chin. Parasitol. Parasit. Dis. 2020, 38, 238–244. [Google Scholar] [CrossRef]
- Tang, Y.; Liu, K.; Wei, F.; Ren, Y.; Zhang, L.; Xiao, W. Impact of future climate change on the potential distribution of Oncomelania in Hubei Province. Adv. Clim. Change Res. 2017, 13, 606–613. [Google Scholar] [CrossRef]
- Liao, J. Study on Potential Transmission Risk of Schistosomiasis in China Based on Ecological Niche Model. Master’s Thesis, Central South University, Changsha, China, 2011. [Google Scholar]
- Yang, Y.; Cheng, W.; Wu, X.; Huang, S.; Deng, Z.; Zeng, X.; Yuan, D.; Yang, Y.; Wu, Z.; Chen, Y.; et al. Prediction of the potential global distribution for Biomphalaria straminea, an intermediate host for Schistosoma mansoni. PLoS Negl. Trop. Dis. 2018, 12, e0006548. [Google Scholar] [CrossRef]
- Pedersen, U.B.; Stendel, M.; Midzi, N.; Mduluza, T.; Soko, W.; Stensgaard, A.S.; Vennervald, B.J.; Mukaratirwa, S. Modelling climate change impact on the spatial distribution of fresh water snails hosting trematodes in Zimbabwe. Parasit. Vectors 2014, 7, 536. [Google Scholar] [CrossRef][Green Version]
- Chamaillé, L.; Tran, A.; Meunier, A.; Bourdoiseau, G.; Ready, P.; Dedet, J.P. Environmental risk mapping of canine leishmaniasis in France. Parasit. Vectors 2010, 3, 31. [Google Scholar] [CrossRef]
- Moyes, C.L.; Shearer, F.M.; Huang, Z.; Wiebe, A.; Gibson, H.S.; Nijman, V.; Mohd-Azlan, J.; Brodie, J.F.; Malaivijitnond, S.; Linkie, M.; et al. Predicting the geographical distributions of the macaque hosts and mosquito vectors of Plasmodium knowlesi malaria in forested and non-forested areas. Parasit. Vectors 2016, 9, 242. [Google Scholar] [CrossRef]
- Wang, Y.; Zheng, P.; Pan, W. Predicting the potential suitable distribution area of Pomacea canaliculata in China based on the GARP ecological niche modeling. J. Fujian Agri Fore Univ. (Nat. Sci. Ed.) 2018, 47, 21–25. [Google Scholar] [CrossRef]
- Zhang, H.; Luo, D.; Mu, X.; Wei, H.; Luo, J.; Zhang, J.; Hu, C. Predicting the potential suitable distribution area of the apple snail Pomacea canaliculata in China based on multiple ecological niche models. Chin. J. Appl. Ecol. 2016, 27, 1277–1284. [Google Scholar] [CrossRef]
- Elith, J.; Phillips, S.J.; Hastie, T.; Dudik, M.; Chee, Y.; Yates, C.J. A statistical explanation of MaxEnt for ecologists. Divers. Distrib. 2015, 17, 43–57. [Google Scholar] [CrossRef]
- Xing, D.; Hao, Z. The principle of maximum entropy and its application in ecology. Biodivers. Sci. 2011, 19, 295–302. [Google Scholar] [CrossRef]
- Elith, J.; Graham, C.H.; Anderson, R.P.; Dudik, M.; Ferrier, S.; Guisan, A. Novel methods improve prediction of species’ distributions from occurrence data. Ecography 2010, 29, 129–151. [Google Scholar] [CrossRef]
- Wu, S.; Yin, Y.; Zheng, D.; Yang, Q. Trend of climate change in the Tibetan Plateau in the past 30 years. Acta Geogr. Sin. 2005, 1, 3–11. [Google Scholar]
- Liu, Q. Impact of climate change on vector-borne diseases and related response strategies in China: Major research findings and recommendations for future research. Chin. J. Vector Biol. Control 2021, 32, 1–11. [Google Scholar] [CrossRef]
- Chen, D.; Xu, B.; Yao, T.; Guo, Z.; Cui, P.; Chen, F. Assessment of past, present and future environmental changes on the Tibetan Plateau. Chin. Sci. Bull. 2015, 60, 3025–3035+1–2. [Google Scholar] [CrossRef]
- Carpenter, G.; Gillison, A.N.; Winter, J. DOMAIN: A flexible modelling procedure for mapping potential distributions of plants and animals. Biodivers. Conserv. 1993, 2, 667–680. [Google Scholar] [CrossRef]
- Phillips, S.J.; Anderson, R.P.; Schapire, R.E. Maximum entropy modeling of species geographic distributions. Ecol. Model. 2006, 190, 231–259. [Google Scholar] [CrossRef]
- Warren, D.L.; Seifert, S.N. Ecological niche modeling in Maxent: The importance of model complexity and the performance of model selection criteria. Ecol. Appl. 2011, 21, 335–342. [Google Scholar] [CrossRef]
- Warren, D.L.; Wright, A.N.; Seifert, S.N.; Shaffer, H.B. Incorporating model complexity and spatial sampling bias into ecological niche models of climate change risks faced by 90 California vertebrate species of concern. Divers. Distrib. 2014, 20, 334–343. [Google Scholar] [CrossRef]
- Zhu, G.; Qiao, H. Effect of the Maxent model’s complexity on the prediction of species potential distribution area. Biodivers. Sci. 2016, 24, 1189–1196. [Google Scholar] [CrossRef]
- Muscarella, R.; Galante, P.J.; Soley-Guardia, M.; Boria, R.A.; Kass, J.M.; Uriarte, M.; Anderson, R.P. ENMeval: An R package for conducting spatially independent evaluations and estimating optimal model complexity for MAXENT ecological niche models. Methods in Ecol Evol. 2014, 5, 1198–1205. [Google Scholar] [CrossRef]
- Liu, C.; White, M.; Newell, G. Measuring and comparing the accuracy of species distribution models with presence–absence data. Ecography 2011, 34, 232–243. [Google Scholar] [CrossRef]
- Zhu, G.; Fan, J.; Wang, M.; Chen, M.; Qiao, H. The importance of the shape of receiver operating characteristic (ROC) curve in ecological niche model evaluation—Case study of Hlyphantria cunea. J. Biosaf. 2017, 26, 184–190. [Google Scholar] [CrossRef]
- Zhu, Y.; Wei, W.; Li, H.; Wang, B.; Yang, X.; Liu, Y. Modelling the potential distribution and shifts of three varieties of Stipa tianschanica in the eastern Eurasian Steppe under multiple climate change scenarios. Glob. Ecol. Conserv. 2018, 16, e00501. [Google Scholar] [CrossRef]
- Hu, Z.; Nong, M.; Yu, W.; Yu, Q.; Hu, E. MaxEnt distribution prediction of Dermacentor nuttalli in Xinjiang region of China. Ecol. Sci. 2022, 41, 92–101. [Google Scholar] [CrossRef]
- Fan, J.; Gao, J.; Yuan, X.; Tan, Y.; Wei, Z.; Gao, J. Junior Secondary School Geography: Volume 2, Eighth Grade Edition; People’s Education Press: Beijing, China, 2023; p. 88. [Google Scholar]
- He, T.; Zhou, Y.; Cheng, N.; Shi, Y.; Tang, M.; Xu, X. Molecular identification and genetic polymorphism analysis of Fasciola hepatica in Nanning area, Guangxi. Chin. J. Pathogenic Biol. 2021, 16, 557–563. [Google Scholar] [CrossRef]
- Li, S.; Li, C.; Chen, F.; Hao, M.; Li, X.; Zhao, Y.; Zhang, D.; Zhang, Q.; Li, C.; Zhang, J.; et al. Investigation and molecular identification of Fasciolopsis buski infection in domestic animals in Dali Bai Autonomous Prefecture, Yunnan Province. Chin. J. Parasitol. Parasit. Dis. 2024, 42, 715–720. [Google Scholar]
- Ichikawa-Seki, M.; Peng, M.; Hayashi, K.; Shoriki, T.; Mohanta, U.K.; Shibahara, T.; Itagaki, T. Nuclear and mitochondrial DNA analysis reveals that hybridization between Fasciola hepatica and Fasciola gigantica occurred in China. Parasitology 2017, 144, 206–213. [Google Scholar] [CrossRef] [PubMed]
- Yao, J.; Jia, T. Global distribution and transmission of Fasciola. Chin. J. Schistosomiasis Control 2019, 34, 654–658. [Google Scholar] [CrossRef]
- Chidan, L.; Wu, J.; Lin, H.; Ma, X. Investigation and comprehensive control technology of fascioliasis in cattle and sheep in the county of Xigaze, Tibet. Tibet’s Sci. Technol. 2014, 1, 50–52. [Google Scholar]
- LI, W. Investigation on Fasciola hepatica Infection of Tibetan Sheep in Some Areas of Qinghai Province and Drug Dehelminth Test. Masrer’s Thesis, Qinghai University, Xining, China, 2014. [Google Scholar]
- Mas-Coma, S.; Valero, M.A.; Bargues, M.D. Chapter 2. Fasciola, lymnaeids and human fascioliasis, with a global overview on disease transmission, epidemiology, evolutionary genetics, molecular epidemiology and control. Adv. Parasitol. 2009, 69, 41–146. [Google Scholar] [CrossRef]
- Mas-Coma, S.; Buchon, P.; Funatsu, I.R.; Angles, R.; Mas-Bargues, C.; Artigas, P.; Valero, M.A.; Bargues, M.D. Donkey fascioliasis within a One Health control action: Transmission capacity, field epidemiology, and reservoir role in a human hyperendemic area. Front. Vet. Sci. 2020, 7, 591384. [Google Scholar] [CrossRef] [PubMed]
- Young, M.R. The life cycles of six species of freshwater molluscs in the Worcester-Birmingham canal. J. Mollus Stud. 1975, 41, 533–548. [Google Scholar]
- Økland, J. Lakes and Snails: Environment and Gastropoda in 1500 Norwegian lakes, Ponds and Rivers; English Edition; Balogh Scientific Books: Oegstgeest, The Netherlands, 1990. [Google Scholar]
- Taft, L.; Wiechert, U.; Riedel, F.; Marc, W.; Zhang, H. Sub-seasonal oxygen and carbon isotope variations in shells of modern Radix sp.(Gastropoda) from the Tibetan Plateau: Potential of a new archive for palaeoclimatic studies. Quat. Sci. Rev. 2012, 34, 44–56. [Google Scholar] [CrossRef]
- White, D.; Preece, R.C.; Shchenikov, A.A.; Parfitt, S.A.; Dlussky, K.G. A Holocene molluscan succession from floodplain sediments of the upper Lena River (Lake Baikal region), Siberia. Quat. Sci. Rev. 2008, 27, 962–987. [Google Scholar] [CrossRef]
- Gaten, E. Life cycle of Lymnaea peregra (Gastropoda: Pulmonata) in the Leicester canal, UK, with an estimate of annual production. Hydrobiologia 1986, 135, 45–54. [Google Scholar] [CrossRef]
- Sheng, S.; Gui, H.; Zhang, M.; Tai, Y.; Ni, S. Ecological study on snails (Lymnaeidae) in Huainan section of the Huaihe River. Chin. J. Appl. Environ. Biol. 2005, 5, 45–47. [Google Scholar]
- Yi, M.; Bai, B.; Liu, Y. Seasonal dynamics of fascioliasis in livestock and selection of the best dehelminth time in high altitude areas. Chin. J. Vet. 1995, 7, 20–22. [Google Scholar]
- Cai, D. Epidemiological investigation of fascioliasis in Tibetan sheep in high altitude pastoral areas. Anim. Husb. Vet Med. 2012, 44, 101–102. [Google Scholar]


Disclaimer/Publisher’s Note: The statements, opinions and data contained in all publications are solely those of the individual author(s) and contributor(s) and not of MDPI and/or the editor(s). MDPI and/or the editor(s) disclaim responsibility for any injury to people or property resulting from any ideas, methods, instructions or products referred to in the content. |
© 2025 by the authors. Licensee MDPI, Basel, Switzerland. This article is an open access article distributed under the terms and conditions of the Creative Commons Attribution (CC BY) license (https://creativecommons.org/licenses/by/4.0/).