
Q Fever-Related Community Infections: United States Exposure to Coxiella burnetii
Abstract
1. Introduction
2. Materials and Methods
2.1. NHANES Occupational Data
2.2. C. burnetii Serology Data
2.3. Statistical Methods
3. Results
3.1. Overall US C. burnetii Seroprevalence
3.2. Occupational Sample Data Descriptives
3.3. C. burnetii Seroprevalence in Those with No History of Agricultural Work
3.4. Length of Residence Data for US Immigrants
3.5. Occupational Data Analysis
4. Discussion
Limitations
Supplementary Materials
Author Contributions
Funding
Institutional Review Board Statement
Informed Consent Statement
Data Availability Statement
Acknowledgments
Conflicts of Interest
Abbreviations
| NHANES | US National Health and Nutrition Examination Survey |
| NCHS | US National Center for Health Statistics |
| BLS | US Bureau of Labor Statistics |
| NNDSS | US National Notifiable Diseases Surveillance System |
| ELISA | Enzyme-linked immunosorbent assay |
| IFA | Immunofluorescence assay |
References
- Anderson, A.; Bijlmer, H.; Fournier, P.-E.; Graves, S.; Hartzell, J.; Kersh, G.J.; Limonard, G.; Marrie, T.J.; Massung, R.F.; McQuiston, J.H.; et al. Diagnosis and management of Q fever—United States, 2013: Recommendations from CDC and the Q fever working group. MMWR Recomm. Rep. RR-03 2013, 62, 1–30. [Google Scholar]
- CDC Wonder. Notifiable Infectious Diseases and Conditions, United States: Annual Tables. 2022. Available online: https://wonder.cdc.gov/nndss-annual-summary.html (accessed on 27 April 2025).
- Parker, N.R.; Barralet, J.H.; Bell, A.M. Q fever. Lancet 2006, 367, 679–688. [Google Scholar] [CrossRef]
- Brooke, R.J.; Kretzschmar, M.E.; Mutters, N.T.; Teunis, S.P. Human dose response relation for airborne exposure to Coxiella burnetii. BMC Infect. Dis. 2013, 13, 488. [Google Scholar] [CrossRef]
- Heppell, C.W.; Egan, J.R.; Hall, I. A human time dose response model for Q fever. Epidemics 2017, 21, 30–38. [Google Scholar] [CrossRef] [PubMed]
- Eldin, C.; Mélenotte, C.; Mediannikov, O.; Ghigo, E.; Million, M.; Edouard, S.; Mege, J.L.; Maurin, M.; Raoult, D. From Q fever to Coxiella burnetii infection: A paradigm change. Clin. Microbiol. Rev. 2017, 30, 115–190. [Google Scholar] [CrossRef]
- Kersh, G.J.; Wolfe, T.M.; Fitzpatrick, K.A.; Candee, A.J.; Oliver, L.D.; Patterson, N.E.; Self, J.S.; Priestley, R.A.; Loftis, A.D.; Massung, R.F. Presence of Coxiella burnetii DNA in the environment of the United States, 2006 to 2008. Appl. Environ. Microbiol. 2010, 76, 4469–4475. [Google Scholar] [CrossRef] [PubMed]
- McQuiston, J.H.; Childs, J.E. Q fever in humans and animals in the United States. Vector Borne Zoonotic Dis. 2002, 2, 179–191. [Google Scholar] [CrossRef]
- National Association of State Public Health Veterinarians, National Assembly of State Animal Health Officials. Prevention and Control of Coxiella burnetii Infection Among Humans and Animals: Guidance for a Coordinated Public health and Animal Health Response. Available online: http://nasphv.org/Documents/Q_Fever_2013.pdf (accessed on 2 February 2025).
- Cherry, C.C.; Heitman, K.N.; Bestul, N.C.; Kersh, G.J. Acute and chronic Q fever national surveillance—United States, 2008-2017. Zoonoses Public Health 2022, 69, 73–82. [Google Scholar] [CrossRef]
- Anderson, A.D.; Kruszon-Moran, D.; Loftis, A.D.; McQuillan, G.; Nicholson, W.L.; Priestley, R.A.; Candee, A.J.; Patterson, N.E.; Massung, R.F. Seroprevalence of Q fever in the United States, 2003–2004. Am. J. Trop. Med. Hyg. 2009, 81, 691–694. [Google Scholar] [CrossRef]
- US National Health and Nutrition Examination Survey. Questionnaire: SP (2003-04) Occupation. OCQ-C. Available online: https://wwwn.cdc.gov/nchs/data/nhanes/public/2003/questionnaires/sp_ocq_c.pdf (accessed on 2 February 2025).
- Zipf, G.; Chiappa, M.; Porter, K.S.; Ostchega, Y.; Lewis, B.G.; Dostal, J. National Health and Nutrition Examination Survey: Plan and operations, 1999–2010. Vital Health Stat 1 2013, 56, 1–28. [Google Scholar]
- Curtin, L.R.; Mohadjer, L.K.; Dohrmann, S.M.; Montaquila, J.M.; Kruszan-Moran, D.; Mirel, L.B.; Carroll, M.D.; Hirsch, R.; Schober, S.; Johnson, C.L. The National Health and Nutrition Examination Survey: Sample design, 1999–2006. Vital Health Stat 2 2012, 155, 1–39. [Google Scholar]
- US National Health and Nutrition Examination Survey. Unweighted Response Rates for NHANES 2003–2004 by Age and Gender. Available online: https://wwwn.cdc.gov/nchs/data/ResponseRates/RRT0102MF.pdf (accessed on 2 February 2025).
- US National Health and Nutrition Examination Survey. 2003–2004 Data Documentation, Codebook, and Frequencies Occupation (OCQ_C). Available online: https://wwwn.cdc.gov/nchs/nhanes/continuousnhanes/default.aspx?BeginYear=2003 (accessed on 30 March 2025).
- National Institute for Occupational Safety and Health. Collecting and Using Industry and Occupation Data. Available online: https://www.cdc.gov/niosh/occupation-industry-data/about-data/coding/classification-systems.html?CDC_AAref_Val=https://www.cdc.gov/niosh/topics/coding/more.html (accessed on 2 February 2025).
- Krieger, N.; Bareau, E.M.; Soobader, M.J. Class matters: U.S. versus U.K. measures of occupational disparities in access to health services and health status in the 2000 U.S. National Health Interview Survey. Int. J. Health Serv. 2005, 35, 213–236. [Google Scholar] [CrossRef]
- U.S. Bureau of Labor Statistics. Labor Force Statistics from the Current Population Survey. Concepts and Definitions. Available online: https://www.bls.gov/cps/definitions.htm (accessed on 27 April 2025).
- US National Health and Nutrition Examination Survey. 2003–2004 Data Documentation, Codebook, and Frequencies. Coxiella burnetii (Q Fever) Antibodies—Serum (Surplus) (SSQFEV_C), Update 2022. Available online: https://wwwn.cdc.gov/Nchs/Data/Nhanes/Public/2003/DataFiles/SSQFEV_C.htm (accessed on 27 April 2025).
- Péter, O.; Dupuis, G.; Burgdorfer, W.; Peacock, M. Evaluation of the complement fixation and indirect immunofluorescence tests in the early diagnosis of primary Q fever. Eur. J. Clin. Microbiol. 1985, 4, 394–396. [Google Scholar] [CrossRef]
- Philip, R.N.; Casper, E.A.; Ormsbee, R.A.; Burgdorfer, W. Microimmunofluorescence test for the serological study of rocky mountain spotted fever and typhus. J. Clin. Microbiol. 1976, 3, 51–61. [Google Scholar] [CrossRef] [PubMed]
- Parker, J.D.; Talih, M.; Irimata, K.E.; Zhang, G.; Branum, A.M.; Davis, D.; Das, B.; Hamilton, B.E.; Kochanek, K. National Center for Health Statistics data presentation standards for rates and counts. Vital Health Stat. 2 2023, 200. Available online: https://stacks.cdc.gov/view/cdc/124368 (accessed on 27 April 2025).
- Parker, J.D.; Talih, M.; Malec, D.J.; Beresovsky, V.; Carroll, M.; Gonzalez, J.F.; Hamilton, B.E.; Ingram, D.D.; Kochanek, K.; McCarty, F. National Center for Health Statistics data presentation standards for proportions. Vital Health Stat. 2 2017, 175, 1–22. Available online: https://www.cdc.gov/nchs/data/series/sr_02/sr02_175.pdf (accessed on 27 April 2025).
- US National Health and Nutrition Examination Survey. NHANES Tutorials, Reliability of Estimates. Available online: https://wwwn.cdc.gov/nchs/nhanes/tutorials/ReliabilityOfEstimates.aspx (accessed on 27 April 2025).
- Tan, T.; Heller, J.; Firestone, S.; Stevenston, M.; Wiethoelter, A. A systematic review of global Q fever outbreaks. One Health 2023, 18, 100667. [Google Scholar] [CrossRef]
- Ahaduzzaman, M.; Reza, M.M. Global and regional seroprevalence of coxiellosis in small ruminants: A systematic review and meta-analysis. Vet. Med. Sci. 2024, 10, e1441. [Google Scholar] [CrossRef]
- Berge, T.O.; Lennette, E.H. World distribution of Q fever: Human, animal and arthropod infection. Am. J. Hyg. 1953, 57, 125–143. [Google Scholar] [CrossRef]
- Gisbert, P.; Garcia-Ispierto, I.; Quintela, L.A.; Guatteo, R. Coxiella burnetii and reproductive disorders in cattle: A Systematic Review. Animals 2024, 14, 1313. [Google Scholar] [CrossRef]
- Olivas, S.; Hornstra, H.; Priestley, R.A.; Kaufman, E.; Hepp, C.; Sonderegger, D.L.; Handady, K.; Massung, R.F.; Keim, P.; Kersh, G.J.; et al. Massive dispersal of Coxiella burnetii among cattle across the United States. Microb. Genom. 2016, 2, e000068. [Google Scholar] [CrossRef]
- Toledo-Perona, R.; Contreras, A.; Gomis, J.; Quereda, J.J.; García-Galán, A.; Sánchez, A.; Gómez-Martín, Á. Controlling Coxiella burnetii in naturally infected sheep, goats and cows, and public health implications: A scoping review. Front. Vet. Sci. 2024, 11, 1321553. [Google Scholar] [CrossRef] [PubMed]
- Agency for Healthcare Quality and Research. Overview of the National (Nationwide) Inpatient Sample (NIS). Available online: https://hcup-us.ahrq.gov/nisoverview.jsp (accessed on 2 February 2025).
- Centers for Disease Control and Prevention. Q Fever Epidemiology and Statistics. Available online: https://www.cdc.gov/q-fever/data-research/index.html (accessed on 27 April 2025).
- Miller, H.K.; Binder, A.M.; Peterson, A.; Theel, E.S.; Volpe, J.M.; Couturier, M.R.; Cherry, C.C.; Kersh, G.J. Trends in Q fever serologic testing by immunofluorescence from four large reference laboratories in the United States, 2012–2016. Sci Rep. 2018, 8, 16670. [Google Scholar] [CrossRef] [PubMed]
- Mohamad Alahmad, M.A.; Hammoud, K.A. Inpatient Q fever frequency is on the rise. Can. J. Infect. Dis. Med. Microbiol. 2023, 31, 4243312. [Google Scholar] [CrossRef]
- Ebani, V.V. Coxiella burnetii Infection in Cats. Pathogens 2023, 12, 1415. [Google Scholar] [CrossRef] [PubMed]
- Pinsky, R.L.; Fishbein, D.B.; Greene, C.R.; Gensheimer, K.F. An outbreak of cat-associated Q fever in the United States. J. Infect. Dis. 1991, 164, 202–204. [Google Scholar] [CrossRef]
- Langley, J.M.; Marrie, T.J.; Covert, A.; Waag, D.M.; Williams, J.C. Poker Players’ Pneumonia: An urban outbreak of Q fever following exposure to a parturient cat. N. Engl. J. Med. 1988, 319, 354–356. [Google Scholar] [CrossRef]
- Marrie, T.J.; Langille, D.; Papukna, V.; Yates, L. Truckin’ pneumonia—An outbreak of Q fever in a truck repair plant probably due to aerosols from clothing contaminated by contact with newborn kittens. Epidemiol. Infect. 1989, 102, 119–127. [Google Scholar] [CrossRef]
- Buhariwalla, F.; Cann, B.; Marriem, T.J. A dog-related outbreak of Q fever. Clin. Infect. Dis. 1996, 23, 753–755. [Google Scholar] [CrossRef]
- McMillan, I.A.; Norris, M.H.; Golon, S.J.; Franckowiak, G.A.; Grinolds, J.M.; Goldstein, S.M.; Phelps, D.M.; Bodenchuk, M.J.; Leland, B.R.; Bowen, R.A.; et al. Serosurveillance of Coxiella burnetii in feral swine populations of Hawai’i and Texas identifies overlap with human Q fever incidence. J. Clin. Microbiol. 2024, 62, e0078024. [Google Scholar] [CrossRef]
- Reusken, C.; van der Plaats, R.; Opsteegh, M.; de Bruin, A.; Swart, A. Coxiella burnetii (Q fever) in Rattus norvegicus and Rattus rattus at livestock farms and urban locations in the Netherlands; could Rattus spp. represent reservoirs for (re)introduction? Prev. Vet. Med. 2011, 101, 124–130. [Google Scholar] [CrossRef] [PubMed]
- Meredith, A.; Cleaveland, S.C.; Denwood, M.J.; Brown, J.K.; Shaw, D.J. Coxiella burnetii (Q-Fever) Seroprevalence in Prey and Predators in the United Kingdom: Evaluation of Infection in Wild Rodents, Foxes and Domestic Cats Using a Modified ELISA. Transbound. Emerg. Dis. 2015, 62, 639–649. [Google Scholar] [CrossRef] [PubMed]
- Kersh, G.J.; Fitzpatrick, K.A.; Self, J.S.; Priestley, R.A.; Kelly, A.J.; Lash, R.R.; Marsden-Haug, N.; Nett, R.J.; Bjork, A.; Massung, R.F.; et al. Presence and persistence of Coxiella burnetii in the environments of goat farms associated with a Q fever outbreak. Appl. Environ. Microbiol. 2013, 79, 697–1703. [Google Scholar] [CrossRef]
- de Bruin, A.; van der Plaats, R.Q.; de Heer, L.; Paauwe, R.; Schimmer, B.; Vellema, P.; van Rotterdam, B.J.; van Duynhoven, Y.T. Detection of Coxiella burnetii DNA on Small-Ruminant Farms during a Q fever Outbreak in the Netherlands. Appl. Environ. Microbiol. 2012, 78, 1652–1657. [Google Scholar] [CrossRef] [PubMed]
- de Bruin, A.; Janse, I.; Koning, M.; de Heer, L.; van der Plaats, R.Q.; van Leuken, J.P.; van Rotterdam, B.J. Detection of Coxiella burnetii DNA in the environment during and after a large Q fever epidemic in the Netherlands. J. Appl. Microbiol. 2013, 114, 1395–1404. [Google Scholar] [CrossRef]
- Yessinou, R.E.; Katja, M.S.; Heinrich, N.; Farougou, S. Prevalence of Coxiella-infections in ticks—Review and meta-analysis. Ticks Tick. Borne Dis. 2022, 13, 101926. [Google Scholar] [CrossRef]
- Duron, O.; Sidi-Boumedine, K.; Rousset, E.; Moutaillerm, S.; Jourdain, E. The Importance of Ticks in Q fever Transmission: What Has (and Has Not) Been Demonstrated? Trends Parasitol. 2015, 31, 536–552. [Google Scholar] [CrossRef]
- Graves, S.R.; Gerrard, J.; Coghill, S. Q fever following a tick bite. Aust. J. Gen. Pract. 2020, 49, 823–825. [Google Scholar] [CrossRef]
- Beaman, M.H.; Hung, J. Pericarditis associated with tick-borne Q fever. Aust. N. Z. J. Med. 1989, 19, 254–256. [Google Scholar] [CrossRef]
- Nett, R.J.; Book, E.; Anderson, A.D. Q fever with unusual exposure history: A classic presentation of a commonly misdiagnosed disease. Case Rep. Infect. Dis. 2012, 2012, 916142. [Google Scholar] [CrossRef]
- Kim, S.G.; Kim, E.H.; Lafferty, C.J.; Dubovi, E. Coxiella burnetii in bulk tank milk samples, United States. Emerg. Infect. Dis. 2005, 11, 619–621. [Google Scholar] [CrossRef] [PubMed]
- Signs, K.A.; Stobierski, M.G.; Gandhi, T.N. Q fever cluster among raw milk drinkers in Michigan, 2011. Clin. Infect. Dis. 2012, 55, 1387–1389. [Google Scholar] [CrossRef] [PubMed]
- Beck, M.D.; Bell, J.A.; Shaw, E.W.; Heubner, R.J. Q fever studies in Southern California; an epidemiological study of 300 cases. Public Health Rep. 1949, 14, 41–56. [Google Scholar] [CrossRef]
- Gale, P.; Kelly, L.; Mearns, R.; Duggan, J.; Snary, E.L. Q fever through consumption of unpasteurised milk and milk products—A risk profile and exposure assessment. J. Appl. Microbiol. 2015, 118, 1083–1095. [Google Scholar] [CrossRef]
- Deutsch, D.L.; Peterson, E.T. Q fever: Transmission from one human being to others. J. Am. Med. Assoc. 1950, 143, 348–350. [Google Scholar] [CrossRef]
- Amit, S.; Shinar, S.; Halutz, O.; Atiya-Nasagi, Y.; Giladi, M. Suspected person-to-person transmission of Q fever among hospitalized pregnant women. Clin. Infect. Dis. 2014, 58, e146–e147. [Google Scholar] [CrossRef] [PubMed]
- Raoult, D.; Stein, A. Q fever during pregnancy—A risk for women, fetuses, and obstetricians. N. Engl. J. Med. 1994, 330, 371. [Google Scholar] [CrossRef]
- Harman, J.B. Q fever in Great Britain; clinical account of eight cases. Lancet 1949, 254, 1028–1030. [Google Scholar] [CrossRef]
- Osorio, S.; Sarriá, C.; González-Ruano, P.; Casal, E.C.; García, A. Nosocomial transmission of Q fever. J. Hosp. Infect. 2003, 54, 162–163. [Google Scholar] [CrossRef]
- Milazzo, A.; Hall, R.; Storm, P.A.; Harris, R.J.; Winslow, W.; Marmion, B.P. Sexually transmitted Q fever. Clin. Infect. Dis. 2001, 33, 399–402. [Google Scholar] [CrossRef]
- Kruszewska, D.; Lembowicz, K.; Tylewska-Wierzbanowska, S. Possible sexual transmission of Q fever among humans. Clin. Infect. Dis. 1996, 22, 1087–1088. [Google Scholar] [CrossRef] [PubMed]
- Miceli, M.H.; Veryser, A.K.; Anderson, A.D.; Hofinger, D.; Lee, S.A.; Tancik, C. A case of person-to-person transmission of Q fever from an active duty serviceman to his spouse. Vector-Borne Zoonotic Dis. 2010, 10, 539–541. [Google Scholar] [CrossRef]
- Million, M.; Roblot, F.; Carles, D.; D’Amato, F.; Protopopescu, C.; Carrieri, M.P.; Raoult, D. Reevaluation of the risk of fetal death and malformation after Q fever. Clin. Infect. Dis. 2014, 59, 256–260. [Google Scholar] [CrossRef] [PubMed]
- Levin, G.; Herzberg, S.; Attari, R.; Abu Khatab, A.; Gil, M.; Rottenstreich, A. Q fever first presenting as a septic shock resulting in intrauterine fetal death. Eur. J. Obstet. Gynecol. Reprod. Biol. 2018, 229, 204–205. [Google Scholar] [CrossRef] [PubMed]
- Ellis, M.E.; Smith, C.C.; Moffat, M.A. Chronic or fatal Q-fever infection: A review of 16 patients seen in North-East Scotland (1967-80). Q. J. Med. 1983, 52, 54–66. [Google Scholar]
- Johnson, J.E.; Kadull, P.J. Laboratory-acquired Q fever. A report of fifty cases. Am. J. Med. 1966, 41, 391–403. [Google Scholar] [CrossRef]
- Fonseca, F.; Pinto, M.R.; De Azevedo, J.F.; Lacerda, M.T. Q Fever in Portugal. History, Clinical Observations, Diagnosis. Clin. Contemp. 1949, 3, 1159–1171. Available online: https://www.cabdirect.org/cabdirect/abstract/19502902290 (accessed on 2 February 2025).
- Anonymous. Commentary: Experimental Q Fever in Man. Br. Med. J. 1950, 1, 1000. [Google Scholar]
- Robyn, M.P.; Newman, A.P.; Amato, M.; Walawander, M.; Kothe, C.; Nerone, J.D.; Pomerantz, C.; Behravesh, C.B.; Biggs, H.M.; Dahlgren, F.S.; et al. Q fever outbreak among travelers to Germany associated with live cell therapy—United States and Canada, 2014: A co-publication. Can. Commun. Dis. Rep. 2015, 41, 223–226. [Google Scholar] [CrossRef]
- van Kraaij, M.G.; Slot, E.; Hogema, B.M.; Zaaijer, H.L. Lookback procedures after postdonation notifications during a Q fever outbreak in the Netherlands. Transfusion 2013, 53, 716–721. [Google Scholar] [CrossRef]
- Kersh, G.J.; Priestley, R.; Massung, R.F. Stability of Coxiella burnetii in stored human blood. Transfusion 2013, 53, 1493–1496. [Google Scholar] [CrossRef] [PubMed]
- Goldberg, J.S.; Perkins, H.A.; Zapitz, V.M.; Hurst, B.B.; Suther, D.; Jensen, F.; Lenette, E.H.; Damus, K.; Roberto, R.R. Q fever—California. Morb. Mortal. Wkly. Rep. 1977, 26, 86–91. [Google Scholar]
- Hogema, B.M.; Slot, E.; Molier, M.; Schneeberger, P.M.; Hermans, M.H.; van Hannen, E.J.; van der Hoek, W.; Cuijpers, H.T.; Zaaijer, H.L. Coxiella burnetii infection among blood donors during the 2009 Q-fever outbreak in The Netherlands. Transfusion 2012, 52, 144–1450. [Google Scholar] [CrossRef] [PubMed]
- Oei, W.; Kretzschmar, M.E.; Zaaijer, H.L.; Coutinho, R.; van der Poel, C.L.; Janssen, M.P. Estimating the transfusion transmission risk of Q fever. Transfusion 2014, 54, 1705–1711. [Google Scholar] [CrossRef]
- Kanfer, E.; Farrag, N.; Price, C.; MacDonald, D.; Coleman, J.; Barrett, A.J. Q fever following bone marrow transplantation. Bone Marrow Transpl. 1988, 3, 165–166. [Google Scholar]
- Gürtler, L.; Bauerfeind, U.; Blümel, J.; Burger, R.; Drosten, C.; Gröner, A.; Heiden, M.; Hildebrandt, M.; Jansen, B.; Offergeld, R.; et al. Coxiella burnetii—Pathogenic Agent of Q (Query) Fever. 2014. Transfus. Med. Hemother. 2014, 41, 60–72. [Google Scholar] [CrossRef]
- Derrick, E.H. Q Fever a new fever entity: Clinical features. diagnosis, and laboratory investigation. Med. J. Aust. 1937, 2, 281–299. [Google Scholar] [CrossRef]
- Bell, J.A.; Beck, M.D.; Huebner, R.J. Epidemiologic Studies of Q fever in Southern California. JAMA 1950, 142, 868–872. [Google Scholar] [CrossRef]
- Topping, N.H.; Shepard, C.C.; Irons, J.V. Q fever in the United States: Epidemiologic Studies of an Outbreak Among Stock Handlers and Slaughterhouse Workers. JAMA 1947, 133, 813–815. [Google Scholar] [CrossRef]
- Uren, A.M.; Harris, J.; Slinko, V.; Vosti, F.; Young, M. Q fever infection is a preventable risk associated with pet food manufacturing. Ann. Work Expo. Health 2024, 68, 104–107. [Google Scholar] [CrossRef]
- National Institute for Occupational Safety and Health (NIOSH). Occupational Hazard Assessment: Criteria for Controlling Occupational Hazards Animal Rendering Processes. Available online: https://www.cdc.gov/niosh/docs/81-133/default.html (accessed on 2 February 2025).
- Wade, A.J.; Cheng, A.C.; Athan, E.; Molloy, J.; Harris, O.C.; Stenos, J.; Hughes, A.J. Q fever outbreak at a cosmetics supply factory. Clin. Infect. Dis. 2006, 42, e50–e52. [Google Scholar] [CrossRef] [PubMed]
- Wattiau, P.; Boldisova, E.; Toman, R.; Van Esbroeck, M.; Quoilin, S.; Hammadi, S.; Tissot-Dupont, H.; Raoult, D.; Henkinbrandt, J.M. Q fever in Woolsorters, Belgium. Emerg. Infect. Dis. 2011, 17, 2368–2369. [Google Scholar] [CrossRef]
- Sigel, M.M.; Scott, T.F.; Henle, W.; Janton, O.H. Q fever in a wool and hair processing plant. Am. J. Public Health Nations Health 1950, 40, 524–532. [Google Scholar] [CrossRef] [PubMed]
- Clark, W.H.; Lennette, E.H.; Romer, M.S. Q fever in California. IX. An outbreak aboard a ship transporting goats. Am. J. Hyg. 1951, 54, 35–43. [Google Scholar]
- Alonso, E.; Eizaguirre, D.; Lopez-Etxaniz, I.; Olaizola, J.I.; Ocabo, B.; Barandika, J.F.; Jado, I.; Álvarez-Alonso, R.; Hurtado, A.; García-Pérez, A.; et al. A Q fever outbreak associated to courier transport of pets. PLoS ONE 2019, 14, e0225605. [Google Scholar] [CrossRef] [PubMed]
- Bayer, R.A. Q fever as an occupational illness at the National Institutes of Health. Public Health Rep. 1982, 97, 58–60. [Google Scholar]
- Hall, C.J.; Richmond, S.J.; Caul, E.O.; Pearce, N.H.; Silver, I.A. Laboratory outbreak of Q fever acquired from sheep. Lancet 1982, 1, 1004–1006. [Google Scholar] [CrossRef]
- Meiklejohn, G.; Reimer, L.G.; Graves, P.S.; Helmick, C. Cryptic Epidemic of Q fever in a Medical School. Infect Dis. 1981, 144, 107–113. [Google Scholar] [CrossRef]
- Galganski, L.A.; Keller, B.A.; Long, C.; Yamashiro, K.J.; Hegazi, M.S.; Pivetti, C.D.; Talken, L.A.; Raff, G.W.; Farmer, D.L.; Chomel, B.B.; et al. Minimizing the risk of occupational Q fever exposure: A protocol for ensuring Coxiella burnetii-negative pregnant ewes are used for medical research. Lab. Anim. 2021, 55, 170–176. [Google Scholar] [CrossRef]
- Simor, A.E.; Brunton, J.L.; Salit, I.E.; Vellend, H.; Ford-Jones, L.; Spence, L.P. Q fever: Hazard from sheep used in research. Can. Med. Assoc. J. 1984, 130, 1013–1036. [Google Scholar]
- Curet, L.B.; Paust, J.C. Transmission of Q fever from experimental sheep to laboratory personnel. Am. J. Obstet. Gynecol. 1972, 114, 566–568. [Google Scholar] [CrossRef] [PubMed]
- Centers for Disease Control. Q Fever at a University Research Center-California. Morb. Mortal. Wkly. Rep. 1979, 28, 333. [Google Scholar]
- Mann, J.S.; Douglas, J.G.; Inglis, J.M.; Leitch, A.G. Q fever: Person to person transmission within a family. Thorax 1986, 41, 974–975. [Google Scholar] [CrossRef] [PubMed]
- Schimmer, B.; Lenferink, A.; Schneeberger, P.; Aangenend, H.; Vellema, P.; Hautvast, J.; van Duynhoven, Y. Seroprevalence and risk factors for Coxiella burnetii (Q fever) seropositivity in dairy goat farmers’ households in The Netherlands, 2009–2010. PLoS ONE 2012, 7, e42364. [Google Scholar] [CrossRef]
- Proboste, T.; Clark, N.J.; Tozer, S.; Wood, C.; Lambert, S.B.; Soares Magalhães, R.J. Profiling risk factors for household and community spatiotemporal clusters of Q fever notifications in Queensland between 2002 and 2017. Pathogens 2022, 11, 830. [Google Scholar] [CrossRef]
- Whitney, E.A.; Massung, R.F.; Candee, A.J.; Ailes, E.C.; Myers, L.M.; Patterson, N.E.; Berkelman, R.L. Seroepidemiologic and occupational risk survey for Coxiella burnetii antibodies among US veterinarians. Clin. Infect. Dis. 2009, 48, 550–557. [Google Scholar] [CrossRef] [PubMed]
- Vest, K.G.; Clark, L.L. Serosurvey and observational study of US Army Veterinary Corps officers for Q fever antibodies from 1989 to 2008. Zoonoses Public Health 2014, 61, 271–282. [Google Scholar] [CrossRef]
- Clark, W.H.; Bogucki, A.S.; Lenette, E.H. Q fever in California. VI. Description of an epidemic occurring at Davis, California, in 1948. Am. J. Hyg. 1951, 54, 15–24. [Google Scholar]
- Oliphant, J.W.; Gordon, D.A.; Meis, A.; Parker, R.R. Q fever in laundry workers, presumably transmitted from contaminated clothing. Am. J. Hyg. 1949, 49, 76–82. [Google Scholar] [CrossRef]
- Shapiro, A.J.; Bosward, K.L.; Heller, J.; Norris, J.M. Seroprevalence of Coxiella burnetii in domesticated and feral cats in eastern Australia. Vet. Microbiol. 2015, 177, 154–161. [Google Scholar] [CrossRef]
- Shapiro, A.J.; Norris, J.M.; Bosward, K.L.; Heller, J. Q fever (Coxiella burnetii) Knowledge and Attitudes of Australian Cat Breeders and Their Husbandry Practices. Zoonoses Public Health 2017, 64, 252–261. [Google Scholar] [CrossRef] [PubMed]
- Alonso, E.; Lopez-Etxaniz, I.; Hurtado, A.; Liendo, P.; Urbaneja, F.; Aspiritxaga, I.; Olaizola, J.I.; Piñero, A.; Arrazola, I.; Barandika, J.F. Q fever Outbreak among Workers at a Waste-Sorting Plant. PLoS ONE 2015, 10, e0138817. [Google Scholar] [CrossRef]
- Bjork, A.; Marsden-Haug, N.; Nett, R.J.; Kersh, G.J.; Nicholson, W.; Gibson, D.; Szymanski, T.; Emery, M.; Kohrs, P.; Woodhall, D. First reported multistate human Q fever outbreak in the United States, 2011. Vector Borne Zoonotic Dis. 2014, 14, 111–117. [Google Scholar] [CrossRef]
- Whelan, J.; Schimmer, B.; de Bruin, A.; van Beest Holle, M.R.; van der Hoek, W.; ter Schegget, R. Visits on ‘lamb-viewing days’ at a sheep farm open to the public was a risk factor for Q fever in 2009. Epidemiol. Infect. 2012, 140, 858–864. [Google Scholar] [CrossRef]
- Valkenburgh, S.M.; de Bruin, A.; Züchner, L. Q-koorts op kinderboerderijen [Q fever on petting zoos]. Tijdschr. Diergeneeskd. 2011, 136, 158–161. [Google Scholar] [PubMed]
- Porten, K.; Rissland, J.; Tigges, A.; Broll, S.; Hopp, W.; Lunemann, M.; van Treeck, U.; Kimmig, P.; Brockmann, S.O.; Wagner-Wiening, C.; et al. A super-spreading ewe infects hundreds with Q fever at a farmers’ market in Germany. BMC Infect. Dis. 2006, 6, 147. [Google Scholar] [CrossRef]
- Tan, T.S.; Hernandez-Jover, M.; Hayes, L.M.; Wiethoelter, A.K.; Firestone, S.M.; Stevenson, M.A.; Heller, J. Identifying scenarios and risk factors for Q fever outbreaks using qualitative analysis of expert opinion. Zoonoses Public Health 2022, 69, 344–358. [Google Scholar] [CrossRef]
- Hurtado, A.; Zendoia, I.I.; Alonso, E.; Beraza, X.; Bidaurrazaga, J.; Ocabo, B.; Arrazola, I.; Cevidanes, A.; Barandika, J.F.; García-Pérez, A.L. A Q fever outbreak among visitors to a natural cave, Bizkaia, Spain, December 2020 to October 2021. Euro Surveill. 2023, 28, 2200824. [Google Scholar] [CrossRef] [PubMed]
- Schets, F.M.; de Heer, L.; de Roda Husman, A.M. Coxiella burnetii in sewage water at sewage water treatment plants in a Q fever epidemic area. Int. J. Hyg. Environ. Health 2013, 216, 98–702. [Google Scholar] [CrossRef]
- Hermans, T.; Jeurissen, L.; Hackert, V.; Hoebe, C. Land-applied goat manure as a source of human Q-fever in the Netherlands, 2006–2010. PLoS ONE 2014, 9, e96607. [Google Scholar] [CrossRef]
- van den Brom, R.; Roest, H.J.; de Bruin, A.; Dercksen, D.; Santman-Berends, I.; van der Hoek, W.; Dinkla, A.; Vellema, J.; Vellema, P. A probably minor role for land-applied goat manure in the transmission of Coxiella burnetii to humans in the 2007–2010 Dutch Q fever outbreak. PLoS ONE 2015, 27, e0121355. [Google Scholar] [CrossRef] [PubMed]
- Price, C.; Smith, S.; Stewart, J.; Palesy, T.; Corbitt, M.; Galappaththy, C.; Hanson, J. Increased recognition of Q fever aortitis as a chronic manifestation of Q fever in tropical North Queensland, Australia. Eur. J. Clin. Microbiol. Infect. Dis. 2023, 42, 1537–1541. [Google Scholar] [CrossRef] [PubMed]
- Salmon, M.M.; Howells, B.; Glencross, E.J.; Evans, A.D.; Palmer, S.R. Q fever in an urban area. Lancet 1982, 1, 1002–1004. [Google Scholar] [CrossRef]
- Dillon, C.F.; Dillon, M.B. Multi-Scale Airborne Infectious Disease Transmission. Appl. Environ. Microbiol. 2021, 87, e02314-20. [Google Scholar] [CrossRef] [PubMed]
- Dillon, M.B.; Dillon, C.F. Regional Relative Risk, a Physics-Based Metric for Characterizing Airborne Infectious Disease Transmission. Appl. Environ. Microbiol. 2021, 87, e0126221. [Google Scholar] [CrossRef]
- Gilsdorf, A.; Kroh, C.; Grimm, S.; Jensen, E.; Wagner-Wiening, C.; Alpers, K. Large Q fever outbreak due to sheep farming near residential areas, Germany, 2005. Epidemiol. Infect. 2008, 136, 1084–1087. [Google Scholar] [CrossRef]
- Hawker, J.I.; Ayres, J.G.; Blair, I.; Evans, M.R.; Smith, D.L.; Smith, E.G.; Burge, P.S.; Carpenter, M.J.; Caul, E.O.; Coupland, B.; et al. A large outbreak of Q fever in the West Midlands: Windborne spread into a metropolitan area? Commun. Dis. Public Health 1988, 1, 180–187. [Google Scholar]
- Tissot-Dupont, H.; Torres, S.; Nezri, M.; Raoult, D. Hyperendemic focus of Q fever related to sheep and wind. Am. J. Epidemiol. 1999, 50, 67–74. [Google Scholar] [CrossRef]
- Hackert, V.H.; van der Hoek, W.; Dukers-Muijrers, N.; de Bruin, A.; Al Dahouk, S.; Neubauer, H.; Bruggeman, C.A.; Hoebe, C.J. Q fever: Single-Point Source Outbreak with High Attack Rates and Massive Numbers of Undetected Infections Across an Entire Region. Clin. Infect. Dis. 2012, 55, 1591–1599. [Google Scholar] [CrossRef]
- Hackert, V.H.; Hoebe, C.J.P.A.; Dukers-Muijrers, N.; Krafftm, T.; Kauhl, B.; Henning, K.; Karges, W.; Sprague, L.; Neubauer, H.; Al Dahouk, S.; et al. Q fever: Evidence of a Massive Yet Undetected Cross-Border Outbreak, with Ongoing Risk of Extra Mortality, in a Dutch-German Border Region. Transbound. Emerg. Dis. 2020, 67, 1660–1670. [Google Scholar] [CrossRef]
- Clark, W.H.; Romer, M.S.; Holmes, M.A.; Welsh, H.H.; Lennette, E.H.; Abinanti, F.R. Q fever in California VIII. An epidemic of Q fever in a small rural community in northern California. Am. J. Hyg. 1951, 54, 25–34. [Google Scholar] [PubMed]
- Archer, B.N.; Hallahan, C.; Stanley, P.; Seward, K.; Lesjak, M.; Hope, K.; Brown, A. Atypical outbreak of Q fever affecting low-risk residents of a remote rural town in New South Wales. Commun. Dis. Intell. Q. Rep. 2017, 41, E125–E133. [Google Scholar] [PubMed]
- van der Hoek, W.; Morroy, G.; Renders, N.H.; Wever, P.C.; Hermans, M.H.; Leenders, A.C.; Schneeberger, P.M. Epidemic Q fever in humans in the Netherlands. Adv. Exp. Med. Biol. 2012, 984, 329–364. [Google Scholar] [CrossRef]
- Dijkstra, F.; van der Hoek, W.; Wijers, N.; Schimmer, B.; Rietveld, A.; Wijkmans, C.J.; Vellema, P.; Schneeberger, P.M. The 2007–2010 Q fever epidemic in the Netherlands: Characteristics of notified acute Q fever patients and the association with dairy goat farming. FEMS Immunol. Med. Microbiol. 2012, 64, 3–12. [Google Scholar] [CrossRef]
- O’Neill, T.J.; Sargeant, J.M.; Poljak, Z. The effectiveness of Coxiella burnetii vaccines in occupationally exposed populations: A systematic review and meta-analysis. Zoonoses Public Health 2014, 61, 81–96. [Google Scholar] [CrossRef]
- Sam, G.; Stenos, J.; Graves, S.R.; Rehm, B.H.A. Q fever immunology: The quest for a safe and effective vaccine. NPJ Vaccines 2023, 8, 133. [Google Scholar] [CrossRef]
- Khademi, P.; Tukmechi, A.; Sgroi, G.; Ownagh, A.; Enferadi, A.; Khalili, M.; Mardani, K. Molecular and genotyping techniques in diagnosis of Coxiella burnetii: An overview. Infect. Genet. Evol. 2024, 123, 105655. [Google Scholar] [CrossRef] [PubMed]
- Zhan, S.; Jin, H.; Ji, H.; Hou, X.; Li, J.; Zhang, Y.; Zheng, J.; Cui, L. Clinical diagnosis of Q fever by targeted next-generation sequencing for identification of Coxiella burnetii. BMC Infect. Dis. 2025, 25, 190. [Google Scholar] [CrossRef]
- US Department of Agriculture Economic Research Service. Farm Labor (See U.S. Employment in Agriculture and Support Industries, 2001–2023). Available online: https://www.ers.usda.gov/topics/farm-economy/farm-labor#size (accessed on 2 February 2025).
- Tapia, T.; Olivares, M.F.; Stenos, J.; Iglesias, R.; Díaz, N.; Vergara, N.; Sotomayor, V.; Gallegos, D.; Soares Magalhães, R.J.; Acevedo, J.; et al. National Seroprevalence of Coxiella burnetii in Chile, 2016–2017. Pathogens 2021, 10, 531. [Google Scholar] [CrossRef]
- Schimmer, B.; Notermans, D.W.; Harms, M.G.; Reimerink, J.H.; Bakker, J.; Schneeberger, P.; Mollema, L.; Teunis, P.; van Pelt, W.; van Duynhoven, Y. Low seroprevalence of Q fever in The Netherlands prior to a series of large outbreaks. Epidemiol. Infect. 2012, 140, 27–35. [Google Scholar] [CrossRef]
- Slot, E.; Hogema, B.H.; Molier, M.; Zaaijer, H.L. Screening of blood donors for chronic Coxiella burnetii infection after large Q fever outbreaks. Transfusion 2014, 54, 2867–2870. [Google Scholar] [CrossRef] [PubMed]
- Gidding, H.F.; Peng, C.Q.; Graves, S.; Massey, P.D.; Nguyen, C.; Stenos, J.; Quinn, H.E.; McIntyre, P.B.; Durrheim, D.N.; Wood, N. Q fever seroprevalence in Australia suggests one in twenty people have been exposed. Epidemiol. Infect. 2020, 148, e18. [Google Scholar] [CrossRef] [PubMed]
- McCaughey, C.; McKenna, J.; McKenna, C.; Coyle, P.V.; O’Neill, H.J.; Wyatt, D.E.; Smyth, B.; Murray, L.J. Human seroprevalence to Coxiella burnetii (Q fever) in Northern Ireland. Zoonoses Public Health 2008, 55, 189–194. [Google Scholar] [CrossRef]
- Johnson, C.L.; Paulose-Ram, R.; Ogden, C.L.; Carroll, M.D.; Kruszon-Moran, D.; Dohrmann, S.M.; Curtin, L.R. National Health and Nutrition Examination Survey: Analytic Guidelines, 1999–2010. Vital Health Stat 2 2013, 161, 1–24. [Google Scholar]
- US National Health and Nutrition Examination Survey. NHANES Biospecimen Program. Available online: https://www.cdc.gov/nchs/nhanes/biospecimen/index.html (accessed on 20 April 2025).

| N | n | Overall US CB Seropositives % (95% CI) | CB Seropositives with No Agricultural Work % (95% CI) | Total Percent with No Agricultural Work % (95% CI) | |
|---|---|---|---|---|---|
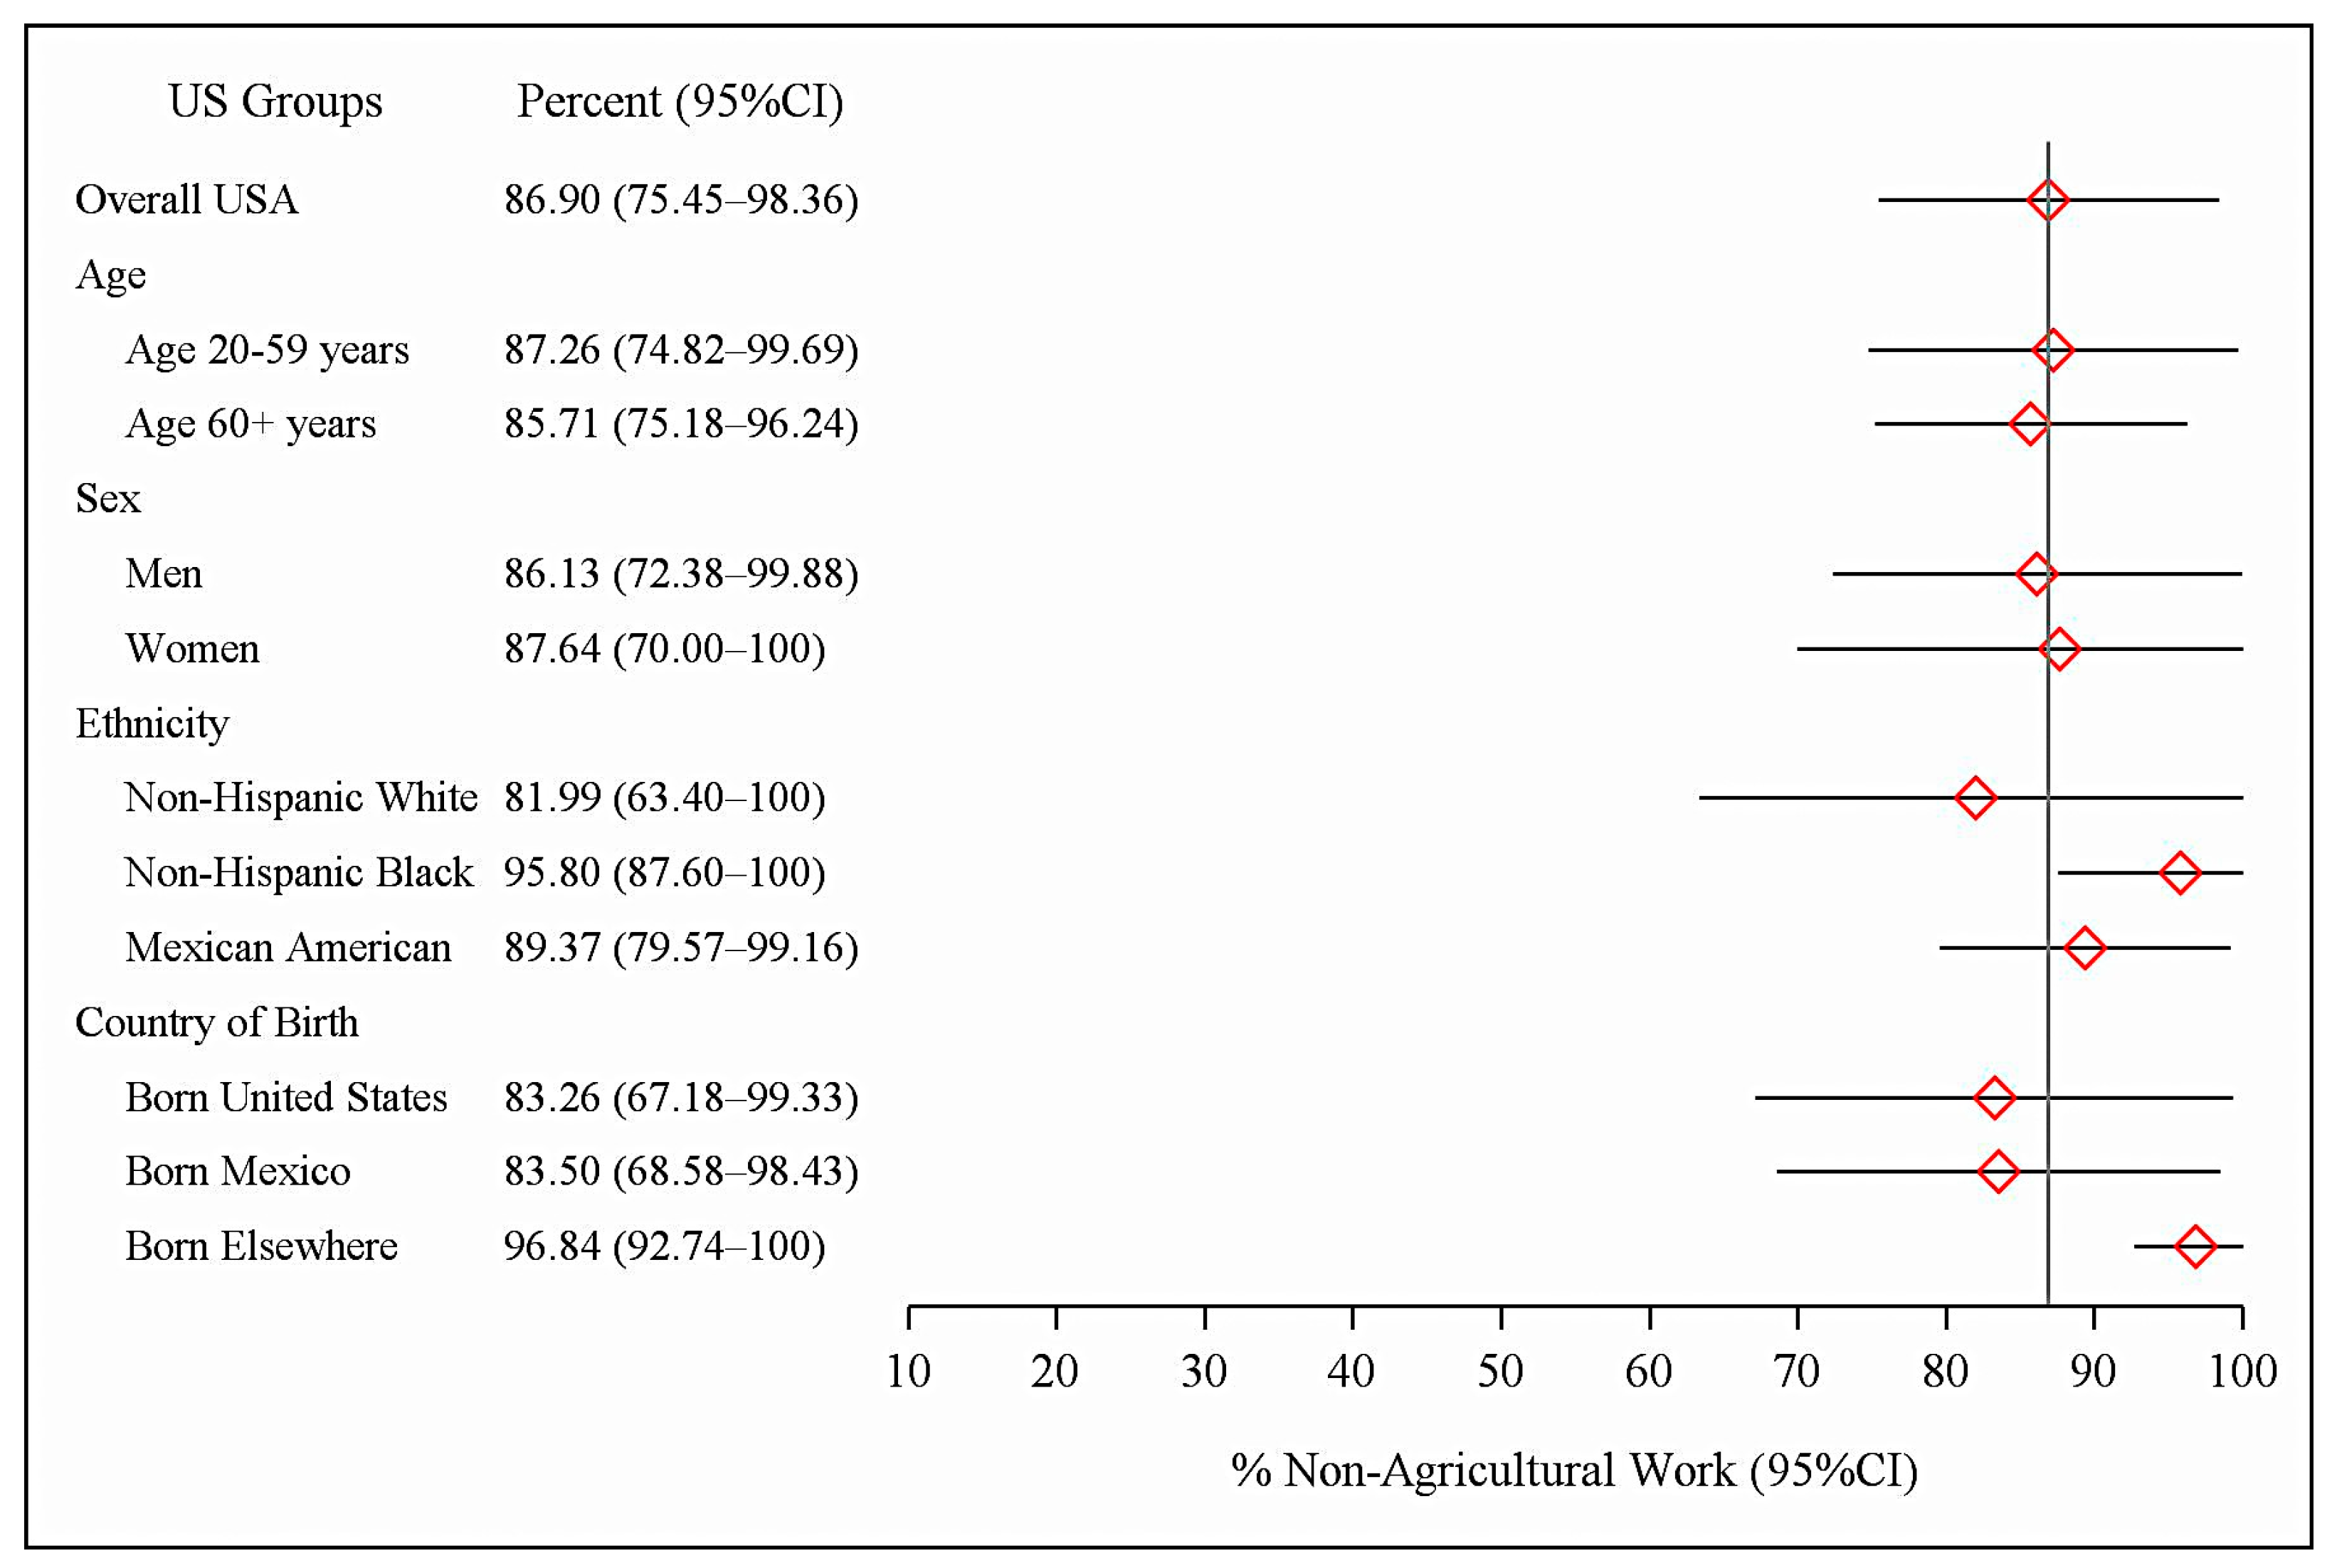
| Total Sample | 4236 | 175 | 3.03 (2.00–4.38) | 2.67 (1.79–3.81) | 86.90 (75.45–98.36) |
| Age 20–59 years | 2661 | 77 | 2.67 (1.65–4.07) | 2.39 (1.48–3.62) | 87.26 (74.82–99.69) |
| Age ≥ 60 years | 1575 | 98 | 4.24 (2.78–6.15) | 3.63 (2.35–5.33) | 85.71 (75.18–96.24) |
| Men | 2056 | 108 | 3.81 (2.49–5.57) | 3.33 (2.17–4.86) | 86.13 (72.38–99.88) |
| Women | 2180 | 67 | 2.33 (1.28–3.87) | 2.09 (1.13–3.53) | 87.64 (70.00–100) |
| Non-Hispanic White | 2298 | 75 | 2.79 (1.61–4.47) | 2.40 (1.43–3.77) | 81.99 (63.40–100) |
| Non-Hispanic Black | 811 | 12 | 1.38 (0.58–2.75) | 1.30 (0.53–2.64) | 95.80 (87.60–100) |
| Mexican American | 854 | 77 | 7.51 (5.83–9.48) | 6.61 (5.04–8.49) | 89.37 (79.57–99.16) |
| Country of Birth | |||||
| United States | 3364 | 109 | 2.35 (1.44–3.61) | 2.01 (1.32–2.91) | 83.26 (67.18–99.33) |
| Mexico | 473 | 41 | 8.57 (6.21–11.47) | 6.90 (4.21–10.57) | 83.50 (68.58–98.43) |
| All Other Countries | 398 | 25 | 6.88 (3.63–11.65) | 6.65 (3.47–11.36) | 96.84 (92.74–100) |
| Total PYR | Currently Employed | Unemployed | Not Working | |
|---|---|---|---|---|
| Total All Ages: | 59,214 | 25,410 | 732 | 33,072 |
| 20–24 years | 966 | 717 | 41 | 208 |
| 25–34 years | 3750 | 2930 | 156 | 664 |
| 35–44 years | 6372 | 5043 | 157 | 1172 |
| 45–54 years | 9092 | 6924 | 152 | 2016 |
| 55–64 years | 10,601 | 5304 | 71 | 5226 |
| 65+ years | 28,433 | 4492 | 155 | 23,786 |
| Age-Specific Rates | BLS 2003 Estimates % | BLS 2004 Estimates % | 2003–2004 Sample N | NHANES 2003–2004 Estimates % (95% CI) |
|---|---|---|---|---|
| Overall 16+ years | 66.2 | 66.0 | 5661 | 66.5 (64.3–68.7) |
| 16–19 years | 44.5 | 43.9 | 919 | 53.8 (45.3–62.0) |
| 20–24 years | 75.4 | 75.0 | 458 | 72.4 (64.7–78.9) |
| 25–34 years | 82.9 | 82.7 | 845 | 78.3 (76.1–80.3) |
| 35–44 years | 83.9 | 83.6 | 756 | 80.6 (77.1–83.7) |
| 45–54 years | 82.1 | 81.8 | 702 | 75.9 (71.2–80.2) |
| 55–64 years | 62.4 | 62.3 | 609 | 56.4 (50.9–61.9) |
| 65+ years | 14.0 | 14.4 | 1372 | 16.6 (13.9–19.8) |
| N | n | Seroprevalence % (95% CI) | |
|---|---|---|---|
| Total Sample | 4236 | 175 | 3.03 (2.00–4.38) |
| Professional, Technical, Office Work | 1561 | 43 | 2.01 (1.11–3.34) |
| Service Work | 647 | 25 | 3.49 (1.88–5.87) |
| Agriculture and Related Occupations | 136 | 21 | 10.98 * |
| Factory, Repair, Construction, Transport, Freight/Materials | 1100 | 59 | 3.87 (2.43–5.81) |
| Worked in Multiple Occupational Groups | 614 | 20 | 3.36 * |
| Never Worked | 178 | 7 | 2.04 * |
| Reservoirs | Examples | References |
|---|---|---|
| Commercial Livestock | Cattle, sheep, goats | [8,9] |
| Domestic and Wild Animals | Cats, dogs, wildlife animals | [1,8,36,37,38,39,40,41,42,43] |
| Environmental Reservoir | C. burnetii contaminated soils | [7,44,45,46] |
| Woodland Ticks | Dermacentor andersoni, Amblyomma triguttatum | [28,47,48,49,50,51] |
| Transmission Pathways | ||
| Oral | Unpasteurized dairy products | [52,53,54,55] |
| Person to Person: | ||
| Hospital (Nosocomial) | To staff, in maternity wards, at deliveries, autopsies | [1,56,57,58,59,60] |
| Sexual | Sexual intercourse | [61,62,63] |
| Vertical | Mother to fetus: prematurity, fetal loss, birth defects | [1,58,64,65,66] |
| Percutaneous and Intradermal | Laboratory sample needlestick injuries, tick bites | [51,67,68,69,70] |
| Blood-Borne | Blood transfusion, bone marrow transplant | [71,72,73,74,75,76,77] |
| Near and Mid-Range (<1 km) | Contaminated body fluids, dust and soil aerosols | |
| Airborne/Fomite Transmission | ||
| Livestock Production | Livestock farming and support services | [9] |
| Animal Food Processing | Slaughterhouses, packing and pet food plants, dairies | [78,79,80,81] |
| Animal Body Processing | Animal rendering and body part plants, cosmetics | [82,83] |
| Animal Skin and Hair | Animal hide and wool processing, sheep shearing | [84,85] |
| Animal Transport | Livestock and pet animal transport, stockyards | [80,86,87] |
| Laboratories | Hospital, medical, and animal research laboratories | [88,89,90,91,92,93,94] |
| Community Transmission | ||
| To Farm Households | Contaminated farm, stable dust to clothing, shoes | [95,96] |
| To Community Households | Contaminated dust to clothing, shoes; animal births | [36,37,38,97] |
| High-Risk Occupations | Veterinary, laundry workers, pet breeders, waste sorters | [98,99,100,101,102,103,104] |
| Recreational | Farm visits, petting zoos, farmer’s markets, hobby farms | [105,106,107,108,109,110] |
| Sewage and Manure | Sewage plants, land manure application | [111,112] |
| Contaminated dust and soils | Excavation work; farm dust; hay and manure aerosols | [3,113,114,115] |
| Long-Range Airborne (≥1 km) | Airborne community and regional exposure, disease | [116,117,118,119,120,121,122] |
| Unknown Transmission | Unexplained community outbreaks | [123,124] |
Disclaimer/Publisher’s Note: The statements, opinions and data contained in all publications are solely those of the individual author(s) and contributor(s) and not of MDPI and/or the editor(s). MDPI and/or the editor(s) disclaim responsibility for any injury to people or property resulting from any ideas, methods, instructions or products referred to in the content. |
© 2025 by the authors. Licensee MDPI, Basel, Switzerland. This article is an open access article distributed under the terms and conditions of the Creative Commons Attribution (CC BY) license (https://creativecommons.org/licenses/by/4.0/).
Share and Cite
Dillon, C.F.; Dillon, G.R. Q Fever-Related Community Infections: United States Exposure to Coxiella burnetii. Pathogens 2025, 14, 460. https://doi.org/10.3390/pathogens14050460
Dillon CF, Dillon GR. Q Fever-Related Community Infections: United States Exposure to Coxiella burnetii. Pathogens. 2025; 14(5):460. https://doi.org/10.3390/pathogens14050460
Chicago/Turabian StyleDillon, Charles F., and Gwendolyn R. Dillon. 2025. "Q Fever-Related Community Infections: United States Exposure to Coxiella burnetii" Pathogens 14, no. 5: 460. https://doi.org/10.3390/pathogens14050460
APA StyleDillon, C. F., & Dillon, G. R. (2025). Q Fever-Related Community Infections: United States Exposure to Coxiella burnetii. Pathogens, 14(5), 460. https://doi.org/10.3390/pathogens14050460