Brief Report

Nutritional Stress Leads to Persistence and Persister-like Growth in Staphylococcus aureus

100K Pathogen Genome Project, Department of Population Health and Reproduction, School of Veterinary Medicine, University of California, Davis, CA 95616, USA
*
Author to whom correspondence should be addressed.
Pathogens 2025, 14(3), 251; https://doi.org/10.3390/pathogens14030251
Submission received: 6 January 2025 / Revised: 25 February 2025 / Accepted: 27 February 2025 / Published: 4 March 2025

Abstract

:
Staphylococcus aureus is a versatile zoonotic pathogen capable of causing a wide range of infections. Due to the organism’s ability to persist, recalcitrant and recurring infections are a major concern for public and animal health. This study investigated the establishment of persistence using two S. aureus strains—ATCC 29740, a bovine mastitis isolate, and USA300, a human clinical isolate—under substrate depletion. This nutritional stress established a persistence phenotype where the strains remained persistent for >120 days at notable concentrations [>2 log10 CFU/mL] and developed persister-like growth, including small colony variant formations. With RT-qPCR, we found the cell density was higher than represented by the plate count while the intracellular ATP remained constant during the persistence phase. These findings indicate that S. aureus has complex survival strategies to support its persistent state, providing a host-specific perspective when addressing recurrent infections in human and animal infectious diseases.

1. Introduction

Staphylococcus aureus, a ubiquitous gram-positive bacterium, is a highly adaptable, versatile pathogen [1]. While S. aureus is a common commensal of the human and animal microbiome, it can cause a wide spectrum of infections in a diverse range of hosts, including livestock, wildlife, and humans [2,3]. In humans, S. aureus can range from mild skin and soft tissue infections to severe, life-threatening diseases such as pneumonia, endocarditis, sepsis, and toxic shock [4]. It is one of the leading causes of nosocomial infections and a major contributor to mortality in hospitals [4], fueled by the rise of methicillin-resistant S. aureus (MRSA) [5,6] and its capacity to form biofilms [7]. In veterinary medicine, S. aureus causes great economic losses in livestock production, most prominently in dairy production, being the leading cause of bovine mastitis worldwide [2,8]. Infections are also widespread in other animals, including swine, poultry, equine, small ruminants, and companion animals [2,9]. Due to the plethora of animal hosts this zoonotic pathogen infects, host-switching events are a common and significant issue at the human/animal interface [9]. For example, more recent zoonotic concerns are being raised as cases of MRSA strains, such as the MRSA ST398 type, which can be transmitted between humans and animals [2,10,11,12]. This opportunistic pathogen is difficult to prevent and treat due to its arsenal of virulence factors that may allow it to survive for prolonged periods in stressful conditions, such as nutritional stress. Staphylococcus commonly experiences nutrient-deficient conditions in terrestrial, clinical, and host environments [13]. In addition to the immune system and other harsh host environments, infecting and persisting in a host specifically requires overcoming challenges like nutritional deprivation, such as nutritional immunity and microbial competition [14,15]. Frequent exposure to stresses like this can motivate the development of persistence factors that address nutrient availability or the lack thereof. These traits highlight the ability of S. aureus to be a highly adaptive pathogen that quickly acquires antibiotic resistance mechanisms through mobile genetic elements or chromosomal mutations. Such developments were witnessed with the spread of MRSA strains into communities worldwide and now leading to the serious threat of vancomycin-resistant S. aureus (VRSA) [16,17,18]. Even if treatment is successful against this adaptive pathogen, S. aureus produces heat- and proteolytic-resistant exotoxins that enable further disease to spread after cell death; a noteworthy example is the pyrogenic toxin superantigens that cause toxic shock syndrome and Staphylococcus-associated food-borne illness [19].
While virulence factors like the ones detailed above are familiar in the field, recently recognized and understudied persistence mechanisms are found in S. aureus, including the phenotypic subpopulations of persisters and small colony variants (SCVs). The persister phenotype is comprised of cellular subpopulations that reduce growth and exhibit antibiotic tolerance. Most antibiotics target active growth mechanisms of microbes, so the inhibition of growth in persisters bypasses the functional mechanisms of the antibiotic. Growth resumes once this stress is removed, suggesting that alternative approaches are needed to understand antimicrobial resistance in concert with persistence. While it is understood that persisters have an altered metabolism and altered ATP production, the mechanisms to enter this antibiotic-tolerant persister state are not well understood [20,21,22]. Within the broad umbrella of persistence are SCVs, being a specific type of persister with an altered colony morphology. SCV colonies appear 1/10 the size of the parent colony with a rougher texture, where development is associated with an intracellular persistence strategy to reduce the expression of virulence factors and invade host cells. This enables protection from antibiotic therapy and cover from the host’s innate defense system [23]. SCVs of S. aureus, considered part of the normal bacterial life cycle, can persist within host cells for years and act as reservoirs for chronic infections [23,24,25,26,27]. Mounting clinical evidence is increasingly correlating chronic infections to persisters and SCVs subpopulations, which has led to a surge of research focused on understanding the underlying mechanisms behind their induction and survival strategies and kickstarting the development of anti-persister drugs [20,21,24,28]. For example, SCVs and persisters have been associated with chronic bovine mastitis [29,30], providing an explanation for symptoms such as biofilm development and antibiotic tolerance [8], directing avenues for future medical perspectives and research.
As S. aureus continues to be a significant concern to public and animal health, understanding the growth patterns and persistence of S. aureus strains from different hosts under stress conditions is important for the development of targeted strategies to prevent, manage, and treat infections in a zoonotic pathogen. The aim of this work was to examine the growth patterns and persistence of two strains under nutritional duress, one isolated from bovine mastitis and another from a human clinical infection. We hypothesized that the two isolates would have different characteristics leading to and during persistence.

2. Materials and Methods

2.1. Strains and Culture Conditions

Staphylococcus aureus ATCC 29740 and USA300 are a bovine mastitis and human clinical isolate, respectively. Both strains were cultured from stock onto Brain Heart Infusion (BHI) plates and incubated at 37 °C for 24 h. One colony of the overnight plate was inoculated into 10 mL of BHI broth (BD Difco, Franklin Lakes, NJ, USA) and incubated overnight at 37 °C, after which the overnight BHI cultures in the exponential phase were all normalized to OD595 = 0.1–0.3 using sterile phosphate buffered saline (PBS) to resuspend before inoculation.

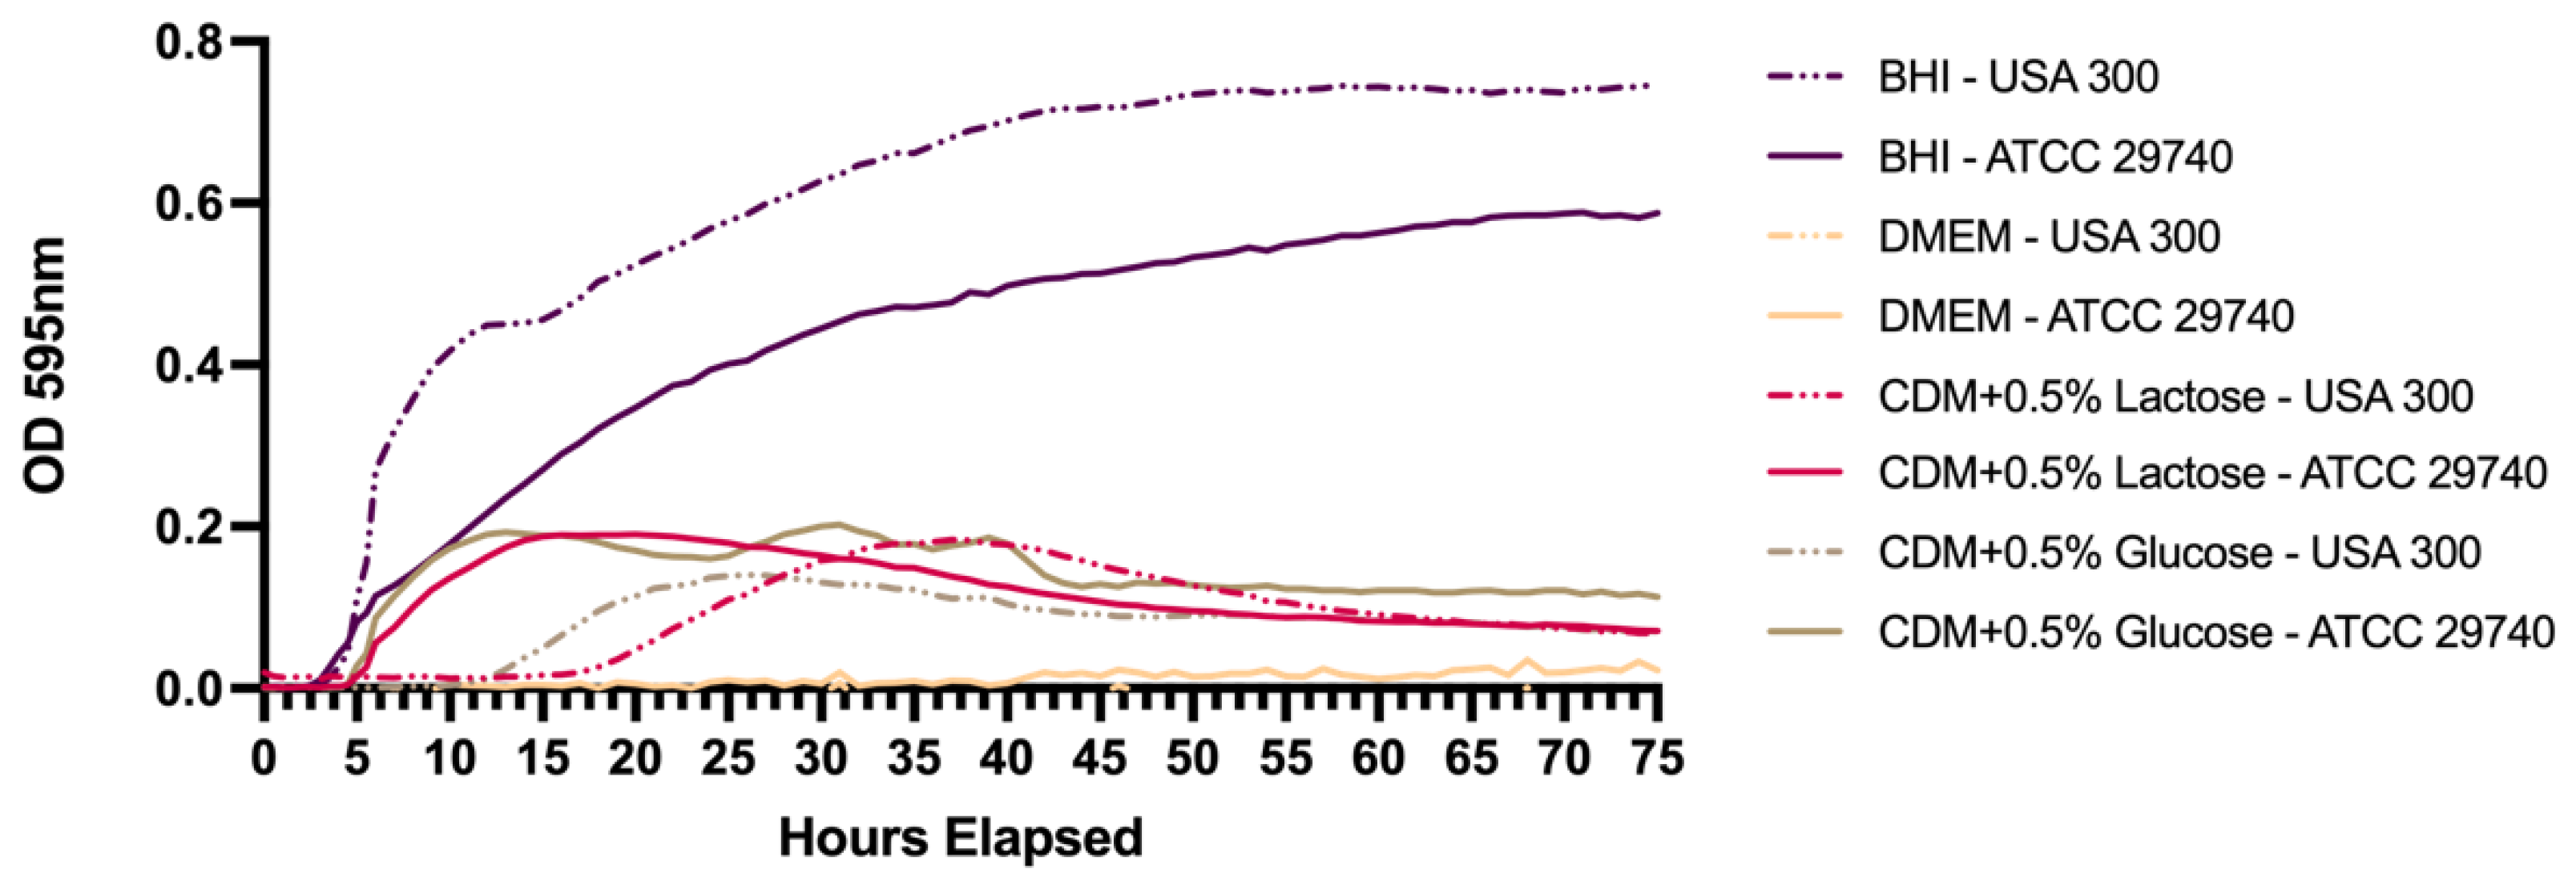
2.2. Growth Curves in Different Media

Overnight cultures were inoculated at 1% v/v into BHI broth, Chemically Defined Media (CDM) [31] with 0.5% lactose (Fisher Scientific, Waltham, MA, USA), CDM with 0.5% glucose (Fisher Scientific, Waltham, MA, USA), or Dulbecco’s Modified Eagle Medium (DMEM) (Cytiva, Logan, UT, USA). BHI was used as it is a standard media for culturing S. aureus. CDM was selected due to its well-defined composition and ability to control carbohydrate sources, such as glucose and lactose. Glucose is a simple sugar and primary energy source, while lactose is a prominent milk-related sugar relevant to the mastitis isolate.
To generate a growth curve, a 200 µL sample of each inoculated media (BHI, CDM with 0.5% glucose, CDM with 0.5% lactose, and DMEM) was added to a 96-well plate in three technical replicates. The 96-well plate with the inoculated media and corresponding blanks was placed in a Molecular Devices DTX 880 Multimode Detector (Beckman Coulter, Brea, CA, USA) at 37 °C with readings taken every 30 min for 75 h. The plate was grown statically except for 10 s of lateral shaking immediately before each reading.

2.3. Nutritional Deprivation and Cell Enumeration

Overnight inoculums of S. aureus (10 mL) were incubated for 14 h in BHI and then centrifuged (5000× g 5 min). The supernatant was discarded and replaced with an equal volume of PBS to remove BHI nutrients from the initial inoculum. Then, 2 mL of the PBS-resuspended culture was added into three separate bottles of 200 mL CDM, each with 0.5% lactose, and then incubated at 37 °C without shaking. At each time point, for sample collection, 100 μL was taken from each of the three bottles for analysis. Collections occurred at the same time each day (on a 24 h cycle), and serial dilutions for plate counting were done in sterile PBS. BHI plates were divided in half, plating 10 μL of a diluted sample per side of the plate. Growth plating assays were incubated at 37 °C, and colonies were counted at 24 and 48 h of incubation on the plate. This procedure was done at (T) 0, 0.5 (12 h), 1, 2, 3, 4, 5, 6, 7, 8, 9, 10, 14, 16, 21, 23, 50, 70, 87, and 120 days.

2.4. Quantitative PCR and ATP Assays

Cell pellets at T87 and T120 were collected (1 mL) and centrifuged (5000× g 5 min) for RT-qPCR and ATP assays. The cell pellet was resuspended in an equal volume of PBS for ATP measurement or 750 μL of TRIzol LS (Invitrogen, Carlsbad, CA, USA) for RT-qPCR analysis. ATP was measured using a BacTiter-Glo Microbial Cell Viability Assay kit (Promega, Madison, WI, USA) according to manufacturer’s instructions, using a DTX 880 Multimode Detector (Beckman Coulter, Brea, CA, USA).
RNA was extracted as described previously using TRIzol LS [32] and checked for quality and concentration using a NanoDrop (Thermo Scientific, Waltham, MA, USA). From the RNA sample, cDNA was produced using the First Strand cDNA Synthesis (Quick Protocol) (New England Biolabs, Ipswich, MA, USA).
The cDNA was used for RT-qPCR quantification of viable cells using a CFX 96 Real Time System (BioRad, Hercules, CA, USA), according to previously established methods [33]. Briefly, 2x iQ Sybr Green Mastermix (Biorad, Hercules, CA, USA) was used along with 100 nM of forward (F) and reverse (R) PCR primers for the EF-TU gene (F: 5′-ACG CGG 313 TAT CAT CAA AGT GG-3′; R: 5′-ATC GGG TGG ATC AGG GTA AC-3′) to quantify the CFU/mL of cells at T87 and T120. The parameters for both primers was done using a denaturation step at 95 °C for 5 min, followed by 40 cycles of denaturation, annealing, and extension at 95 °C for 15 s, 56 °C for 30 s, 72 °C for 30 s, respectively, and a final extension at 72 °C for 1 min. The amplified product was verified using melt curve analysis from 50˚C to 95 °C with a transition rate of 0.2 °C/s. To convert cycle threshold (ct) values to CFU/mL, a standard curve was generated from both S. aureus USA 300 and S. aureus ATCC 29740 using 10-fold dilutions of cDNA, starting with associated plate counts from the extraction material. The standard curves and associated equations of each isolate were then generated using the built-in capabilities of the BioRad CFX Manager qPCR software (version 3.1, BioRad, Hercules, CA, USA). The ct values for technical replicates were then averaged and plugged into the standard curve of the matching isolate to generate an estimated CFU/mL for each biological replicate.

2.5. Statistical Analysis

Plate count data are represented as the mean ± SEM of three biological replicates. A Mann–Whitney U Test was used to identify statistically significant differences in plate counts between strains at each time point using R (version 4.0.5). Two-tailed t-tests with unequal variances were done using GraphPad Prism 10 (Graphpad, Menlo Park, CA, USA). Growth rate determination in the exponential phase was calculated by finding the best fit third-order polynomial in GraphPad Prism 10. The second-order derivative of each best-fit equation was then used to find the inflection point, with four points around the inflection used to calculate slope and, thus, growth rate. Lag phase calculations were made with the Microbial Lag Phase Duration Calculator with default settings [34]. All figures were visualized with the programs GraphPad Prism 10 and bioRender (bioRender, Toronto, ON, Canada).

3. Results

3.1. Persistence Establishes Within 72 h in Nutrient Deficient Conditions

To determine the growth patterns, including the length of lag phase and time to stationary phase in different media, ATCC 29740 and USA300 initial growth curves were generated for different media with varying nutrient availability (Figure 1). BHI was used as the positive control for growth analysis, noting that each strain had significantly different growth characteristics that were used to determine individual growth differences within each strain. Within CDM, the maximum density was similar across strain and sugar addition. Furthermore, the rapid decline in optical density reflects the death of susceptible cells and the following selection for persistent subpopulations. Grouping differences were seen between strains rather than between sugar composition. Staphylococcus aureus ATCC 29740 had shorter lag phases compared to S. aureus USA300, initiating exponential growth a few hours before USA300. While growth rates were similar (Table A1 and Table A2) across strains and media, the lag phase was significant between strains in the same media with lactose sugar (p = 0.0033), while glucose sugar was bordering significance (p = 0.0871). Insignificant growth was seen when cultured in DMEM.

3.2. Persistence Continues for over 120 Days When Challenged with Nutritional Stress and Induces Persister-like Growth Patterns

Active replication was determined using plate counts on BHI agar, where persistence was observed over a 120-day incubation (Figure 2). The growth rate of the two strains was not significantly different (p > 0.05) within the initial 5 h. Both strains maintained a similar population by CFU/mL plate counts to ~T7. Within each strain, the CFU/mL counts remained relatively steady; however, a significant difference (p < 0.05) in population between strains was observed during T7 to T10. With continued incubation, a differential decline in the replicating population was observed.
The replicating population continued to differentiate after T15, which included the initiation of three growth characteristics and multiple colony types. The first and most common colony type was ‘wild-type’ growth, with colonies appearing within 24 h with the wild-type colony morphology of S. aureus. The second colony type had a smaller colony morphology and appeared within 24 h, exhibiting SCV characteristics. The third observed growth variation was marked by delayed visibility, requiring 48 h of incubation to produce visible colonies. These slow-growing colonies would appear dispersed among wild-type colonies with continued incubation on the plates. Despite the initial delay in appearance on the plates, these colonies would continue growing and become indistinguishable from the wild-type morphology after 48 h (Figure 3). Although there were multiple biological replicates per strain, there were divergences within replicates regarding the occurrence of these three growth patterns, indicating changing subpopulations within each bottle. The appearance of all colony types after long-term incubation in each bottle suggests that each morphology is a persister irrespective of appearance on plates, and perhaps further suggesting different adaptations to the nutritional stress per cell.

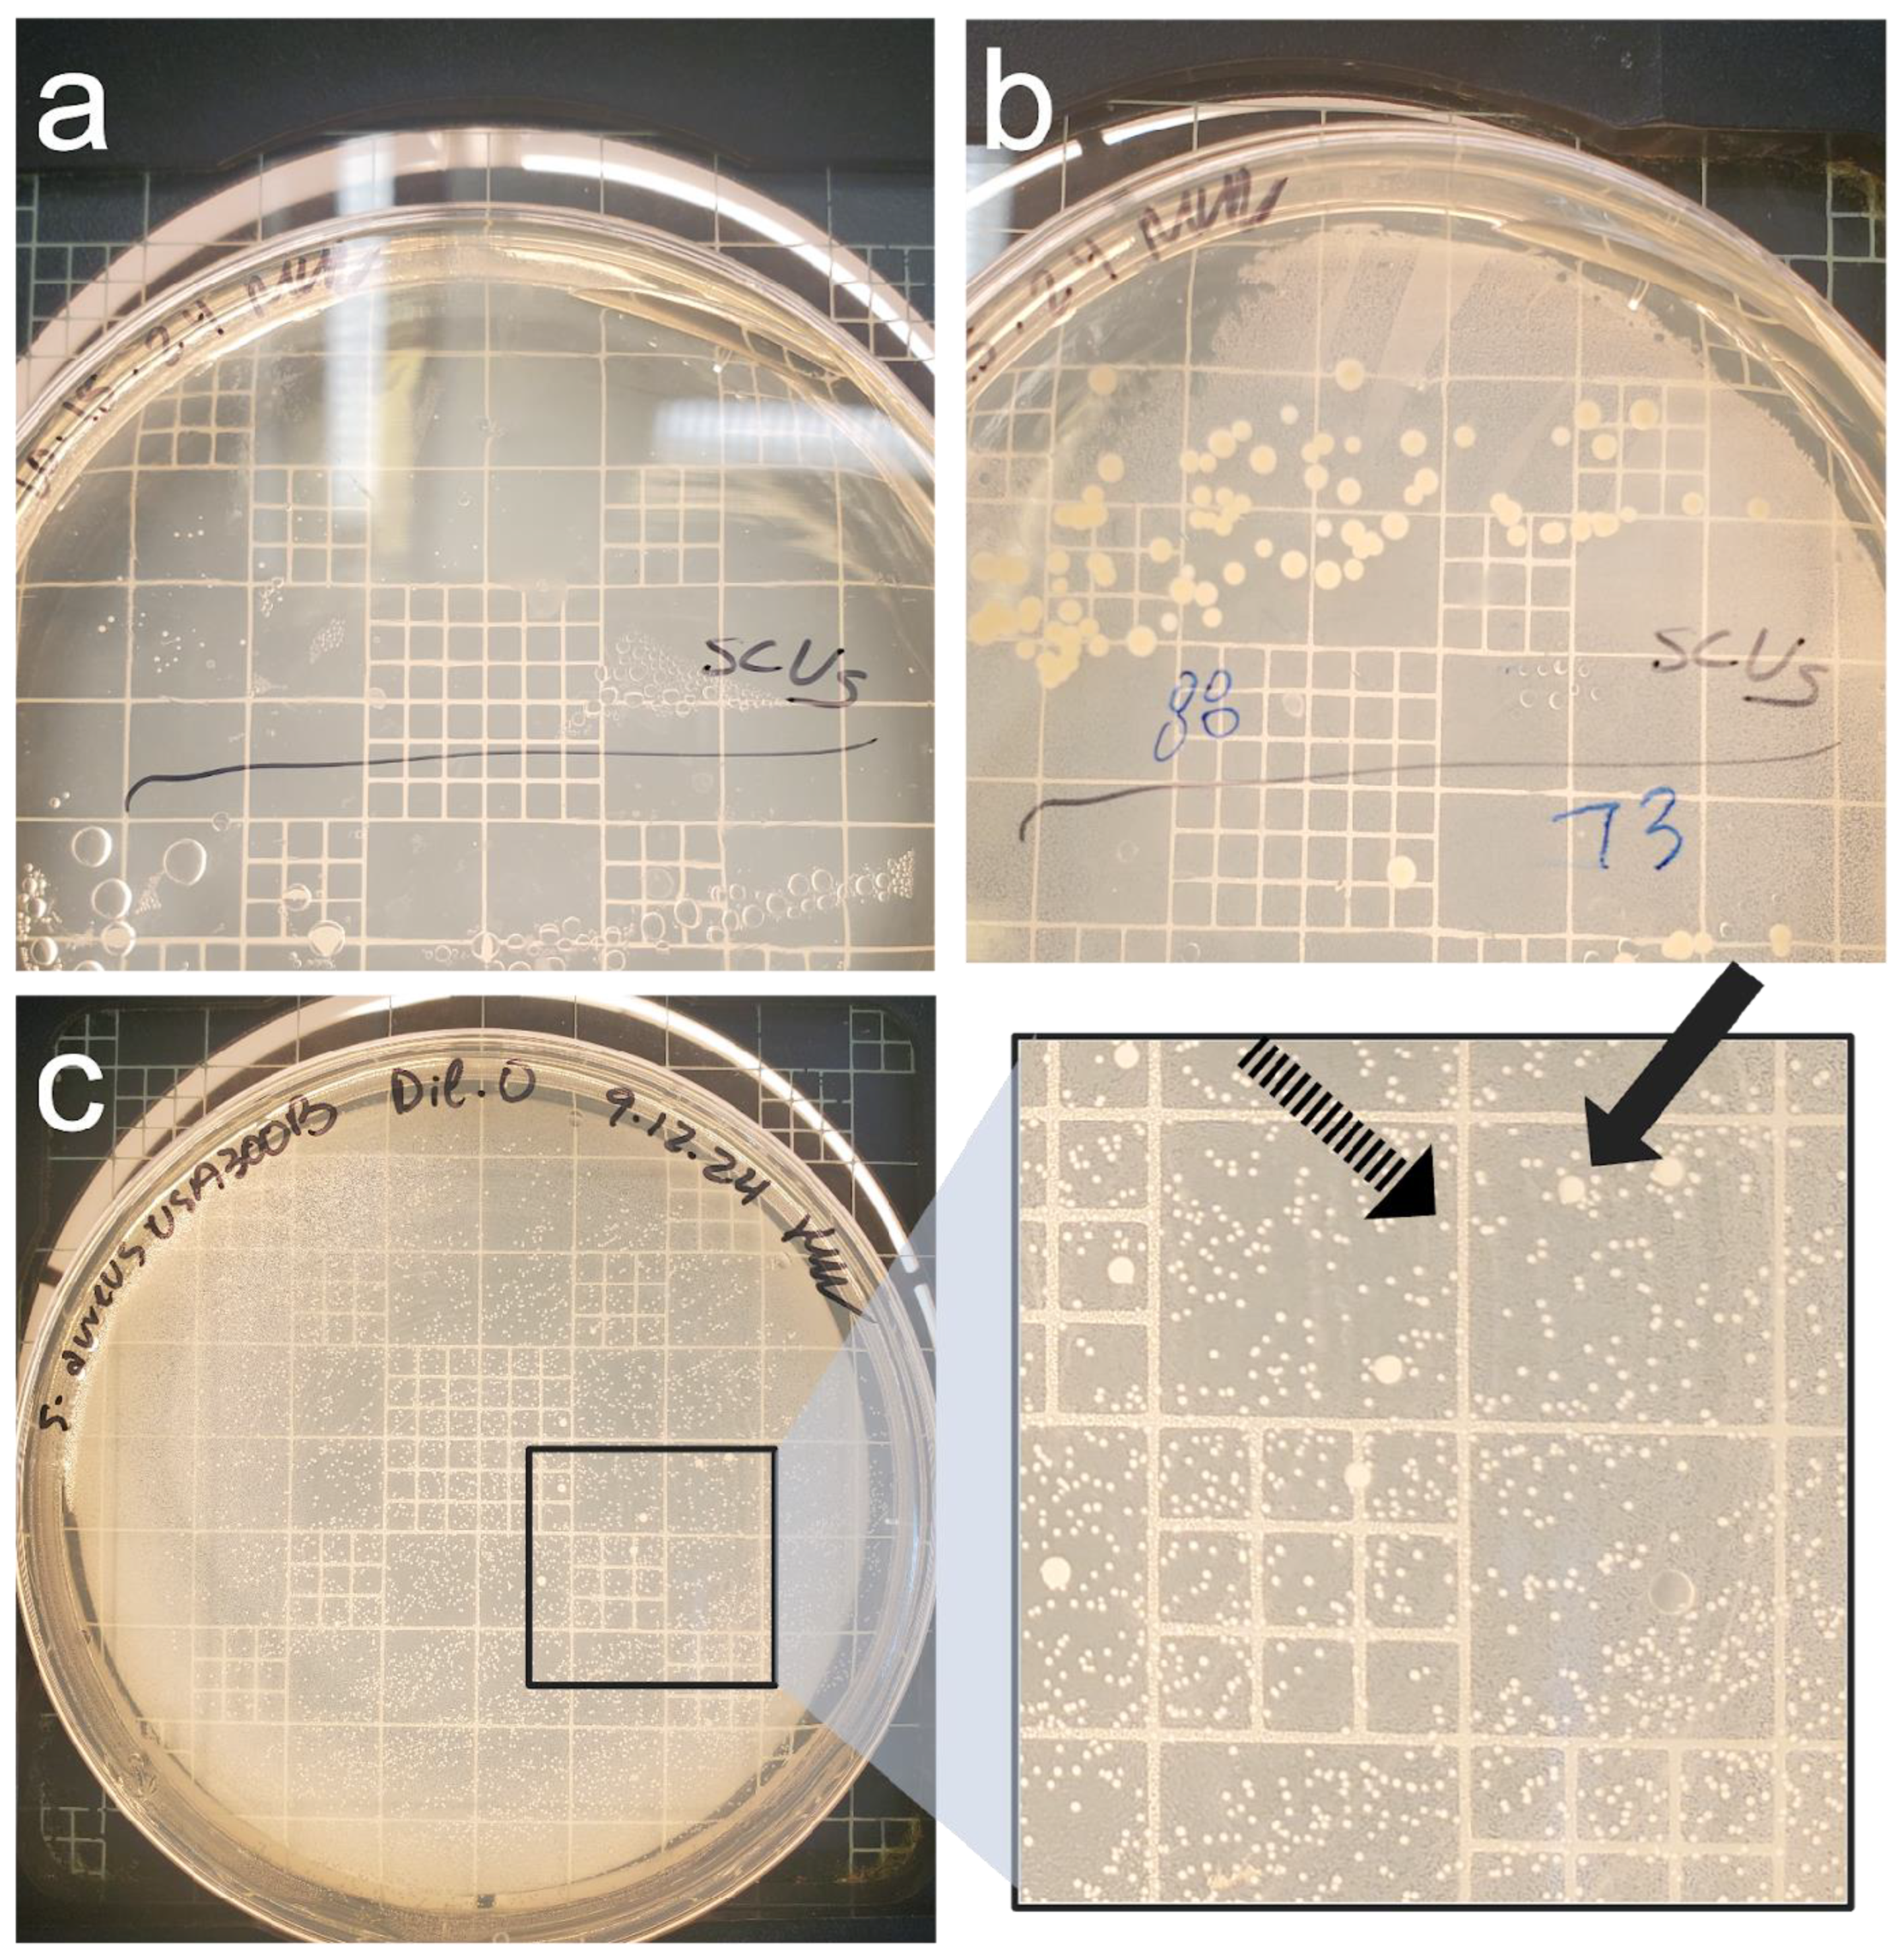
3.3. Culture-Based Methods of Detection Do Not Accurately Reflect Viability

To verify the cell viability of the population, RT-qPCR and ATP assays were done at various incubation times during persistence (Figure 4). Results from the qPCR revealed an increase in cell density (Log10 CFU/mL) between the two time points with both strains. This result is divergent from the estimate determined using plate counts, suggesting there are two populations in the broth, (1) one that is persistent and (2) one that is non-culturable on plates but intact and metabolically active. Previous work on S. aureus and other pathogens supports the existence of mixed populations within persister-inducing conditions, with one subset of cells maintaining the hallmarks of active replication and another existing as non-replicating by viable cells [35,36]. The non-replicating cells, termed viable but non-culturable (VBNC), do not appear on plate counts but continue producing enough ATP for active transport and maintaining intact membranes and metabolic activity [35]. There was a statistical difference seen within USA300 between days T87 and T120, but no difference was seen within ATCC 29740 or between strains. To determine if the amount of energy is different between the populations, we used intracellular ATP assays, which remained consistent for both time points, with an average of 0.94 (±0.004) pM ATP or 0.001 (±3.91) pM ATP/CFU. For reference, S. aureus grown in nutrient-rich conditions has approximately 0.04 pM ATP/CFU [37]. There were no statistical differences between strains or days.

4. Discussion

In this study, we aimed to characterize the persistence and adaptability of Staphylococcus aureus strains under conditions of nutritional stress, with significant implications for understanding the mechanisms behind chronic and recalcitrant infections. Furthermore, adopting a multi-host perspective captures the diversity of a pathogen that displays host specificity and specialization, an important factor when developing targeted strategies to prevent and manage persistent infections in both human and veterinary contexts.
When first determining initial growth patterns and the divergence toward persistence, persistence induction remained universal in both strains, becoming steady in the stationary phase within 72 h. This highlights the swift response and adaption to environmental stresses this pathogen is capable of. Considering the short period between inoculation and the induction of persistence, persistence is not an acquired genetic resistance but an innate phenotypic change conserved across S. aureus strains in response to stressors. Additionally, persistence within 72 h implies a limited window for effective antimicrobial intervention. Treatments may need to be aggressive and rapid to prevent the formation of persistence phenotypes; however, further studies involving host models will be necessary to see if such rapid treatment would prevent chronic infection altogether.
The difference in the lag phase between the strains could allude to accustomed metabolism plasticity and switching based on the host environment. S. aureus derived from bovine mastitis has undergone gene acquisition, loss, and diversification in order to distinctively thrive in the mammary gland [8], expanding its nutrient utilization to incorporate lactose uptake, a common sugar found in dairy milk [38]. The human host environment may encourage catabolite repression, where resource optimization would prioritize glucose over lactose [39], accounting for slight differences of growth between the sugars in S. aureus USA300. Lack of growth in DMEM implies that this media lacks key nutrients required for both S. aureus growth and persistence, highlighting the auxotrophic nature of the bacteria and its need for specific amino acids, vitamins, and other nutrients found abundantly when housed in its host. Overall, despite known host-switching and host specializations, persistence is a maintained virulence factor, indicating its necessity for infection. Based on this information, we decided to use lactose as our sugar for our extended persistence experiment due to it being the largest difference in persistence induction between the two strains.
When investigating the persistence of this pathogen beyond 72 h, S. aureus remained actively replicating for over 120 days. While differences were noticed in initial growth patterns, both human clinical and bovine mastitis S. aureus isolates shared similar persistence activities when assessed days and weeks after the initial inoculation. Interestingly, on day 87 of incubation, the evaluation of cell density and metabolic potential by qPCR and ATP concentration suggests that the plate counts accurately captured the population density at that time, while the observations on day 120 suggest a divergence. The lack of congruence between the plate counts, qPCR, and ATP measurements at day 120 in both isolates suggests that subpopulations of differing physiological states contribute to the community counts in non-congruent ways. While active and replicating cells, even with markedly slow replication, appear on the plate, non-active but viable cells can contribute to the ATP and qPCR results without adding to the plate count [36,40]. This discrepancy across different methods of measurements suggests that the emergence of subpopulations within one culture bottle, and potentially within a host or environmental reservoir, may lead to inaccurate assessments of S. aureus populations when only one screening method is applied. Such findings should be considered when assessing active or recovered infections in multiple host types.
These findings align with previous studies describing the starvation response of S. aureus. Other work similarly found persistent bacteria lasting for months and the development of SCVs when grown in glucose- and multi-nutrient-limited media [13,41]. The fluctuating plate counts and variance in colony morphology between biological replicates over time suggest that persistence is influenced by microenvironmental factors, causing stochastic fluctuations in population. These variations may additionally be heightened by the small sample size, and thus, a larger study will be necessary to tease apart molecular mechanisms behind these differences and to apply clinical relevance to them.
One such concern of clinical relevance in S. aureus is the ability of persistent populations to withstand antibiotic treatment and then regrow after the antibiotic stress is removed, ultimately leading to relapsing infections [20]. Persister resuscitation is an underdeveloped but advancing issue that is being addressed in the field. The revival of persisters is triggered through chemotaxis systems, sensing nutrient availability within the environment, such as essential amino acids. Secondary messenger proteins like cAMP that are in high concentrations in persisters are reduced, leading to ribosomal resuscitation and following protein synthesis and growth [42]. Furthermore, the slow growth and altered characteristics of SCVs, such as reduced metabolism and increased antibiotic tolerance [43], allow them to evade the immune system and antibiotic treatment and persist longer in nutrient-depleted environments, contributing to chronic and recurrent infections [24]. The growth patterns observed throughout this experiment resemble that of persisters and SCVs. However, further testing would be required to confirm these phenotypes [27]. The simultaneous occurrence of persister-like colonies among wild-type and the resumed growth after 48 h of incubation could indicate a reversion back to the wild-type phenotype when introduced back to a nutrient-rich environment. The appearance of persister-like colonies at different time points across biological replicates and their subsequent reversion is expected, given the unstable and often transient nature of SCVs [25]. Furthermore, SCVs are difficult to culture, contributing to the challenge of researching this persister, but as this study presents and others have suspected, the strategy of continuous culturing is proving to be an effective strategy for the selection of persisters like SCVs [44].
Confirmation of viability using multiple assays revealed inconsistencies within culture-based detection methods. Culture-based methods of detection are considered the ‘gold standard’ when testing for food contamination and food analysis [45]. However, while the results from the plating and qPCR were similar on T87, divergences occurred on T120, where the qPCR determined a larger viable population than the culture-based method. With the development of persisters, culture-based methods for detection become unreliable due to the slow growth of these persisters. For example, SCVS may take 2–3 days to become visible on a plate [27], not appearing within the incubation period used within the experiment and, therefore, seemingly having a lower viable population. Additionally, the ATP assay revealed a steady level of intracellular ATP between both strains on both days, confirming viability and active metabolism. When the integrity of the membrane is compromised, ATP production is halted, and ATPases will deplete any remaining intracellular ATP [46]. Based on the maintained ATP presence within the cells at both time points, the population may have reached a favored ATP concentration to sustain a persister state, enough to support this chemotaxis sensing necessary for resuscitation. The 48-h incubations in combination with the small sample size and limited sample collections provide a restricted perspective of the true viability of the population, but local conditions are causing stochastic fluctuations in plate counts, persister-like growth, and viability within these assays, further complicating the phenomenon of persistence.
Our objective was to evaluate the persistence mechanisms involved during nutritional stress in a subset of different host-derived isolates, with a specific interest in the induction of persisters. These findings highlight potential broader implications of S. aureus persistence mechanisms, especially when considering the known health risks, food safety, and zoonotic potential of S. aureus. By revealing how S. aureus adapts and survives under prolonged nutritional stress, this research underscores the capacity of this pathogen to persist in livestock and human settings alike, contributing to recalcitrant and recurring infections. Such adaptability not only complicates treatment but also poses a risk for cross-species transmission, which can amplify the spread of resilient strains and potentially contribute to outbreaks. Understanding these persistence strategies is essential for informing effective therapeutic and preventative measures aimed at minimizing the impact of S. aureus on both human and veterinary health. Further investigation into the molecular mechanisms driving SCV formation, persistence, and resuscitation when considering environmental stressors and host-specific factors is essential for improving therapeutic approaches to prevent and manage these challenging infections in human and veterinary medicine.

Author Contributions

Conceptualization, K.R.R., C.A.S. and B.C.W.; methodology, K.R.R., C.A.S. and B.C.W. formal analysis, K.R.R. and C.A.S.; resources, B.C.W.; data curation, K.R.R. and C.A.S.; writing—original draft preparation, K.R.R.; writing—reviewing and editing, K.R.R., C.A.S. and B.C.W.; visualization, K.R.R. and C.A.S.; project administration, B.C.W.; funding acquisition, B.C.W. All authors have read and agreed to the published version of the manuscript.

Funding

This research received no external funding.

Institutional Review Board Statement

Not applicable.

Informed Consent Statement

Not applicable.

Data Availability Statement

Data are contained within the article.

Conflicts of Interest

The authors declare no conflicts of interest. The funders had no role in the design of this study; in the collection, analysis, or interpretation of data; in the writing of the manuscript; or in the decision to publish the results.

Abbreviation

The following abbreviation is used in this manuscript:
SCVSmall Colony Variant

Appendix A

Table A1. Two-tailed t-tests with unequal variances of growth rates in different medias.
Between StrainLactose0.14370278
Glucose0.684679703
DMEM0.902200382
BHI0.396304143
USA300 LactoseGlucoseDMEMBHI
LactoseNA
Glucose0.474397606NA
DMEM0.4599869840.404311317NA
BHI0.2758560740.1719695570.648222506NA
ATCC 29740 LactoseGlucoseDMEMBHI
LactoseNA
Glucose0.686956269NA
DMEM0.2844798080.07761123NA
BHI0.077611230.1585642510.372151583NA
Table A2. Polynomials for growth rate determination in different medias.
USA300 LactoseUSA300 LactoseUSA300 LactoseATCC 29740 LactoseATCC 29740 LactoseATCC 29740 LactoseUSA300 GlucoseUSA300 GlucoseUSA300 GlucoseATCC 29740 GlucoseATCC 29740 GlucoseATCC 29740 GlucoseUSA300 DMEMUSA300 DMEMUSA300 DMEMATCC 29740 DMEMATCC 29740 DMEMATCC 29740 DMEMUSA300 BHIUSA300 BHIUSA300 BHIATCC 29740 BHIATCC 29740 BHIATCC 29740 BHI
Polynomial: Third Order (Y = A + B × X + C × X2 + D × X3)
Best-fit values
A−0.02955−0.02211−0.04404−0.03076−0.00408−0.00111−0.02581−0.03726−0.03781−0.034690.014710.005401−0.003383−0.01499−0.009090.0002317−0.01088−0.01937−0.008495−0.067060.006125−0.03296−0.03929−0.01938
B0.010280.006040.010910.017560.014140.014420.00960.0083710.011590.018820.012150.0143−0.0008398−0.00015390.0008184−0.00043620.00021570.0022740.037170.045760.034910.028020.027340.01746
C−0.0001998−4.69 × 10−05−0.0001984−0.0004227−0.0003586−0.0003699−0.0001915−0.000144−0.0002658−0.0004149−0.0003274−0.0003271.92 × 10−059.57 × 10−06−1.52 × 10−053.05 × 10−051.19 × 10−05−4.55 × 10−05−0.0005777−0.0008184−0.0006166−0.0003767−0.0004096−0.0002194
D1.03 × 10−06−1.35 × 10−079.69 × 10−072.71 × 10−062.41 × 10−062.49 × 10−061.13 × 10−066.76 × 10−071.65 × 10−062.56 × 10−062.28 × 10−062.08 × 10−06−1.53 × 10−07−1.01 × 10−078.03 × 10−08−2.34 × 10−07−1.28 × 10−072.62 × 10−073.05 × 10−064.67 × 10−063.58 × 10−061.65 × 10−062.23 × 10−068.96 × 10−07
95% CI (profile likelihood)
A−0.04944 to −0.009659−0.04571 to 0.001492−0.06369 to −0.02439−0.04600 to −0.01553−0.02068 to 0.01252−0.01817 to 0.01595−0.03908 to −0.01253−0.05263 to −0.02188−0.05377 to −0.02186−0.05573 to −0.01365−0.006418 to 0.03584−0.01603 to 0.02684−0.006616 to −0.0001501−0.01899 to −0.01099−0.01359 to −0.004586−0.004664 to 0.005127−0.01424 to −0.007522−0.02343 to −0.01530−0.03834 to 0.02135−0.08336 to −0.05076−0.03117 to 0.04342−0.06039 to −0.005528−0.05340 to −0.02518−0.03421 to −0.004551
B0.008121 to 0.012440.003478 to 0.0086010.008783 to 0.013050.01591 to 0.019210.01234 to 0.015940.01256 to 0.016270.008159 to 0.011040.006703 to 0.010040.009857 to 0.013320.01654 to 0.021100.009854 to 0.014440.01197 to 0.01663−0.001191 to −0.0004890−0.0005882 to 0.00028030.0003297 to 0.001307−0.0009674 to 9.499 × 10−05−0.0001486 to 0.00057990.001833 to 0.0027160.03393 to 0.040400.04399 to 0.047530.03086 to 0.038960.02504 to 0.031000.02581 to 0.028870.01585 to 0.01907
C−0.0002590 to −0.0001406−0.0001171 to 2.342 × 10−05−0.0002569 to −0.0001399−0.0004681 to −0.0003773−0.0004081 to −0.0003092−0.0004207 to −0.0003191−0.0002311 to −0.0001520−0.0001897 to −9.819 × 10−05−0.0003133 to −0.0002183−0.0004776 to −0.0003523−0.0003903 to −0.0002645−0.0003908 to −0.00026319.538 × 10−06 to 2.879 × 10−05−2.350 × 10−06 to 2.148 × 10−05−2.860 × 10−05 to −1.776 × 10−061.588 × 10−05 to 4.504 × 10−051.940 × 10−06 to 2.193 × 10−05−5.765 × 10−05 to −3.343 × 10−05−0.0006666 to −0.0004888−0.0008669 to −0.0007698−0.0007277 to −0.0005056−0.0004584 to −0.0002950−0.0004516 to −0.0003676−0.0002636 to −0.0001753
D5.783 × 10−07 to 1.473 × 10−06−6.660 × 10−07 to 3.955 × 10−075.275 × 10−07 to 1.411 × 10−062.364 × 10−06 to 3.049 × 10−062.032 × 10−06 to 2.778 × 10−062.108 × 10−06 to 2.876 × 10−068.323 × 10−07 to 1.429 × 10−063.305 × 10−07 to 1.022 × 10−061.292 × 10−06 to 2.010 × 10−062.090 × 10−06 to 3.036 × 10−061.802 × 10−06 to 2.753 × 10−061.593 × 10−06 to 2.557 × 10−06−2.258 × 10−07 to −8.040 × 10−08−1.914 × 10−07 to −1.143 × 10−08−2.094 × 10−08 to 1.816 × 10−07−3.443 × 10−07 to −1.241 × 10−07−2.037 × 10−07 to −5.273 × 10−081.709 × 10−07 to 3.538 × 10−072.378 × 10−06 to 3.720 × 10−064.299 × 10−06 to 5.032 × 10−062.740 × 10−06 to 4.417 × 10−061.034 × 10−06 to 2.268 × 10−061.916 × 10−06 to 2.550 × 10−065.627 × 10−07 to 1.230 × 10−06
Goodness of Fit
Degrees of Freedom929292929292929292929292929292929292929292929292
R squared0.67690.66250.72780.86290.75570.75630.79140.74420.72140.80160.5950.67190.65050.17050.21380.82260.8090.67810.96930.98990.92650.96330.99010.9758
Sum of Squares0.08960.12620.087410.052560.062380.065930.039920.053530.057650.10030.10110.10410.0023670.0036270.0045940.0054270.0025520.0037440.20170.060160.3150.17040.04510.04981
Sy.x0.031210.037030.030820.02390.026040.026770.020830.024120.025030.033020.033150.033630.0050720.0062790.0070660.0076810.0052660.0063790.046830.025570.058510.043040.022140.02327

References

  1. Lowy, F.D. Staphylococcus aureus infections. N. Engl. J. Med. 1998, 339, 520–532. [Google Scholar] [CrossRef] [PubMed]
  2. Peton, V.; Le Loir, Y. Staphylococcus aureus in veterinary medicine. Infect. Genet. Evol. 2014, 21, 602–615. [Google Scholar] [CrossRef]
  3. Peres, A.G.; Madrenas, J. The broad landscape of immune interactions with Staphylococcus aureus: From commensalism to lethal infections. Burns 2013, 39, 380–388. [Google Scholar] [CrossRef] [PubMed]
  4. Gnanamani, A.; Hariharan, P.; Paul-Satyaseela, M. Staphylococcus aureus: Overview of Bacteriology, Clinical Diseases, Epidemiology, Antibiotic Resistance and Therapeutic Approach. In Frontiers in Staphylococcus aureus; InTech Open: London, UK, 2017. [Google Scholar]
  5. Thompson, R.L. Epidemiology of Nosocomial Infections Caused by Methicillin-Resistant Staphylococcus aureus. Ann. Intern. Med. 1982, 97, 309. [Google Scholar] [CrossRef] [PubMed]
  6. Sharma, N.K. Nosocomial Infections and Drug Susceptibility Patterns in Methicillin Sensitive and Methicillin Resistant Staphylococcus aureus. J. Clin. Diagn. Res. 2013, 7, 2178–2180. [Google Scholar] [CrossRef]
  7. Bhattacharya, M.; Wozniak, D.J.; Stoodley, P.; Hall-Stoodley, L. Prevention and treatment of Staphylococcus aureus biofilms. Expert. Rev. Anti-Infect. Ther. 2015, 13, 1499–1516. [Google Scholar] [CrossRef]
  8. Campos, B.; Pickering, A.C.; Rocha, L.S.; Aguilar, A.P.; Fabres-Klein, M.H.; de Oliveira Mendes, T.A.; Fitzgerald, J.R.; de Oliveira Barros Ribon, A. Diversity and pathogenesis of Staphylococcus aureus from bovine mastitis: Current understanding and future perspectives. BMC Vet. Res. 2022, 18, 115. [Google Scholar] [CrossRef] [PubMed]
  9. Haag, A.F.; Fitzgerald, J.R.; Penadés, J.R. Staphylococcus aureus in Animals. Microbiol. Spectr. 2019, 7, 10–1128. [Google Scholar] [CrossRef] [PubMed]
  10. Jangra, S.; Khunger, S.; Chattopadhya, D. Antimicrobial Resistance in Staphylococci Special Emphasis on Methicillin Resistance among Companion Livestock and Its Impact on Human Health in Rural India. In Bovine Science-Challenges and Advances; IntechOpen: London, UK, 2022. [Google Scholar]
  11. Park, S.; Ronholm, J. Staphylococcus aureus in Agriculture: Lessons in Evolution from a Multispecies Pathogen. Clin. Microbiol. Rev. 2021, 34, 10–1128. [Google Scholar] [CrossRef]
  12. Leonard, F.C.; Markey, B.K. Meticillin-resistant Staphylococcus aureus in animals: A review. Vet. J. 2008, 175, 27–36. [Google Scholar] [CrossRef]
  13. Onyango, L.A.; Alreshidi, M.M. Adaptive Metabolism in Staphylococci: Survival and Persistence in Environmental and Clinical Settings. J. Pathog. 2018, 2018, 1092632. [Google Scholar] [CrossRef]
  14. Cassat, J.E.; Skaar, E.P. Metal ion acquisition in Staphylococcus aureus: Overcoming nutritional immunity. Semin. Immunopathol. 2012, 34, 215–235. [Google Scholar] [CrossRef] [PubMed]
  15. Grim, K.P.; Francisco, B.S.; Radin, J.N.; Brazel, E.B.; Kelliher, J.L.; Párraga Solórzano, P.K.; Kim, P.C.; McDevitt, C.A.; Kehl-Fie, T.E. The Metallophore Staphylopine Enables Staphylococcus aureus To Compete with the Host for Zinc and Overcome Nutritional Immunity. mBio 2017, 8, 10–1128. [Google Scholar] [CrossRef] [PubMed]
  16. Pantosti, A.; Sanchini, A.; Monaco, M. Mechanisms of Antibiotic Resistance in Staphylococcus Aureus. Future Microbiol. 2007, 2, 323–334. [Google Scholar] [CrossRef]
  17. Appelbaum, P.C. Microbiology of Antibiotic Resistance in Staphylococcus aureus. Clin. Infect. Dis. 2007, 45, S165–S170. [Google Scholar] [CrossRef]
  18. Chambers, H.F.; Deleo, F.R. Waves of resistance: Staphylococcus aureus in the antibiotic era. Nat. Rev. Microbiol. 2009, 7, 629–641. [Google Scholar] [CrossRef]
  19. Dinges, M.M.; Orwin, P.M.; Schlievert, P.M. Exotoxins of Staphylococcus aureus. Clin. Microbiol. Rev. 2000, 13, 16–34. [Google Scholar] [CrossRef]
  20. Conlon, B.P. Staphylococcus aureus chronic and relapsing infections: Evidence of a role for persister cells: An investigation of persister cells, their formation and their role in S. aureus disease. BioEssays 2014, 36, 991–996. [Google Scholar] [CrossRef] [PubMed]
  21. Chang, J.; Lee, R.-E.; Lee, W. A pursuit of Staphylococcus aureus continues: A role of persister cells. Arch. Pharmacal Res. 2020, 43, 630–638. [Google Scholar] [CrossRef]
  22. Lewis, K. Persister Cells: Molecular Mechanisms Related to Antibiotic Tolerance. Handb. Exp. Pharmacol. 2012, 211, 121–133. [Google Scholar]
  23. Proctor, R.A.; von Eiff, C.; Kahl, B.C.; Becker, K.; McNamara, P.; Herrmann, M.; Peters, G. Small colony variants: A pathogenic form of bacteria that facilitates persistent and recurrent infections. Nat. Rev. Microbiol. 2006, 4, 295–305. [Google Scholar] [CrossRef] [PubMed]
  24. Proctor, R.A.; Kriegeskorte, A.; Kahl, B.C.; Becker, K.; Löffler, B.; Peters, G. Staphylococcus aureus Small Colony Variants (SCVs): A road map for the metabolic pathways involved in persistent infections. Front. Cell. Infect. Microbiol. 2014, 4, 99. [Google Scholar] [CrossRef]
  25. Tuchscherr, L.; Heitmann, V.; Hussain, M.; Viemann, D.; Roth, J.; von Eiff, C.; Peters, G.; Becker, K.; Löffler, B. Staphylococcus aureus Small-Colony Variants Are Adapted Phenotypes for Intracellular Persistence. J. Infect. Dis. 2010, 202, 1031–1040. [Google Scholar] [CrossRef]
  26. Tuchscherr, L.; Medina, E.; Hussain, M.; Völker, W.; Heitmann, V.; Niemann, S.; Holzinger, D.; Roth, J.; Proctor, R.A.; Becker, K.; et al. Staphylococcus aureus phenotype switching: An effective bacterial strategy to escape host immune response and establish a chronic infection. EMBO Mol. Med. 2011, 3, 129–141. [Google Scholar] [CrossRef] [PubMed]
  27. Becker, K. Detection, Identification and Diagnostic Characterization of the Staphylococcal Small Colony-Variant (SCV) Phenotype. Antibiotics 2023, 12, 1446. [Google Scholar] [CrossRef] [PubMed]
  28. Rowe, S.E.; Beam, J.E.; Conlon, B.P. Recalcitrant Staphylococcus aureus Infections: Obstacles and Solutions. Infect. Immun. 2021, 89, 10–1128. [Google Scholar] [CrossRef] [PubMed]
  29. Zaatout, N.; Ayachi, A.; Kecha, M. Staphylococcus aureus persistence properties associated with bovine mastitis and alternative therapeutic modalities. J. Appl. Microbiol. 2020, 129, 1102–1119. [Google Scholar] [CrossRef] [PubMed]
  30. Lin, X.-Q.; Liu, Z.-Z.; Zhou, C.-K.; Zhang, L.; Gao, Y.; Luo, X.-Y.; Zhang, J.-G.; Chen, W.; Yang, Y.-J. Trained immunity in recurrent Staphylococcus aureus infection promotes bacterial persistence. PLoS Pathog. 2024, 20, e1011918. [Google Scholar] [CrossRef]
  31. Gao, S.; Oh, D.H.; Broadbent, D.R.; Johnson, M.E.; Weimer, B.C.; Steele, J.L. Aromatic amino acid catabolism by lactococci. Le. Lait. 1997, 77, 371–381. [Google Scholar] [CrossRef]
  32. Shaw, C.; Weimer, B.C.; Gann, R.; Desai, P.T.; Shah, J.D. The Yin and Yang of pathogens and probiotics: Interplay between Salmonella enterica sv. Typhimurium and Bifidobacterium infantis during co-infection. Front. Microbiol. 2024, 15, 1387498. [Google Scholar] [CrossRef]
  33. Arabyan, N.; Park, D.; Foutouhi, S.; Weis, A.M.; Huang, B.C.; Williams, C.C.; Desai, P.; Shah, J.; Jeannotte, R.; Kong, N.; et al. Salmonella Degrades the Host Glycocalyx Leading to Altered Infection and Glycan Remodeling. Sci. Rep. 2016, 6, 29525. [Google Scholar] [CrossRef] [PubMed]
  34. Smug, B.J.; Opalek, M.; Necki, M.; Wloch-Salamon, D. Microbial lag calculator: A shiny-based application and an R package for calculating the duration of microbial lag phase. Methods Ecol. Evol. 2024, 15, 301–307. [Google Scholar] [CrossRef]
  35. Peyrusson, F.; Nguygen, T.K.; Najdovski, T.; Van Bambeke, F. Host Cell Oxidative Stress Induces Dormant Staphylococcus aureus Persisters. Microbiol. Spectr. 2022, 10, e0231321. [Google Scholar] [CrossRef]
  36. Ayrapetyan, M.; Williams, T.C.; Baxter, R.; Oliver, J.D. Viable but Nonculturable and Persister Cells Coexist Stochastically and Are Induced by Human Serum. Infect. Immun. 2015, 83, 4194–4203. [Google Scholar] [CrossRef]
  37. Huemer, M.; Shambat, S.M.; Bergada-Pijuan, J.; Söderholm, S.; Boumasmoud, M.; Vulin, C.; Gómez-Mejia, A.; Antelo Varela, M.; Tripathi, V.; Götschi, S.; et al. Molecular reprogramming and phenotype switching in Staphylococcus aureus lead to high antibiotic persistence and affect therapy success. Proc. Natl. Acad. Sci. USA 2021, 118, e2014920118. [Google Scholar] [CrossRef]
  38. Richardson, E.J.; Bacigalupe, R.; Harrison, E.M.; Weinert, L.A.; Lycett, S.; Vrieling, M.; Robb, K.; Hoskisson, P.A.; Holden, M.T.G.; Feil, E.J.; et al. Gene exchange drives the ecological success of a multi-host bacterial pathogen. Nat. Ecol. Evol. 2018, 2, 1468–1478. [Google Scholar] [CrossRef] [PubMed]
  39. Stülke, J.; Hillen, W. Carbon. catabolite repression in bacteria. Curr. Opin. Microbiol. 1999, 2, 195–201. [Google Scholar] [CrossRef]
  40. Ayrapetyan, M.; Williams, T.; Oliver, J.D. Relationship between the Viable but Nonculturable State and Antibiotic Persister Cells. J. Bacteriol. 2018, 200, 10–1128. [Google Scholar] [CrossRef]
  41. Watson, S.P.; Clements, M.O.; Foster, S.J. Characterization of the Starvation-Survival Response of Staphylococcus aureus. J. Bacteriol. 1998, 180, 1750–1758. [Google Scholar] [CrossRef] [PubMed]
  42. Wainwright, J.; Hobbs, G.; Nakouti, I. Persister cells: Formation, resuscitation and combative therapies. Arch. Microbiol. 2021, 203, 5899–5906. [Google Scholar] [CrossRef] [PubMed]
  43. Von Eiff, C. Staphylococcus aureus small colony variants: A challenge to microbiologists and clinicians. Int. J. Antimicrob. Agents 2008, 31, 507–510. [Google Scholar] [CrossRef] [PubMed]
  44. Lee, J.; Zilm, P.S.; Kidd, S.P. Novel Research Models for Staphylococcus aureus Small Colony Variants (SCV) Development: Co-pathogenesis and Growth Rate. Front. Microbiol. 2020, 11, 321. [Google Scholar] [CrossRef] [PubMed]
  45. Foddai, A.C.G.; Grant, I.R. Methods for detection of viable foodborne pathogens: Current state-of-art and future prospects. Appl. Microbiol. Biotechnol. 2020, 104, 4281–4288. [Google Scholar] [CrossRef]
  46. Riss, T.L.; Moravec, R.A.; Niles, A.L.; Duellman, S.; Benink, H.A.; Worzella, T.J.; Minor, L. Cell Viability Assays. Assay Guidance Manual; Eli Lilly & Company and the National Center for Advancing Translational Sciences: Bethesda, MD, USA, 2016.
Figure 1. Staphylococcus aureus growth curves in different media. Similar cell densities were reached for both strains when grown in media other than BHI. Growth curves in DMEM maintained an OD595 of about 0.
Pathogens 14 00251 g001
Figure 2. Plate count enumeration during extended incubation in CDM containing 0.5% lactose. Plate counts were averaged over three biological replicates and three technical replicates. Error bars represent ± SEM.
Pathogens 14 00251 g002
Figure 3. Colony morphology within the culturable population during growth on plating; (a) S. aureus ATCC 297490 A at T120 after 24 h incubation on the plate. There are minuscule colonies appearing, but they are too small to retrieve an accurate count. This characterizes the entire plated population; (b) the plate from (a) after 48 h of incubation on the plate, showing colonies now have reverted and display wild-type features. (c) Staphylococcus aureus USA300 B at T87 after 24 h of incubation on the plate that contained two phenotypic colonies, wild-type and small morphology, visualized on the zoomed in panel. The dashed arrow indicates SCV-like colonies, while the solid arrow indicates wild-type colonies.
Pathogens 14 00251 g003
Figure 4. Cell density and intracellular energy during the persistence phase. (A) RT-qPCR determining cell viability through EF-TU quantification (refer to Section 2) at T87 and T120, illustrating an increase in population over these two days. A significant difference was seen between USA300 between T87 and T120 at p = 0.0011. (B) ATP assay on T87 and T120, indicating a maintained composition level of intracellular ATP. ns represents nonsignificant, ** represents p-value < 0.005.
Pathogens 14 00251 g004
Disclaimer/Publisher’s Note: The statements, opinions and data contained in all publications are solely those of the individual author(s) and contributor(s) and not of MDPI and/or the editor(s). MDPI and/or the editor(s) disclaim responsibility for any injury to people or property resulting from any ideas, methods, instructions or products referred to in the content.

