
Potential Therapeutic Target and Vaccines for SARS-CoV-2

 , ,
, ,  ,
,  , ,
, ,  , , ,
, , ,  ,
,  and
and 
Abstract
1. Introduction
2. Material and Methods
2.1. Whole Genomes Analysis
2.2. Comparative Genomic Analysis of SARS-CoV-2 with the Most Relevant One
2.3. Low Similarity Region Analysis
3. Results and Discussion
3.1. Whole Genome Analysis
3.2. Low Similarity Region Analysis
4. Conclusions
Author Contributions
Funding
Institutional Review Board Statement
Informed Consent Statement
Data Availability Statement
Acknowledgments
Conflicts of Interest
Abbreviations
References
- Martín-Blanco, C.; Zamorano, M.; Lizárraga, C.; Molina-Moreno, V. The Impact of COVID-19 on the Sustainable Development Goals: Achievements and Expectations. Int. J. Environ. Res. Public Health 2022, 19, 16266. [Google Scholar] [CrossRef] [PubMed]
- Safitri, Y.; Ningsih, R.D.; Agustianingsih, D.P.; Sukhwani, V.; Kato, A.; Shaw, R. COVID-19 Impact on SDGs and the Fiscal Measures: Case of Indonesia. Int. J. Environ. Res. Public Health 2021, 18, 2911. [Google Scholar] [CrossRef] [PubMed]
- Custodis, F.; Schwarzkopf, K.; Weimann, R.; Spüntrup, E.; Böhm, M.; Laufs, U. A SARS-CoV2-negative corona victim. Clin. Res. Cardiol. Off. J. Ger. Card. Soc. 2020, 109, 1569–1572. [Google Scholar] [CrossRef] [PubMed]
- Hassan, M.M.; Hussain, M.A.; Kambal, S.; Elshikh, A.A.; Gendeel, O.R.; Ahmed, S.A.; Altayeb, R.A.; Muhajir, A.M.; Mohamed, S.B. NeoCoV Is Closer to MERS-CoV than SARS-CoV. Infect. Dis. 2020, 13, 1178633720930711. [Google Scholar] [CrossRef] [PubMed]
- Zhang, W. COVID-19: From Basics to Clinical Practice; World Scientific: Singapore, 2020. [Google Scholar]
- Kahn, J.S.; McIntosh, K. History and recent advances in coronavirus discovery. Pediatr. Infect. Dis. J. 2005, 24, S223–S227, discussion S226. [Google Scholar] [CrossRef]
- Abdallah, H.M.; El-Halawany, A.M.; Darwish, K.M.; Algandaby, M.M.; Mohamed, G.A.; Ibrahim, S.R.M.; Koshak, A.E.; Elhady, S.S.; Fadil, S.A.; Alqarni, A.A.; et al. Bio-Guided Isolation of SARS-CoV-2 Main Protease Inhibitors from Medicinal Plants: In Vitro Assay and Molecular Dynamics. Plants 2022, 11, 1914. [Google Scholar] [CrossRef]
- Abdallah, H.M.; El-Halawany, A.M.; Sirwi, A.; El-Araby, A.M.; Mohamed, G.A.; Ibrahim, S.R.M.; Koshak, A.E.; Asfour, H.Z.; Awan, Z.A.; Elfaky, M.A. Repurposing of Some Natural Product Isolates as SARS-CoV-2 Main Protease Inhibitors via In Vitro Cell Free and Cell-Based Antiviral Assessments and Molecular Modeling Approaches. Pharmaceuticals 2021, 14, 213. [Google Scholar] [CrossRef] [PubMed]
- Sharma, A.; Tiwari, S.; Deb, M.K.; Marty, J.L. Severe acute respiratory syndrome coronavirus-2 (SARS-CoV-2): A global pandemic and treatment strategies. Int. J. Antimicrob. Agents 2020, 56, 106054. [Google Scholar] [CrossRef]
- Sifuentes-Rodríguez, E.; Palacios-Reyes, D. COVID-19: The outbreak caused by a new coronavirus. Bol. Med. Del Hosp. Infant. Mex. 2020, 77, 47–53. [Google Scholar] [CrossRef]
- Koley, T.K.; Dhole, M. The COVID-19 Pandemic: The Deadly Coronavirus Outbreak; Routledge India: Delhi, India, 2020. [Google Scholar]
- Kavey, R.-E.W.; Kavey, A.B. Viral Pandemics: From Smallpox to COVID-19; Routledge: London, UK, 2020. [Google Scholar]
- Available online: https://covid19.who.int/ (accessed on 15 March 2023).
- Zhou, H.; Chen, X.; Hu, T.; Li, J.; Song, H.; Liu, Y.; Wang, P.; Liu, D.; Yang, J.; Holmes, E.C.; et al. A Novel Bat Coronavirus Closely Related to SARS-CoV-2 Contains Natural Insertions at the S1/S2 Cleavage Site of the Spike Protein. Curr. Biol. 2020, 30, 2196–2203. [Google Scholar] [CrossRef]
- Malik, Y.A. Properties of Coronavirus and SARS-CoV-2. Malays. J. Pathol. 2020, 42, 3–11. [Google Scholar] [PubMed]
- Yang, X.L.; Hu, B.; Wang, B.; Wang, M.N.; Zhang, Q.; Zhang, W.; Wu, L.J.; Ge, X.Y.; Zhang, Y.Z.; Daszak, P.; et al. Isolation and Characterization of a Novel Bat Coronavirus Closely Related to the Direct Progenitor of Severe Acute Respiratory Syndrome Coronavirus. J. Virol. 2015, 90, 3253–3256. [Google Scholar] [CrossRef] [PubMed]
- Chen, S.; Zheng, X.; Zhu, J.; Ding, R.; Jin, Y.; Zhang, W.; Yang, H.; Zheng, Y.; Li, X.; Duan, G. Extended ORF8 Gene Region Is Valuable in the Epidemiological Investigation of Severe Acute Respiratory Syndrome-Similar Coronavirus. J. Infect. Dis. 2020, 222, 223–233. [Google Scholar] [CrossRef]
- Wu, Z.; Yang, L.; Ren, X.; Zhang, J.; Yang, F.; Zhang, S.; Jin, Q. ORF8-Related Genetic Evidence for Chinese Horseshoe Bats as the Source of Human Severe Acute Respiratory Syndrome Coronavirus. J. Infect. Dis. 2016, 213, 579–583. [Google Scholar] [CrossRef] [PubMed]
- Mousavizadeh, L.; Ghasemi, S. Genotype and phenotype of COVID-19: Their roles in pathogenesis. J. Microbiol. Immunol. Infect. 2021, 54, 159–163. [Google Scholar] [CrossRef]
- Edgar, R.C. MUSCLE: Multiple sequence alignment with high accuracy and high throughput. Nucleic Acids Res. 2004, 32, 1792–1797. [Google Scholar] [CrossRef]
- Kumar, S.; Stecher, G.; Tamura, K. MEGA7: Molecular Evolutionary Genetics Analysis Version 7.0 for Bigger Datasets. Mol. Biol. Evol. 2016, 33, 1870–1874. [Google Scholar] [CrossRef]
- Felsenstein, J. Confidence Limits on Phylogenies: An Approach Using the Bootstrap. Evol. Int. J. Org. Evol. 1985, 39, 783–791. [Google Scholar] [CrossRef]
- Carver, T.J.; Rutherford, K.M.; Berriman, M.; Rajandream, M.A.; Barrell, B.G.; Parkhill, J. ACT: The Artemis Comparison Tool. Bioinformatics 2005, 21, 3422–3423. [Google Scholar] [CrossRef]
- Yachdav, G.; Kloppmann, E.; Kajan, L.; Hecht, M.; Goldberg, T.; Hamp, T.; Hönigschmid, P.; Schafferhans, A.; Roos, M.; Bernhofer, M.; et al. PredictProtein—An open resource for online prediction of protein structural and functional features. Nucleic Acids Res. 2014, 42, W337–W343. [Google Scholar] [CrossRef]
- Bienert, S.; Waterhouse, A.; de Beer, T.A.; Tauriello, G.; Studer, G.; Bordoli, L.; Schwede, T. The SWISS-MODEL Repository-new features and functionality. Nucleic Acids Res. 2017, 45, D313–D319. [Google Scholar] [CrossRef] [PubMed]
- Zhang, Y.; Skolnick, J. TM-align: A protein structure alignment algorithm based on the TM-score. Nucleic Acids Res. 2005, 33, 2302–2309. [Google Scholar] [CrossRef] [PubMed]
- Csaba, G.; Birzele, F.; Zimmer, R. Systematic comparison of SCOP and CATH: A new gold standard for protein structure analysis. BMC Struct. Biol. 2009, 9, 23. [Google Scholar] [CrossRef] [PubMed]
- Buchan, D.W.A.; Jones, D.T. The PSIPRED Protein Analysis Workbench: 20 years on. Nucleic Acids Res. 2019, 47, W402–W407. [Google Scholar] [CrossRef]
- Nugent, T.; Jones, D.T. Transmembrane protein topology prediction using support vector machines. BMC Bioinform. 2009, 10, 159. [Google Scholar] [CrossRef]
- Ahmed, S.F.; Quadeer, A.A.; McKay, M.R. Preliminary Identification of Potential Vaccine Targets for the COVID-19 Coronavirus (SARS-CoV-2) Based on SARS-CoV Immunological Studies. Viruses 2020, 12, 254. [Google Scholar] [CrossRef]
- Petrosillo, N.; Viceconte, G.; Ergonul, O.; Ippolito, G.; Petersen, E. COVID-19, SARS and MERS: Are they closely related? Clin. Microbiol. Infect. 2020, 26, 729–734. [Google Scholar] [CrossRef]
- Shereen, M.A.; Khan, S.; Kazmi, A.; Bashir, N.; Siddique, R. COVID-19 infection: Origin, transmission, and characteristics of human coronaviruses. J. Adv. Res. 2020, 24, 91–98. [Google Scholar] [CrossRef]
- Ceraolo, C.; Giorgi, F.M. Genomic variance of the 2019-nCoV coronavirus. J. Med. Virol. 2020, 92, 522–528. [Google Scholar] [CrossRef]
- Park, M.D. Immune evasion via SARS-CoV-2 ORF8 protein? Nat. Rev. Immunol. 2020, 20, 408. [Google Scholar] [CrossRef]
- Lau, S.K.; Feng, Y.; Chen, H.; Luk, H.K.; Yang, W.H.; Li, K.S.; Zhang, Y.Z.; Huang, Y.; Song, Z.Z.; Chow, W.N.; et al. Severe Acute Respiratory Syndrome (SARS) Coronavirus ORF8 Protein Is Acquired from SARS-Related Coronavirus from Greater Horseshoe Bats through Recombination. J. Virol. 2015, 89, 10532–10547. [Google Scholar] [CrossRef]
- Keng, C.-T.; Tan, Y.-J. Molecular and Biochemical Characterization of the SARS-CoV Accessory Proteins ORF8a, ORF8b and ORF8ab. In Molecular Biology of the SARS-Coronavirus; Springer: Berlin/Heidelberg, Germany, 2020. [Google Scholar]
- UniProt Consortium. UniProt: A worldwide hub of protein knowledge. Nucleic Acids Res. 2019, 47, D506–D515. [Google Scholar] [CrossRef] [PubMed]
- Shi, C.S.; Qi, H.Y.; Boularan, C.; Huang, N.N.; Abu-Asab, M.; Shelhamer, J.H.; Kehrl, J.H. SARS-coronavirus open reading frame-9b suppresses innate immunity by targeting mitochondria and the MAVS/TRAF3/TRAF6 signalosome. J. Immunol. 2014, 193, 3080–3089. [Google Scholar] [CrossRef] [PubMed]
- Schaecher, S.R.; Diamond, M.S.; Pekosz, A. The transmembrane domain of the severe acute respiratory syndrome coronavirus ORF7b protein is necessary and sufficient for its retention in the Golgi complex. J. Virol. 2008, 82, 9477–9491. [Google Scholar] [CrossRef] [PubMed]
- Li, F. Structure, Function, and Evolution of Coronavirus Spike Proteins. Annu. Rev. Virol. 2016, 3, 237–261. [Google Scholar] [CrossRef]


| 1 | 2 | 3 | 4 | 5 | 6 | 7 | 8 | 9 | ||
|---|---|---|---|---|---|---|---|---|---|---|
| MERS | 1 | 100.00 | 97.23 | 76.28 | 55.19 | 55.29 | 56.99 | 56.40 | 55.45 | |
| OC43 | 2 | 0.00 | 97.23 | 76.28 | 55.19 | 55.29 | 56.99 | 56.40 | 55.45 | |
| 4408S | 3 | 0.03 | 0.03 | 76.29 | 55.13 | 55.23 | 56.97 | 56.35 | 55.50 | |
| HKU1 | 4 | 0.29 | 0.2 | 0.29 | 54.74 | 55.98 | 57.19 | 57.73 | 55.67 | |
| SARS | 5 | 0.68 | 0.68 | 0.68 | 0.69 | 81.43 | 55.85 | 52.00 | 51.17 | |
| SARS-2 | 6 | 0.68 | 0.68 | 0.68 | 0.66 | 0.21 | 56.13 | 52.57 | 51.22 | |
| NEO | 7 | 0.64 | 0.64 | 0.64 | 0.63 | 0.66 | 0.65 | 52.74 | 52.01 | |
| NL63 | 8 | 0.65 | 0.65 | 0.65 | 0.62 | 0.76 | 0.75 | 0.74 | 69.67 | |
| 229E | 9 | 0.67 | 0.67 | 0.67 | 0.67 | 0.78 | 0.78 | 0.76 | 0.39 |
| Regions | Features | SARS-CoV | SARS-CoV-2 |
|---|---|---|---|
| First | Location | 1924–3883 | 1925–3956 |
| Genes | Orf1ab | Orf1ab | |
| Proteins | - Orf1ab - Orf1a | - Orf1ab - Orf1a | |
| Second | Location | 21,507–22,429 | 21,579–22,539 |
| Genes | Spike S | Spike S | |
| Proteins | Surface glycoprotein | Surface glycoprotein | |
| Third | Location | 27,799–28,103 | 27,912–28,257 |
| Genes | - Sars8a - Sars8b | Orf8 | |
| Proteins | - Hypothetical protein Sars8a - Hypothetical protein Sars8b | Orf8 protein |
| Information | SARS-CoV-2 | SARS-CoV |
|---|---|---|
| Length | 29,903 bp | 29,751 bp |
| Weight (single-stranded) | 9241.224 kDa | 9192.103 kDa |
| Counts of Atoms | ||
| Hydrogen (H) | 368,432 | 366,157 |
| Carbon (C) | 293,538 | 291,570 |
| Nitrogen (N) | 109,749 | 109,446 |
| Oxygen (O) | 180,059 | 179,169 |
| Phosphorus (P) | 29,903 | 29,751 |
| Comparison elements | ||
| Identities | 23,718 | |
| Percent identity | 79.12 | |
| Difference | 6261 | |
| Gaps | 304 | |
| Distance | 0.23 | |
| Descriptions | SARS-CoV ID | Length bp | SARS-CoV-2 ID | Length bp | Identities | Percent Identity | Difference | Gaps | Distance | |
|---|---|---|---|---|---|---|---|---|---|---|
| Name | ||||||||||
| Genes | ||||||||||
| Orf1ab | 1489680 | 21,221 | 43740578 | 21,290 | 16,972 | 79.65 | 4336 | 105 | 0.23 | |
| Spike | 1489668 | 3768 | 4374056 | 3822 | 2797 | 72.82 | 1044 | 92 | 0.31 | |
| Proteins | ||||||||||
| Orf1ab | NP_828849.2 | 7073 | YP_009724389.1 | 7096 | 6123 | 86.20 | 980 | 37 | 0.14 | |
| Orf1a | NP_828850.1 | 4382 | YP_009725295.1 | 4405 | 3550 | 80.46 | 862 | 37 | 0.21 | |
| Spike (S) | NP_828851.1 | 1255 | YP_009724390.1 | 1273 | 974 | 76.27 | 303 | 26 | 0.25 | |
| Proteins | SARS-CoV Orf1ab | SARS-CoV-2 Orf1ab | SARS-CoV Orf1a | SARS-CoV-2 Orf1a | SARS-CoV Spike (S) | SARS-CoV-2 Spike (S) | |
|---|---|---|---|---|---|---|---|
| Descriptions | |||||||
| Molecular weight | 790,248.32 | 794,057.79 | 486,372.73 | 489,988.91 | 139,109.14 | 141,178.47 | |
| Theoretical pI | 6.19 | 6.32 | 5.91 | 6.04 | 5.56 | 6.24 | |
| Extinction coefficients | 920,760 906,260 | 942,275 928,150 | 530,660 521,660 | 552,175 543,550 | 143,335 140,960 | 148,960 146,460 | |
| Estimated half-life | 30 h | 30 h | 30 h | 30 h | 30 h | 30 h | |
| Instability index | 33.65 (stable) | 33.31 (stable) | 35.51 (stable) | 34.92 (stable) | 32.42 (stable) | 33.01 (stable) | |
| Aliphatic index | 87.08 | 86.87 | 89.43 | 88.99 | 82.80 | 84.67 | |
| Grand average of hydropathicity (GRAVY) | −0.071 | −0.070 | −0.020 | −0.023 | −0.043 | −0.079 | |
| Descriptions | SARS-CoV ID | SARS-CoV-2 ID | Length | Genome Location | Protein Type (NCBI Database) | |
|---|---|---|---|---|---|---|
| Name | ||||||
| Genes | ||||||
| Orf8a (Sars8a) | 1489676 | - | 120 | 27,779–27,898 | - | |
| Orf8b (Sars8b) | 1489677 | - | 255 | 27,864–28,118 | - | |
| Orf8 | - | 43740577 | 366 | 27,894–28,259 | - | |
| Proteins | ||||||
| Orf8a | NP_849176.1 | - | 39 | - | Hypothetical protein | |
| Orf8b | NP_849177.1 | - | 84 | - | Hypothetical protein | |
| Orf8 | - | YP_009724396.1 | 121 | - | Orf8 protein | |
| Proteins | Orf8a NP_849176.1 | Orf8b NP_849177.1 | Orf8 YP_009724396.1 | |
|---|---|---|---|---|
| Descriptions | ||||
| Molecular weight | 4327.30 | 9560.16 | 13831.01 | |
| Theoretical pI | 8.30 | 9.45 | 5.42 | |
| Total number of negatively charged Total number of positively charged | 2 4 | 3 9 | 13 9 | |
| Extinction coefficients | 375 (Low confidence results) | 21,220 20,970 | 16,305 15,930 | |
| Estimated half-life | ||||
| Instability index | 27.07 (stable) | 34.68 (stable) | 45.79 (unstable) | |
| Aliphatic index | 119.74 | 88.21 | 97.36 | |
| Grand average of hydropathicity (GRAVY) | 0.644 | −0.029 | 0.219 | |
| Atomic composition | ||||
| Carbon (C) | 185 | 425 | 633 | |
| Hydrogen (H) | 318 | 667 | 961 | |
| Nitrogen (N) | 52 | 125 | 155 | |
| Oxygen (O) | 52 | 113 | 177 | |
| Sulfur (S) | 7 | 7 | 8 | |
| Total number of atoms | 614 | 1337 | 1934 | |
| Subsection | Orf8a | Orf8b | Orf8 | |||
|---|---|---|---|---|---|---|
| BLASTp results (most significant with 100% of similarity) | Protein nonstructural 8a (UniProt ID: Q7TFA0) | Non-structural protein 8b (UniProt ID: Q80H93) | Non-structural protein 8 (UniProt ID: P0DTC8) | |||
| UniProtKB curators | Reviewed | Reviewed | Reviewed | |||
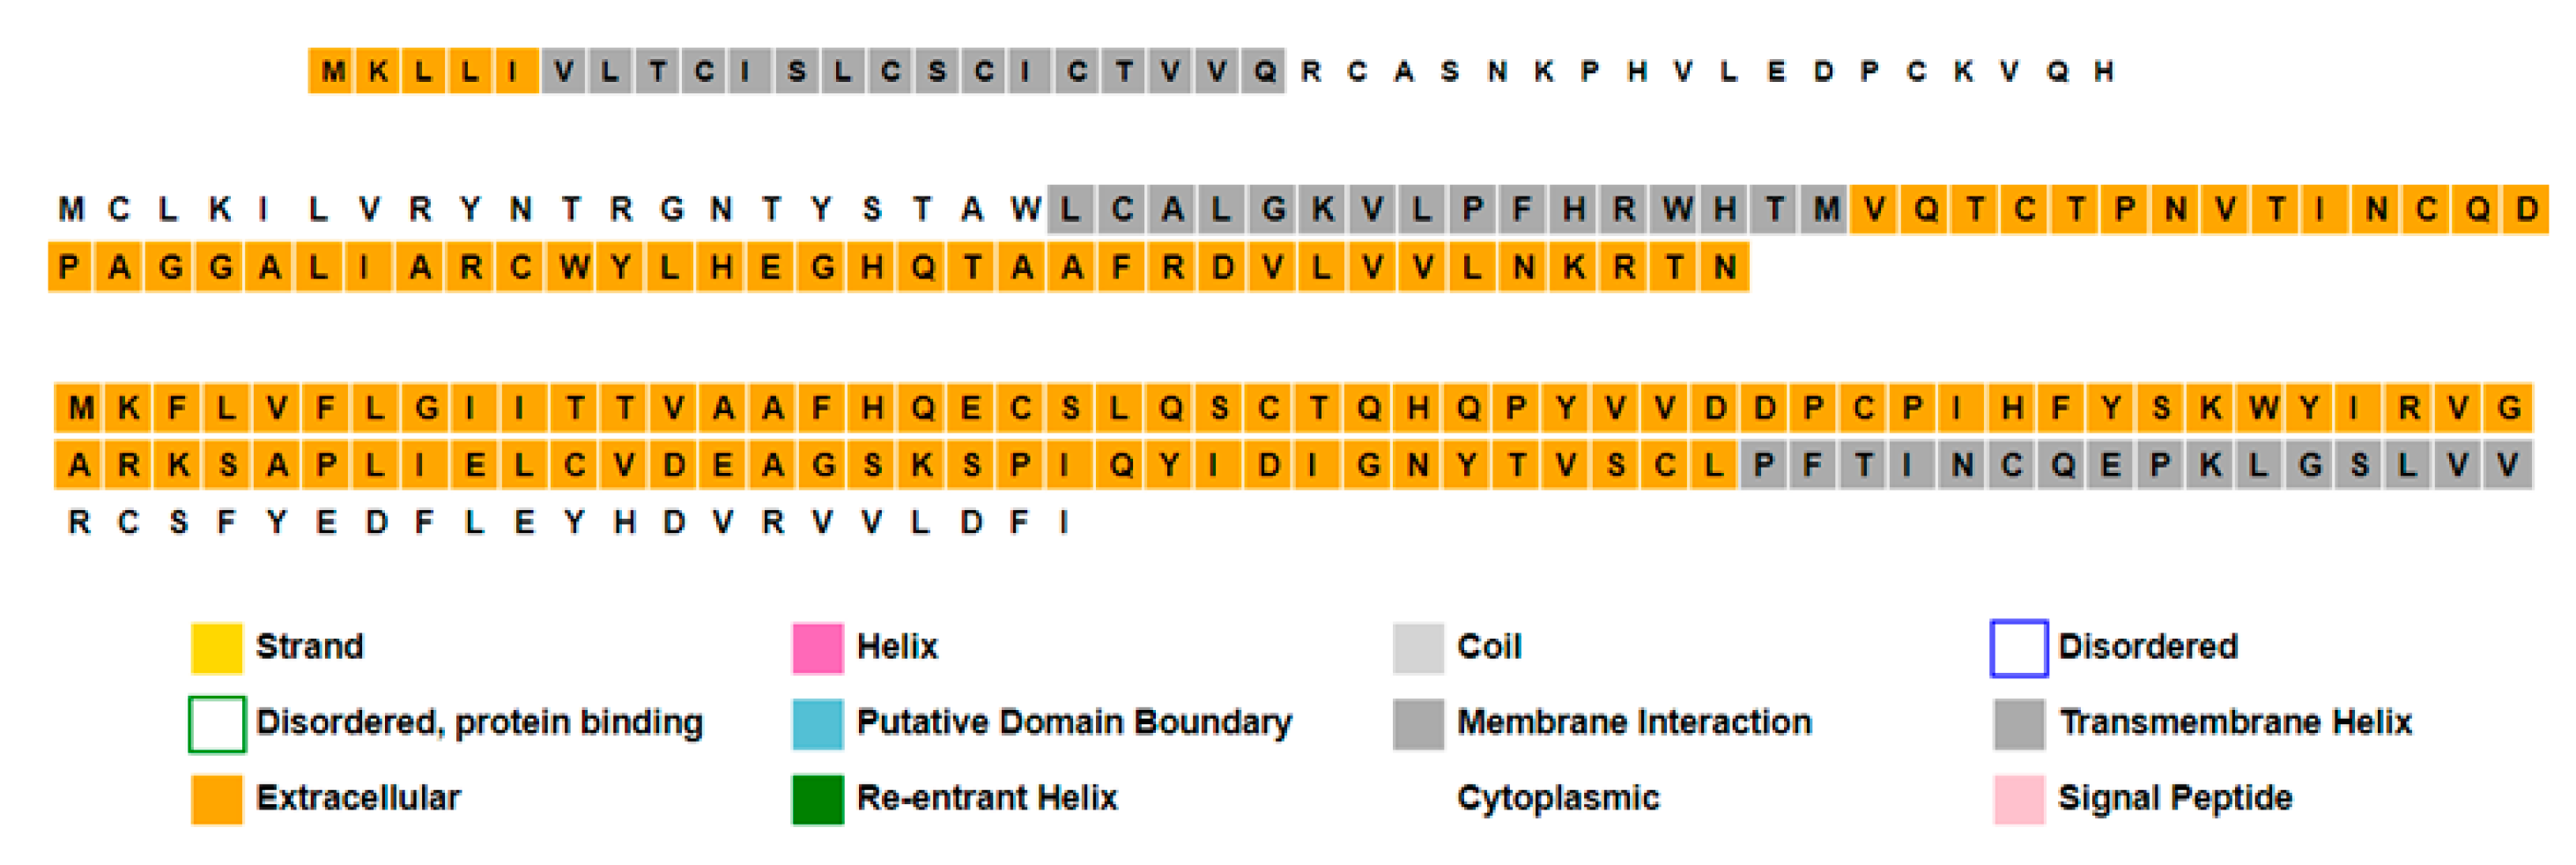
| Post-translational modifications (PTMs) and/or processing events | Feature key -Signal peptide -Chain | Position(s) 1–15 16–39 | Feature key -Chain | Position(s) 1–84 | Feature key -Signal peptide -Chain | Position(s) 1–15 16–121 |
| Structure | Nil | Nil | Nil | |||
| Family/Domains or motifs | Corona_NS8/EDPCP and INCQ | Corona_NS8/EDPCP and INCQ | Corona_NS8/EDPCP and INCQ | |||
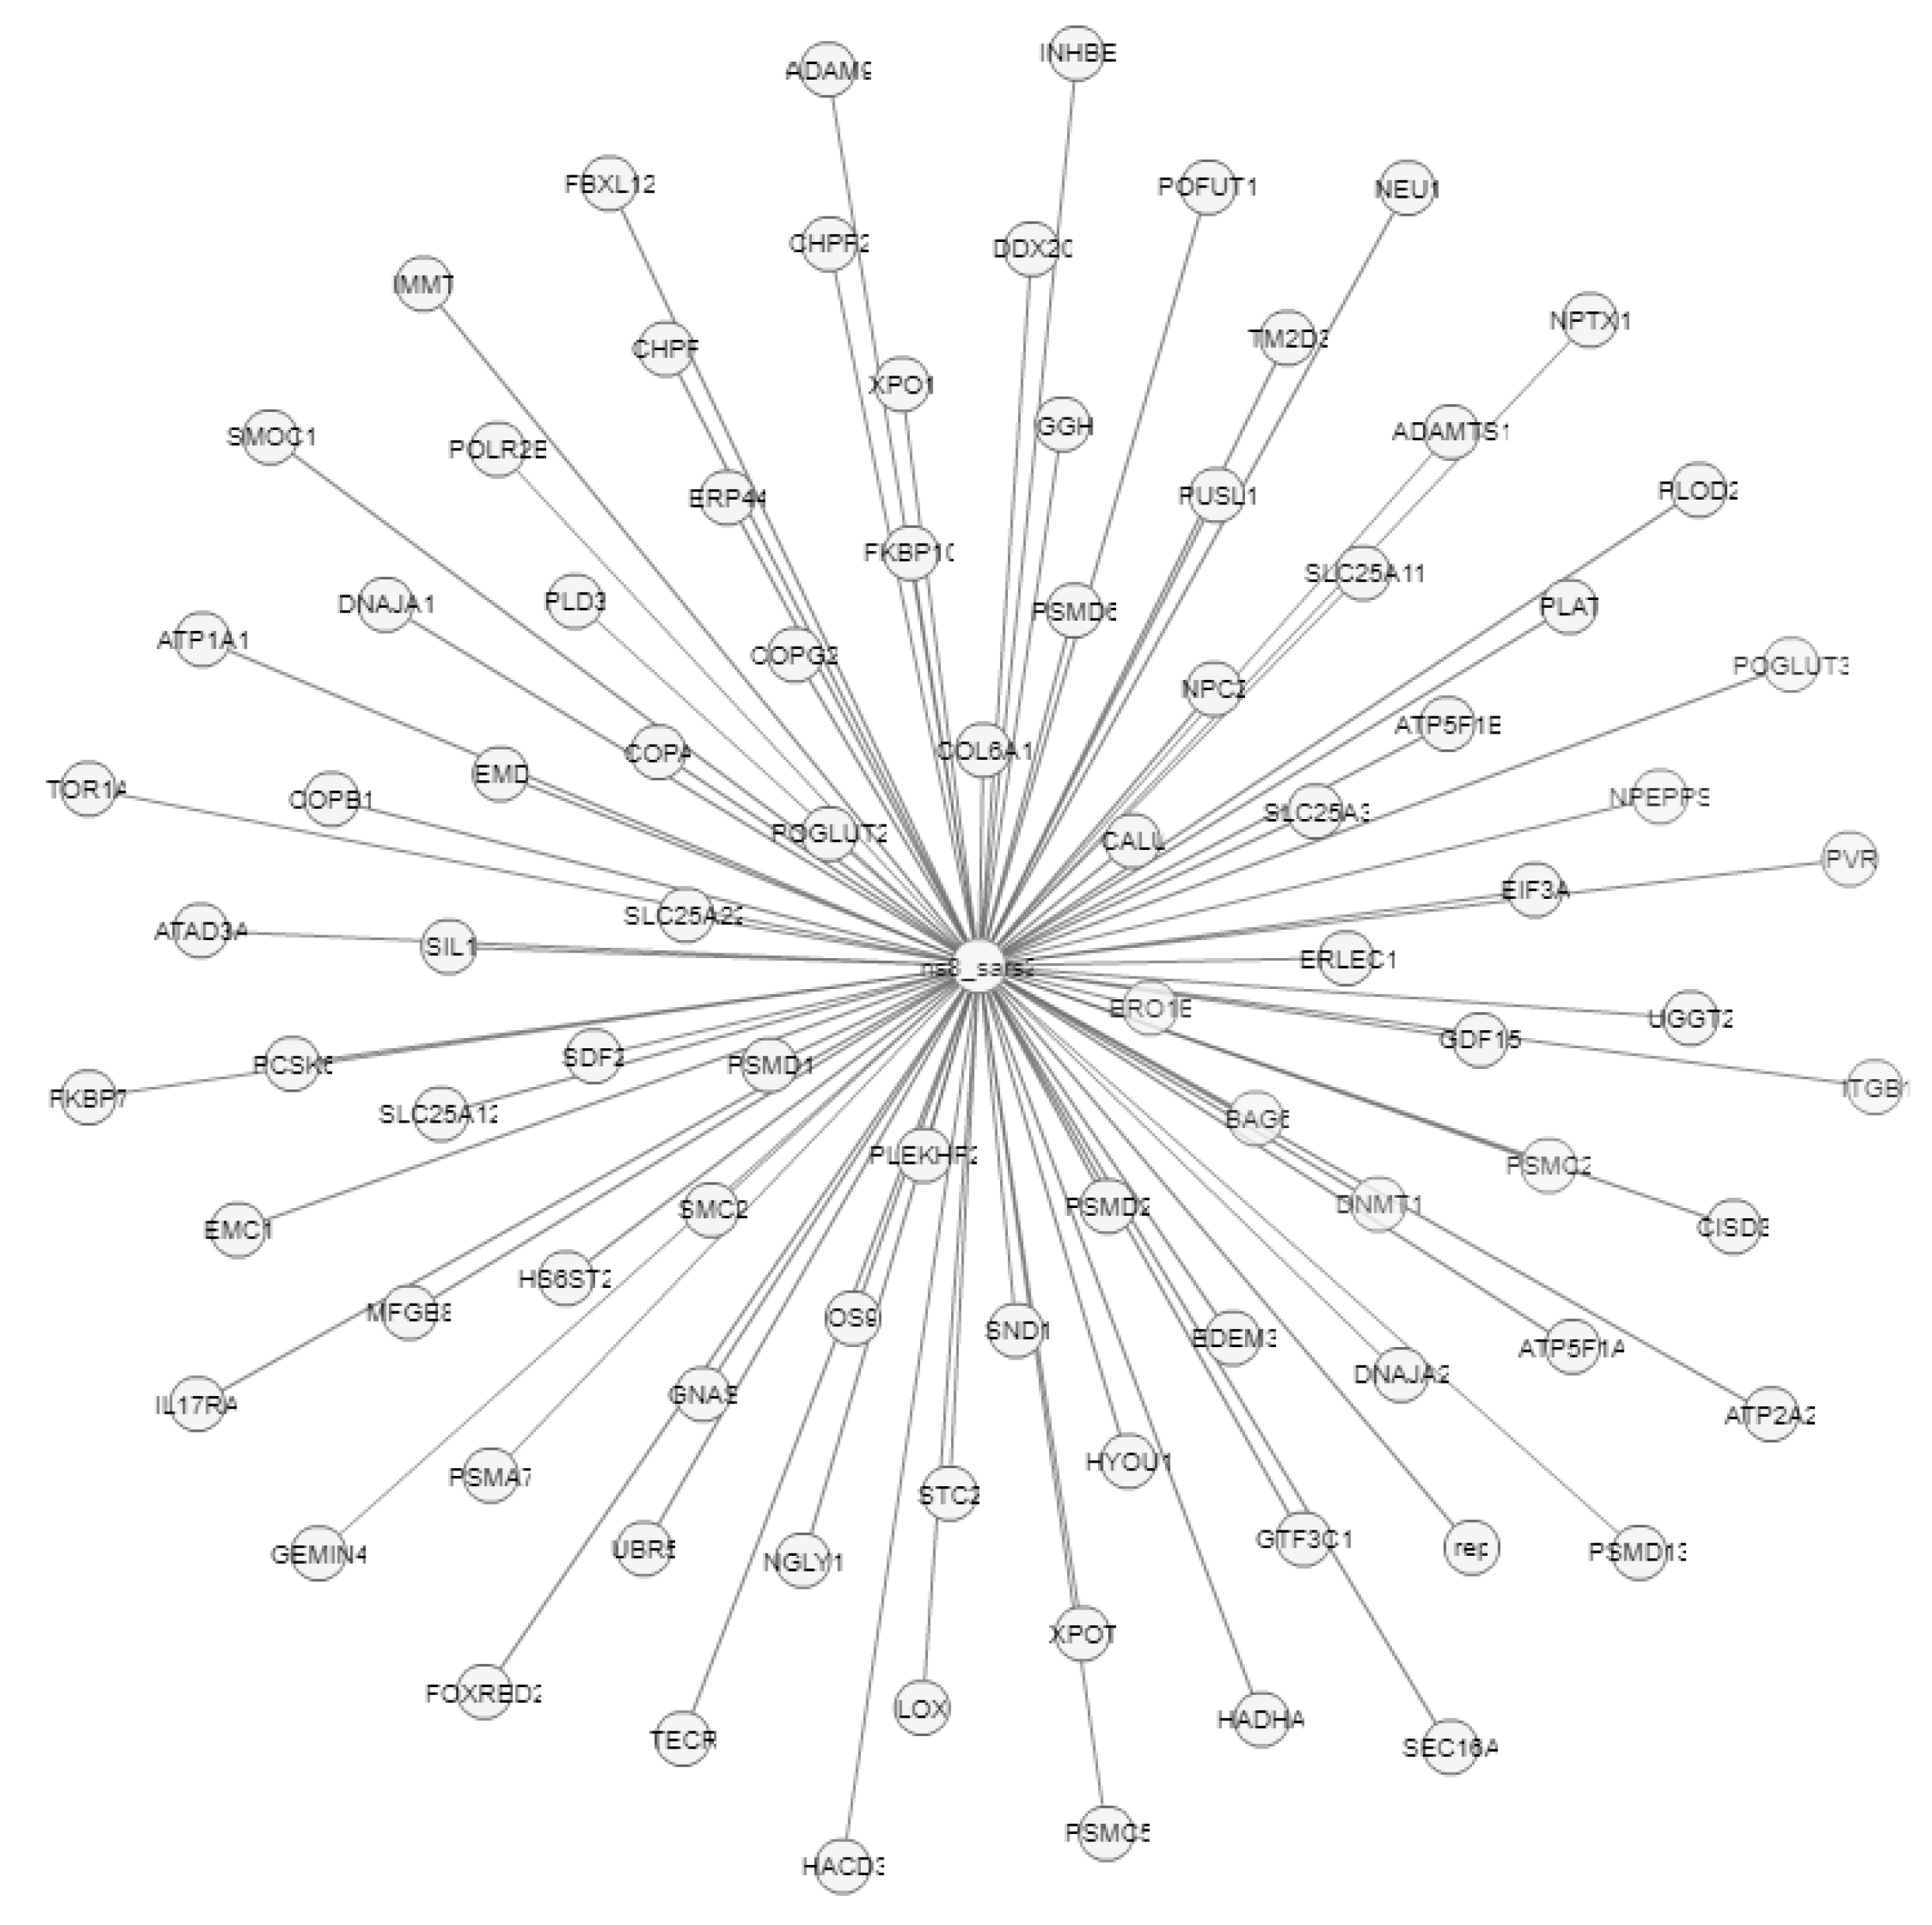
| Description of proteins’ family | This family of proteins includes the accessory proteins encoded by Orf8 in coronaviruses, also known as accessory protein 8, or nonstructural protein 8 (ns8). Proteins in this ns8 family are typically between 39 and 121 amino acids in length. This protein has two conserved sequence motifs: EDPCP and INCQ. It may modulate viral pathogenicity or replication in favor of human adaptation. ORF8 was suggested as one of the relevant genes in the study of human adaptation to the virus. This entry includes the NS8a and NS8b proteins from the human SARS coronavirus (SARS-CoV). | |||||
| Databases/Server | Orf8a | Orf8b | Orf8 |
|---|---|---|---|
| Function | |||
| Pfam database | Nonstructural proteins (8a, 8b, and 8, respectively). This family of proteins is functionally uncharacterized. This protein is found in coronaviruses. Proteins in this family are typically between 39 and 121 amino acids in length. This protein has two conserved sequence motifs: EDPCP and INCQ. | ||
| InterPro database | These proteins have two conserved sequence motifs: EDPCP and INCQ. They may modulate viral pathogenicity or replication in favor of human adaptation. ORF8 was suggested as one of the relevant genes in the study of human adaptation to the virus. | ||
| Conserved Domains database | Fast-evolving proteins in SARS-related CoVs, and a potential pathogenicity factor that evolves rapidly to counter the immune response and facilitate the transmission between hosts. | ||
PANDA server
|
|
|
|
| Prosite database | Predicted features: SIGNAL (1- 14) LIPID (15) N-palmitoyl cysteine LIPID (15) S-diacylglycerol cysteine | No feature predicted | No feature predicted |
| Subcellular Location | |||
| Virus-mPLoc server | - | Host cytoplasm. | Host cell membrane. Host endoplasmic reticulum. Host cytoplasm. |
| CELLO2GO server (Highest Localization Probability) | Extracellular | Extracellular | Plasmamembrane |
| Antigenicity (Threshold for this model: 0.4) | |||
| VaxiJen v2.0 | 0.1251 (Probable NONANTIGEN) | 0.5035 (Probable ANTIGEN) | 0.6502 (Probable ANTIGEN) |
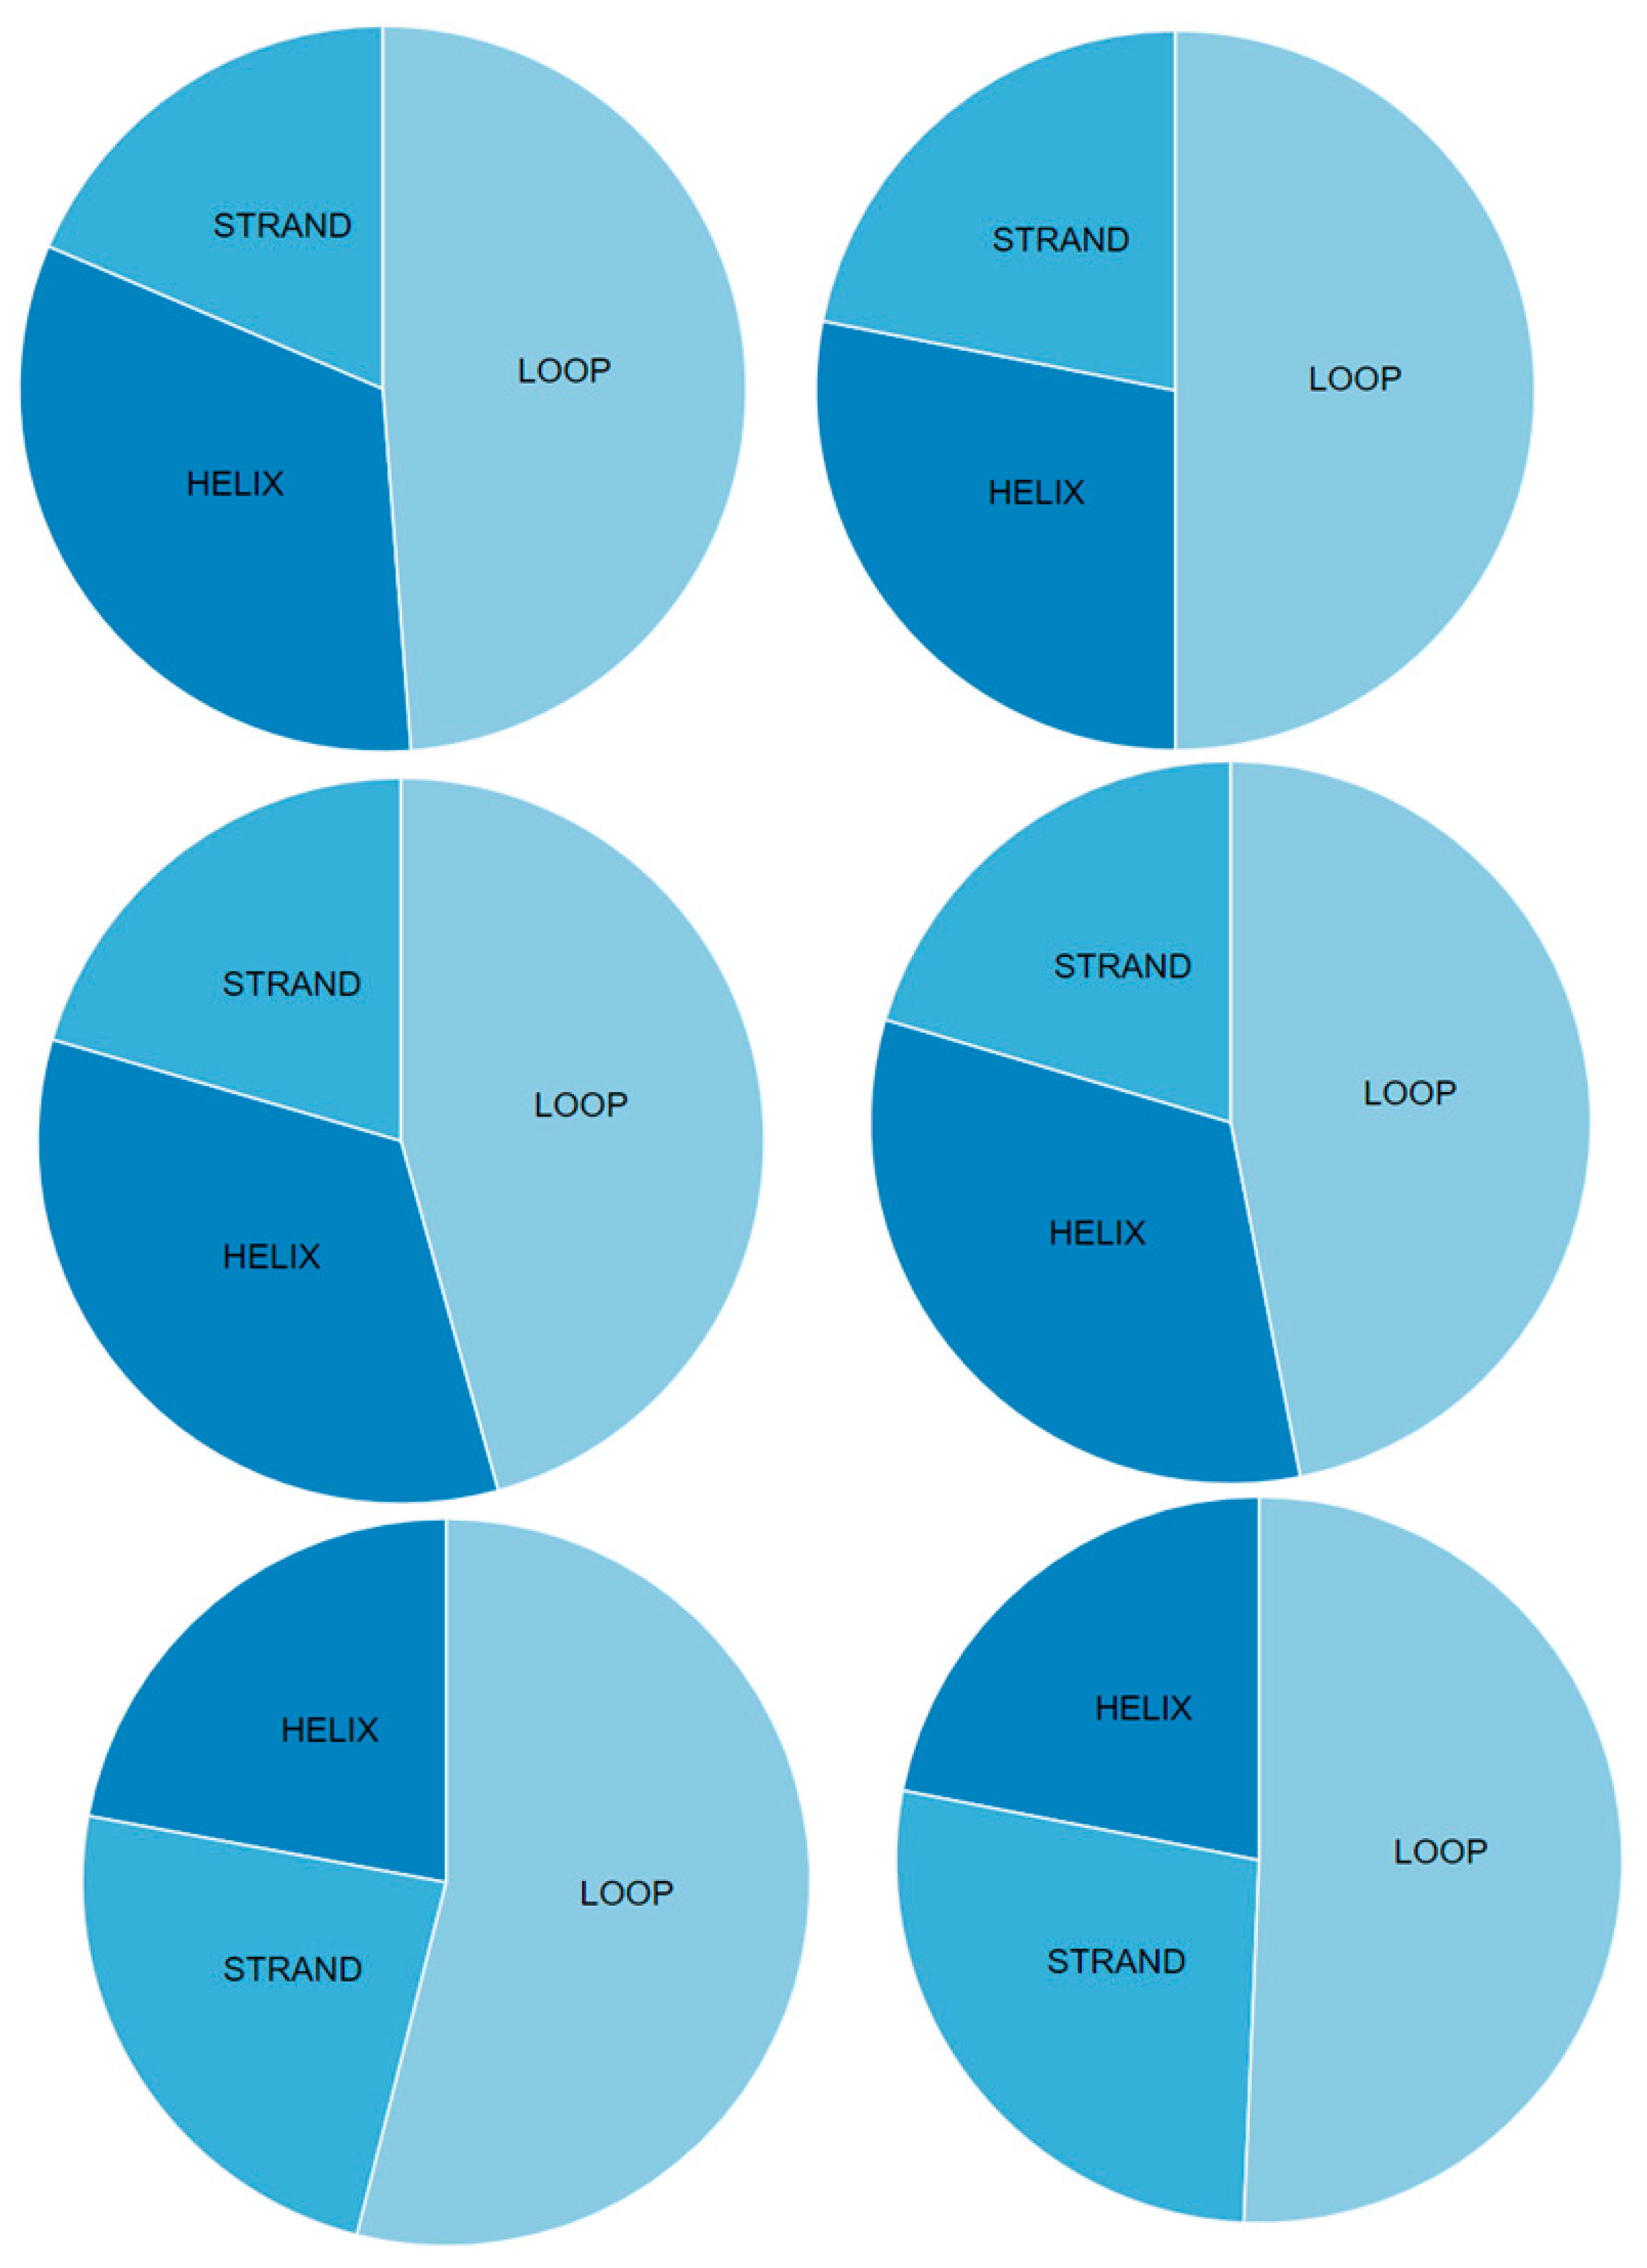
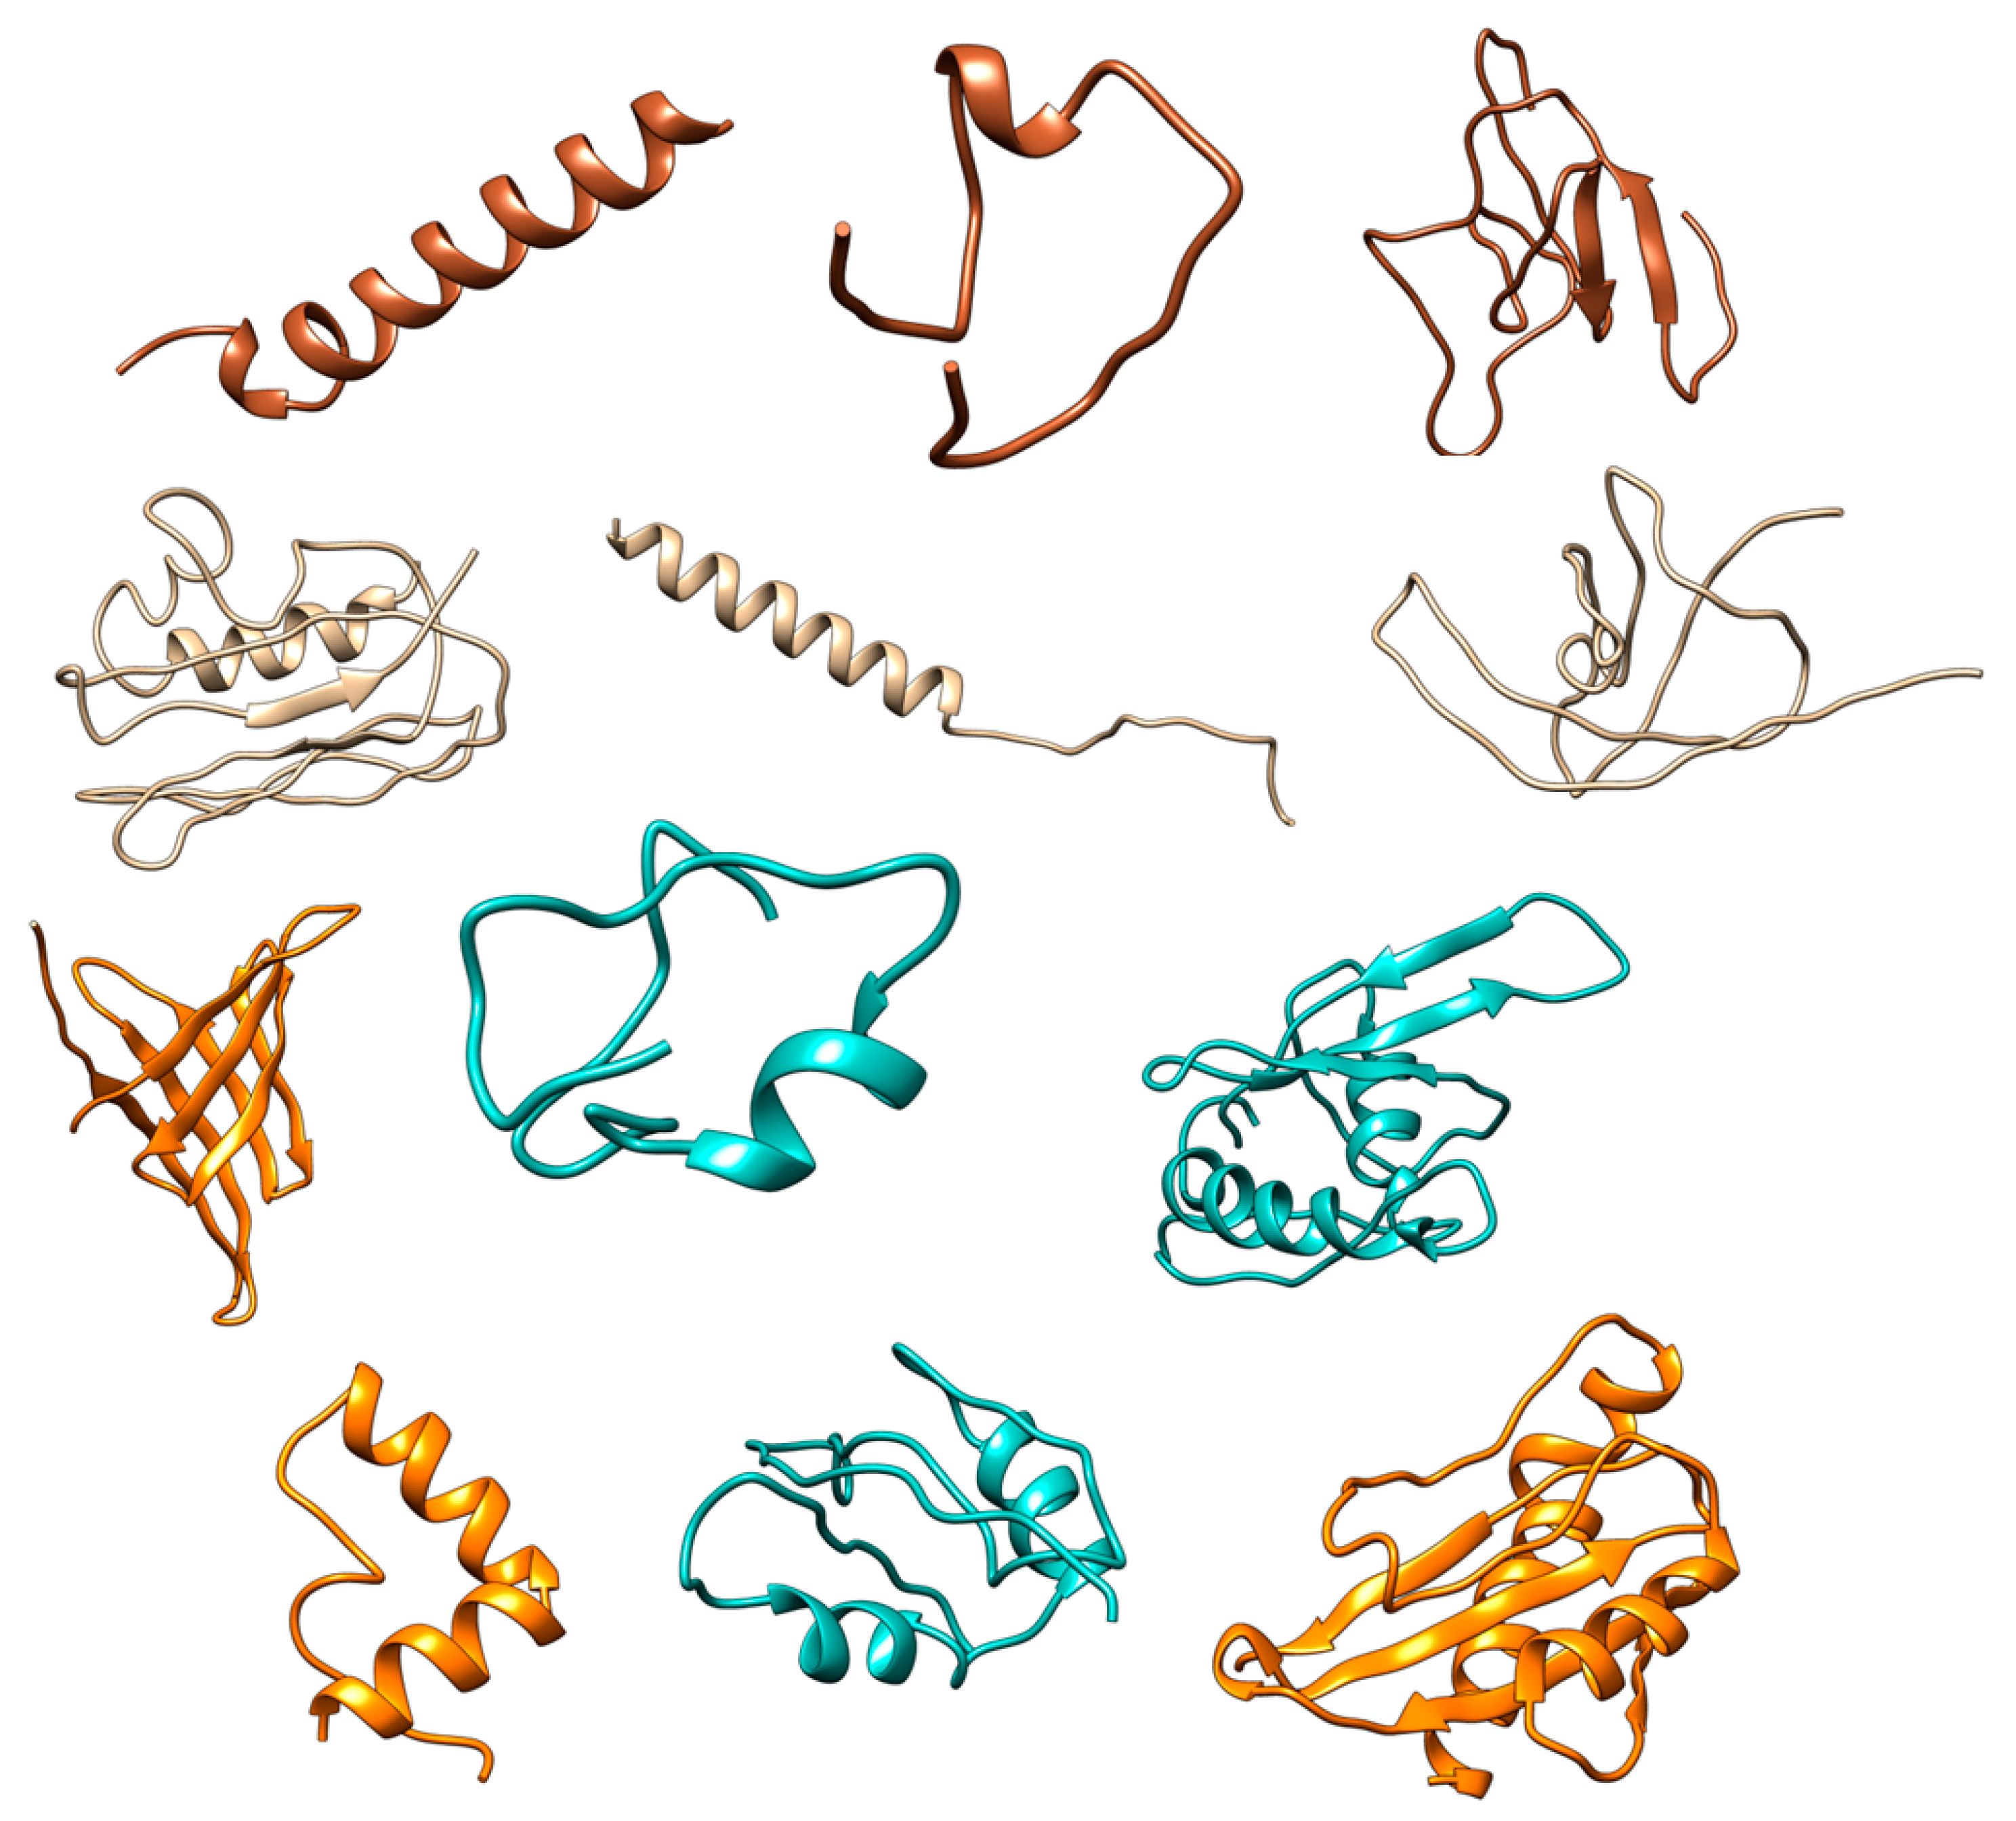
| Server Name | Structure | Chain | Helix% | Beta-Strand% | Turn% | Coil% | Protein Length | Overall Quality | Covalent Bond Quality | Non-Covalent/Packing Quality | Torsion Angle Quality |
|---|---|---|---|---|---|---|---|---|---|---|---|
| Swiss-Model | Orf8a | L | 73% | 0% | 13% | 27% | 30 | 3.5 | 5.5 | 3.5 | 3.5 |
| Orf8b | A | 0% | 26% | 15% | 74% | 26 | 2.5 | 6.5 | 3.5 | 2.5 | |
| Orf8 | A | 0% | 29% | 10% | 71% | 74 | 3.5 | 6.5 | 3.5 | 2.5 | |
| DMPfold | Orf8a | A | 56% | 0% | 10% | 44% | 39 | 3.5 | 5.5 | 3.5 | 3.5 |
| Orf8b | A | 5% | 41% | 4% | 54% | 84 | 2.5 | 3.5 | 2.5 | 2.5 | |
| Orf8 | A | 10% | 42% | 3% | 48% | 121 | 2.5 | 3.5 | 2.5 | 1.5 | |
| I-TASSER | Orf8a | A | 10% | 0% | 30% | 90% | 39 | 2.5 | 3.5 | 3.5 | 1.5 |
| Orf8b | A | 17% | 16% | 9% | 67% | 84 | 1.5 | 4.5 | 3.5 | 0.5 | |
| Orf8 | A | 20% | 26% | 9% | 54% | 121 | 2.5 | 4.5 | 3.5 | 1.5 | |
| Robetta | 3R | A | 69% | 0% | 10% | 31% | 39 | 5.5 | 6.5 | 6.5 | 4.5 |
| 7R | A | 0% | 66% | 14% | 34% | 84 | 5.5 | 7.5 | 6.5 | 4.5 | |
| 11R | A | 29% | 23% | 13% | 48% | 121 | 4.5 | 6.5 | 5.5 | 3.5 |
Disclaimer/Publisher’s Note: The statements, opinions and data contained in all publications are solely those of the individual author(s) and contributor(s) and not of MDPI and/or the editor(s). MDPI and/or the editor(s) disclaim responsibility for any injury to people or property resulting from any ideas, methods, instructions or products referred to in the content. |
© 2023 by the authors. Licensee MDPI, Basel, Switzerland. This article is an open access article distributed under the terms and conditions of the Creative Commons Attribution (CC BY) license (https://creativecommons.org/licenses/by/4.0/).
Share and Cite
Hussain, M.A.; Hassan, M.M.; Bashir, B.A.; Gamar, T.A.; Gasmalbari, E.; Mohamed, A.O.; Osman, W.; Sherif, A.E.; Elgaml, A.; Alhaddad, A.A.; et al. Potential Therapeutic Target and Vaccines for SARS-CoV-2. Pathogens 2023, 12, 926. https://doi.org/10.3390/pathogens12070926
Hussain MA, Hassan MM, Bashir BA, Gamar TA, Gasmalbari E, Mohamed AO, Osman W, Sherif AE, Elgaml A, Alhaddad AA, et al. Potential Therapeutic Target and Vaccines for SARS-CoV-2. Pathogens. 2023; 12(7):926. https://doi.org/10.3390/pathogens12070926
Chicago/Turabian StyleHussain, Mohamed A., Mohamed M. Hassan, Bashir Abdrhman Bashir, Tarig A. Gamar, Elmuaiz Gasmalbari, Ahmed Osman Mohamed, Wadah Osman, Asmaa E. Sherif, Abdelaziz Elgaml, Aisha A. Alhaddad, and et al. 2023. "Potential Therapeutic Target and Vaccines for SARS-CoV-2" Pathogens 12, no. 7: 926. https://doi.org/10.3390/pathogens12070926
APA StyleHussain, M. A., Hassan, M. M., Bashir, B. A., Gamar, T. A., Gasmalbari, E., Mohamed, A. O., Osman, W., Sherif, A. E., Elgaml, A., Alhaddad, A. A., Ghazawi, K. F., Miski, S. F., Ainousah, B. E., Andijani, Y. S., Ibrahim, S. R. M., Mohamed, G. A., & Ashour, A. (2023). Potential Therapeutic Target and Vaccines for SARS-CoV-2. Pathogens, 12(7), 926. https://doi.org/10.3390/pathogens12070926