Article

The Role of Dendritic Cells in the Host Response to Marek’s Disease Virus (MDV) as Shown by Transcriptomic Analysis of Susceptible and Resistant Birds

1
The Roslin Institute and R(D)SVS, University of Edinburgh, Easter Bush, Midlothian EH25 9RG, UK
2
Department of Medicine and Surgery, Faculty of Veterinary Medicine, Chattogram Veterinary and Animal Sciences University, Chattogram 4225, Bangladesh
3
Roslin Innovation Centre, Wobble Genomics, Easter Bush Campus, Midlothian EH25 9RG, UK
*
Author to whom correspondence should be addressed.
Deceased.
Pathogens 2022, 11(11), 1340; https://doi.org/10.3390/pathogens11111340
Submission received: 21 September 2022 / Revised: 8 November 2022 / Accepted: 10 November 2022 / Published: 13 November 2022

Abstract

:
Despite the successful control of highly contagious tumorigenic Marek’s disease (MD) by vaccination, a continuous increase in MD virus (MDV) virulence over recent decades has put emphasis on the development of more MD-resistant chickens. The cell types and genes involved in resistance therefore need to be recognized. The virus is primarily lymphotropic, but research should also focus on innate immunity, as innate immune cells are among the first to encounter MDV. Our previous study on MDV–macrophage interaction revealed significant differences between MHC-congenic lines 61 (MD-resistant) and 72 (MD-susceptible). To investigate the role of dendritic cells (DCs) in MD resistance, bone-marrow-derived DCs from these lines were infected with MDV in vitro. They were then characterized by cell sorting, and the respective transcriptomes analysed by RNA-seq. The differential expression (DE) of genes revealed a strong immune activation in DCs of the susceptible line, although an inherent immune supremacy was shown by the resistant line, including a significant expression of tumour-suppressor miRNA, gga-mir-124a, in line 61 control birds. Enrichment analysis of DE genes revealed high expression of an oncogenic transcription factor, AP-1, in the susceptible line following MDV challenge. This research highlights genes and pathways that may play a role in DCs in determining resistance or susceptibility to MDV infection.

1. Introduction

Marek’s disease (MD), caused by Gallid alphaherpesvirus 2, is an economically important tumorigenic, lymphotropic viral disease of chickens. The virus is commonly known as Marek’s disease virus (MDV). Although the virus is well-known for its association with lymphoid cells, MDV infection in other cells such as fibroblasts [1], EACs (ellipsoid-associated cells) [2] and phagocytes [3] has also been documented. Despite its oncogenic nature, MD is the first of its kind to be controllable by large-scale global vaccination programs [4,5,6]. However, the virulence of MDV has been increasing in recent decades, as the current MDV vaccines do not induce sterile immunity, but only protect chickens from developing tumours [7,8]. With the continuing evolution of MDV virulence, it is increasingly important to identify the genes responsible for exerting resistance to MD, and to explore the cell types in which this phenotype is expressed. This will allow for the selection and breeding of more resistant chickens.
Among the antigen-presenting cells (APCs), dendritic cells (DCs) efficiently present antigens to T cells, and thus play a crucial role in the initiation of adaptive immune responses. Because MDV infection is strictly cell-associated, T-cell-mediated immunity is likely to play a more significant role than humoral immunity [9]. Research on MDV pathogenesis has largely been focused on T cells due to the lymphotropic nature of MDV, and information regarding the roles of macrophages and DCs in MDV pathogenesis is very limited [10]. Nonetheless, DCs are the least-studied cells regarding MDV infections in chickens, and therefore require further examination. Moreover, there is still a lack of knowledge regarding the type and function of DCs in the initiation of adaptive immune responses such as the presentation of MDV antigen and the priming of T cells by DCs in chickens [10].
Immune cells such as phagocytes as well as B and T cells are infected by MDV during different stages of its life cycle [11], and the resistance signatures can be expressed in any or all of these cells. Among the immune cells, B and T cells can be readily infected with MDV under both in vivo and in vitro conditions. However, it is important to examine MDV–phagocyte interactions, as macrophages/DCs are the innate immune cells with which MDV first interacts. The MDV infection of DCs has not been described in vivo, perhaps due to the difficulty in isolating adequate numbers of DCs for downstream analysis following MDV infection. To overcome the problems of in vivo MDV–DC (or phagocyte) infection studies, an in vitro infection model was developed [3] and chicken bone-marrow-derived DCs (BMDCs) were generated and characterized from outbred chickens using a previously described protocol [12]. Using this model in an earlier experiment, we infected bone-marrow-derived macrophages (BMDMs) from MD-resistant (line 61) and MD-susceptible (line 72) chickens and conducted a transcriptomic analysis [13]. These two inbred chicken lines are exceptional in the sense that, despite sharing the same MHC haplotype, they exhibit very different phenotypes with regard to MDV resistance [14,15]. This highlights the role of non-MHC genetics in this disease resistance. To complement and add to this previous study, BMDCs from lines 61 and 72 were infected with MDV-infected CEFs (chicken embryo fibroblasts) and characterized by FACS (fluorescence-activated cell-sorting) and RNA-seq. Transcriptomic analysis was carried out with the aim of exploring the role of DCs pre- and post-MDV infection in vitro.

2. Materials and Methods

2.1. Experimental Birds

Specific-pathogen-free (SPF) chickens from inbred research lines 61 and 72 [16] were used in this study. Line 61 birds were bred in the Poultry Production Unit at the Institute for Animal Health, Compton, UK and reared in the poultry unit of The Moredun Research Institute, Edinburgh, UK, while line 72 chickens were bred and reared at the National Avian Research Facility (NARF), Edinburgh, UK. For chicken embryos, chicken layer line J was used (an intercross from 9 lines, originally bred from Brown Leghorn chickens at the Poultry Research Centre, Edinburgh). They were bred and conventionally raised at the NARF.

2.2. Marek’s Disease Virus

The virus used in this study was CVI988 UL41 eGFP and it was generated from a BAC construct of vaccine strain CVI988 (Rispens) of MDV serotype 1, in which the UL41 gene was replaced with eGFP (enhanced green fluorescent protein) under the control of the murine phosphoglycerol kinase promoter [17]. The presence of eGFP indicates MDV replication. MDV replication is independent of UL41 deletion, as mutant strains replicate as well as the parental strain in culture [18].

2.3. Cell Cultures

Initially 12–15 chicken embryos of 9–11 days old were used to collect chicken embryo fibroblasts (CEFs). The CEFs were cultured in T175 flasks as described previously [13]. The MDV-BAC virus was initially grown and propagated in CEF cultures [19]. Isolation of chicken bone marrow cells was carried out from 3–6-week-old birds and BMDCs were cultured as per the standard method [12]. In order to obtain approximately 1 × 10⁷ BMDCs at harvest on day 4 of culture, bone marrow cells were seeded at a concentration of approximately 1.2 × 10⁶ cells/mL. Cells were cultured in T75 flasks at 41 °C with 5% CO2 using RPMI-1640 medium supplemented with 10% heat-inactivated chicken serum (CS), 1% L-glutamine and 0.1% pen-strep. Recombinant chicken interleukin-4 (chIL-4) and granulocyte-macrophage colony stimulating factor (chCSF-2 or GM-CSF) [12] were added to the BMDC culture and medium was refreshed every 2 days.

2.4. Co-Culture Infection Experiments and FACS (Fluorescence-Activated Cell Sorting)

Virus-infected CEFs were used to infect BMDCs because MDV is strictly cell-associated in culture. Co-culture infection experiments and FACS were performed as described previously [13] with the exception that the BMDCs were infected with sorted MDV-infected CEFs on day 4 of culture at an infection ratio of 1:2.5 (CEF:BMDC) in RPMI-1640 medium containing 10% FBS (Gibco), 1% pen-strep and 1% L-glutamine. Co-cultured cells were incubated at 41 °C with 5% CO2 for 1 day, and then harvested for downstream experiments.

2.5. Cell and Sample Preparation for RNA-Sequencing (RNA-seq)

Control and infected BMDCs from inbred chicken lines 61 and 72 were sorted at 1 dpi based on eGFP and CD45 expression as described previously [13]. RNA was extracted using RNeasy Mini Kits (Qiagen, Manchester, UK), and DNase treatment of RNAs was carried out with Ambion Turbo DNA-free kits (Life Technologies, Paisley, UK). RNA quantification was performed using Qubit RNA Assay kit with the Qubit 2.0 Fluorometer (Invitrogen, Inchinnan, UK). Three separate biological replicates for each of the control and infected BMDCs were used for RNA preparation and subsequent sequencing.

2.6. RNA-seq and Analysis

RNA sequencing was performed by the Edinburgh Genomics sequencing facility (Edinburgh, UK) using a pool of individually barcoded RNA samples representing 3 biological replicates for each of the control and infected BMDCs. Paired-end sequencing (125 bp reads) was carried out on an Illumina HiSeq 2500 platform using an Illumina TruSeq Rapid SBS Kit (Illumina, Little Chesterford, UK). The quality of the RNA-seq reads was evaluated using the software FastQC [20]. Adapter sequences (Illumina TruSeq v3 adapters) were trimmed from the FASTQ sequences using Cutadapt software (v1.6) [21] with a minimum length cut-off at 50 bp. Trimmed reads were analysed to explore the differentially expressed (DE) genes in MDV-infected and control BMDCs. The data analysis pipeline included the following steps: The short reads were aligned to the chicken reference genome sequence (Galgal4, Ensembl release 78) using Bowtie and TopHat software packages [22]. Following alignment of the RNA-seq reads, HTSeq-count was used to calculate counts per million (CPM) for each gene [23]. The differential gene expression was then analysed using edgeR (empirical analysis of digital gene expression in R) software [24]. Differentially expressed genes (DEGs) were filtered using an FDR (false discovery rate) of 0.05 and fold change (FC) > 2. Viral transcript expression was measured by mapping reads to the CVI988 MDV genome (Accession: DQ530348) using STAR [25] with default options, except we scaled down --enomeSAindexNbases to 7, as suggested, due to the small size of the viral genome. Mapped reads were counted using featurecounts [26]. The mapping statistics was summarized to assess the number of reads mapped to the viral gene. Expression is detailed as transcripts per million (TPMs). Differential expression comparisons were performed using DESeq2 [27].

2.7. In Silico Functional Analysis of DE Genes

Ingenuity Pathway Analysis (IPA) software (Qiagen—https://digitalinsights.qiagen.com/products-overview/discovery-insights-portfolio/analysis-and-visualization/qiagen-ipa/ (accessed on 27 September 2021)) was used to reveal biological pathways and functions pertaining to the DEGs identified in our analyses. P-values were calculated using the right-tailed Fisher Exact Test (threshold p < 0.05). Enriched pathways, gene ontologies, miRNA targets and transcription factor binding sites were identified using WebGestalt (WEB-based GEne SeT AnaLysis Toolkit) algorithms (http://www.webgestalt.org/ (accessed on 28 September 2021)) [28]. Over-representation analysis (ORA) was carried out using the network functional database to identify both transcription factor and miRNA targets. The ‘chicken genome’ was used as the background reference. Results showing an FDR < 0.05 were considered significant. gProfiler (https://biit.cs.ut.ee/gprofiler/gost (accessed on 5 October 2021)) [29] provided functional analysis of the host responses in each line. DEGs were examined as an ordered list and queried against the Gallus gallus background reference.

2.8. Determination of Potential MDV QTL Candidate Genes

The BioMart data mining tool within the Ensembl database (release 78) (http://www.ensembl.org/index.html) was used to identify differentially expressed genes located in genomic regions previously identified as being under QTLs for MDV resistance [30,31] (Supplementary File S1).

3. Results

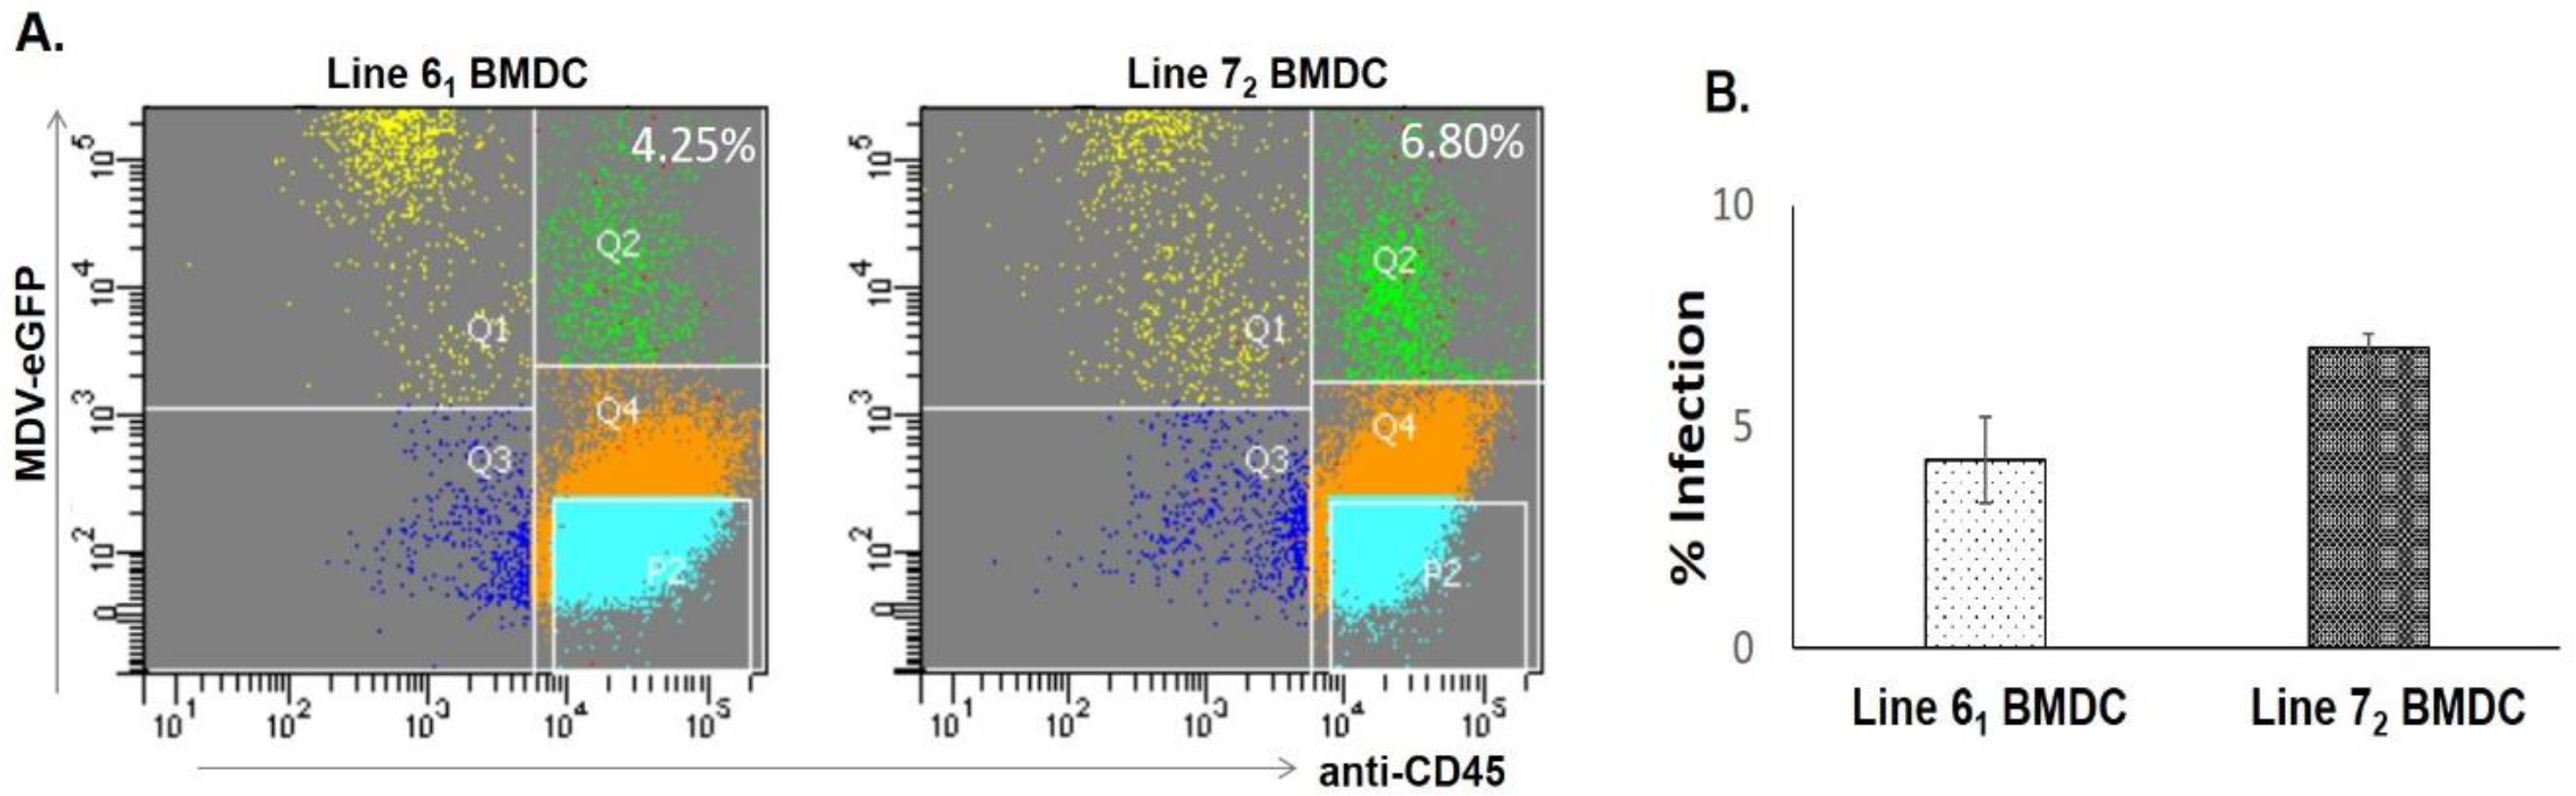
3.1. BMDC Infection in Resistant and Susceptible Lines

Pre-sorted MDV-infected CD45-eGFP+CEFs were co-cultured with chicken BMDCs from the two inbred lines (61 and 72), and analysis of BMDCs expressing CD45 and eGFP during co-culture cell sorting experiments on 1 dpi revealed that the average proportion of infected DCs was 1.6% higher in line 72 (MD-susceptible; 6.8%) than in line 61 (MD-resistant; 4.25%) (Figure 1A). The means and respective standard errors of the mean (SEMs) of the percentages of infected cells from four independent experiments are shown in Figure 1B.

3.2. Analysis of Gene Expression in BMDCs of Resistant and Susceptible Lines

Analysis of RNA-seq data was carried out to explore differences in gene expression in control and infected BMDCs from the two inbred lines. The infected BMDCs were purified using flow sorting based on the expression of eGFP-MDV and CD45. Comparisons were made as follows: (1) Control BMDCs (line 61) vs. control BMDCs (line 72)—to see which genes were inherently differentially expressed between susceptible and resistant birds. (2) Control BMDCs vs. infected BMDCs for both lines 61 and 72—to define the host response to infection in each line of birds. (3) (Infected BMDCs − control BMDCs) from line 61 vs. (infected BMDCs − control BMDCs) from line 72—to examine differences in host response to MDV infection between susceptible and resistant birds. The numbers of significant DEGs (FDR < 0.05; FC > 2) used for downstream functional analyses are provided in Table 1. The full lists of DEGs in BMDCs from lines 61 and 72 are provided in Supplementary File S2.

3.3. Inherent Differences Exist between the Two Inbred Lines

In order to compare basal gene expression in each line, control birds were compared. An almost equal number of genes were differentially expressed in each line prior to infection (477 genes were more highly expressed in line 61 and 478 genes were higher in line 72) (Supplementary File S2). However, a different immune-related gene profile was seen in line 61 (MD-resistant) compared to line 72 (MD-susceptible). Genes more highly expressed in line 61 included interleukins, interleukin ligands, receptors and accessory proteins (IL8, IL8L1, IL13RA1, IL13RA2, IL20RA, IL1RAPL2H1), CD antigen genes (CD200, CD109, CD2), chemokine ligand CCL4, tumour necrosis factor (TNF) receptor-associated factors (TRAF1, TRAF2 and TRAF3) and TNF superfamily member TNFSF13B. Other genes included interferon alpha-inducible proteins (IFI6 and IFI27L2), the interferon regulatory factor IRF1, the myxovirus resistance gene (MX1), the avidin gene (AVD), the lysozyme gene (LYZ), inducible nitric oxide synthase (INOS) and the basic leucine zipper ATF-like transcription factor 3 gene (BATF3). Among the highly expressed DEGs in line 72, genes with known immune functions included some interleukins, chemokine ligands and receptors (IL12B, IL1R2, IL15, CCL17, CXCR4), a couple of TNF receptor superfamily members (TNFRSF18, TNFRSF25H), Toll-like receptor gene TLR7, the beta defensins AvBD1 and AvBD2 and other CD antigen genes (CD200R1L, CD300L-S1, CD300LG, CD14, CD3D, CD3E, CD1A1, CD247, CD83, CD244, CD80). Hence, there were inherent differences between the two lines with regard to immune gene expression.

3.4. Host Response to MDV Infection in Susceptible Birds

In the MD-susceptible line (72), 843 genes were upregulated and 678 genes were downregulated compared to control during the host response against MD (Supplementary File S2). Downregulated immune genes were low in number, consisting of only a few interleukins and chemokines (IL15, IL1R2, IL1RAPL2HI, CCL17, CXCR4); a couple of TLRs (TLR4, TLR7); one TNF gene (TRAF3IP3); some interferon regulatory genes (IRF2BP2, IFNGR2, SOCS2) and CD79B. Contrarily, many immune-related genes were upregulated, including several interleukins and chemokines (IL6, IL16, IL23R, IL2RA, IL13RA2, IL18RAP, CCL19, CCL20), TLR3, TNFs (TNFAIP2, TNFAIP6, TNFSF10, TNFRSF8, TNFRSF10B, TNFRSF11B, TRAF1, TRAF3, TRAF3IP2), genes involved in controlling the interferon response (IFIT5, IFITM3, IFITM5, IRF1, IRF10, IFI6, IFI27L2, IFNW1, STAT1, STAT2, SOCS7) and some other immune-related genes (INOS, GZMA, MX1, NFκBIZ). This indicates a strong immune response against MDV in the susceptible birds.

3.5. Host Response to MDV Infection in Resistant Birds

After MDV challenge, 760 genes were upregulated and 722 genes were downregulated in line 61 (MD-resistant) (Supplementary File S2). Among them, a few immune-related genes were highly expressed, whereas the expression of several immune genes decreased. Immune genes with lower expression included interleukins and their receptors (IL1B, IL8, IL1RL1, IL10R2, IL20RA and IL1RAPL2H1), chemokines and their receptors (CCR2, CCR7, CCL4, CCL17, CCL26, CXCL1, CXCL14), Toll-like receptors (TLR1A, TLR1B, TLR15), some TNF genes (TNFSF13B, TNFRSF6B, TNFRSF11A, TRAF3IP3), interferon regulatory genes (IRF5, IRF8, IRF2BP2, IRF2BPL, IFNGR2), the suppressor of cytokine signalling genes (SOCS1, SOCS2, SOCS3) and some other immune-related genes, such as AVD, LYZ, AMIGO2, CD79B, CHIR-B2 and TGFB1. In contrast, only a few immune-related genes were upregulated in this line during the response to MDV. These included a couple of TNF superfamily members (TNFSF15, TNFRSF108), some interferon regulatory genes (IRF4, IFIT5, IFNW1, IFI6, SOCS7) and the IL23R interleukin receptor. This suggests that the more resistant birds do not need to mount as robust an immune response to MDV as their more susceptible counterparts. Indeed, the suppression of such genes would prevent an inappropriate and excessive inflammatory response, which is often the main reason for the pathology seen in the host.

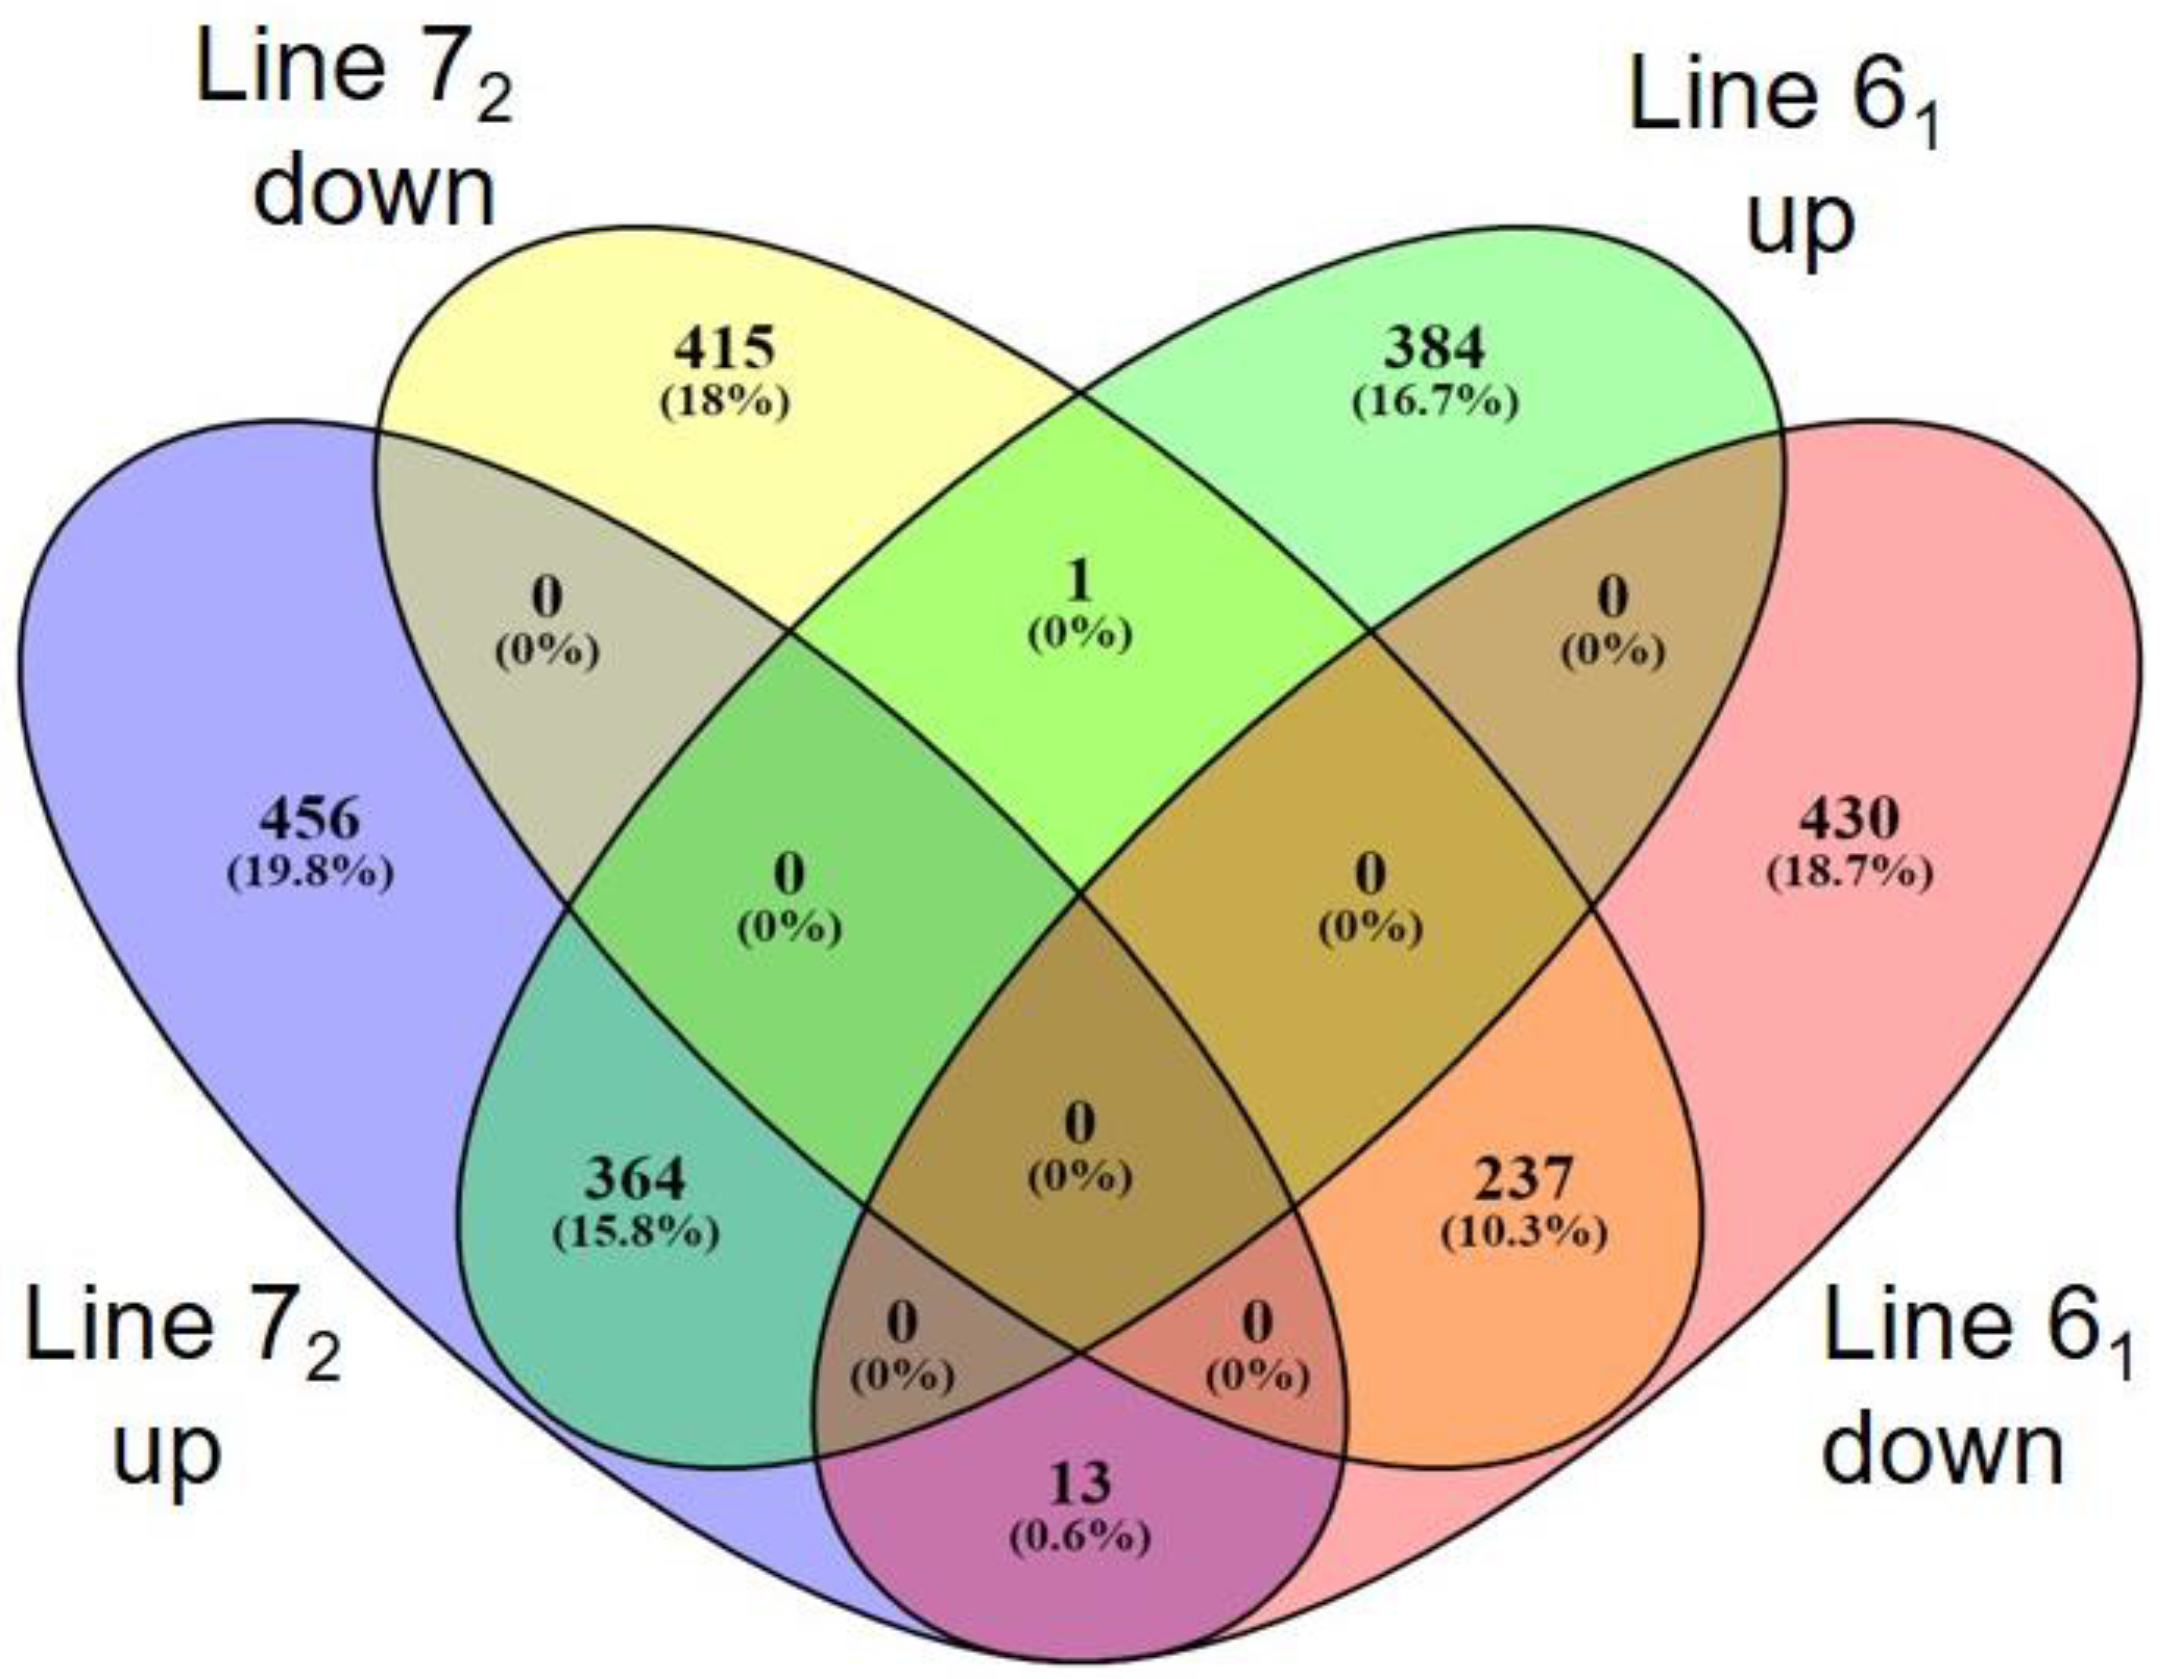
3.6. Comparison of Host Response to Infection between the Two Lines

There were differences in gene expression levels between BMDCs from the two lines after infection (317 DEGs were highly expressed in line 61 and 668 DEGs were expressed at a higher level in line 72) (Supplementary File S2). In the resistant line (61), the upregulated immune genes were few in number, and included ILIRAPL2H1, a couple of TNFs (TNFSF11, TNFSF15), chicken immunoglobulin-like receptors and adhesion molecule (CHIR-B2, CHIR-IG1-5, CHIR-AB-600, AMIGO2).
On the other hand, genes more highly expressed in the susceptible line (72) included several interleukins and interleukin receptors (IL1β, IL6, IL1RL1, IL22RA1, IL17RE, IL17RC); chemokines (CCL1, CCL17, CCL26, CX3CL1, CXCL12, CXCL14); TLRs (TLR2H, TLR21); a number of TNFs (TNFAIP2, TNFAIP6, TNFSF10, TNFRSF6B, TNFRSF11B, TNFRSF25H, TRAF3IP3); various interferon controlling genes (IFI6, IRF7, IFITM5, SOCS1, SOCS2, SOCS3); a few other immune-related genes (JAK3, GZMA, INOS); B-cell linker gene (BLNK); and transforming growth factor beta genes (TGFB1 and TGFB2).
Hence, disparity in the upregulation of immune genes was identified between resistant and susceptible lines following MDV infection. The distinctive nature of each response can be visualized in the Venn diagram shown in Figure 2. In line 72, 456 genes were uniquely upregulated and 415 down, while in line 61, 384 genes were upregulated only in this line and 430 were uniquely downregulated. Thirteen genes (ACSL6, ADAM12, ADAMTS15, ADAMTSL1, CD72AG, COL6A3, CSPG4, FSCN1, PTGS2, LOC101749645, PRDM8, TNFAIP6 and TNIP3) saw their expression increase in line 72 while being downregulated in line 61. Only 1 gene (GNAI1) was seen to show increased expression in line 61 while showing reduced expression in line 72.

3.7. Expression Profiles of MicroRNAs

MicroRNAs (miRNAs) are small, non-coding RNAs that regulate gene expression by directing them for translational repression or degradation [32]. Although samples were not specifically sequenced to capture small RNAs, some miRNAs have been identified as being differentially expressed in our study. Looking at inherent gene expression in control birds, we see that gga-mir-1797 was more highly expressed in line 72, whereas gga-mir-22 expression was higher in line 61. Upon infection, gga-mir-3064 and gga-mir-6690 were downregulated in line 61. In line 72, gga-mir-3523 was upregulated in response to virus while expression of gga-mir-1618, gga-mir-3064 and gga-mir-34a was decreased. Comparison of expression between the lines after infection demonstrates that gga-mir-3064 and gga-mir-6690 were more highly expressed in susceptible birds (72), and gga-mir-22 showed greater expression with the more resistant phenotype (61). Although the function of these miRNAs is largely unknown, it is interesting to note that mir-22, which has been associated with tumour-suppressor activity [33], was more highly expressed in line 61 while expression of another tumour-suppressor, gga-mir-34a, was decreased in line 72.

3.8. Viral Gene Expression

Viral gene expression after infection in lines 61 and 72 was determined, and is presented as transcripts per million reads in Supplementary File S3. The small number of reads seen in control samples were background. A high level of viral expression was seen in the infected samples. Differences in the expression of the viral transcripts in each of the two lines are shown in Supplementary File S4. The expression of viral transcripts varied between the two lines, with some transcripts found to be present at up to four times higher levels in line 72 as compared to line 61, although some transcripts were more highly expressed in line 61 (with regard to TPM values). The average TPM value was 1.1 for line 72/line 61, which reflects the cell-sorting results. It would therefore appear that similar numbers of dendritic cells became infected in the two lines, and there were also similar levels of viral gene expression. This would indicate that the difference in host response to MDV infection in dendritic cells is due to how the cells respond to infection and not to differences in viral infection in the cell.

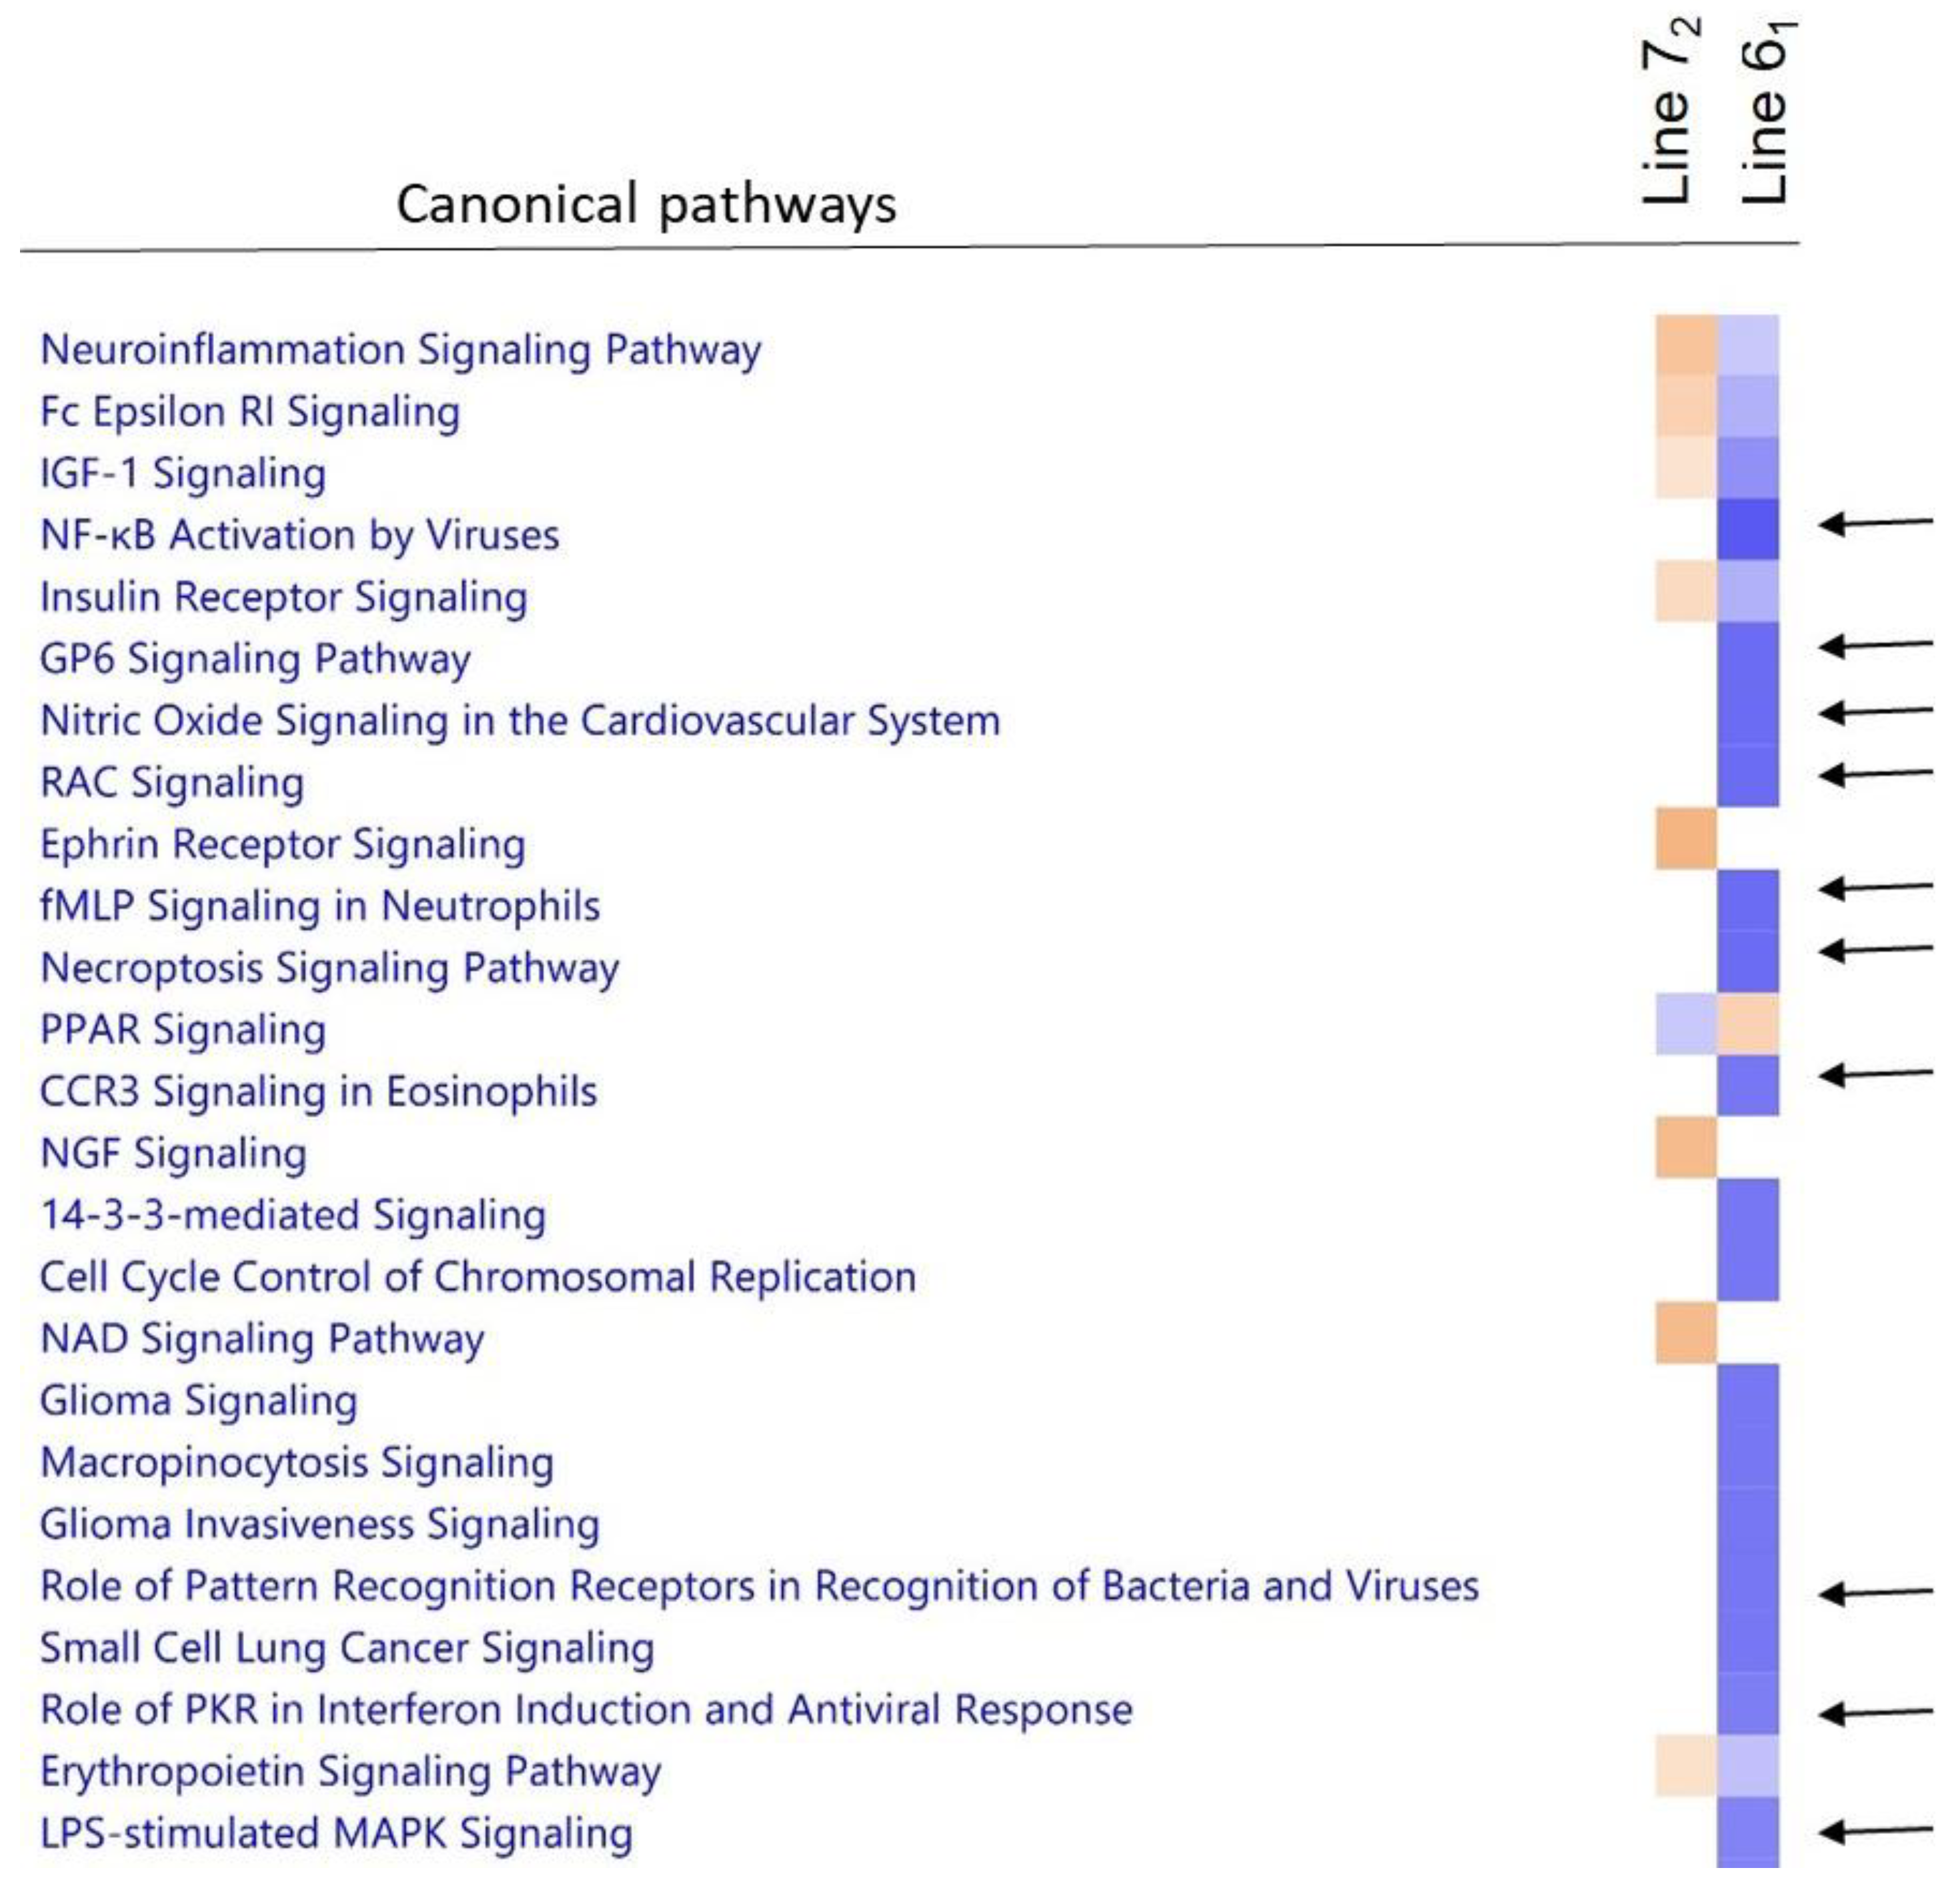
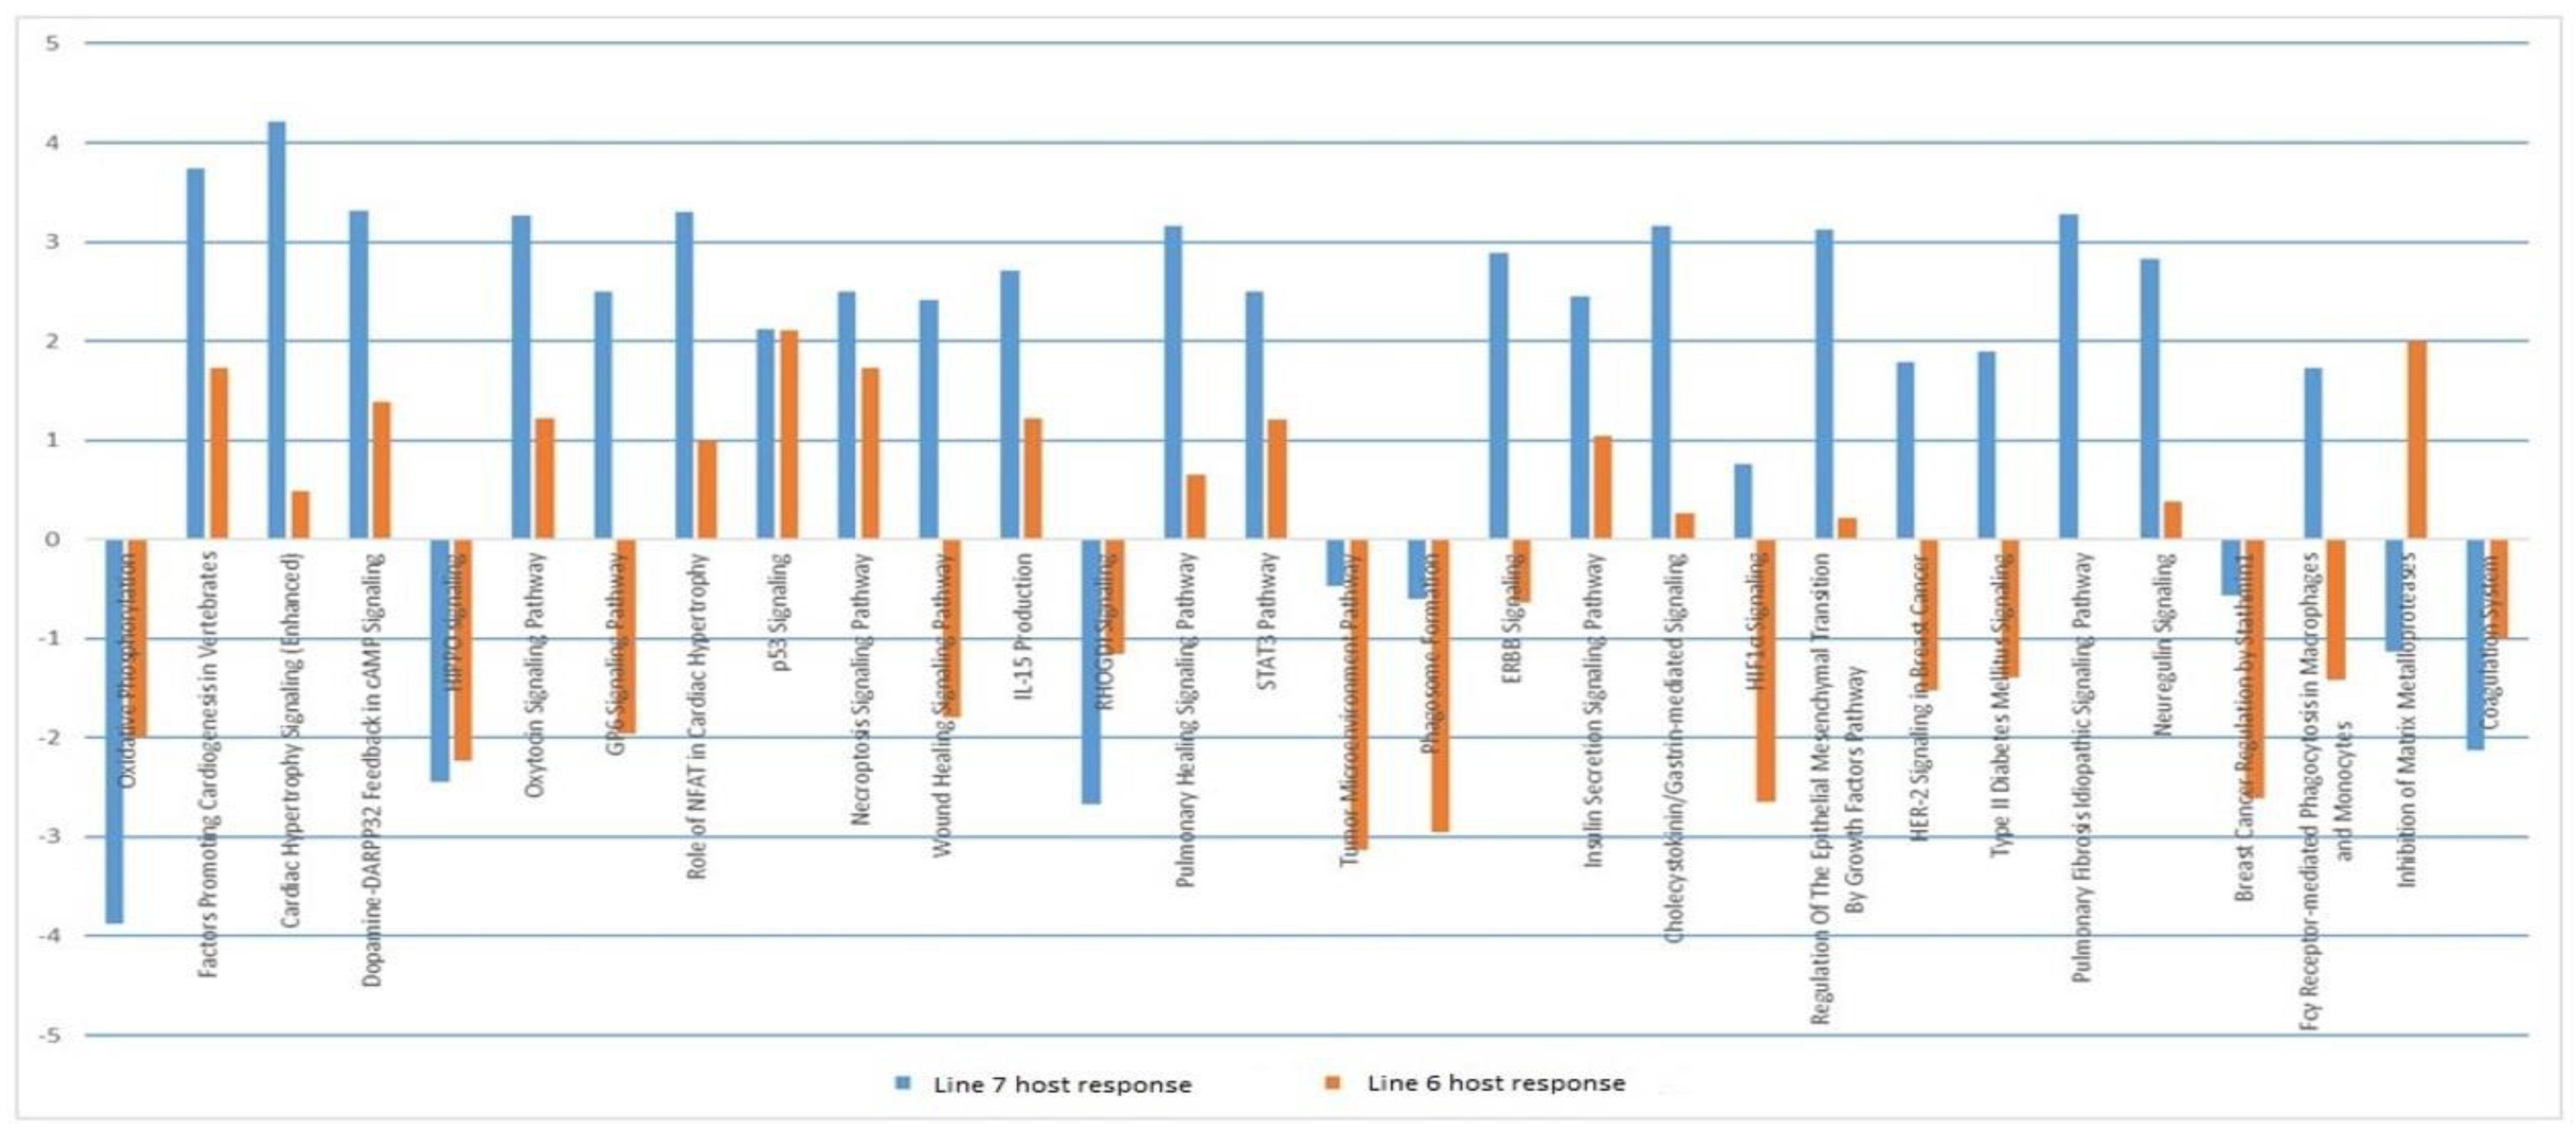
3.9. Downstream Analysis of Differentially Expressed Genes

Inherent differences in biological pathways were observed when comparing gene expression in BMDCs of uninfected control birds between the two lines. Genes involved in pathways such as those for NFĸB activation, signalling of GP6, nitric oxide, RAC, fMLP, necroptosis, CCR3, the role of pattern recognition receptors, interferon induction and MAPK signalling were expressed at a higher level in line 61 compared to line 72 (Figure 3). Thus, even before infection, it can be seen that the more resistant line was primed to attack the MDV pathogen in a way that the more susceptible line was not. Analysis of genes more highly expressed in line 61 showed an enrichment of genes that are targets for mir124a (Supplementary File S5). This microRNA is known to act as a tumour suppressor [34], and to be particularly associated with normal neuronal development and function [35].
The biological pathways involved during the host response in each line were examined. Figure 4 compares pathways which were activated or inhibited in host dendritic cells after infection with MDV. Several pathways were seen to be more downregulated in line 61 compared with line 72. These included GP6 signalling, tumour microenvironment, ERBB signalling, HIF1A signalling, HR2 signalling and phagocytosis. These are all processes associated with the immune system and/or tumour progression, and were more highly activated in the susceptible line 72 birds after challenge with MDV.
Using the WebGestalt tool to examine DEGs for specific enrichment showed an over-representation of genes associated with particular transcription factors and as targets for specific miRNAs. A significant number of genes upregulated in the resistant line 61 birds after infection contain binding sites for transcription factors, including CREBP1, which can act as a tumour suppressor [36], and RFX1, which is a regulator of MHC Class II genes [37]. Many of these DEGs are also targets for the miRNA mir-153 (amongst others), which is known to act as a tumour suppressor and reduce oncogenic processes. This is in contrast to DEGs in line 72 that are over-represented by genes that have binding sites for transcription factors including LEF1, AFP1 and p53—all of which have been associated with cancer progression [38,39,40]. We also observed an enrichment of genes acting as targets for miRNA mir-374 (amongst others), which is known to be associated with lymphoma [41]. A complete list of enriched factors found in DEGs either up- or downregulated in each of the lines can be found in Supplementary File S6. When a direct comparison of lines was made, we observed that DEGs in line 72 showed an over-representation of genes with binding sites for AP-1 (Table 2). In order to examine genes upregulated in each line more closely, the gProfiler tool was used. Significant GO terms, pathways and transcription factor binding sites for DEGs in each line are shown in Supplementary File S7.

3.10. Identification of Putative Candidate Genes for Resistance/Susceptibility to MD

To explore potential candidate genes for resistance or susceptibility to MD, DEGs were analysed between the two lines pre- and post-MDV infection by mapping them to regions underlying known QTLs (Supplementary File S1). Genes significantly differentially expressed and lying within defined QTL regions can be highlighted as strong candidates for having a role in resistance/susceptibility to MDV. Candidates showing differential inherent expression between the two lines included FGFR3 and SLBP, which were more highly expressed in line 61, and ST6GALNAC4, which showed higher expression in line 72. Examination of DEGs following MDV challenge indicated CERCAM, ST3GAL1, FGFRL1 and TMEM71 as potential candidates for increased susceptibility to MDV infection. The above-mentioned genes lie under QTLs reported previously [30,31]; however, all genes listed in Supplementary File S2 that are associated with a known QTLR can be considered potential candidates for resistance/susceptibility to MDV.

4. Discussion

To investigate the role of dendritic cells in the host response to MDV, BMDCs from MD-resistant (61) and MD-susceptible (72) chicken lines were infected with MDV-infected CEFs using a pre-established in vitro infection model and accordingly characterized on 1 dpi by FACS and RNA-seq analysis. Despite sharing the same MHC haplotype, these two inbred chicken lines express opposite phenotypes following infection with MDV, as shown by the mortality rates, ranging from 7% to 94% in resistant and susceptible chickens, respectively [42]. A high difference in the percentage of infection was also observed between the two lines when BMDMs (bone-marrow-derived macrophages) from these two lines were infected in vitro with MDV, revealing that line 72 BMDMs were three times more susceptible than those of line 61 [13]. As phagocytes, BMDCs from these two lines could be assumed to be infected by MDV at levels similar to BMDMs. However, the percentage of BMDCs infected in this study was only around 1.6% higher in the susceptible line compared to the resistant line, despite using a high ratio of infection. In this context it is worth mentioning that in order to obtain a sufficient number of infected BMDCs during cell sorting, a higher infection ratio (CEF:BMDC; 1:2.5) was used here than in our previous study (CEF:BMDM; 1:5) [13].
A possible interpretation of low infection in DCs could be that while BMDMs were cultured in the presence of chicken CSF-1, BMDCs were cultured with chIL-4 and chCSF-2, leading to differential transcription profiles in these two cell types, which might affect their susceptibility to infection [3]. Another potential reason for lower infection in DCs may be related to their function. While macrophages are well-equipped for terminating invading microorganisms, DCs are engaged in the initiation of adaptive immunity by the efficient processing and presentation of antigens to T cells [43]. Therefore, macrophages probably phagocytose more pathogens to destroy them at a greater rate, and DCs internalize a lesser amount of virus sufficient for processing and presenting antigens to T cells. There is also evidence that phagosomal degradation and acidification are much lower in DCs compared to macrophages [44]. These factors might have been the cause of the lower MDV infection rate seen in the current study. However, further studies are needed to clarify this.
Transcriptomic analysis of MDV-infected DCs has not previously been carried out, either in vivo or in vitro. To illustrate the role of DCs during MDV infection in vitro, DEGs of control and infected BMDCs from resistant (61) and susceptible lines (72) were analysed and compared. Although infection rates of susceptible and resistant lines were comparable, the inherent levels of immune gene expression and subsequent changes after challenge were very different. Differences in inherent gene expression between the lines may account for some of the differential resistance seen in these birds, and may help to explain the lower morbidity in line 61 following infection. It was observed that, after MDV infection, many immune genes were downregulated in line 61 BMDCs while their upregulated expression was seen in line 72. This finding is in agreement with our previous study in BMDMs [13], and it also supports the concept of MDV latency in resistant chickens (61) as not being recognized by the host immune responses [45], presumably by the lower expression of immune genes.
Differing gene expression profiles were seen in response to MDV challenge depending on which line was being examined. A stronger immune system activation was seen in the more susceptible line 72 birds, although the more resistant line 61 birds appeared to be more inherently immune-primed. Biological pathways significantly activated/repressed were those involved in the immune system, those related to neuronal pathways and those involved with oncogenesis, which is what might be expected considering the profile of MDV infection.
Upon MDV challenge, we saw unique responses in each of the two lines, with some genes showing completely contrasting expression. Genes showing increased expression in line 72 but downregulation in line 61 included ACSL6, ADAM12, ADAMTS15, ADAMTSL1, CD72AG, COL6A3, CSPG4, FSCN1, PTGS2, LOC101749645, PRDM8, TNFAIP6 and TNIP3. Some of these genes have functions that are obviously relevant in MDV pathogenesis. These include genes with a role in neuronal processes (ACSL6, ADAM12, CSPG4, PRDM8) and the immune system (CD72AG, PTGS2, TNIP3). Several other genes have roles in the cytoskeleton/extra-cellular matrix (ADAMTSL1, COL6A3, FSCN1, TNFAIP6). Extracellular matrix degradation is one of the consequences of MDV infection [46]. There was only 1 gene (GNAI1) that showed increased expression in line 61 but downregulation in line 72. GNAI1 is a guanine nucleotide-binding protein, and mutations in this gene are known to cause neurodevelopmental disorders [47].
Specific profiling of small RNAs was not carried out, but a few miRNAs were still highlighted as being differentially expressed between the two lines examined in this study. Gga-mir-22 and gga-mir-1797 showed different inherent levels of expression in control birds, while miRNAs gga-mir-22, gga-mir-3064 and gga-mir-6690 responded differently in each line after infection. Very little is known regarding the function of most chicken miRNAs, but they are understood to play a significant role in the regulation of cancer progression. Many of these transcripts have functions as either oncogenes or as tumour suppressors. Indeed, some microRNAs can act in both roles, depending on the physiological environment [48]. With the oncogenic nature of MDV [8,49], it is clear why the role of these molecules may be important. Interestingly, gga-mir-22 was highlighted in line 61 infected DCs this study. Mir-22 is known to be able to function as a tumour suppressor [50], and to have neuroprotective function [51]. MDV affects the nervous system of infected chickens [52,53] and thus higher expression of gga-mir-22 in line 61 may have a protective role against some of the symptoms associated with MDV infection.
When differentially expressed genes in DCs were examined as enriched targets for particular miRNAs, gga-mir-124a was identified as significant in control birds. Basal levels of expression were higher in line 61 for genes that are targets for this miRNA. miR-124 exerts a crucial role in the development of the immune system, regulation of immune responses, and inflammatory disorders [54]. miR-124 has been shown to be critically involved in neurogenesis, migration, morphogenesis and neuronal cell death [55]. It is also known to act as a tumour suppressor [34].
Enrichment analysis of differentially expressed genes also highlighted the fact that genes that were more highly expressed in susceptible line 72 in response to MDV challenge contained a high proportion with binding sites for the activator protein 1 (AP-1) transcription factor. AP-1 mediates gene regulation in response to many different physiological and pathogenic stimuli, including viral infections as well as oncogenic stimuli [56]. With its known role as a proto-oncogene [57,58], it could be hypothesized that, even at the early stages of MDV infection, the virus stimulates the expression of genes which can be regulated by AP-1, thus enabling the downstream transformation of cells later in infection. Expression of the gene encoding the JUN subunit of AP-1 was also seen to be downregulated in the more resistant line 61 birds.
Differentially expressed genes located under known MDV QTL regions were mapped to reveal putative candidate genes for MDV resistance/susceptibility. Genes found to be differentially expressed in this study and found to underlie QTL from two previous independent studies [30,31] were of particular interest. The SLBP gene was more highly expressed in line 61 control birds, while ST6GALNAC4 showed higher expression in line 72. SLBP is an RNA-binding protein involved in histone processing and expression [59], while ST6GALNAC4 is known to be overexpressed in metastases [60]. Following MDV challenge, CERCAM, ST3GAL1, FGFRL1 and TMEM71 were indicated as potential candidates for increased susceptibility to MDV infection. CERCAM encodes a cell adhesion protein involved in leukocyte transmigration across the blood–brain barrier [61]. ST3GAL1 has been implicated in tumour progression [62] and TMEM71 has been shown to be upregulated in gliomas [63]. A candidate for increased resistance to MDV is the FGFR3 gene, which had higher expression in line 61 after MDV challenge. Due to frequent mutations in certain cancers, FGFR3 is considered an oncogene [64]. However, in tumours of epithelial origin, FGFR3 can limit tumour growth and thus be considered a tumour suppressor [65].

5. Conclusions

Here, for the first time, we studied the role of dendritic cells in response to MDV challenge in vitro and outlined a major role in the host response during the early stage of MDV infection. Although we noted similar levels of infection of BMDC in lines of differing resistance, the underlying gene expression profiles were very different. This was seen at both the basal level in uninfected birds and during the host response to MDV infection in each line. The role of different aspects of the immune response were highlighted, along with the potential involvement of various miRNAs. Several candidate genes for MDV resistance/susceptibility were identified as strong targets for future functional validation.

Supplementary Materials

The following supporting information can be downloaded at: https://www.mdpi.com/article/10.3390/pathogens11111340/s1, Supplementary File S1: QTL regions for MDV resistance examined in this study; Supplementary File S2: All differentially expressed genes identified by the different comparisons described; Supplementary File S3: MDV transcript counts in each sample (TPM); Supplementary File S4: Differential expression of viral transcripts; Supplementary File S5: Genes that are targets for mir124A are enriched within genes more highly expressed in line 61 control birds, compared to line 72 controls; Supplementary File S6: Enrichment analysis results of DEGs in each line as determined by WebGestalt; Supplementary File S7: gProfiler analysis of DEGs from each line.

Author Contributions

Conceptualization, P.K.; data curation, R.I.K.; formal analysis, R.I.K. and Z.W.; funding acquisition, P.K.; investigation, P.C. and J.S.; methodology, P.C. and K.M.M.; project administration, P.K.; supervision, B.M.D. and P.K.; validation, P.C.; visualization, P.C. and J.S.; writing—original draft, P.C.; writing—review and editing, B.M.D. and J.S. All authors have read and agreed to the published version of the manuscript.

Funding

This project was funded by the Biotechnology and Biological Sciences Research Council (BBSRC) Institute Strategic Program Grant BB/J004324/1. P.C. was funded by a Principal’s Career Development PhD Scholarship and Edinburgh Global Research Scholarship.

Institutional Review Board Statement

Animals were housed in premises licensed under a UK Home Office Establishment License within the terms of the UK Home Office Animals (Scientific Procedures) Act 1986. Housing and husbandry complied with the Code of Practice for Housing and Care of Animals Bred, Supplied or Used for Scientific Purposes and were overseen by the Roslin Institute Animal Welfare and Ethical Review Board. Animals were culled by schedule one methods authorized by the Animals (Scientific Procedures) Act 1986.

Informed Consent Statement

Not applicable.

Data Availability Statement

Data have been submitted to European Nucleotide Archive under accession number PRJEB55811.

Acknowledgments

We thank Edinburgh Genomics (Edinburgh, UK) for carrying out the transcriptomic sequencing. We are also thankful to Robert Fleming and Graeme Robertson from Roslin Bio-imaging for their excellent support in cell sorting. Our gratitude extends to Bob Dalziel (The Roslin Institute) for providing eGFP MDV and to Venugopal Nair (The Pirbright Institute) for providing MDV CVI988 BAC as kind gifts. For the purpose of open access, the authors have applied a Creative Commons Attribution (CC BY) licence to any Author Accepted Manuscript version arising from this submission.

Conflicts of Interest

The authors declare no conflict of interest.

References

  1. Haunshi, S.; Cheng, H.H. Differential expression of Toll-like receptor pathway genes in chicken embryo fibroblasts from chickens resistant and susceptible to Marek’s disease. Poult. Sci. 2014, 93, 550–555. [Google Scholar] [CrossRef] [PubMed]
  2. Jeurissen, S.H.; Scholten, R.; Hilgers, L.A.; Pol, J.M.; De Boer, G.F. In situ detection by monoclonal antibody D-35.1 of cells infected with Marek’s disease virus that interact with splenic ellipsoid-associated reticulum cells. Avian Dis. 1989, 33, 657–663. [Google Scholar] [CrossRef] [PubMed]
  3. Chakraborty, P.; Vervelde, L.; Dalziel, R.G.; Wasson, P.S.; Nair, V.; Dutia, B.M.; Kaiser, P. Marek’s disease virus infection of phagocytes: A de novo in vitro infection model. J. Gen. Virol. 2017, 98, 1080–1088. [Google Scholar] [CrossRef]
  4. Davison, T.F.; Kaiser, P. Immunity to Marek’s disease. In Marek’s Disease: An Evolving Problem; Davison, F., Nair, V., Eds.; Elsevier Academic Press: London, UK, 2004; pp. 126–139. [Google Scholar]
  5. Haq, K.; Schat, K.A.; Sharif, S. Immunity to Marek’s disease: Where are we now? Dev. Comp. Immunol. 2013, 41, 439–446. [Google Scholar] [CrossRef] [PubMed]
  6. Boodhoo, N.; Gurung, A.; Sharif, S.; Behboudi, S. Marek’s disease in chickens: A review with focus on immunology. Vet. Res. 2016, 47, 119. [Google Scholar] [CrossRef] [Green Version]
  7. Gimeno, I.M. Marek’s disease vaccines: A solution for today but a worry for tomorrow? Vaccine 2008, 26 (Suppl. 3), C31–C41. [Google Scholar] [CrossRef] [PubMed]
  8. Nair, V. Latency and Tumorigenesis in Marek’s Disease. Avian Dis. 2013, 57 (Suppl. 2), 360–365. [Google Scholar] [CrossRef]
  9. Yang, Y.; Dong, M.; Hao, X.; Qin, A.; Shang, S. Revisiting cellular immune response to oncogenic Marek’s disease virus: The rising of avian T-cell immunity. Cell. Mol. Life Sci. 2020, 77, 3103–3116. [Google Scholar] [CrossRef] [Green Version]
  10. Zmrhal, V.; Slama, P. Current knowledge about interactions between avian dendritic cells and poultry pathogens. Dev. Comp. Immunol. 2020, 104, 103565. [Google Scholar] [CrossRef]
  11. Calnek, B.W. Pathogenesis of Marek’s Disease Virus Infection. Curr. Top. Microbiol. Immunol. 2000, 255, 25–55. [Google Scholar] [CrossRef]
  12. Wu, Z.; Rothwell, L.; Young, J.R.; Kaufman, J.; Butter, C.; Kaiser, P. Generation and characterization of chicken bone marrow-derived dendritic cells. Immunology 2010, 129, 133–145. [Google Scholar] [CrossRef] [PubMed]
  13. Chakraborty, P.; Kuo, R.; Vervelde, L.; Dutia, B.M.; Kaiser, P.; Smith, J. Macrophages from Susceptible and Resistant Chicken Lines have Different Transcriptomes following Marek’s Disease Virus Infection. Genes 2019, 10, 74. [Google Scholar] [CrossRef] [PubMed] [Green Version]
  14. Cole, R.K. Studies on Genetic Resistance to Marek’s Disease. Avian Dis. 1968, 12, 9. [Google Scholar] [CrossRef] [PubMed]
  15. Lee, L.F.; Powell, P.; Rennie, M.; Ross, L.; Payne, L. Nature of Genetic Resistance to Marek’s Disease in Chickens2. JNCI J. Natl. Cancer Inst. 1981, 66, 789–796. [Google Scholar] [CrossRef] [PubMed]
  16. Bacon, L.D.; Hunt, H.D.; Cheng, H.H. A Review of the Development of Chicken Lines to Resolve Genes Determining Resistance to Diseases. Poult. Sci. 2000, 79, 1082–1093. [Google Scholar] [CrossRef] [PubMed]
  17. Wasson, P. Development of Novel Virus Vectors for Influenza Vaccination. Ph.D. Thesis, University of Edinburgh, Edinburgh, UK, July 2011. [Google Scholar]
  18. Gimeno, I.; Silva, R.F. Deletion of the Marek’s disease virus UL41 gene (vhs) has no measurable effect on latency or pathogenesis. Virus Genes 2008, 36, 499–507. [Google Scholar] [CrossRef] [PubMed]
  19. Petherbridge, L.; Howes, K.; Baigent, S.J.; Sacco, M.A.; Evans, S.; Osterrieder, N.; Nair, V. Replication-Competent Bacterial Artificial Chromosomes of Marek’s Disease Virus: Novel Tools for Generation of Molecularly Defined Herpesvirus Vaccines. J. Virol. 2003, 77, 8712–8718. [Google Scholar] [CrossRef] [Green Version]
  20. Andrews, S. FastQC: A Quality Control Tool for High Throughput Sequence Data. 2010. Available online: http://www.bioinformatics.babraham.ac.uk/projects/fastqc (accessed on 3 November 2014).
  21. Martin, M. Cutadapt removes adapter sequences from high-throughput sequencing reads. EMBnet. J. 2011, 17, 10–12. [Google Scholar] [CrossRef]
  22. Li, H.; Handsaker, B.; Wysoker, A.; Fennell, T.; Ruan, J.; Homer, N.; Marth, G.; Abecasis, G.; Durbin, R. The Sequence Alignment/Map Format and SAMtools. Bioinformatics 2009, 25, 2078–2079. [Google Scholar] [CrossRef] [Green Version]
  23. Anders, S.; Pyl, P.T.; Huber, W. HTSeq—A Python framework to work with high-throughput sequencing data. Bioinformatics 2015, 31, 166–169. [Google Scholar] [CrossRef] [Green Version]
  24. Robinson, M.D.; Smyth, G.K. Moderated statistical tests for assessing differences in tag abundance. Bioinformatics 2007, 23, 2881–2887. [Google Scholar] [CrossRef] [Green Version]
  25. Dobin, A.; Davis, C.A.; Schlesinger, F.; Drenkow, J.; Zaleski, C.; Jha, S.; Batut, P.; Chaisson, M.; Gingeras, T.R. STAR: Ultrafast universal RNA-seq aligner. Bioinformatics 2013, 29, 15–21. [Google Scholar] [CrossRef] [PubMed]
  26. Liao, Y.; Smyth, G.K.; Shi, W. feature Counts: An efficient general purpose program for assigning sequence reads to genomic features. Bioinformatics 2014, 30, 923–930. [Google Scholar] [CrossRef] [Green Version]
  27. Love, M.I.; Huber, W.; Anders, S. Moderated estimation of fold change and dispersion for RNA-seq data with DESeq2. Genome Biol. 2014, 15, 550. [Google Scholar] [CrossRef] [Green Version]
  28. Zhang, B.; Kirov, S.; Snoddy, J. WebGestalt: An integrated system for exploring gene sets in various biological contexts. Nucleic Acids Res. 2005, 33 (Suppl. 2), W741–W748. [Google Scholar] [CrossRef]
  29. Raudvere, U.; Kolberg, L.; Kuzmin, I.; Arak, T.; Adler, P.; Peterson, H.; Vilo, J. g:Profiler: A web server for functional enrichment analysis and conversions of gene lists (2019 update). Nucleic Acids Res. 2019, 47, W191–W198. [Google Scholar] [CrossRef] [PubMed] [Green Version]
  30. Smith, J.; Sadeyen, J.-R.; Paton, I.R.; Hocking, P.M.; Salmon, N.; Fife, M.; Nair, V.; Burt, D.W.; Kaiser, P. Systems Analysis of Immune Responses in Marek’s Disease Virus-Infected Chickens Identifies a Gene Involved in Susceptibility and Highlights a Possible Novel Pathogenicity Mechanism. J. Virol. 2011, 85, 11146–11158. [Google Scholar] [CrossRef] [Green Version]
  31. Smith, J.; Lipkin, E.; Soller, M.; Fulton, J.; Burt, D. Mapping QTL Associated with Resistance to Avian Oncogenic Marek’s Disease Virus (MDV) Reveals Major Candidate Genes and Variants. Genes 2020, 11, 1019. [Google Scholar] [CrossRef] [PubMed]
  32. O’Brien, J.; Hayder, H.; Zayed, Y.; Peng, C. Overview of MicroRNA Biogenesis, Mechanisms of Actions, and Circulation. Front. Endocrinol. 2018, 9, 402. [Google Scholar] [CrossRef] [Green Version]
  33. Wang, J.; Li, Y.; Ding, M.; Zhang, H.; Xu, X.; Tang, J. Molecular mechanisms and clinical applications of miR-22 in regulating malignant progression in human cancer (Review). Int. J. Oncol. 2017, 50, 345–355. [Google Scholar] [CrossRef]
  34. Jia, X.; Wang, X.; Guo, X.; Ji, J.; Lou, G.; Zhao, J.; Zhou, W.; Guo, M.; Zhang, M.; Li, C.; et al. MicroRNA-124: An emerging therapeutic target in cancer. Cancer Med. 2019, 8, 5638–5650. [Google Scholar] [CrossRef] [PubMed] [Green Version]
  35. Hou, Q.; Ruan, H.; Gilbert, J.; Wang, G.; Ma, Q.; Yao, W.-D.; Man, H.-Y. MicroRNA miR124 is required for the expression of homeostatic synaptic plasticity. Nat. Commun. 2015, 6, 10045. [Google Scholar] [CrossRef] [PubMed] [Green Version]
  36. Bhoumik, A.; Ronai, Z. ATF2: A transcription factor that elicits oncogenic or tumor suppressor activities. Cell Cycle 2008, 7, 2341–2345. [Google Scholar] [CrossRef] [PubMed] [Green Version]
  37. Reith, W.; Herrero-Sanchez, C.; Kobr, M.; Silacci, P.; Berte, C.; Barras, E.; Fey, S.; Mach, B. MHC class II regulatory factor RFX has a novel DNA-binding domain and a functionally independent dimerization domain. Genes Dev. 1990, 4, 1528–1540. [Google Scholar] [CrossRef] [Green Version]
  38. Feng, Y.; Li, Y.; Dai, W.; Mo, S.; Li, Q.; Cai, S. Clinicopathologic Features and Prognostic Factors in Alpha-Fetoprotein-Producing Colorectal Cancer: Analysis of 78 Cases. Cell. Physiol. Biochem. 2018, 51, 2052–2064. [Google Scholar] [CrossRef]
  39. Marei, H.E.; Althani, A.; Afifi, N.; Hasan, A.; Caceci, T.; Pozzoli, G.; Morrione, A.; Giordano, A.; Cenciarelli, C. p53 signaling in cancer progression and therapy. Cancer Cell Int. 2021, 21, 703. [Google Scholar] [CrossRef]
  40. Xiao, L.; Zhang, C.; Li, X.; Jia, C.; Chen, L.; Yuan, Y.; Gao, Q.; Lu, Z.; Feng, Y.; Zhao, R.; et al. LEF1 Enhances the Progression of Colonic Adenocarcinoma via Remodeling the Cell Motility Associated Structures. Int. J. Mol. Sci. 2021, 22, 10870. [Google Scholar] [CrossRef]
  41. Qian, D.; Chen, K.; Deng, H.; Rao, H.; Huang, H.; Liao, Y.; Sun, X.; Lu, S.; Yuan, Z.; Xie, D.; et al. MicroRNA-374b Suppresses Proliferation and Promotes Apoptosis in T-cell Lymphoblastic Lymphoma by Repressing AKT1 and Wnt-16. Clin. Cancer Res. 2015, 21, 4881–4891. [Google Scholar] [CrossRef] [Green Version]
  42. Bumstead, N.; Kaufman, J. Genetic resistance to Marek’s disease. In Marek’s Disease: An Evolving Problem; Davison, F., Nair, V., Eds.; Elsevier Academic Press: London, UK, 2004; pp. 112–125. [Google Scholar]
  43. De Geus, E.D.; Vervelde, L. Regulation of macrophage and dendritic cell function by pathogens and through immunomodulation in the avian mucosa. Dev. Comp. Immunol. 2013, 41, 341–351. [Google Scholar] [CrossRef]
  44. Savina, A.; Amigorena, S. Phagocytosis and antigen presentation in dendritic cells. Immunol. Rev. 2007, 219, 143–156. [Google Scholar] [CrossRef]
  45. Kaiser, P.; Underwood, G.; Davison, F. Differential Cytokine Responses following Marek’s Disease Virus Infection of Chickens Differing in Resistance to Marek’s Disease. J. Virol. 2003, 77, 762–768. [Google Scholar] [CrossRef] [PubMed] [Green Version]
  46. Akkoc, A.; Yilmaz, R.; Sonmez, G. Expression of Matrix Metalloproteinases in Marek’S Disease Tumours. Avian Biol. Res. 2012, 5, 93–98. [Google Scholar] [CrossRef]
  47. Muir, A.M.; Gardner, J.F.; van Jaarsveld, R.H.; de Lange, I.M.; van der Smagt, J.J.; Wilson, G.N.; Dubbs, H.; Goldberg, E.M.; Zitano, L.; Bupp, C.; et al. Variants in GNAI1 cause a syndrome associated with variable features including developmental delay, seizures, and hypotonia. Genet. Med. 2021, 23, 881–887. [Google Scholar] [CrossRef] [PubMed]
  48. Semina, E.V.; Rysenkova, K.D.; Troyanovskiy, K.E.; Shmakova, A.A.; Rubina, K.A. MicroRNAs in Cancer: From Gene Expression Regulation to the Metastatic Niche Reprogramming. Biochemistry 2021, 86, 785–799. [Google Scholar] [CrossRef] [PubMed]
  49. Payne, L.; Rennie, M. The proportions of b and t lymphocytes in lymphomas, peripheral nerves and lymphoid organs in Marek’s disease. Avian Pathol. 1976, 5, 147–154. [Google Scholar] [CrossRef] [Green Version]
  50. Tsuchiya, N.; Izumiya, M.; Ogata-Kawata, H.; Okamoto, K.; Fujiwara, Y.; Nakai, M.; Okabe, A.; Schetter, A.J.; Bowman, E.D.; Midorikawa, Y.; et al. Tumor Suppressor miR-22 Determines p53-Dependent Cellular Fate through Post-transcriptional Regulation of p21. Cancer Res. 2011, 71, 4628–4639. [Google Scholar] [CrossRef] [Green Version]
  51. Jovicic, A.; Zaldivar Jolissaint, J.F.; Moser, R.; Silva Santos, M.D.; Luthi-Carter, R. MicroRNA-22 (miR-22) Overexpression Is Neuroprotective via General Anti-Apoptotic Effects and May also Target Specific Huntington’s Disease-Related Mechanisms. PLoS ONE 2013, 8, e54222. [Google Scholar] [CrossRef] [Green Version]
  52. Witter, R.L.; Schat, K.A. Marek’s Disease. In Diseases of Poultry; Saif, Y.M., Ed.; Iowa State University Press: Ames, IA, USA, 2003; pp. 407–465. [Google Scholar]
  53. Payne, L.N. Pathological responses to infection. In Marek’s Disease: An Evolving Problem; Davison, F., Nair, V., Eds.; Elsevier Academic Press: London, UK, 2004; pp. 78–97. [Google Scholar]
  54. Qin, Z.; Wang, P.-Y.; Su, D.-F.; Liu, X. miRNA-124 in Immune System and Immune Disorders. Front. Immunol. 2016, 7, 406. [Google Scholar] [CrossRef] [Green Version]
  55. Sun, Y.; Luo, Z.-M.; Guo, X.-M.; Su, D.-F.; Liu, X. An updated role of microRNA-124 in central nervous system disorders: A review. Front. Cell. Neurosci. 2015, 9, 193. [Google Scholar] [CrossRef] [Green Version]
  56. Hess, J.; Angel, P.; Schorpp-Kistner, M. AP-1 subunits: Quarrel and harmony among siblings. J. Cell Sci. 2004, 117, 5965–5973. [Google Scholar] [CrossRef]
  57. Shaulian, E.; Karin, M. AP-1 as a regulator of cell life and death. Nature 2002, 4, E131–E136. [Google Scholar] [CrossRef] [PubMed]
  58. Shaulian, E. AP-1—The Jun proteins: Oncogenes or tumor suppressors in disguise? Cell. Signal. 2010, 22, 894–899. [Google Scholar] [CrossRef] [PubMed]
  59. Whitfield, M.L.; Kaygun, H.; Erkmann, J.A.; Townley-Tilson, W.H.D.; Dominski, Z.; Marzluff, W.F. SLBP is associated with histone mRNA on polyribosomes as a component of the histone mRNP. Nucleic Acids Res. 2004, 32, 4833–4842. [Google Scholar] [CrossRef] [PubMed]
  60. Dimitroff, C.J. Galectin-Binding O-Glycosylations as Regulators of Malignancy. Cancer Res. 2015, 75, 3195–3202. [Google Scholar] [CrossRef] [PubMed] [Green Version]
  61. Starzyk, R.M.; Rosenow, C.; Frye, J.; Leismann, M.; Rodzinski, E.; Putney, S.; Tuomanen, E.I. Cerebral Cell Adhesion Molecule: A Novel Leukocyte Adhesion Determinant on Blood-Brain Barrier Capillary Endothelium. J. Infect. Dis. 2000, 181, 181–187. [Google Scholar] [CrossRef]
  62. Chong, Y.K.; Sandanaraj, E.; Koh, L.W.H.; Thangaveloo, M.; Tan, M.S.Y.; Koh, G.R.H.; Toh, T.B.; Lim, G.G.Y.; Holbrook, J.D.; Kon, O.L.; et al. ST3GAL1-Associated Transcriptomic Program in Glioblastoma Tumor Growth, Invasion, and Prognosis. JNCI J. Natl. Cancer Inst. 2016, 108. [Google Scholar] [CrossRef] [Green Version]
  63. Wang, K.; Huang, R.; Tong, X.; Zhang, K.; Liu, Y.; Zeng, F.; Hu, H.; Jiang, T. Molecular and clinical characterization of TMEM71 expression at the transcriptional level in glioma. CNS Neurosci. Ther. 2019, 25, 965–975. [Google Scholar] [CrossRef] [Green Version]
  64. Chesi, M.; Brents, L.A.; Ely, S.A.; Bais, C.; Robbiani, D.F.; Mesri, E.A.; Kuehl, W.M.; Bergsagel, P.L. Activated fibroblast growth factor receptor 3 is an oncogene that contributes to tumor progression in multiple myeloma. Blood 2001, 97, 729–736. [Google Scholar] [CrossRef] [Green Version]
  65. Lafitte, M.; Moranvillier, I.; Garcia, S.; Peuchant, E.; Iovanna, J.; Rousseau, B.; Dubus, P.; Guyonnet-Dupérat, V.; Belleannée, G.; Ramos, J.; et al. FGFR3 has tumor suppressor properties in cells with epithelial phenotype. Mol. Cancer 2013, 12, 83. [Google Scholar] [CrossRef]
Figure 1. (A) The in vitro infection of DCs from two inbred lines with Marek’s disease virus (MDV). Chicken bone-marrow-derived DCs (BMDCs) from lines 61 and 72 were cultured with chIL-4 and colony stimulating factor 2 (chCSF-2) for 4 days. On the day of infection, pre-sorted eGFP+CD45- chicken embryo fibroblasts (CEFs) were co-cultured with BMDCs at a ratio of 1:2.5 (CEF:BMDC). At 1 dpi, in vitro-infected BMDCs were characterized by FACS for the expression of eGFP and CD45. Data shown are the average percentage of infection of four independent experiments. Distribution of cells: Q1, infected CEFs; Q2, infected BMDCs; Q3, uninfected CEFs; Q4, uninfected BMDCs. (B) Graph showing means and respective standard errors of the mean (SEM) of the percentages of infected cells found within the four biological replicates from lines 61 and 72 BMDCs during cell-sorting experiments.
Pathogens 11 01340 g001
Figure 2. Venn diagram showing the overlap of differentially expressed genes between lines 61 and 72 after infection by MDV. Numbers of genes up- and downregulated are indicated.
Pathogens 11 01340 g002
Figure 3. Comparison of canonical pathways represented by genes expressed in BMDCs at inherently different levels in the two lines studied. Orange colour denotes upregulation in the MD-susceptible line (72) and blue colour represents upregulation in the MD-resistant line (61). Arrows indicate some of the pathways showing notable basal differential gene expression in each line.
Pathogens 11 01340 g003
Figure 4. A comparison of pathways activated/inhibited in lines 61 and 72 in response to MDV challenge.
Pathogens 11 01340 g004
Table 1. The numbers of differentially expressed genes (DEGs) (p < 0.05) used for functional analysis.
CategoryGenes More Highly Expressed in BMDCs of Line 61 Genes More Highly Expressed in BMDCs of Line 72
Host response in line 72 compared to controls/843 ↑ and 678 ↓
Host response in line 61 compared to controls760 ↑ and 722 ↓/
Inherent difference between lines477478
Difference between lines upon infection317668
↑—up-regulated; ↓—down-regulated.
Table 2. DEGs upregulated in line 72 after challenge with MDV were enriched with binding sites for AP-1.
Gene SetSizeExpectRatiop-ValueFDR
TGANTCA_AP1_C159038.3641.66820.000020.009
AP1_C4099.86852.4320.000050.009
GGGTGGRR_PAX4_03185344.711.56560.000060.009
AP1_Q4_014129.94092.41430.000060.009
CTTTGA_LEF1_Q2168340.6081.5760.000110.012
SRY_013247.81762.55830.000120.012
AP1_Q23809.16882.39940.000130.012
CTTTAAR_UNKNOWN140833.9731.61890.000190.013
STAT4_013899.3862.34390.000190.013
CAGGTA_AREB6_01116228.0371.67630.000270.017
Publisher’s Note: MDPI stays neutral with regard to jurisdictional claims in published maps and institutional affiliations.

