
Cryptic Diversity in Cladosporium cladosporioides Resulting from Sequence-Based Species Delimitation Analyses


Abstract
:1. Introduction
2. Results
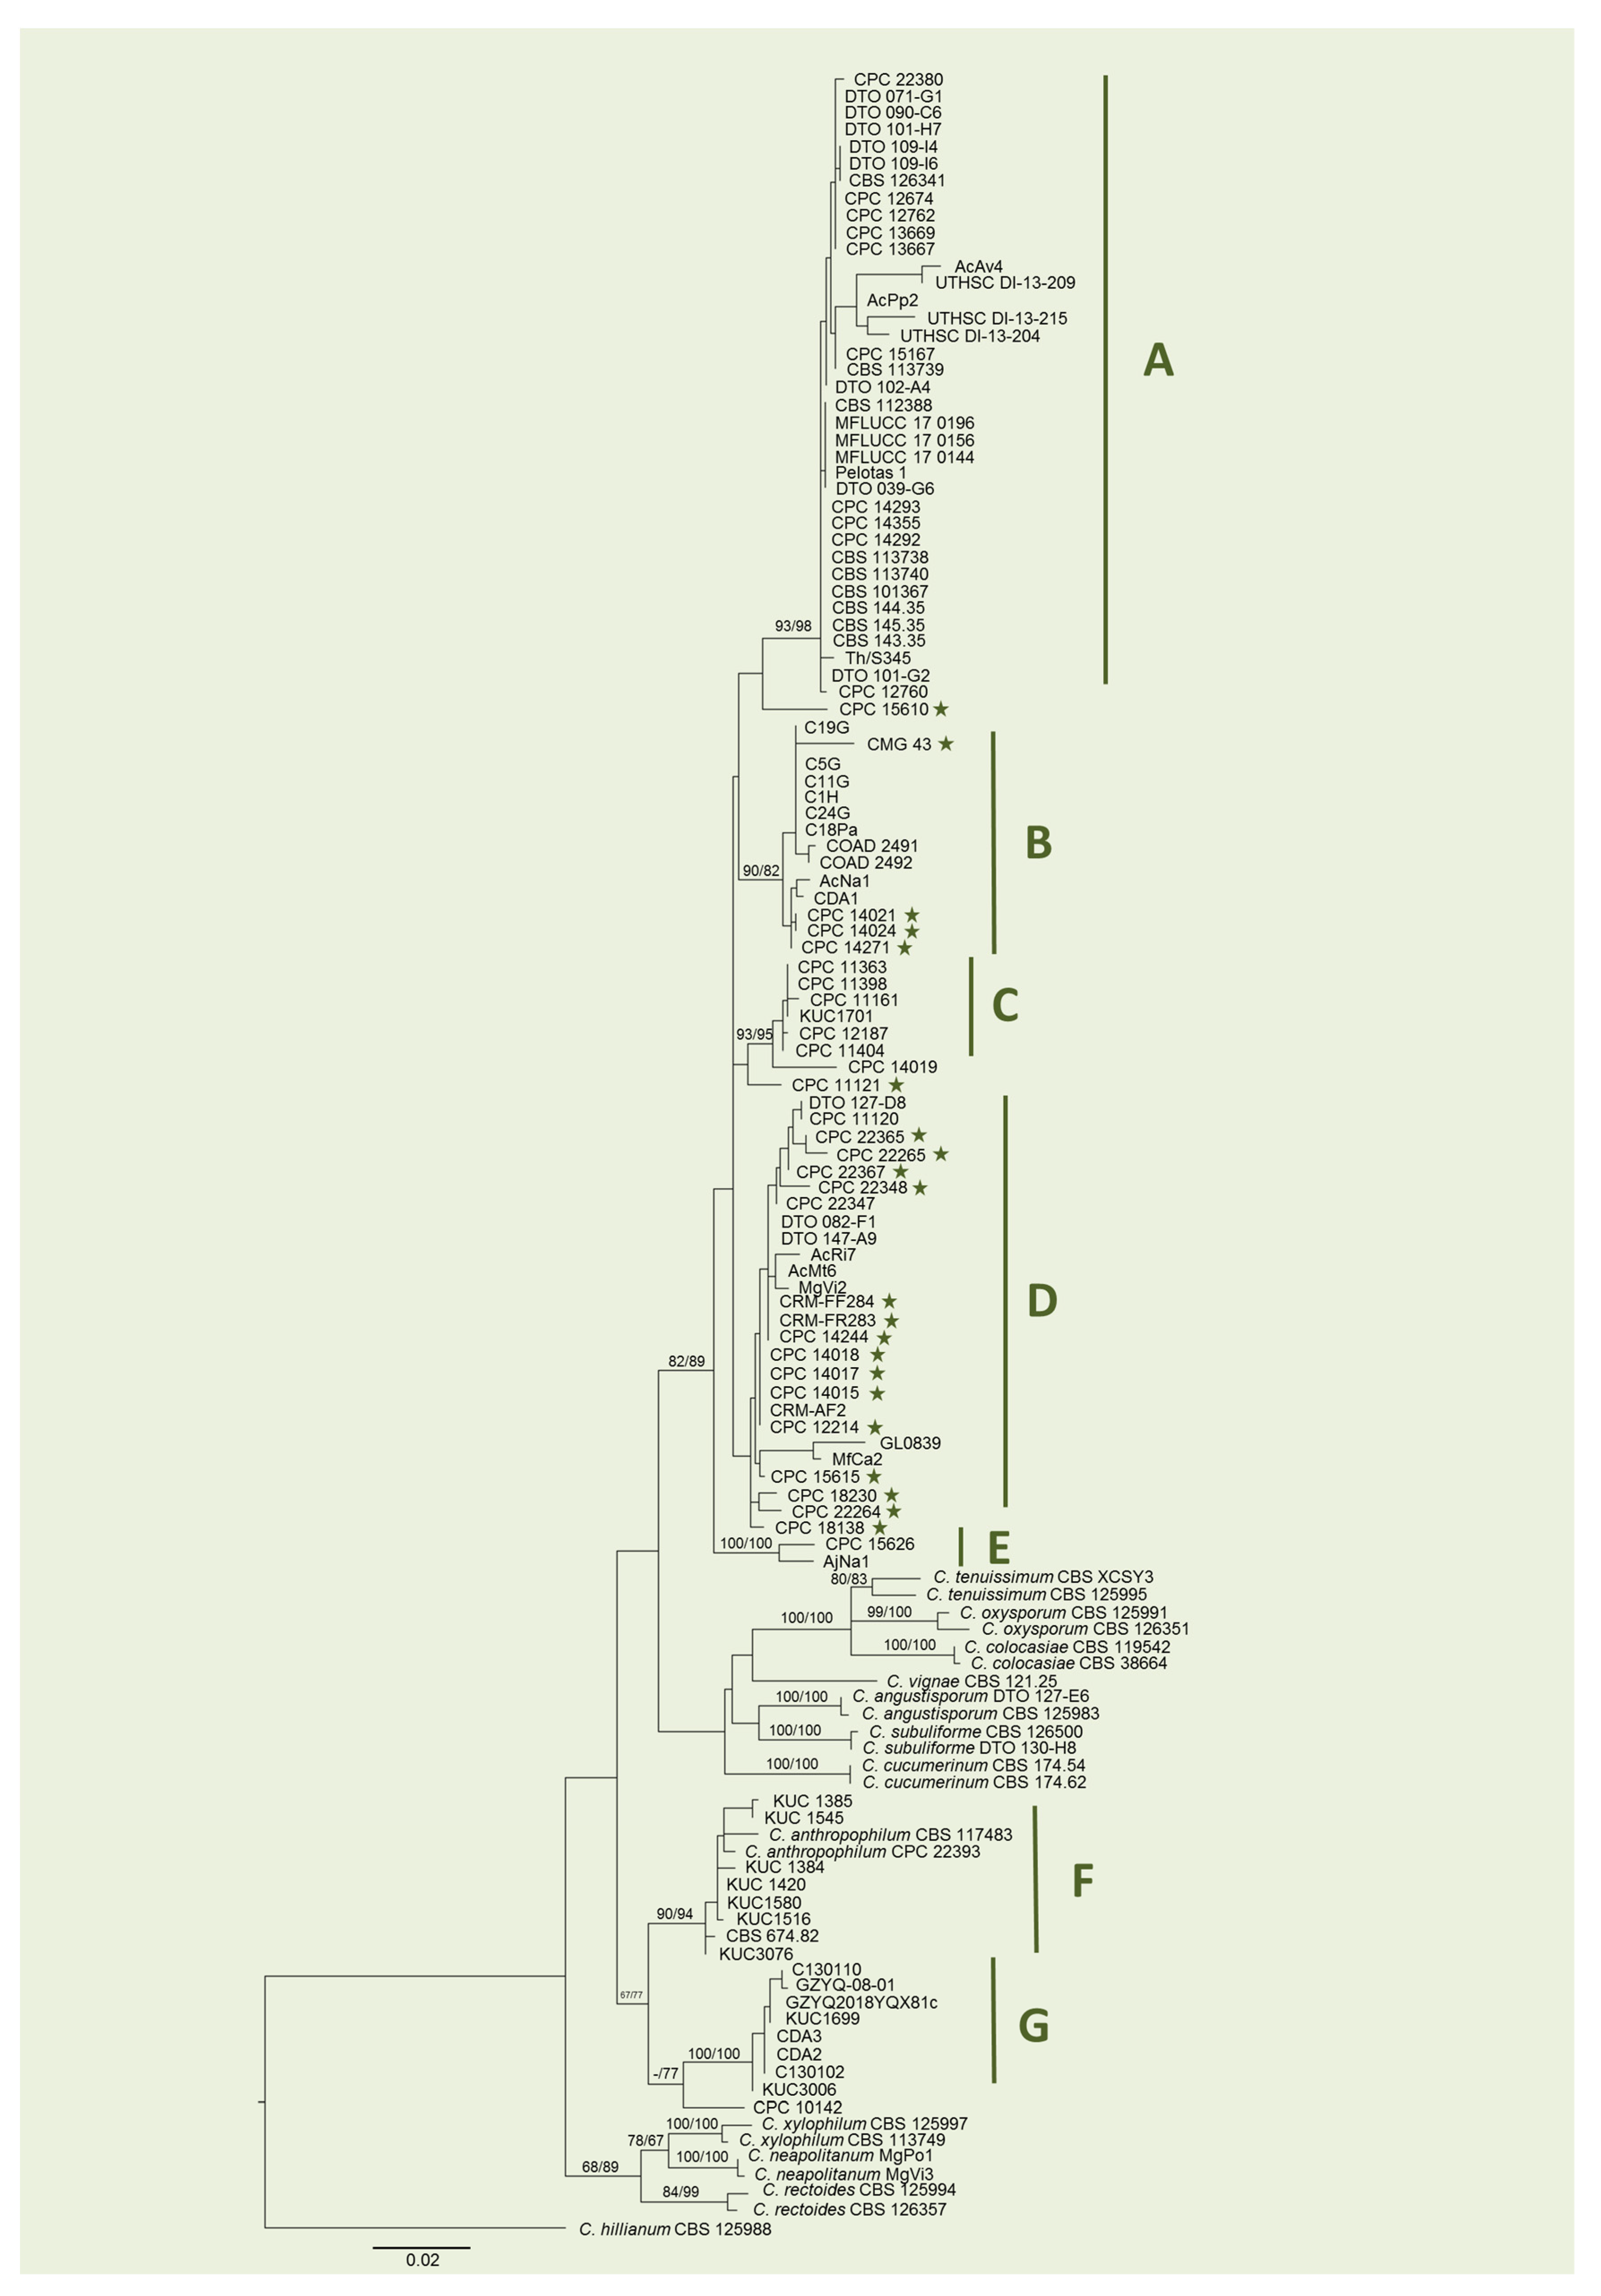
2.1. Phylogenetic Analysis
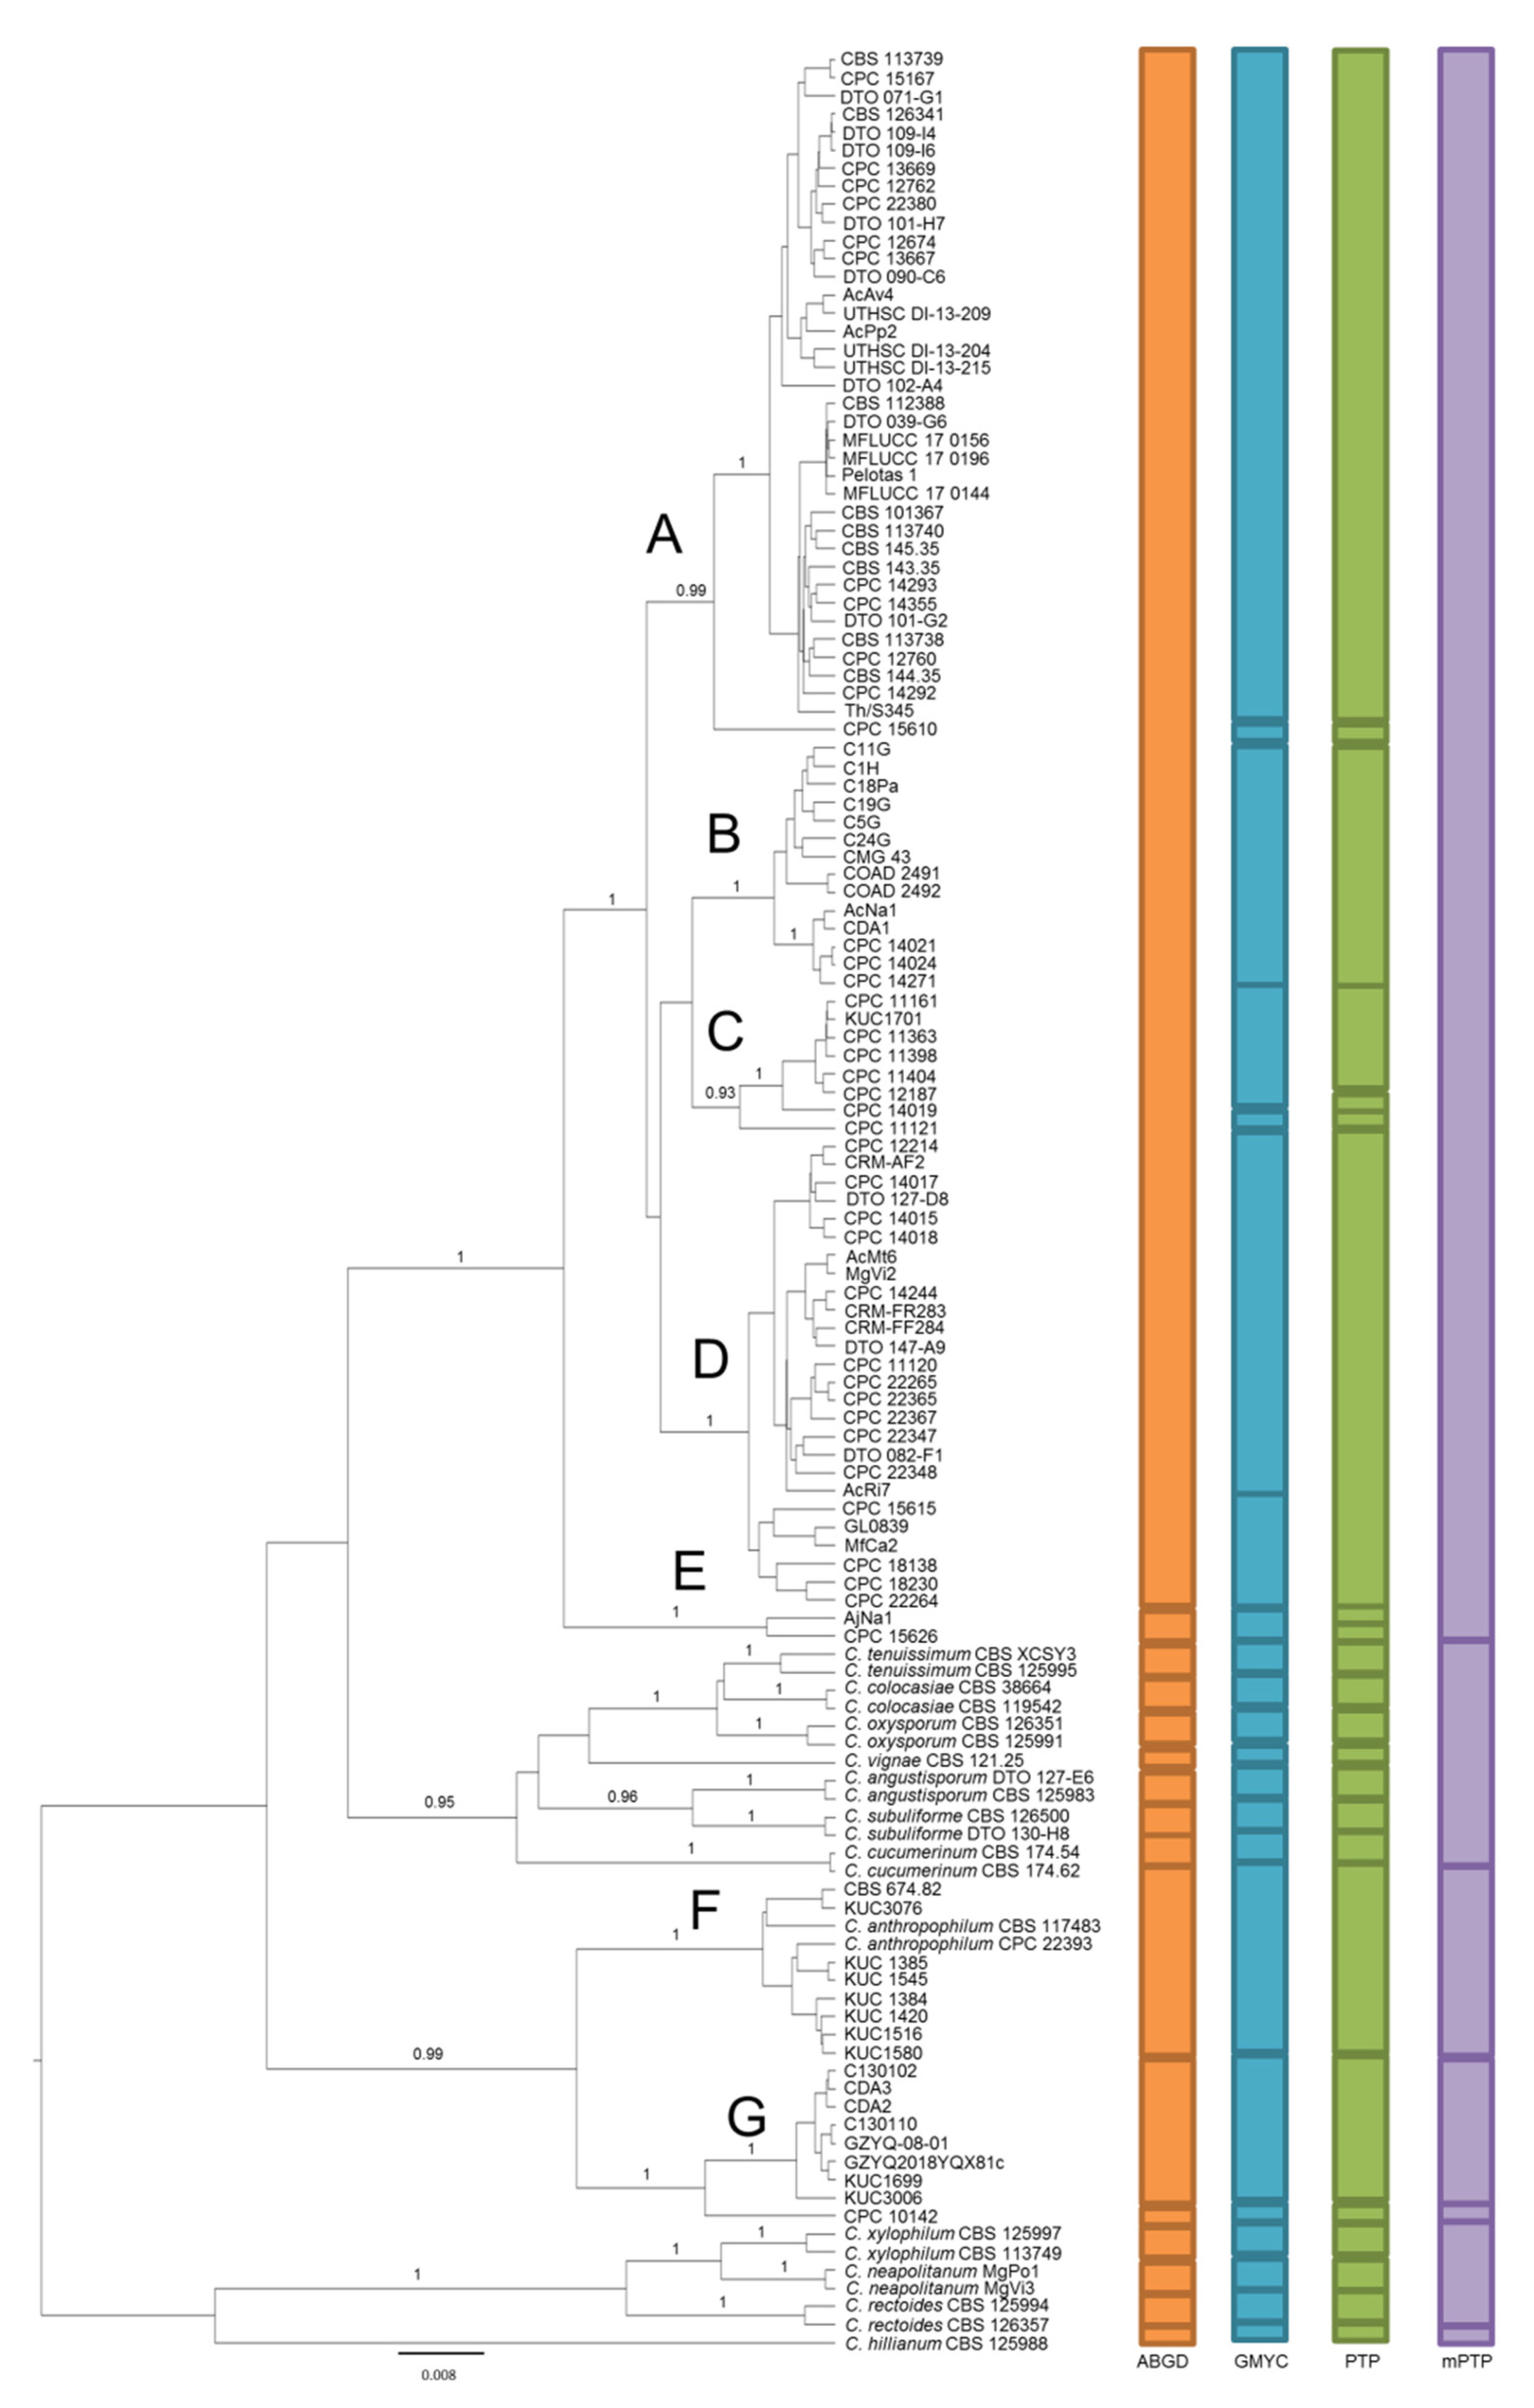
2.2. Species Delimitation Analyses
3. Discussion
4. Materials and Methods
4.1. Phylogenetic Analysis
4.2. Species Delimitation Analysis
5. Conclusions
Author Contributions
Funding
Institutional Review Board Statement
Informed Consent Statement
Data Availability Statement
Acknowledgments
Conflicts of Interest
References
- Bensch, K.; Groenewald, J.Z.; Braun, U.; Dijksterhuis, J.; de Jesús Yáñez-Morales, M.; Crous, P.W. Common but different: The expanding realm of Cladosporium. Stud. Mycol. 2015, 82, 23–74. [Google Scholar] [CrossRef] [Green Version]
- Bensch, K.; Braun, U.; Groenewald, J.Z.; Crous, P.W. The genus Cladosporium. Stud. Mycol. 2012, 72, 1–401. [Google Scholar] [CrossRef] [PubMed] [Green Version]
- Bensch, K.; Groenewald, J.Z.; Dijksterhuis, J.; Starink-Willemse, M.; Andersen, B.; Summerell, B.A.; Shin, H.-D.; Dugan, F.M.; Schroers, H.-J.; Braun, U.; et al. Species and ecological diversity within the Cladosporium cladosporioides complex (Davidiellaceae, Capnodiales). Stud. Mycol. 2010, 67, 1–94. [Google Scholar] [CrossRef] [PubMed]
- Sandoval-Denis, M.; Gené, J.; Sutton, D.A.; Wiederhold, N.P.; Cano-Lira, J.F.; Guarro, J. New species of Cladosporium associated with human and animal infections. Persoonia 2016, 36, 281–298. [Google Scholar] [CrossRef] [Green Version]
- Salvatore, M.M.; Andolfi, A.; Nicoletti, R. The genus Cladosporium: A rich source of diverse and bioactive natural compounds. Molecules 2021, 26, 3959. [Google Scholar] [CrossRef] [PubMed]
- Iturrieta-González, I.; García, D.; Gené, J. Novel species of Cladosporium from environmental sources in Spain. MycoKeys 2021, 77, 1–25. [Google Scholar] [CrossRef] [PubMed]
- Bensch, K.; Groenewald, J.Z.; Meijer, M.; Dijksterhuis, J.; Jurjević, Ž.; Andersen, B.; Houbraken, J.; Crous, P.W.; Samson, R.A. Cladosporium species in indoor environments. Stud. Mycol. 2018, 89, 177–301. [Google Scholar] [CrossRef] [PubMed]
- Sandoval-Denis, M.; Sutton, D.A.; Martin-Vicente, A.; Cano-Lira, J.F.; Wiederhold, N.; Guarro, J.; Gené, J. Cladosporium species recovered from clinical samples in the USA. J. Clin. Microbiol. 2015, 53, 2990–3000. [Google Scholar] [CrossRef] [PubMed] [Green Version]
- Maharachchikumbura, S.S.N.; Chen, Y.; Ariyawansa, H.A.; Hyde, K.D.; Haelewaters, D.; Perera, R.H.; Samarakoon, M.C.; Wanasinghe, D.N.; Bustamante, D.E.; Liu, J.-K.; et al. Integrative approaches for species delimitation in Ascomycota. Fungal Divers. 2021. [Google Scholar] [CrossRef]
- Haelewaters, D.; Urbina, H.; Brown, S.; Newerth-Henson, S.; Aime, M.C. Isolation and molecular characterization of the romaine lettuce phylloplane mycobiome. J. Fungi 2021, 7, 277. [Google Scholar] [CrossRef]
- Carstens, B.C.; Pelletier, T.A.; Reid, N.M.; Satler, J.D. How to fail at species delimitation. Mol. Ecol. 2013, 22, 4369–4383. [Google Scholar] [CrossRef]
- Bustamante, D.E.; Oliva, M.; Leiva, S.; Mendoza, J.E.; Bobadilla, L.; Angulo, G.; Calderon, M.S. Phylogeny and species delimitations in the entomopathogenic genus Beauveria (Hypocreales, Ascomycota), including the description of B. Peruviensis sp. nov. MycoKeys 2019, 58, 47–68. [Google Scholar] [CrossRef]
- Haelewaters, D.; De Kesel, A.; Pfister, D.H. Integrative taxonomy reveals hidden species within a common fungal parasite of ladybirds. Sci. Rep. 2018, 8, 15966. [Google Scholar] [CrossRef]
- Parnmen, S.; Rangsiruji, A.; Mongkolsuk, P.; Boonpragob, K.; Nutakki, A.; Lumbsch, H.T. Using phylogenetic and coalescent methods to understand the species diversity in the Cladia aggregata complex (Ascomycota, Lecanorales). PLoS ONE 2012, 7, e52245. [Google Scholar] [CrossRef] [PubMed]
- Zimowska, B.; Becchimanzi, A.; Krol, E.D.; Furmanczyk, A.; Bensch, K.; Nicoletti, R. New Cladosporium species from normal and galled flowers of Lamiaceae. Pathogens 2021, 10, 369. [Google Scholar] [CrossRef]
- AlMatar, M.; Makky, E.A. Cladosporium cladosporioides from the perspectives of medical and biotechnological approaches. 3 Biotech 2015, 6, 4. [Google Scholar] [CrossRef] [Green Version]
- Matheny, P.B.; Wang, Z.; Binder, M.; Curtis, J.M.; Lim, Y.W.; Nilsson, R.H.; Hughes, K.W.; Hofstetter, V.; Ammirati, J.F.; Schoch, C.L.; et al. Contributions of Rpb2 and Tef1 to the phylogeny of mushrooms and allies (Basidiomycota, Fungi). Mol. Phylogenet. Evol. 2007, 43, 430–451. [Google Scholar] [CrossRef]
- Liu, F.; Wang, M.; Damm, U.; Crous, P.W.; Cai, L. Species boundaries in plant pathogenic fungi: A Colletotrichum case study. BMC Evol. Biol. 2016, 16, 81. [Google Scholar] [CrossRef] [PubMed] [Green Version]
- Puillandre, N.; Lambert, A.; Brouillet, S.; Achaz, G. ABGD, Automatic Barcode Gap Discovery for primary species delimitation. Mol. Ecol. 2012, 21, 1864–1877. [Google Scholar] [CrossRef]
- Fujisawa, T.; Barraclough, T.G. Delimiting species using single-locus data and the Generalized Mixed Yule Coalescent approach: A revised method and evaluation on simulated data sets. Syst. Biol. 2013, 62, 707–724. [Google Scholar] [CrossRef] [Green Version]
- Pons, J.; Barraclough, T.G.; Gomez-Zurita, J.; Cardoso, A.; Duran, D.P.; Hazell, S.; Kamoun, S.; Sumlin, W.D.; Vogler, A.P. Sequence-based species delimitation for the DNA taxonomy of undescribed insects. Syst. Biol. 2006, 55, 595–609. [Google Scholar] [CrossRef] [Green Version]
- Zhang, J.; Kapli, P.; Pavlidis, P.; Stamatakis, A. A general species delimitation method with applications to phylogenetic placements. Bioinformatics 2013, 29, 2869–2876. [Google Scholar] [CrossRef] [PubMed] [Green Version]
- Kapli, P.; Lutteropp, S.; Zhang, J.; Kobert, K.; Pavlidis, P.; Stamatakis, A.; Flouri, T. Multi-rate poisson tree processes for single-locus species delimitation under Maximum Likelihood and Markov Chain Monte Carlo. Bioinformatics 2017, 33, 1630–1638. [Google Scholar] [CrossRef] [Green Version]
- Nilsson, R.H.; Ryberg, M.; Kristiansson, E.; Abarenkov, K.; Larsson, K.-H.; Kõljalg, U. Taxonomic reliability of DNA sequences in public sequence databases: A fungal perspective. PLoS ONE 2006, 1, e59. [Google Scholar] [CrossRef]
- Piemontese, L.; Giovannini, I.; Guidetti, R.; Pellegri, G.; Dioli, P.; Maistrello, L.; Rebecchi, L.; Cesari, M. The species identification problem in mirids (Hemiptera: Heteroptera) highlighted by DNA barcoding and species delimitation studies. Eur. Zool. J. 2020, 87, 310–324. [Google Scholar] [CrossRef]
- Leray, M.; Knowlton, N.; Ho, S.-L.; Nguyen, B.N.; Machida, R.J. GenBank is a reliable resource for 21st century biodiversity research. PNAS 2019, 116, 22651–22656. [Google Scholar] [CrossRef] [Green Version]
- Lücking, R.; Aime, M.C.; Robbertse, B.; Miller, A.N.; Ariyawansa, H.A.; Aoki, T.; Cardinali, G.; Crous, P.W.; Druzhinina, I.S.; Geiser, D.M.; et al. Unambiguous identification of fungi: Where do we stand and how accurate and precise is fungal DNA barcoding? IMA Fungus 2020, 11, 14. [Google Scholar] [CrossRef]
- Marchetta, A.; Gerrits van den Ende, B.; Al-Hatmi, A.M.S.; Hagen, F.; Zalar, P.; Sudhadham, M.; Gunde-Cimerman, N.; Urzì, C.; De Hoog, S.; De Leo, F. Global molecular diversity of the halotolerant fungus Hortaea werneckii. Life 2018, 8, 31. [Google Scholar] [CrossRef] [Green Version]
- Huang, W.; Xie, X.; Huo, L.; Liang, X.; Wang, X.; Chen, X. An integrative DNA barcoding framework of ladybird beetles (Coleoptera: Coccinellidae). Sci. Rep. 2020, 10, 10063. [Google Scholar] [CrossRef]
- Song, C.; Lin, X.-L.; Wang, Q.; Wang, X.-H. DNA barcodes successfully delimit morphospecies in a superdiverse insect genus. Zool. Scripta 2018, 47, 311–324. [Google Scholar] [CrossRef]
- Talavera, G.; Dincă, V.; Vila, R. Factors affecting species delimitations with the GMYC model: Insights from a butterfly survey. Methods Ecol. Evol. 2013, 4, 1101–1110. [Google Scholar] [CrossRef] [Green Version]
- Jörger, K.M.; Norenburg, J.L.; Wilson, N.G.; Schrödl, M. Barcoding against a paradox? Combined molecular species delineations reveal multiple cryptic lineages in elusive meiofaunal sea slugs. BMC Evol. Biol. 2012, 12, 245. [Google Scholar] [CrossRef] [Green Version]
- Weigand, A.M.; Jochum, A.; Slapnik, R.; Schnitzler, J.; Zarza, E.; Klussmann-Kolb, A. Evolution of microgastropods (Ellobioidea, Carychiidae): Integrating taxonomic, phylogenetic and evolutionary hypotheses. BMC Evol. Biol. 2013, 13, 18. [Google Scholar] [CrossRef] [PubMed] [Green Version]
- Kekkonen, M.; Hebert, P.D.N. DNA barcode-based delineation of putative species: Efficient start for taxonomic workflows. Mol. Ecol. Resour. 2014, 14, 706–715. [Google Scholar] [CrossRef]
- Giraud, T.; Refrégier, G.; Le Gac, M.; de Vienne, D.M.; Hood, M.E. Speciation in fungi. Fungal Gen. Biol. 2008, 45, 791–802. [Google Scholar] [CrossRef]
- Edgar, R.C. MUSCLE: Multiple sequence alignment with high accuracy and high throughput. Nucleic Acids Res. 2004, 32, 1792–1797. [Google Scholar] [CrossRef] [Green Version]
- Larsson, A. AliView: A fast and lightweight alignment viewer and editor for large datasets. Bioinformatics 2014, 30, 3276–3278. [Google Scholar] [CrossRef]
- Dissanayake, A. Applied aspects of methods to infer phylogenetic relationships amongst fungi. Mycosphere 2020, 11, 2652–2676. [Google Scholar] [CrossRef]
- Darriba, D.; Taboada, G.L.; Doallo, R.; Posada, D. JModelTest 2: More models, new heuristics and high-performance computing. Nat. Methods 2012, 9, 772. [Google Scholar] [CrossRef] [PubMed] [Green Version]
- Stamatakis, A. RAxML-VI-HPC: Maximum likelihood-based phylogenetic analyses with thousands of taxa and mixed models. Bioinformatics 2006, 22, 2688–2690. [Google Scholar] [CrossRef]
- Bouckaert, R.; Heled, J.; Kühnert, D.; Vaughan, T.; Wu, C.-H.; Xie, D.; Suchard, M.A.; Rambaut, A.; Drummond, A.J. BEAST 2: A software platform for Bayesian evolutionary analysis. PLOS Comput. Biol. 2014, 10, e1003537. [Google Scholar] [CrossRef] [Green Version]
- Miralles, A.; Vences, M. New metrics for comparison of taxonomies reveal striking discrepancies among species delimitation methods in Madascincus lizards. PLoS ONE 2013, 8, e68242. [Google Scholar] [CrossRef] [Green Version]
- Blair, C.; Bryson, R.W. Cryptic diversity and discordance in single-locus species delimitation methods within horned lizards (Phrynosomatidae: Phrynosoma). Mol. Ecol. Res. 2017, 17, 1168–1182. [Google Scholar] [CrossRef] [Green Version]

| Code | Source | Country | ITS | tef1 | act |
|---|---|---|---|---|---|
| AcAv4 | larva of Asphondylia nepetae | Italy | MK387888 | MK416092 | MK416049 |
| AcMt6 | larva of Asphondylia nepetae | Italy | MK387883 | MK416087 | MK416044 |
| AcNa1 | gall on Clinopodium nepeta | Italy | MK387881 | MK416085 | MK416042 |
| AcPp2 | Clinopodium nepeta, receptacle | Italy | MK387885 | MK416089 | MK416046 |
| AcRi7 | Clinopodium nepeta, receptacle | Italy | MK387886 | MK416090 | MK416047 |
| AjNa1 | Ajuga reptans, receptacle | Italy | MK387884 | MK416088 | MK416045 |
| C11G | rice leaf | Brazil | MK049921 | MK073937 | MK073928 |
| C130102 | Fragaria x ananassa | Korea | KJ558398 | KJ558400 | KJ558395 |
| C130110 | Fragaria x ananassa | Korea | KJ558397 | KJ558399 | KJ558394 |
| C18Pa | rice leaf | Brazil | MK049923 | MK073939 | MK073930 |
| C19G | rice leaf | Brazil | MK049924 | MK073940 | MK073931 |
| C1H | rice leaf | Brazil | MK049917 | MK073933 | MK073924 |
| C24G | rice leaf | Brazil | MK049925 | MK073941 | MK073932 |
| C5G | rice leaf | Brazil | MK049919 | MK073935 | MK073926 |
| CBS 101367 | soil | Brazil | HM148002 | HM148243 | HM148489 |
| CBS 112388 † | indoor air | Germany | HM148003 | HM148244 | HM148490 |
| CBS 113738 | grape bud | USA | HM148004 | HM148245 | HM148491 |
| CBS 113739 | crested wheat grass | USA | HM148005 | HM148246 | HM148492 |
| CBS 113740 | berry | USA | HM148006 | HM148247 | HM148493 |
| CBS 126341 | spinach seed | USA | HM148009 | HM148250 | HM148496 |
| CBS 143.35 | Pisum sativum | South Africa | HM148011 | HM148252 | HM148498 |
| CBS 144.35 | Pisum sativum | USA | HM148012 | HM148253 | HM148499 |
| CBS 145.35 | Pisum sativum | Germany | HM148013 | HM148254 | HM148500 |
| CBS 674.82 | cotton seed | Israel | HM148014 | HM148255 | HM148501 |
| CDA1 | Phragmidium griseum | Korea | MG451052 | MG451058 | MG451055 |
| CDA2 | Gymnosporangium haraeanum | Korea | MG451053 | MG451059 | MG451056 |
| CDA3 | Gymnosporangium haraeanum | Korea | MG451054 | MG451060 | MG451057 |
| CMG 43 | Fucus spiralis | Portugal | MN053016 | MN066642 | MN066637 |
| COAD 2491 | leaf litter | Brazil | MK253342 | MK293782 | MK249985 |
| COAD 2492 | leaf litter | Brazil | MK253343 | MK293783 | MK249986 |
| CPC 10142 | Chenopodium ficifolium | Korea | HM148015 | HM148256 | HM148502 |
| CPC 11120 | Viola mandshurica | Korea | HM148017 | HM148258 | HM148504 |
| CPC 11121 | Celosia cristata | Korea | HM148018 | HM148259 | HM148505 |
| CPC 11161 | Eucalyptus sp. | India | HM148022 | HM148263 | HM148509 |
| CPC 11363 | Valeriana fauriei | Korea | HM148023 | HM148264 | HM148510 |
| CPC 11398 | rust (Phragmidium griseum) | Korea | HM148024 | HM148265 | HM148511 |
| CPC 11404 | Rubus coreanus | Korea | HM148025 | HM148266 | HM148512 |
| CPC 12187 | Myosoton aquaticum, leaf | Korea | HM148027 | HM148268 | HM148514 |
| CPC 12214 | Morus rubra, leaf | Germany | HM148028 | HM148269 | HM148515 |
| CPC 12760 | Spinacia oleracea, seed | USA | HM148029 | HM148270 | HM148516 |
| CPC 12762 | Spinacia oleracea, seed | USA | HM148030 | HM148271 | HM148517 |
| CPC 12764 | Spinacia oleracea, seed | USA | HM148031 | HM148272 | HM148518 |
| CPC 13667 | Eucalyptus robertsonii | Australia | HM148034 | HM148275 | HM148521 |
| CPC 13669 | Eucalyptus robertsonii | Australia | HM148035 | HM148276 | HM148522 |
| CPC 14015 | wheat | South Africa | HM148038 | HM148279 | HM148525 |
| CPC 14017 | wheat | South Africa | HM148039 | HM148280 | HM148526 |
| CPC 14018 | wheat | South Africa | HM148040 | HM148281 | HM148527 |
| CPC 14019 | wheat | South Africa | HM148041 | HM148282 | HM148528 |
| CPC 14021 | wheat | South Africa | HM148042 | HM148283 | HM148529 |
| CPC 14024 | pawpaw | South Africa | HM148043 | HM148284 | HM148530 |
| CPC 14244 | Magnolia sp. | USA | HM148044 | HM148285 | HM148531 |
| CPC 14271 | twig of unidentified tree | France | HM148045 | HM148286 | HM148532 |
| CPC 14271 | unidentified tree | France | HM148045 | HM148286 | HM148532 |
| CPC 14292 | soil | Denmark | HM148046 | HM148287 | HM148533 |
| CPC 14293 | cellulose powder | Denmark | HM148047 | HM148288 | HM148534 |
| CPC 14355 | mouldy pea | USA | HM148048 | HM148289 | HM148535 |
| CPC 15167 | mite in strawberry leaf | Slovenia | HM148052 | HM148293 | HM148539 |
| CPC 15610 | Rumex sp. | Mexico | KT600385 | KT600482 | KT600580 |
| CPC 15615 | wild tree | Mexico | KT600386 | KT600483 | KT600581 |
| CPC 15626 | wild plant | Mexico | KT600387 | KT600484 | KT600582 |
| CPC 18138 | pine needles | Mexico | KT600388 | KT600485 | KT600583 |
| CPC 18230 | bract of Phaenocoma prolifera | South Africa | JF499834 | JF499872 | JF499878 |
| CPC 22264 | indoor air sample | USA | MF472936 | MF473363 | MF473786 |
| CPC 22265 | indoor air sample | USA | MF472937 | MF473364 | MF473787 |
| CPC 22347 | indoor air sample | USA | MF472938 | MF473365 | MF473788 |
| CPC 22348 | indoor air sample | USA | MF472939 | MF473366 | MF473789 |
| CPC 22365 | indoor air sample | USA | MF472940 | MF473367 | MF473790 |
| CPC 22367 | indoor air | USA | MF472941 | MF473368 | MF473791 |
| CPC 22380 | indoor air sample | USA | MF472942 | MF473369 | MF473792 |
| CRM-AF2 | Vaccinium corymbosum, fruit | Mexico | MN857901 | MN865110 | MN865115 |
| CRM-FF284 | Rubus idaeus, fruit | Mexico | MN857899 | MN865108 | MN865113 |
| CRM-FR283 | Fragaria x ananassa, fruit | Mexico | MN857900 | MN865109 | MN865114 |
| DTO 039-G6 | indoor air sample | Germany | KP701868 | KP701745 | KP701991 |
| DTO 071-G1 | indoor air sample | Greece | KP701872 | KP701749 | KP701995 |
| DTO 082-F1 | indoor air sample | The Netherlands | KP701879 | KP701756 | KP702002 |
| DTO 090-C6 | archive | The Netherlands | KP701898 | KP701775 | KP702021 |
| DTO 101-G2 | table | Hungary | MF472943 | MF473370 | MF473793 |
| DTO 101-H7 | floor | Hungary | MF472944 | MF473371 | MF473794 |
| DTO 102-A4 | bathroom | Hungary | KP701905 | KP701782 | KP702028 |
| DTO 109-I4 | indoor environment | Denmark | KP701920 | KP701797 | KP702043 |
| DTO 109-I6 | indoor environment | Denmark | KP701922 | KP701799 | KP702045 |
| DTO 127-D8 | indoor air sample | The Netherlands | KP701933 | KP701810 | KP702055 |
| DTO 147-A9 | indoor environment | Hungary | KP701941 | KP701818 | KP702063 |
| GL0839 | apple | China | JX241647 | JX241672 | JX241674 |
| GZYQ-08-01 | Camellia sinensis, leaf | China | MK852271 | MK852273 | MK852272 |
| GZYQ2018YQX81c | Camellia sinensis, leaf | China | MK799636 | MK799638 | MK799637 |
| KUC1384 | Korean pine | Korea | JN033485 | JN033540 | JN033512 |
| KUC1385 | Korean pine | Korea | JN033484 | JN033539 | JN033511 |
| KUC1420 | Japanese red pine lumber | Korea | JN033483 | JN033538 | JN033510 |
| KUC1516 | Korean pine lumber | Korea | JN033479 | JN033534 | JN033506 |
| KUC1545 | Korean pine lumber | Korea | JN033478 | JN033533 | JN033505 |
| KUC1580 | larch | Korea | JN033477 | JN033532 | JN033504 |
| KUC1699 | Japanese red pine | Korea | JN033473 | JN033528 | JN033500 |
| KUC1701 | Japanese red pine | Korea | JN033471 | JN033526 | JN033498 |
| KUC3006 | radiata pine wood | Korea | JN033465 | JN033520 | JN033492 |
| KUC3076 | larch wood | Korea | JN033463 | JN033518 | JN033490 |
| MfCa2 | gall on Micromeria fruticulosa | Italy | MK387882 | MK416086 | MK416043 |
| MFLUCC 17 0144 | Vitis vinifera | China | MG938710 | MG938823 | MG938675 |
| MFLUCC 17 0156 | Vitis vinifera | China | MG938711 | MG938824 | MG938676 |
| MFLUCC 17 0196 | Vitis vinifera | China | MG938712 | MG938825 | MG938677 |
| MgVi2 | larva of Asphondylia sp. | Italy | MK387887 | MK416091 | MK416048 |
| Pelotas1 | Alstroemeria hybrida | Brazil | MG775703 | MG775038 | MG775039 |
| Th/S345 | Thymus vulgaris, achene | Poland | MK387889 | MK416093 | MK416050 |
| UTHSC DI-13-204 | abdomen | USA | LN834358 | LN834454 | LN834542 |
| UTHSC DI-13-209 | pleura | USA | LN834359 | LN834455 | LN834543 |
| UTHSC DI-13-215 | sputum | USA | LN834360 | LN834456 | LN834544 |
| Species | Code | Source | ITS | tef1 | act |
|---|---|---|---|---|---|
| C. angustisporum | CBS 125983 | Alloxylon wickhamii | HM147995 | HM148236 | HM148482 |
| C. angustisporum | DTO-127-E6 | air in bakery | KP701935 | KP701812 | KP702057 |
| C. anthropophilum | CBS 117483 | - | HM148007 | HM148248 | HM148494 |
| C. anthropophilum | CPC 22393 | indoor air | MF472922 | MF473349 | MF473772 |
| C. colocasiae | CBS 386.64 | Colocasia esculenta | HM148067 | HM148310 | HM148555 |
| C. colocasiae | CBS 119542 | Colocasia esculenta | HM148066 | HM148309 | HM148554 |
| C. cucumerinum | CBS 174.62 | painted floor | HM148076 | HM148320 | HM148565 |
| C. cucumerinum | CBS 174.54 | Cucumis sativus | HM148075 | HM148319 | HM148564 |
| C. hillianum | CBS 125988 | leaf of Typha orientalis | HM148097 | HM148341 | HM148586 |
| C. neapolitanum | MgPo1 | Micromeria graeca-receptacle | MK387890 | MK416094 | MK416051 |
| C. neapolitanum | MgVi3 | Micromeria graeca-receptacle | MK387892 | MK416096 | MK416053 |
| C. oxysporum | CBS 125991 | soil | HM148118 | HM148362 | HM148607 |
| C. oxysporum | CBS 126351 | indoor air | HM148119 | HM148363 | HM148608 |
| C. rectoides | CBS 125994 | Vitis flexuosa | HM148193 | HM148438 | HM148683 |
| C. rectoides | CBS 126357 | Plectranthus sp. | MH863933 | HM148439 | HM148684 |
| C. subuliforme | CBS 126500 | Chamaedorea metallica | HM148196 | HM148441 | HM148686 |
| C. subuliforme | DTO-130-H8 | indoor environment | KP701938 | KP701815 | KP702060 |
| C. tenuissimum | XCSY3 | Coriandrum sativum | MG873079 | MT154184 | MT154174 |
| C. tenuissimum | CBS 125995 | Lagerstroemia sp. | HM148197 | HM148442 | HM148687 |
| C. vignae | CBS 121.25 | Vigna unguiculata | HM148227 | HM148473 | HM148718 |
| C. xylophilum | CBS 125997 | dead wood of Picea abies | HM148230 | HM148476 | HM148721 |
| C. xylophilum | CBS 113749 | Prunus avium | HM148228 | HM148474 | HM148719 |
| Method | Ctax | Mean Ctax | |||
|---|---|---|---|---|---|
| ABGD | GMYC | PTP | mPTP | ||
| ABGD | - | - | - | - | 0.60 |
| GMYC | 0.71 | - | - | - | 0.62 |
| PTP | 0.68 | 0.87 | - | - | 0.60 |
| mPTP | 0.40 | 0.28 | 0.27 | - | 0.32 |
Publisher’s Note: MDPI stays neutral with regard to jurisdictional claims in published maps and institutional affiliations. |
© 2021 by the authors. Licensee MDPI, Basel, Switzerland. This article is an open access article distributed under the terms and conditions of the Creative Commons Attribution (CC BY) license (https://creativecommons.org/licenses/by/4.0/).
Share and Cite
Becchimanzi, A.; Zimowska, B.; Nicoletti, R. Cryptic Diversity in Cladosporium cladosporioides Resulting from Sequence-Based Species Delimitation Analyses. Pathogens 2021, 10, 1167. https://doi.org/10.3390/pathogens10091167
Becchimanzi A, Zimowska B, Nicoletti R. Cryptic Diversity in Cladosporium cladosporioides Resulting from Sequence-Based Species Delimitation Analyses. Pathogens. 2021; 10(9):1167. https://doi.org/10.3390/pathogens10091167
Chicago/Turabian StyleBecchimanzi, Andrea, Beata Zimowska, and Rosario Nicoletti. 2021. "Cryptic Diversity in Cladosporium cladosporioides Resulting from Sequence-Based Species Delimitation Analyses" Pathogens 10, no. 9: 1167. https://doi.org/10.3390/pathogens10091167
APA StyleBecchimanzi, A., Zimowska, B., & Nicoletti, R. (2021). Cryptic Diversity in Cladosporium cladosporioides Resulting from Sequence-Based Species Delimitation Analyses. Pathogens, 10(9), 1167. https://doi.org/10.3390/pathogens10091167