Article

Dysregulation of Glycerophosphocholines in the Cutaneous Lesion Caused by Leishmania major in Experimental Murine Models

by
Adwaita R. Parab
1,2,
Diane Thomas
3,
Sharon Lostracco-Johnson
3,
Jair L. Siqueira-Neto
3,
James H. McKerrow
3,
Pieter C. Dorrestein
3,4,5 and
Laura-Isobel McCall
1,2,6,*
1
Department of Microbiology and Plant Biology, University of Oklahoma, Norman, OK 73019, USA
2
Laboratories of Molecular Anthropology and Microbiome Research, University of Oklahoma, Norman, OK 73019, USA
3
Skaggs School of Pharmacy and Pharmaceutical Sciences, University of California San Diego, La Jolla, CA 92093, USA
4
Center for Microbiome Innovation, University of California San Diego, La Jolla, CA 92093, USA
5
Collaborative Mass Spectrometry Innovation Center, University of California San Diego, La Jolla, CA 92093, USA
6
Department of Chemistry and Biochemistry, University of Oklahoma, Norman, OK 73019, USA
*
Author to whom correspondence should be addressed.
Pathogens 2021, 10(5), 593; https://doi.org/10.3390/pathogens10050593
Submission received: 15 April 2021 / Revised: 6 May 2021 / Accepted: 10 May 2021 / Published: 13 May 2021
(This article belongs to the Collection Pathology and Parasitic Diseases of Animals)

Abstract

:
Cutaneous leishmaniasis (CL) is the most common disease form caused by a Leishmania parasite infection and considered a neglected tropical disease (NTD), affecting 700,000 to 1.2 million new cases per year in the world. Leishmania major is one of several different species of the Leishmania genus that can cause CL. Current CL treatments are limited by adverse effects and rising resistance. Studying disease metabolism at the site of infection can provide knowledge of new targets for host-targeted drug development. In this study, tissue samples were collected from mice infected in the ear or footpad with L. major and analyzed by untargeted liquid chromatography-tandem mass spectrometry (LC-MS/MS). Significant differences in overall metabolite profiles were noted in the ear at the site of the lesion. Interestingly, lesion-adjacent, macroscopically healthy sites also showed alterations in specific metabolites, including selected glycerophosphocholines (PCs). Host-derived PCs in the lower m/z range (m/z 200–799) showed an increase with infection in the ear at the lesion site, while those in the higher m/z range (m/z 800–899) were decreased with infection at the lesion site. Overall, our results expanded our understanding of the mechanisms of CL pathogenesis through host metabolism and may lead to new curative measures against infection with Leishmania.

1. Introduction

Leishmaniasis affects people in 88 countries worldwide in tropical, subtropical and temperate regions, putting approximately 350 million individuals at risk of infection, with approximately 12 million battling the disease [1]. It is one of the three most impactful vector-borne protozoan neglected tropical diseases, causing approximately 2.1 million DALYs (Disability-Adjusted Life Years) and 51,000 deaths annually. With recent population movements, leishmaniasis is now affecting people in non-endemic regions as well. The expanding spread of leishmaniasis can also be attributed to climate change and social constraints of populations living in poverty and conflict. Leishmaniasis is a disease that is exacerbated by poverty and socio-economic barriers, which subsequently increase the rates of disease progression, mortality and morbidity and the social stigma [2,3].
Leishmaniasis is caused by about 20 different species of the parasite Leishmania, and it is manifested most frequently in three clinical syndromes in humans: visceral, cutaneous (CL) and mucocutaneous leishmaniasis. CL is the most common form of the disease, and symptoms include skin lesions and ulcers on exposed parts of the body. Mucocutaneous leishmaniasis is a disabling form where the lesions can lead to destruction of soft tissue of the nose, mouth, and throat cavities. Of the three clinical forms of the disease, visceral leishmaniasis (kala-azar) is the deadliest, with serious symptoms such as swelling of the liver and spleen, extreme anemia and frequent bouts of fever. Infection is transmitted through female sandflies of the Phlebotomus genus in the Old World and the Lutzomyia genus in the New World. Infected female sandflies bite the mammalian host, regurgitating promastigote-stage parasites into the host’s body. Subsequently, the parasites are taken up by macrophages, neutrophils and dendritic cells. Within the macrophage phagolysosome, promastigotes differentiate into the amastigote stage, which then multiply and affect various tissue types depending on whether infection is initiated by a viscerotropic or dermotropic parasite strain [4,5]. This initiates the clinical manifestations of the disease. Humans as well as other mammals serve as host reservoirs for the parasite [6].
The current course of treatment for CL is usually antimonial drug compounds. These are known to be highly toxic compounds, in addition to the threat of increased parasite resistance to antimony in several regions of the world. Miltefosine, amphotericin B and paromomycin are among the other drugs that are administered for CL treatment, all of which have the drawbacks of high levels of toxicity, increased drug resistance and treatment failure. Miltefosine is also teratogenic and should not be given to women of childbearing age. Treatment failure can be attributed to the characteristics of the host (immune system and nutritional status), of the parasite (mechanisms of survival within the host, drug resistance mechanisms, tissue location, etc.) and of environmental factors such as awareness and treatment accessibility [7]. Approaching disease pathogenesis from a molecular perspective could uncover new mechanisms of infection and aid in developing new cures for leishmaniasis [8].
Alongside genes and proteins, metabolites play an important role in the life of an organism. The metabolome reflects the true functional endpoint of a complex biological system and provides a functional view of the organism by taking into account the sum of its genes, RNA, proteins and its environment [9]. Untargeted metabolomics can help identify metabolites involved in disease pathogenesis in an unbiased fashion, acquiring data across a broad mass range [10]. For example, untargeted metabolomics has shown that miltefosine’s mode of action in vitro may be related to modulation of the parasite lipid metabolism, particularly increased levels of by-products of lipid turnover [11]. Importantly, miltefosine was originally designed as a cancer treatment and thus may also target the host glycerophosphocholine (PC) metabolism [12]. PCs are important membrane constituents but also play regulatory and signaling roles, particularly pro-inflammatory [13]
The overall aim of this work was to perform an untargeted metabolic analysis of CL lesions in mice infected with Leishmania major. Our results showed significant changes in the host metabolism, specifically concerning PCs, in the skin lesions of CL.

2. Results

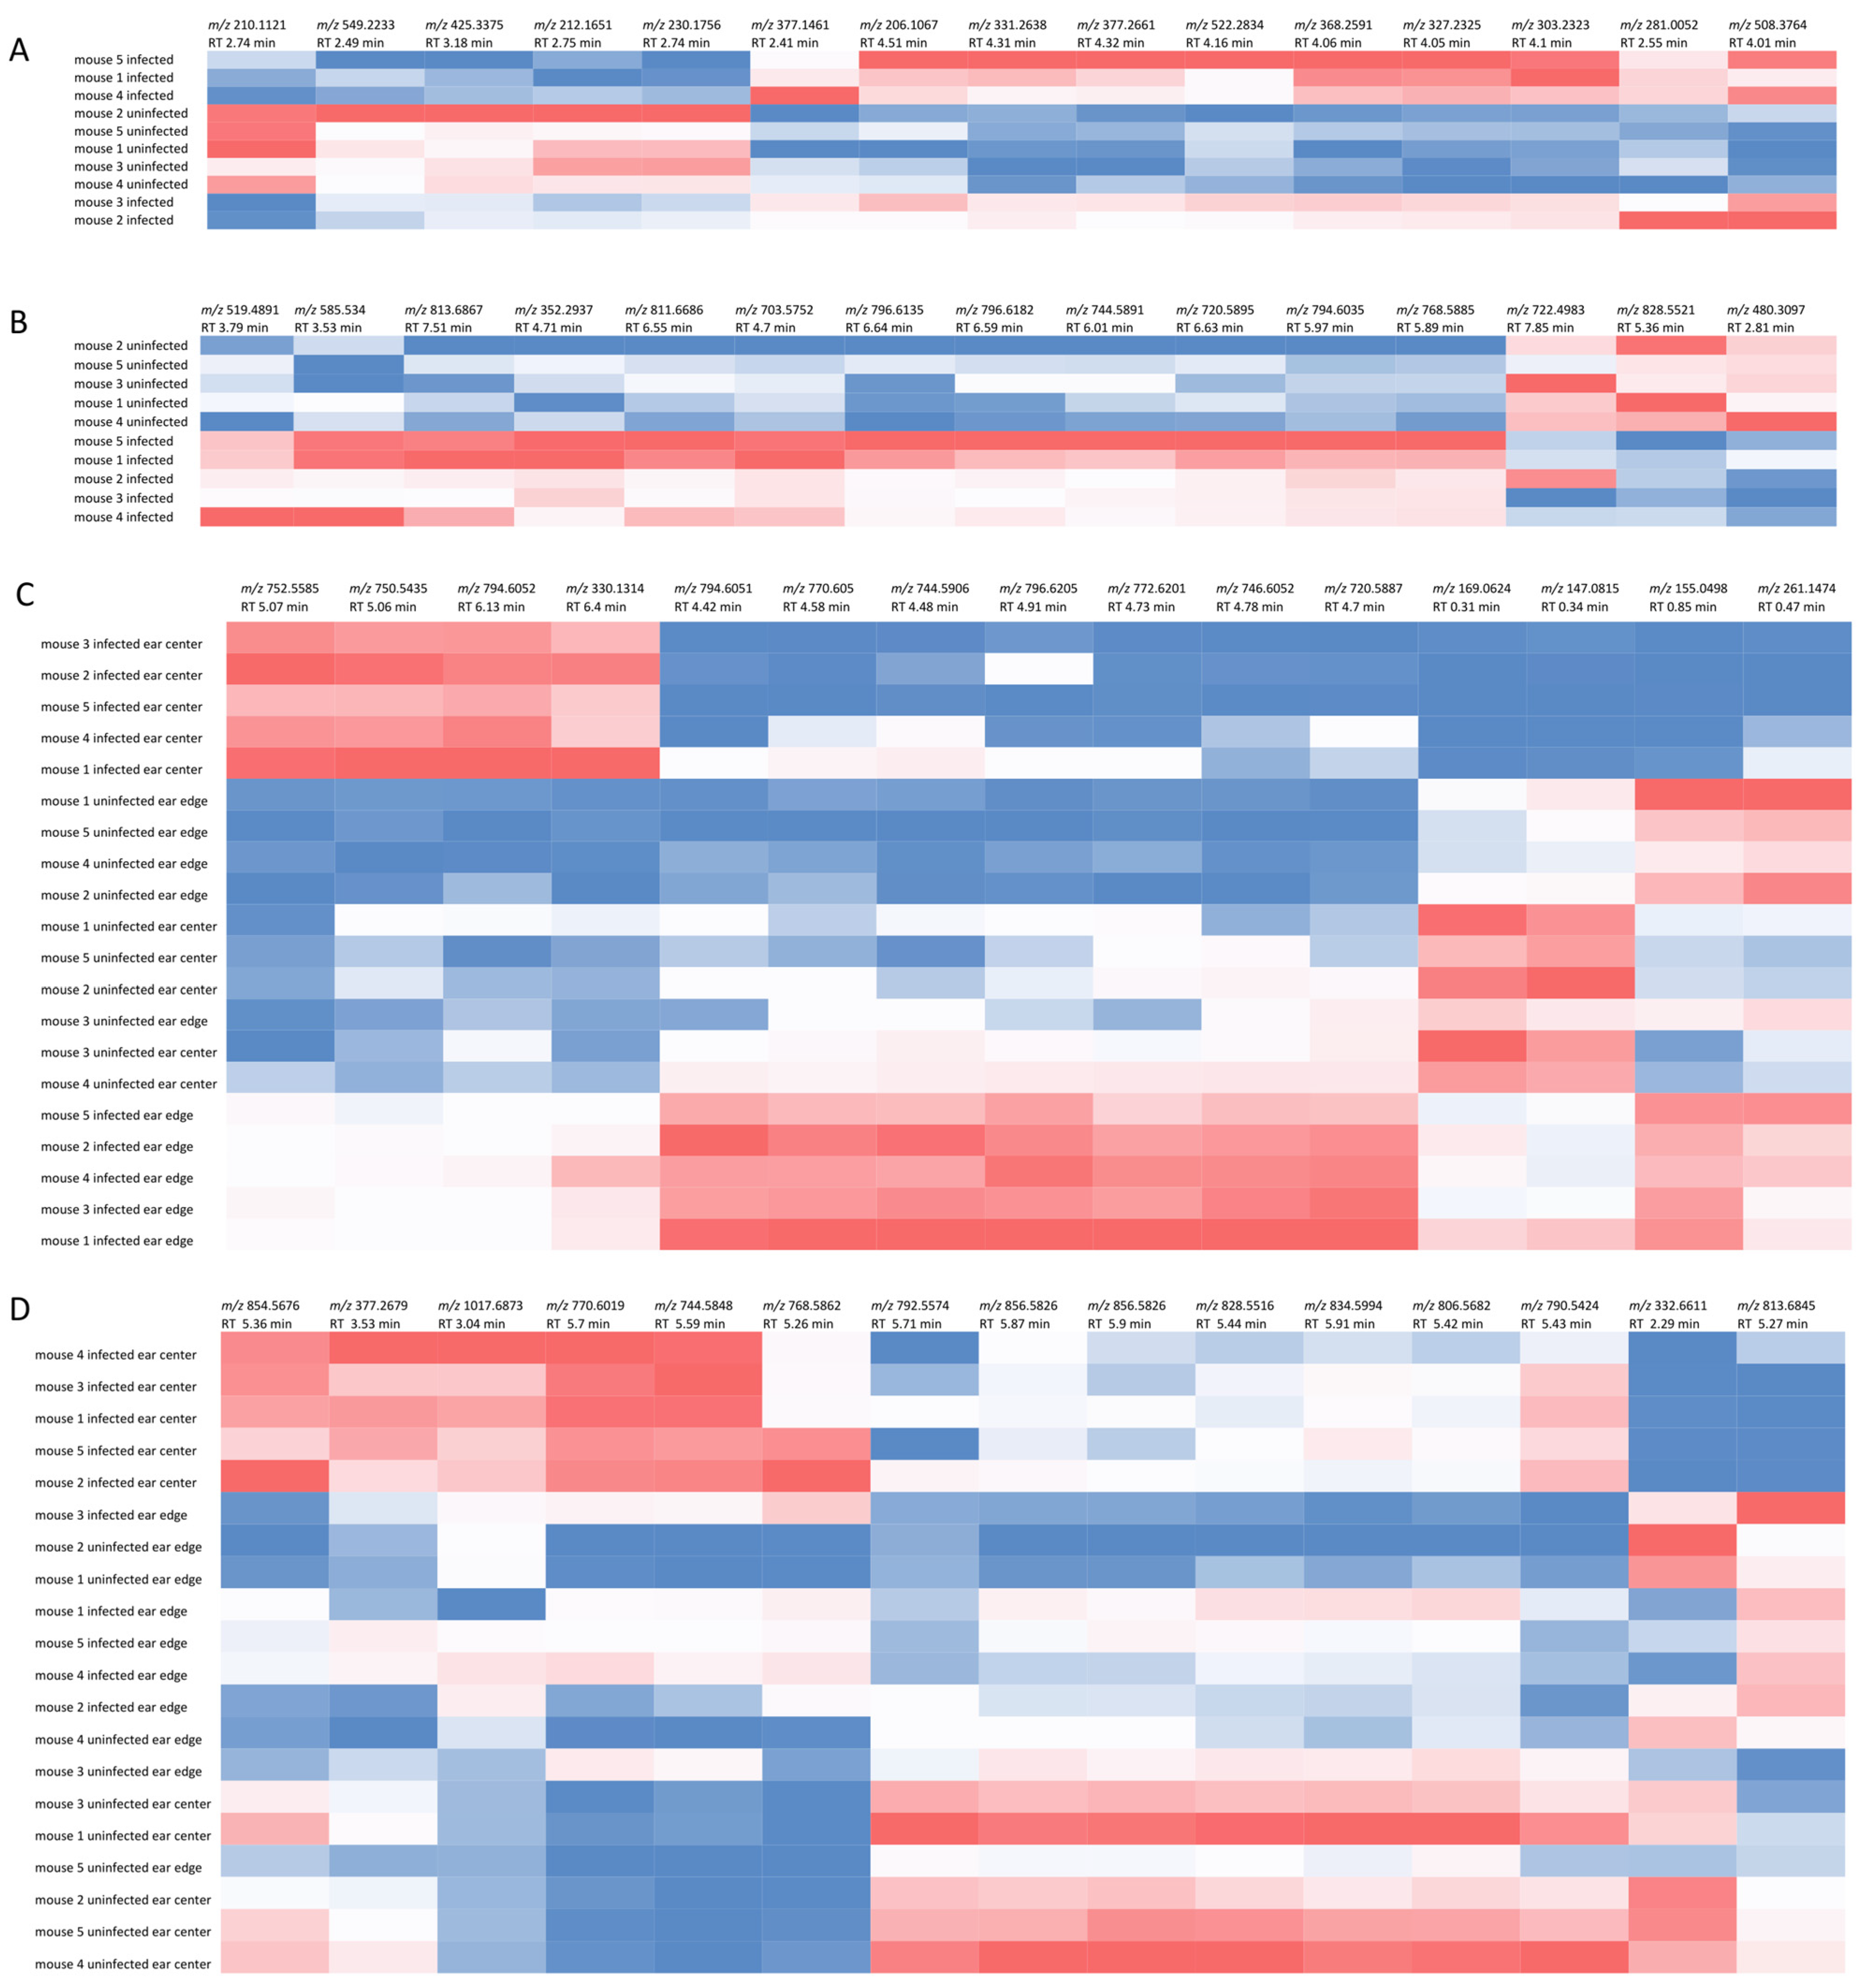
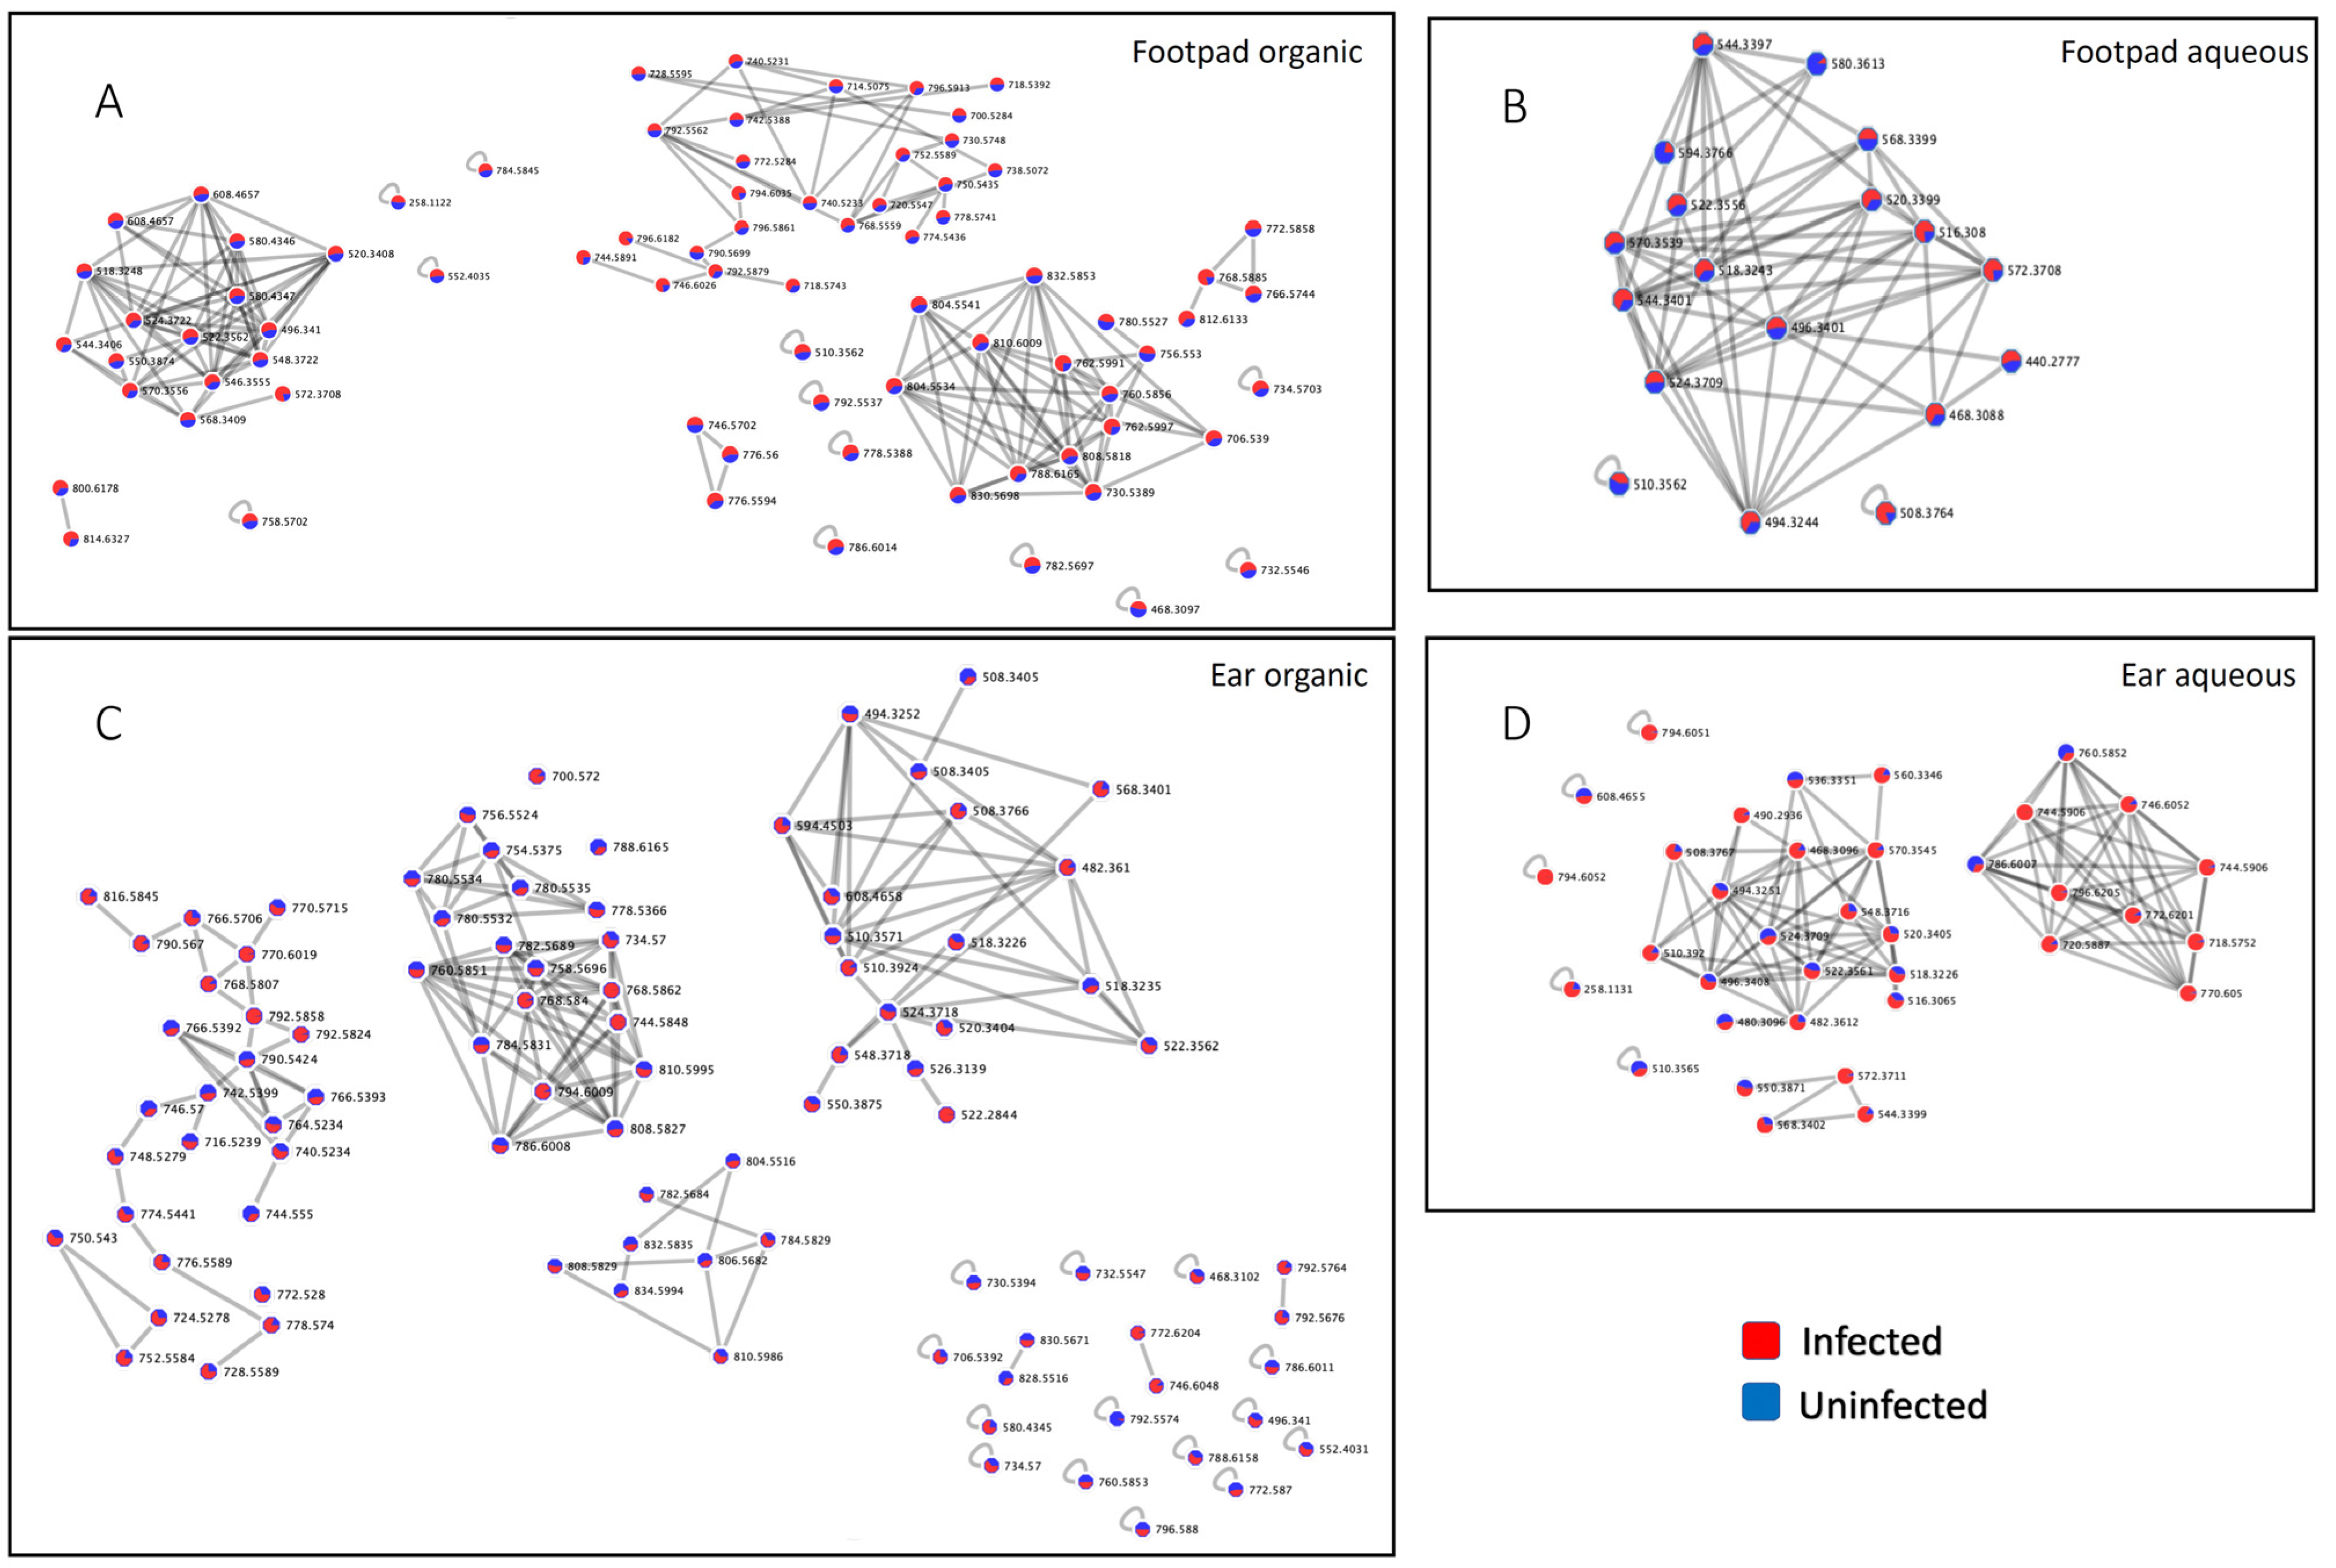
2.1. Overall Impact of L. major Infection on Ear and Footpad Metabolism

To understand better the impact of infection on tissue metabolites, we analyzed overall and specific metabolite differences in the presence and absence of infection with Leishmania major at sites of lesion and lesion-adjacent sites (with no visible signs of infection). BALB/c mice were injected intradermally in the ear or subcutaneously in the footpad with L. major parasites. Eight weeks post-infection, samples were collected from the area where the parasites were injected, which showed skin lesions (“infected ear center”), the surrounding area that appeared infection-free (“infected ear edge”), and the matched tissue regions from the uninfected ear (“uninfected ear center”, “uninfected ear edge”) (Figure 1A). Metabolites were extracted with aqueous and organic solvents and analyzed by untargeted LC-MS/MS (see Materials and Methods). Overall, for both aqueous and organic extractions, distinct global metabolite profiles were observed by Principal Coordinate Analysis (PCoA) for the infected ear center compared to the infected ear edge (PERMANOVA p < 0.01, aqueous extraction R2 = 0.743, organic extraction R2= 0.643), to the uninfected ear center (PERMANOVA p < 0.01, aqueous extraction R2 = 0.739, organic extraction R2 = 0.805) and to the uninfected ear edge (PERMANOVA p < 0.01, aqueous extraction R2 = 0.288, organic extraction R2 = 0.248). In contrast, no significant differences for both aqueous and organic extracts by PCoA analysis in terms of overall metabolite profile were observed between the infected ear edge and the uninfected ear samples (Figure 1B,C, PERMANOVA p > 0.1). Thus, L. major infection changes the overall tissue chemical composition at the lesion location in the ear. In contrast, the impact of L. major infection on the overall footpad metabolite profile for the organic (PERMANOVA p = 0.218 R2 = 0.156) and aqueous (PERMANOVA p = 0.244 R2 = 0.146) extractions was much less significant.
Random forest machine learning analysis [14] was performed to identify the metabolites most affected by infection in both experimental systems, with annotation performed using molecular networking and GNPS [15]. Annotatable molecules most highly affected by infection include metabolites of the glycerophosphocholine family of phospholipids, including PC O-38:5 (m/z 794.6051 RT 4.42 min), PC O-36:3 (m/z 770.605 RT 4.58 min), PC O-36:4 (m/z 768.5862 RT 5.26 min) and PC 37:7 (m/z 790.5424 RT 5.42 min). Glutamine and eicosatrienoic acid were also affected by infection (Figure 2 and Figure S1, Table 1, Table 2, Table 3 and Table 4). Glutamine was decreased with infection at the site of the ear lesion (Wilcoxon rank sum test p value = 0.008 comparing to the uninfected ear center, Figure 1D), although it was unaffected by infection in the footpad. Eicosatrienoic acid was increased in the infected footpad (Wilcoxon rank sum test p value = 0.008). PE(18:1/0:0) (m/z 480.3097 RT 2.81 min) was also increased by infection in the footpad (Wilcoxon rank sum test p value = 0.008).

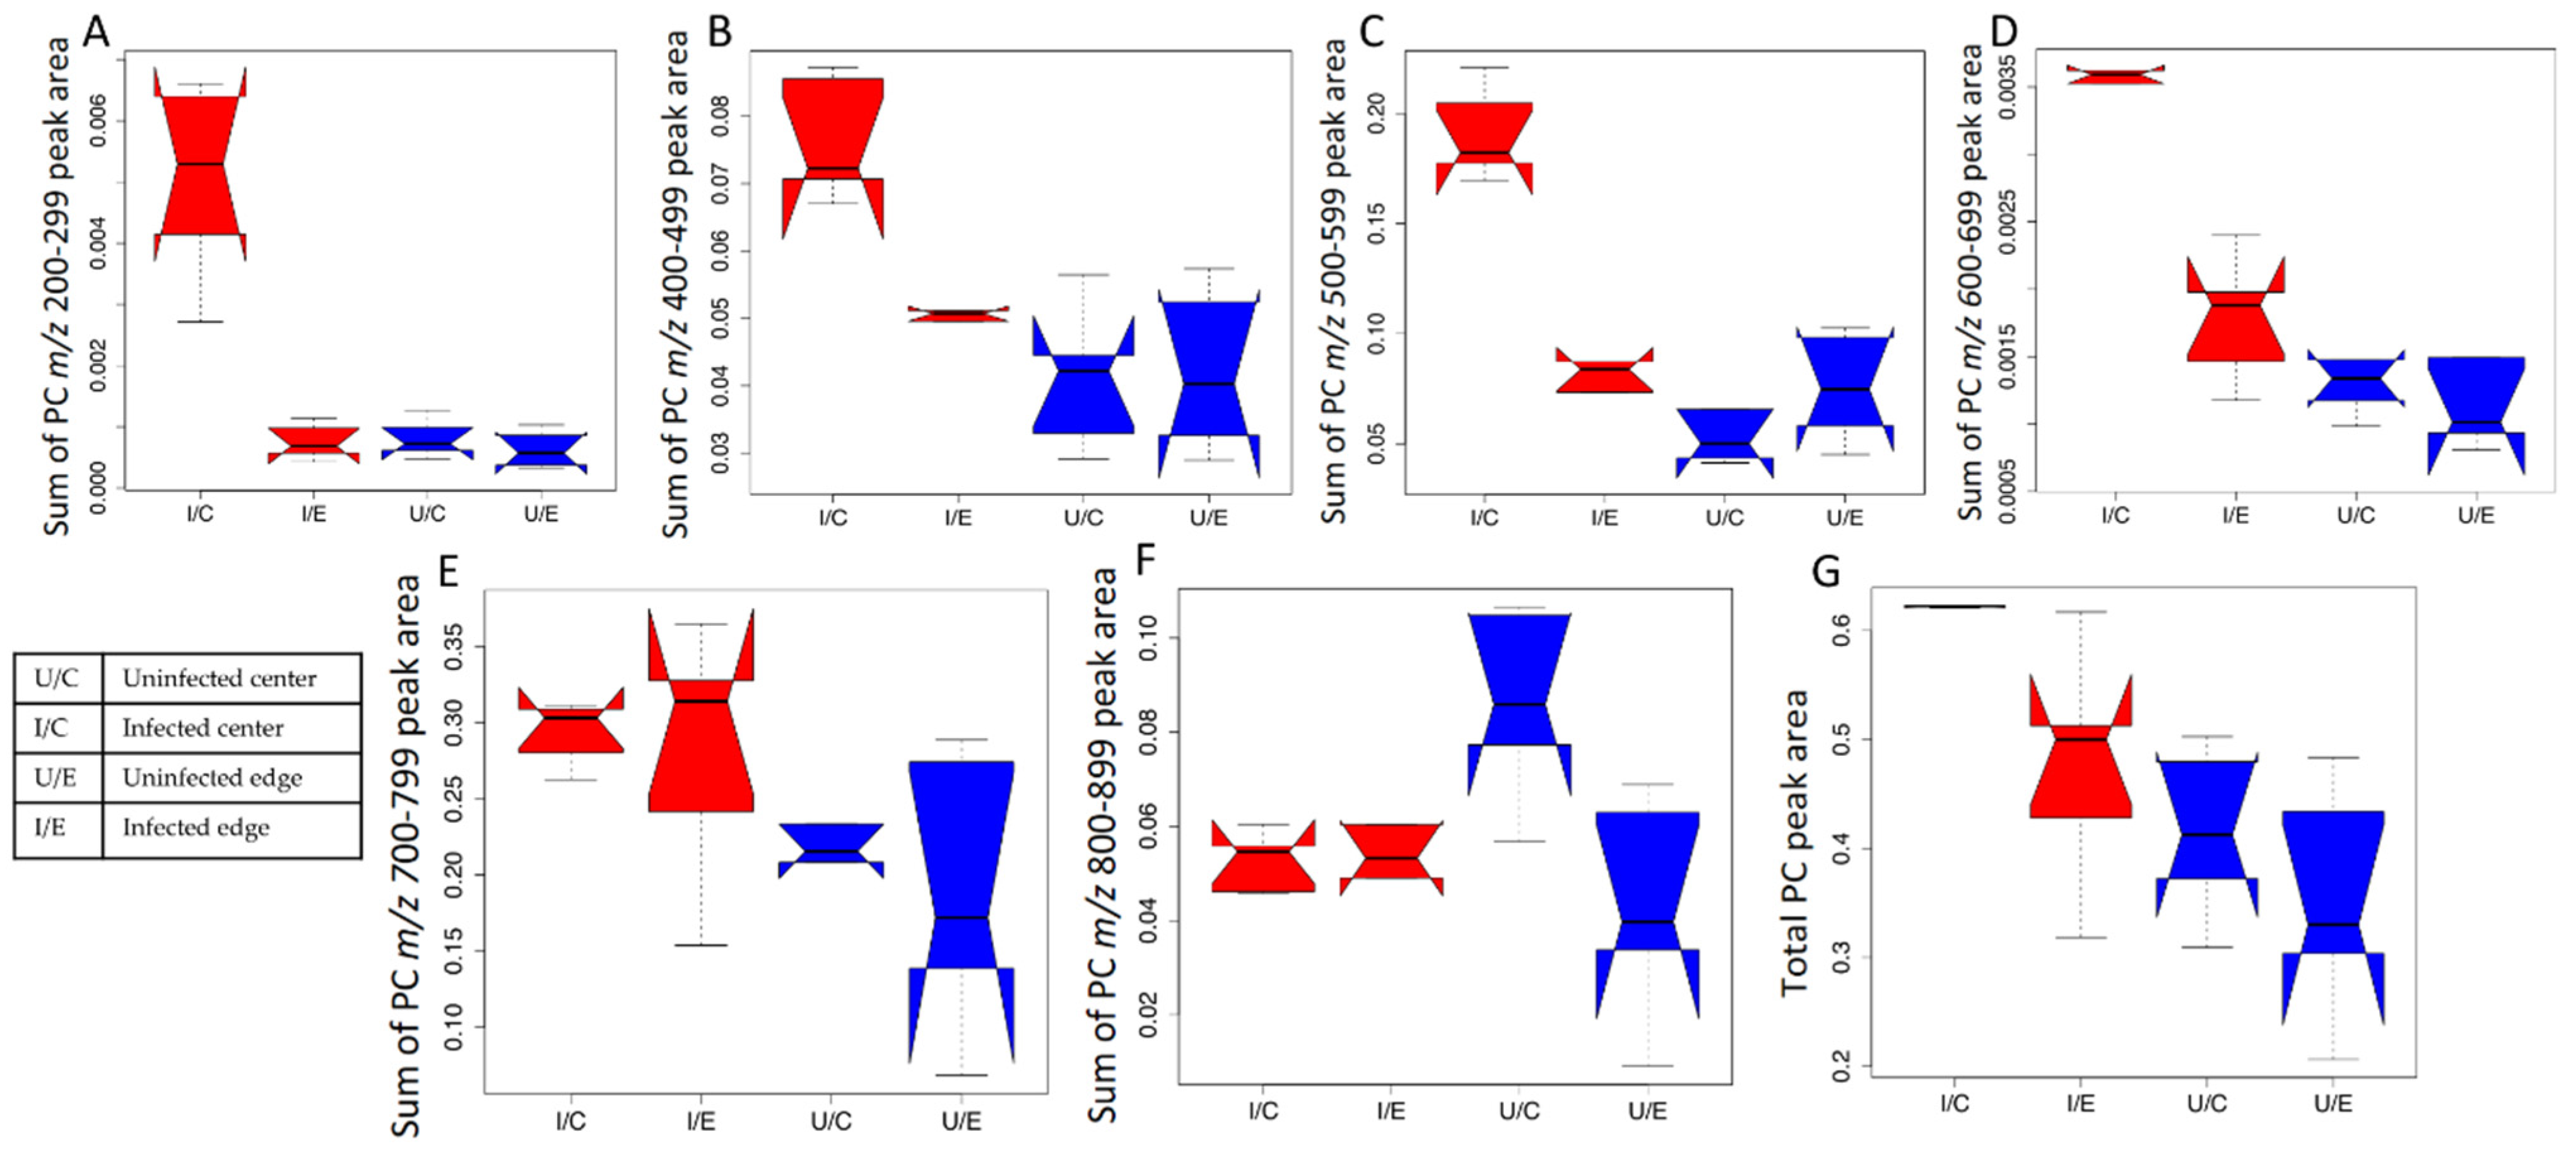
2.2. Impact of L. major Infection on Tissue PCs

Given that many of the differential molecules are PCs, we investigated the impact of infection on this family in greater detail. Molecular network analysis of the PC family molecules in both aqueous and organic ear extracts showed that most detected PCs were strongly increased by infection (Figure 3). In particular, the infected group was significantly higher than the uninfected group for PCs in the lower mass ranges of m/z 200–299, 400–499, 500–599 and 600–699 (Wilcoxon rank sum test p value < 0.05). PCs in these mass ranges were also significantly higher in the infected ear center compared to the infected ear edge, to the uninfected ear center and to the uninfected ear edge (Wilcoxon rank sum test p value < 0.05 for each pairwise comparison, Figure 4A–D). PC levels in the mass range of m/z 700–799, and total PCs were significantly increased in the infected group in comparison to the uninfected group (Wilcoxon rank sum test p value < 0.05, Figure 4E,G). A reverse trend was observed in the mass range of m/z 800–899 where the PC levels were significantly higher in the uninfected ear center in comparison to the infected ear center (Figure 4F). Given that almost all PCs were detected in both infected and uninfected samples, albeit at differential abundances, they are either host-derived or commonly produced by both parasite and host. No PCs were detected in the m/z 300–399 range. Likewise, most PCs were increased by infection in the footpad (Table 3 and Table 4, Figure 3). These results indicate that PCs are strongly affected by cutaneous Leishmania infection. In addition, our observation that specific PCs as well as PCs of multiple m/z ranges are also affected at lesion-adjacent sites (“infected ear edge”) indicates that infection-induced metabolic perturbations are not restricted to the lesion site, revealing a better picture of what is happening to the host during the disease state and providing clues to the pathways involved.

3. Discussion

The metabolome provides a link between genotype and phenotype by identifying changes occurring at the molecular level, for example, when parasites and their hosts interact [16]. Metabolism is also an indicator of the host physiological state. Understanding the infection-induced host metabolic alterations could lead to the identification of potential targets and subsequently to drug development for parasitic diseases [17], particularly host-targeted drug therapy focused on pathways otherwise redundant to the host but important for parasite invasion, replication and survival [18], or on mitigating damage caused by the parasite [17]. In addition, changes in the host plasma metabolite abundance, including pyruvate, taurine and N-acetylglutamine, can serve as an indicator of response to CL treatment [19]. Several studies previously investigated Leishmania and host metabolism during in vitro macrophage infection [20,21,22,23], or in amastigotes purified from mouse granulomatous lesions [24], but there is still a lack of knowledge of host metabolic responses during in vivo infection.
We cannot exclude the possibility that detected metabolites are produced by both host and parasite. However, we estimate that most infection-associated metabolites identified in our study are nevertheless host-derived for the following reasons: the relative host vs parasite biomass and our instrumental limit of detection; the slow replication of Leishmania during in vivo infection [24]; the fact that lesion-derived amastigote PC composition significantly differs from the mouse tissue PC composition [25]; most detected metabolites in our study are found in both infected and uninfected samples, including PCs (see Figure 3). Our results therefore expand our understanding of host metabolic contributions to CL pathogenesis. We note the following exceptions with regards to PCs: m/z 770.605 RT 4.58 min, annotated as PC O-36:3 and m/z 772.6201 RT 4.73 min, annotated as PC O-36:2, which were only detected in the infected ear edge and not in the uninfected samples. These findings concur with data from Moitra et al, which only detected these PCs in amastigotes and not in uninfected mouse tissue [25]. These findings should however be interpreted with caution, as these PCs are all listed as “endogenous” in the Human Metabolome Database (HMDB) [26,27]. Thus, they all have at least the potential to be host-derived but infection-induced.
Amongst annotatable metabolites in our study, members of the PC family were most affected by infection in both intradermal ear infection and subcutaneous footpad infection models. PCs of the m/z range 200–799 and total PCs were significantly higher with infection at the site of the ear infection (infected ear center) (Figure 4). PCs were also increased in the infected footpad (Table 3 and Table 4, Figure 3). This increase concurs with prior reports of elevated lysophosphatidylcholine (LPC) and PCs in infected macrophages in vitro [23,28]. Concordance between infection models supports our approach and translatability of results.
LPC has immunomodulatory roles that promote parasite growth [29]. PC elevation may also reflect increased membrane turnover during infection and modulate immune responses [30]. For example, PC biosynthesis is a critical component of Golgi membrane remodeling following TLR4 engagement and is required for secretion of TNFα and interleukin 6 cytokines [31]. TLR4 is required for control of L. major infection [32]. Elevation of PCs is also a marker of the switch from monocyte to macrophage [33]. Increased PCs may also reflect phagolysosome membranes given the intracellular lifestyle of L. major [30], though PC elevation was also observed during infection with T. cruzi, which resides in the cytosol [34,35]. Lastly, PCs may also be derived from other immune cells attracted to the site of infection, such as T cells and dendritic cells. The absence or low levels of these cells in uninfected tissue would account for the absence of these PCs in uninfected or lesion-adjacent sites.
Miltefosine is a commonly administered oral drug for the treatment of visceral leishmaniasis and CL that targets the PC biosynthetic pathway, inhibiting phosphatidylethanolamine-N-methyltransferase and activating phospholipase A2 in Leishmania [36]. In mammalian cells, miltefosine also decreases phosphatidylethanolamine-N-methyltransferase activity, while also decreasing membrane-bound CTP:phosphocholine cytidylyltransferase activity, leading to reduced levels of PCs [12]. Thus, it may be expected to proceed via host-directed effects in addition to impacts on parasite metabolism. This is further supported by recent observations that PC biosynthesis is dispensable in Leishmania amastigotes [25]. We therefore speculate that the mechanism of action of miltefosine in CL may thus involve re-normalization of infection-induced changes in host PCs and restriction of the parasite’s ability to scavenge host PCs. Future studies are thus needed to investigate the mechanism of action of miltefosine with respect to the host metabolism in CL in vivo.
Additional annotatable infection-affected metabolites also included the omega-3 fatty acid eicosatrienoic acid and glutamine. Glutamine was significantly lower with infection at the site of the ear lesion but was unaffected by infection in the footpad. These findings contrast with the metabolomic profiling of L. amazonensis-infected macrophages, which showed increased glutamine levels [22]. A recent study in mice infected with L. donovani, however, showed heightened glutamine consumption with infection and a role of glutamine supplementation in clearing parasite load [37], which concur with our findings. Future studies should aim to look at the specific functional role of the glutamine metabolism in L. major infection.
The clinical presentations of CL lesions can vary, and lesions are capable of self-healing in some cases. However, resolving them can take several months to years, leaving a significant amount of scarring. In cases of Post-Kala Azar dermal leishmaniasis, patients can continue to serve as a reservoir for the parasites after the lesions have long been healed [38]. Our results showed significant perturbations in the metabolism of the skin lesions, with the area near the skin lesions also being affected in experimental CL. Our study relied on bioluminescence to measure parasite burden and as such we cannot ascertain whether parasites were still present at low levels in the sites adjacent to the skin lesions. There is therefore still a strong need to understand the role of lesion-free tissues in the transmission of Leishmania and in disease pathogenesis. However, our results are consistent with findings of microbiota dysbiosis in lesion-adjacent tissues in humans and in lesion-free cutaneous sites in mice [39].
This study looked at both ear and footpad infection models, although the effect of infection on metabolism in the footpad was found to be less significant than in the ear. Nevertheless, PC family metabolites were increased with infection in both sites, showcasing similarities in pathogenesis processes between these two infection models. These similarities are particularly striking given differences in pathogenic processes between ear and footpad models, including differences in the elicited immune response [40,41] and vaccine-mediated protection [42]. These differences in immune cell recruitment may account for the observed differences in the infection-elicited PC profile.
While this untargeted metabolomics study enabled us to uncover several metabolic pathways affected in CL, on average, compounds that could not be directly annotated (level 2 annotations according to metabolites standards initiative [43]) still represent 71.11% of our data. Molecular networking did enable us to extend annotations further, so that 41.6% of our top 15 most differential metabolite features identified by random forest had at least family-level (level 3) annotations [43]. Nevertheless, metabolomics annotation rates are continuously improving. Our results were deposited in a “living data” database [15], where they are continuously being re-annotated as reference libraries and computational tools expand. As such, they will continue to yield expanding insights into CL pathogenesis and serve as a building point for expanded studies of metabolism in CL. Such results will help guide the next generation of CL drug treatments.

4. Materials and Methods

4.1. In Vivo Experimentation

Female BALB/c mice (6–8 week-old) were injected intradermally in the left ear with 1 × 10⁶ luciferase-expressing L. major strain LV39 promastigotes (n = 5) or in the left rear footpad with 5 × 10⁶ luciferase-expressing L. major strain LV39 promastigotes in PBS (n = 5) [44]. These inocula were selected based on standard inocula for each model [45,46]. Bioluminescence imaging was performed on an IVIS Lumina LT Series III instrument (Perkin Elmer), and data were processed using Living Image 4.5 software (Perkin Elmer, https://www.perkinelmer.com/product/li-software-for-spectrum-1-seat-add-on-128113, used September 2016–May 2021). Upon euthanasia, infected and uninfected ear tissue, including the entirety of the lesion area (“infected ear center”) and the entirety of the surrounding, macroscopically-healthy surrounding area (“infected ear edge”), as well as matched positions from the other, uninfected ear (“uninfected ear center”, “uninfected ear edge”) were collected 8 weeks post-infection and immediately snap-frozen. Upon euthanasia, infected and uninfected footpads were collected 7 weeks post-infection; lesion tissue was scraped off above the footpad bones and collected in its entirety, with matched tissue collected from the other, uninfected footpad. The entirety of the tissue was immediately snap-frozen. Samples were stored at −80 °C until metabolite extraction. Parasites were maintained at 28 °C in M199 medium (Sigma) supplemented with 10% fetal bovine serum (Sigma), 1% penicillin-streptomycin, RPMI 1640 vitamin mix (1%), HEPES (25 mM), adenosine (100 μM), glutamine (1 mM), hemin (0.005%), NaHCO3 (12 mM) and folic acid (10 μM) (pH 7.2) [47].

4.2. LC-MS/MS

Metabolite extraction, liquid chromatography and mass spectrometry were performed as previously described [48]. Briefly, metabolites were extracted by homogenization in a Tissuelyzer using a 5 mm stainless steel bead (Qiagen) in 50% methanol (aqueous extract) followed by 3:1 dichloromethane:methanol (organic extract). LC was performed on an UltiMate 3000 UHPLC (Thermo Scientific, Waltham, MA, USA) with Phenomenex UHPLC 1.7 µm 100 Å Kinetex C8 column (50 × 2.1 mm), and with water and 0.1% formic acid as mobile phase A and acetonitrile and 0.1% formic acid as mobile phase B, flow rate of 0.5 mL/min and column temperature of 40 °C. LC gradient parameters were optimized for each extraction with regards to overall chromatogram peak shape (Table 5). Daily MS calibration was performed with the ESI-L Low Concentration Tuning Mix, which covers m/z 118.086 to 2721.895 (Agilent Technologies). The internal calibrant (lock mass) Hexakis(1H,1H,3H-tetrafluoropropoxy)phosphazene (Synquest Laboratories), m/z 922.009798, was present throughout the run, as previously described [48,49,50]. MS was performed in the positive mode on a Maxis Impact HD QTOF mass spectrometer (Bruker); instrumental parameters are listed in Table 6. MS/MS data for each run was collected by fragmentation of the ten most intense ions, in a range of 80–2000 m/z, with active exclusion after 4 spectra and release after 30 s. Instrumental performance controls included solvent blanks, pooled quality controls for each tissue type and a standard mix of 6 molecules (sulfamethazine, sulfadimethoxine, sulfachloropyridazine, coumarin-314, sulfamethizole, amitriptyline). To avoid any confounding from run order, we alternated between samples from infected and uninfected animals.

4.3. LC-MS/MS Data Analysis

LC-MS/MS data were processed using MZmine 2.37 [51], with parameters as shown in Table 7.
Features with a peak area within 3-fold of peak area in blanks were removed. Normalization to total peak area (Total ion current (TIC) normalization) and data processing were performed in Jupyter notebook in R [52]. Principal Coordinate Analysis (PCoA) was done using the Bray-Curtis dissimilarity matrix implemented in QIIME1 [53], and PERMANOVA calculations were performed using the R package “vegan” to compare the chemical similarity of samples from the four groups of varying condition and position of infection [54,55]. EMPeror was used to visualize PCoA plots [56]. The randomForest package in R was used to find variables of importance associated with infection and sampling conditions, using 7000 trees [14]. The Global Natural Products Social Molecular Networking platform (GNPS) was used to annotate molecules from spectral library references and to perform feature-based molecular networking [15,57,58]. The following parameters were used in GNPS: precursor ion mass tolerance of 0.02 Da, fragment ion mass tolerance of 0.02 Da, minimum cosine score of 0.7 and 4 or more matched fragment ions. The maximum shift allowed between two MS/MS spectra was 500 Da, 10 maximum neighbor nodes allowed and a maximum difference between the precursor ion mass of searched MS/MS spectrum and library spectra was 100 Da. Spectral matches were evaluated by considering cosine scores, quality of mirror plots, as well as the number of matched peaks. Molecular network visualization was done in Cytoscape 3.7.2 [59]. All members of the PC subnetworks were visually inspected and verified to contain the diagnostic MS/MS peaks with m/z 184.08 (phosphocholine), m/z 125.00 (2,2-Dihydroxy-1,3,2-dioxaphospholan-2-ium) and m/z 86.10 (N,N,N-Trimethylethenaminium) from the phospholipid head group. Putative annotations for members of the PC subnetworks that were not available through spectral matching in GNPS were obtained using LipidMaps [60]. Notched box plots showing metabolite feature abundance for the four different groups (infected/uninfected vs. center/edge) for the ear samples and two different groups (infected vs. uninfected) for the footpad samples along with non-parametric two-tailed Wilcoxon statistical tests were both performed in R. Boxplot whiskers represent the lowest and largest data points, and non-overlapping boxplot notches indicate different medians between groups (95% confidence) [61]. Molecular formula prediction was performed using SIRIUS version 4.5.1 [62], allowing 30 ppm mass deviation, with 10 candidates, searching all available databases and considering [M+H]+, [M+K]+ and [M+Na]+ ions. Allowed elements were: C, H, N, O, P, S. The formula with the highest Sirius Score is presented here.

Supplementary Materials

The following are available online at https://www.mdpi.com/article/10.3390/pathogens10050593/s1, Figure S1. Mirror plots for differential annotatable metabolites. (A) m/z 746.6052 RT 4.78 min, PC O-16:0/18:1. (B) m/z 147.0815 RT 0.34 min, Glutamine. (C) m/z 792.5574, RT 5.71 min, PC O-16:0/22:6. (D) m/z 303.2323, RT 4.1 min, 5,6-Epoxy-8Z,11Z,14Z-eicosatrienoic acid from NIST14. (E) m/z 508.3764, RT 4.01 min, PC P-18:0/0:0. Figure S2. Bioluminescent imaging confirms parasite persistence. Left, ear. Right, footpad. Table S1. All annotatable PC metabolites for ear organic extraction. Table S2. All annotatable PC metabolites for ear aqueous extraction. Table S3. All annotatable PC metabolites for footpad organic extraction. Table S4. All annotatable PC metabolites for footpad aqueous extraction.

Author Contributions

Conceptualization, L.-I.M.; methodology, L.-I.M.; formal analysis, A.R.P. and L.-I.M.; investigation, A.R.P., D.T., S.L.-J. and L.-I.M.; resources, J.L.S.-N., J.H.M., P.C.D. and L.-I.M.; data curation, A.R.P. and L.-I.M.; writing—original draft preparation, A.R.P. and L.-I.M.; writing—review and editing, A.R.P. and L.-I.M.; visualization, A.R.P. and L.-I.M.; supervision, L.-I.M.; project administration, L.-I.M.; funding acquisition, L.-I.M. All authors have read and agreed to the published version of the manuscript.

Funding

Data collection was supported by a postdoctoral fellowship from the Canadian Institutes of Health Research, award number 338511 to L-IM (www.cihr-irsc.gc.ca/). Work in the McCall laboratory at the University of Oklahoma is supported by start-up funds from the University of Oklahoma (http://www.ou.edu/). This work was also partially supported by the U.S. National Institutes of Health (NIH) grant 5P41GM103484-07 to PCD (www.nih.gov/). We further acknowledge the NIH Grant GMS10RR029121 (www.nih.gov/) and Bruker (www.bruker.com/) for the shared instrumentation infrastructure that enabled this work (to PCD). The funders had no role in study design, data collection and analysis, decision to publish or preparation of the manuscript.

Institutional Review Board Statement

All vertebrate animal studies were performed in accordance with the USDA Animal Welfare Act and the Guide for the Care and Use of Laboratory Animals of the National Institutes of Health, under a protocol approved by the University of California San Diego Institutional Animal Care and Use Committee (protocol S14187; AAALAC Accreditation Number 000503).

Informed Consent Statement

Not applicable.

Data Availability Statement

Data were deposited in MassIVE (massive.ucsd.edu, accession numbers MSV000081004 (ear) and MSV000080239 (footpad)). Molecular networking can be accessed here: https://gnps.ucsd.edu/ProteoSAFe/status.jsp?task=451754c383de461e9e4abdf6eb3199d2 (aqueous ear extraction), https://gnps.ucsd.edu/ProteoSAFe/status.jsp?task=0d092bbb213347c3bd7a19b9cae2bcf4 (organic ear extraction), https://gnps.ucsd.edu/ProteoSAFe/status.jsp?task=eccdfd5f15be491b8993084c010467ef (aqueous footpad extraction), https://gnps.ucsd.edu/ProteoSAFe/status.jsp?task=ecc0d126d74f4e6e8e3d599296d8f6e2 (organic footpad extraction).

Acknowledgments

Luciferase-expressing L. major parasites were provided by Martin Olivier, McGill University.

Conflicts of Interest

The authors declare no conflict of interest. The funders had no role in the design of the study; in the collection, analyses or interpretation of data; in the writing of the manuscript or in the decision to publish the results.

References

  1. Georgiadou, S.P.; Makaritsis, K.P.; Dalekos, G.N. Leishmaniasis Revisited: Current Aspects on Epidemiology, Diagnosis and Treatment. J. Transl. Int. Med. 2015, 3, 43–50. [Google Scholar] [CrossRef] [PubMed] [Green Version]
  2. Alvar, J.; Yactayo, S.; Bern, C. Leishmaniasis and Poverty. Trends Parasitol. 2006, 22, 552–557. [Google Scholar] [CrossRef]
  3. Bern, C.; Maguire, J.H.; Alvar, J. Complexities of Assessing the Disease Burden Attributable to Leishmaniasis. PLoS Negl. Trop. Dis. 2008, 2, e313. [Google Scholar] [CrossRef]
  4. McCall, L.-I.; Zhang, W.-W.; Matlashewski, G. Determinants for the Development of Visceral Leishmaniasis Disease. PLoS Pathog. 2013, 9, e1003053. [Google Scholar] [CrossRef] [Green Version]
  5. McCall, L.-I.; McKerrow, J.H. Determinants of Disease Phenotype in Trypanosomatid Parasites. Trends Parasitol. 2014, 30, 342–349. [Google Scholar] [CrossRef] [PubMed]
  6. Burza, S.; Croft, S.L.; Boelaert, M. Leishmaniasis. Lancet 2018, 392, 951–970. [Google Scholar] [CrossRef]
  7. Ponte-Sucre, A.; Gamarro, F.; Dujardin, J.-C.; Barrett, M.P.; López-Vélez, R.; García-Hernández, R.; Pountain, A.W.; Mwenechanya, R.; Papadopoulou, B. Drug Resistance and Treatment Failure in Leishmaniasis: A 21st Century Challenge. PLoS Negl. Trop. Dis. 2017, 11, e0006052. [Google Scholar] [CrossRef]
  8. Bueno-Marí, R.; Jiménez-Peydró, R. Global Change and Human Vulnerability to Vector-Borne Diseases. Front. Physiol. 2013, 4, 158. [Google Scholar] [CrossRef] [Green Version]
  9. Deidda, M.; Piras, C.; Bassareo, P.P.; Dessalvi, C.C.; Mercuro, G. Metabolomics, a Promising Approach to Translational Research in Cardiology. IJC Metab. Endocr. 2015, 9, 31–38. [Google Scholar] [CrossRef]
  10. Vinayavekhin, N.; Saghatelian, A. Untargeted Metabolomics. Curr. Protoc. Mol. Biol. 2010. [Google Scholar] [CrossRef]
  11. Vincent, I.M.; Weidt, S.; Rivas, L.; Burgess, K.; Smith, T.K.; Ouellette, M. Untargeted Metabolomic Analysis of Miltefosine Action in Leishmania Infantum Reveals Changes to the Internal Lipid Metabolism. Int. J. Parasitol. Drugs Drug Resist. 2014, 4, 20–27. [Google Scholar] [CrossRef] [PubMed] [Green Version]
  12. Jiménez-López, J.M.; Ríos-Marco, P.; Marco, C.; Segovia, J.L.; Carrasco, M.P. Alterations in the Homeostasis of Phospholipids and Cholesterol by Antitumor Alkylphospholipids. Lipids Health Dis. 2010, 9, 33. [Google Scholar] [CrossRef] [PubMed] [Green Version]
  13. O’Donnell, V.B.; Rossjohn, J.; Wakelam, M.J.O. Phospholipid Signaling in Innate Immune Cells. J. Clin. Investig. 2018, 128, 2670–2679. [Google Scholar] [CrossRef] [PubMed]
  14. Breiman, L. Random Forests. Mach. Learn. 2001, 45, 5–32. [Google Scholar] [CrossRef] [Green Version]
  15. Wang, M.; Carver, J.J.; Phelan, V.V.; Sanchez, L.M.; Garg, N.; Peng, Y.; Nguyen, D.D.; Watrous, J.; Kapono, C.A.; Luzzatto-Knaan, T.; et al. Sharing and Community Curation of Mass Spectrometry Data with Global Natural Products Social Molecular Networking. Nat. Biotechnol. 2016, 34, 828–837. [Google Scholar] [CrossRef] [Green Version]
  16. Newsom, S.N.; McCall, L.-I. Metabolomics: Eavesdropping on Silent Conversations between Hosts and Their Unwelcome Guests. PLoS Pathog. 2018, 14, e1006926. [Google Scholar] [CrossRef]
  17. Hossain, E.; Khanam, S.; Wu, C.; Lostracco-Johnson, S.; Thomas, D.; Katemauswa, M.; Gosmanov, C.; Li, D.; Woelfel-Monsivais, C.; Sankaranarayanan, K.; et al. Mapping of Host-Parasite-Microbiome Interactions Reveals Metabolic Determinants of Tropism and Tolerance in Chagas Disease. Sci. Adv. 2020, 6, eaaz2015. [Google Scholar] [CrossRef]
  18. Varikuti, S.; Jha, B.K.; Volpedo, G.; Ryan, N.M.; Halsey, G.; Hamza, O.M.; McGwire, B.S.; Satoskar, A.R. Host-Directed Drug Therapies for Neglected Tropical Diseases Caused by Protozoan Parasites. Front. Microbiol. 2018, 9, 2655. [Google Scholar] [CrossRef]
  19. Vargas, D.A.; Prieto, M.D.; Martínez-Valencia, A.J.; Cossio, A.; Burgess, K.E.V.; Burchmore, R.J.S.; Gómez, M.A. Pharmacometabolomics of Meglumine Antimoniate in Patients with Cutaneous Leishmaniasis. Front. Pharm. 2019, 10. [Google Scholar] [CrossRef]
  20. Saunders, E.C.; Ng, W.W.; Kloehn, J.; Chambers, J.M.; Ng, M.; McConville, M.J. Induction of a Stringent Metabolic Response in Intracellular Stages of Leishmania mexicana Leads to Increased Dependence on Mitochondrial Metabolism. PLoS Pathog. 2014, 10, e1003888. [Google Scholar] [CrossRef] [Green Version]
  21. Ty, M.C.; Loke, P.; Alberola, J.; Rodriguez, A.; Rodriguez-Cortes, A. Immuno-Metabolic Profile of Human Macrophages after Leishmania and Trypanosoma cruzi Infection. PLoS ONE 2019, 14, e0225588. [Google Scholar] [CrossRef]
  22. Muxel, S.M.; Mamani-Huanca, M.; Aoki, J.I.; Zampieri, R.A.; Floeter-Winter, L.M.; López-Gonzálvez, Á.; Barbas, C. Metabolomic Profile of BALB/c Macrophages Infected with Leishmania amazonensis: Deciphering L-Arginine Metabolism. Int. J. Mol. Sci. 2019, 20, 6248. [Google Scholar] [CrossRef] [Green Version]
  23. Negrão, F.; Abánades, D.R.; Jaeeger, C.F.; Rocha, D.F.O.; Belaz, K.R.A.; Giorgio, S.; Eberlin, M.N.; Angolini, C.F.F. Lipidomic Alterations of in Vitro Macrophage Infection by L. infantum and L. amazonensis. Mol. Biosyst. 2017, 13, 2401–2406. [Google Scholar] [CrossRef]
  24. Kloehn, J.; Saunders, E.C.; O’Callaghan, S.; Dagley, M.J.; McConville, M.J. Characterization of Metabolically Quiescent Leishmania Parasites in Murine Lesions Using Heavy Water Labeling. PLoS Pathog. 2015, 11, e1004683. [Google Scholar] [CrossRef] [Green Version]
  25. Moitra, S.; Basu, S.; Pawlowic, M.; Hsu, F.-F.; Zhang, K. Synthesis of Phosphatidylcholine Is Essential for the Promastigote but Not Amastigote Stage in. Front. Cell. Infect. Microbiol. 2021, 11, 647870. [Google Scholar] [CrossRef]
  26. Wishart, D.S.; Tzur, D.; Knox, C.; Eisner, R.; Guo, A.C.; Young, N.; Cheng, D.; Jewell, K.; Arndt, D.; Sawhney, S.; et al. HMDB: The Human Metabolome Database. Nucleic Acids Res. 2007, 35, D521–D526. [Google Scholar] [CrossRef]
  27. Wishart, D.S.; Feunang, Y.D.; Marcu, A.; Guo, A.C.; Liang, K.; Vázquez-Fresno, R.; Sajed, T.; Johnson, D.; Li, C.; Karu, N.; et al. HMDB 4.0: The Human Metabolome Database for 2018. Nucleic Acids Res. 2018, 46, D608–D617. [Google Scholar] [CrossRef]
  28. Henriques, C.; Atella, G.C.; Bonilha, V.L.; de Souza, W. Biochemical Analysis of Proteins and Lipids Found in Parasitophorous Vacuoles Containing Leishmania amazonensis. Parasitol. Res. 2003, 89, 123–133. [Google Scholar]
  29. Tounsi, N.; Meghari, S.; Moser, M.; Djerdjouri, B. Lysophosphatidylcholine Exacerbates Leishmania major-Dendritic Cell Infection through Interleukin-10 and a Burst in arginase1 and Indoleamine 2,3-Dioxygenase Activities. Int. Immunopharmacol. 2015, 25, 1–9. [Google Scholar] [CrossRef] [PubMed]
  30. Bohdanowicz, M.; Grinstein, S. Role of Phospholipids in Endocytosis, Phagocytosis, and Macropinocytosis. Physiol. Rev. 2013, 93, 69–106. [Google Scholar] [CrossRef] [Green Version]
  31. Tian, Y.; Pate, C.; Andreolotti, A.; Wang, L.; Tuomanen, E.; Boyd, K.; Claro, E.; Jackowski, S. Cytokine Secretion Requires Phosphatidylcholine Synthesis. J. Cell Biol. 2008, 181, 945–957. [Google Scholar] [CrossRef] [PubMed] [Green Version]
  32. Kropf, P.; Freudenberg, M.A.; Modolell, M.; Price, H.P.; Herath, S.; Antoniazi, S.; Galanos, C.; Smith, D.F.; Müller, I. Toll-like Receptor 4 Contributes to Efficient Control of Infection with the Protozoan Parasite Leishmania major. Infect. Immun. 2004, 72, 1920–1928. [Google Scholar] [CrossRef] [Green Version]
  33. Ecker, J.; Liebisch, G.; Englmaier, M.; Grandl, M.; Robenek, H.; Schmitz, G. Induction of Fatty Acid Synthesis Is a Key Requirement for Phagocytic Differentiation of Human Monocytes. Proc. Natl. Acad. Sci. USA 2010, 107, 7817–7822. [Google Scholar] [CrossRef] [PubMed] [Green Version]
  34. Hoffman, K.; Liu, Z.; Hossain, E.; Bottazzi, M.E.; Hotez, P.J.; Jones, K.M.; McCall, L.I. Alterations to the Cardiac Metabolome Induced by Chronic T. cruzi Infection Relate to the Degree of Cardiac Pathology. ACS Infect. Dis. 2021. [Google Scholar] [CrossRef]
  35. Dean, D.A.; Gautham, J.L.; Siqueira-Neto, J.H.; McKerrow, J.H.; Dorrestein, P.C.; McCall, L.-I. Spatial Metabolomics Identifies Localized Chemical Changes in Heart Tissue during Chronic Cardiac Chagas Disease. bioRxiv 2020. [Google Scholar] [CrossRef]
  36. Rakotomanga, M.; Blanc, S.; Gaudin, K.; Chaminade, P.; Loiseau, P.M. Miltefosine Affects Lipid Metabolism in Leishmania donovani Promastigotes. Antimicrob. Agents Chemother. 2007, 51, 1425–1430. [Google Scholar] [CrossRef] [PubMed] [Green Version]
  37. Ferreira, C.; Mesquita, I.; Barbosa, A.M.; Osório, N.S.; Torrado, E.; Beauparlant, C.-J.; Droit, A.; Cunha, C.; Carvalho, A.; Saha, B.; et al. Glutamine Supplementation Improves the Efficacy of Miltefosine Treatment for Visceral Leishmaniasis. PLoS Negl. Trop. Dis. 2020, 14, e0008125. [Google Scholar] [CrossRef] [PubMed] [Green Version]
  38. Scorza, B.M.; Carvalho, E.M.; Wilson, M.E. Cutaneous Manifestations of Human and Murine Leishmaniasis. Int. J. Mol. Sci. 2017, 18, 1296. [Google Scholar] [CrossRef] [PubMed] [Green Version]
  39. Gimblet, C.; Meisel, J.S.; Loesche, M.A.; Cole, S.D.; Horwinski, J.; Novais, F.O.; Misic, A.M.; Bradley, C.W.; Beiting, D.P.; Rankin, S.C.; et al. Cutaneous Leishmaniasis Induces a Transmissible Dysbiotic Skin Microbiota That Promotes Skin Inflammation. Cell Host Microbe 2017, 22, 13–24.e4. [Google Scholar] [CrossRef] [PubMed] [Green Version]
  40. Loeuillet, C.; Bañuls, A.-L.; Hide, M. Study of Leishmania Pathogenesis in Mice: Experimental Considerations. Parasit. Vectors 2016, 9, 144. [Google Scholar] [CrossRef] [PubMed] [Green Version]
  41. Ribeiro-Gomes, F.L.; Roma, E.H.; Carneiro, M.B.H.; Doria, N.A.; Sacks, D.L.; Peters, N.C. Site-Dependent Recruitment of Inflammatory Cells Determines the Effective Dose of Leishmania major. Infect. Immun. 2014, 82, 2713–2727. [Google Scholar] [CrossRef] [PubMed] [Green Version]
  42. Tabbara, K.S.; Peters, N.C.; Afrin, F.; Mendez, S.; Bertholet, S.; Belkaid, Y.; Sacks, D.L. Conditions Influencing the Efficacy of Vaccination with Live Organisms against Leishmania major Infection. Infect. Immun. 2005, 73, 4714–4722. [Google Scholar] [CrossRef] [PubMed] [Green Version]
  43. Sumner, L.W.; Amberg, A.; Barrett, D.; Beale, M.H.; Beger, R.; Daykin, C.A.; Fan, T.W.-M.; Fiehn, O.; Goodacre, R.; Griffin, J.L.; et al. Proposed Minimum Reporting Standards for Chemical Analysis Chemical Analysis Working Group (CAWG) Metabolomics Standards Initiative (MSI). Metabolomics 2007, 3, 211–221. [Google Scholar] [CrossRef] [PubMed] [Green Version]
  44. Roy, G.; Dumas, C.; Sereno, D.; Wu, Y.; Singh, A.K.; Tremblay, M.J.; Ouellette, M.; Olivier, M.; Papadopoulou, B. Episomal and Stable Expression of the Luciferase Reporter Gene for Quantifying Leishmania Spp. Infections in Macrophages and in Animal Models. Mol. Biochem. Parasitol. 2000, 110, 195–206. [Google Scholar] [CrossRef]
  45. Côrtes, D.F.; Carneiro, M.B.H.; Santos, L.M.; de Souza, T.C.O.; Maioli, T.U.; Duz, A.L.C.; Ramos-Jorge, M.L.; Afonso, L.C.C.; Carneiro, C.; Vieira, L.Q. Low and High-Dose Intradermal Infection with Leishmania major and Leishmania amazonensis in C57BL/6 Mice. Mem. Inst. Oswaldo Cruz 2010, 105, 736–745. [Google Scholar] [CrossRef] [Green Version]
  46. Zhang, W.W.; Ramasamy, G.; McCall, L.-I.; Haydock, A.; Ranasinghe, S.; Abeygunasekara, P.; Sirimanna, G.; Wickremasinghe, R.; Myler, P.; Matlashewski, G. Genetic Analysis of Leishmania donovani Tropism Using a Naturally Attenuated Cutaneous Strain. PLoS Pathog. 2014, 10, e1004244. [Google Scholar] [CrossRef] [Green Version]
  47. McCall, L.-I.; El Aroussi, A.; Choi, J.Y.; Vieira, D.F.; De Muylder, G.; Johnston, J.B.; Chen, S.; Kellar, D.; Siqueira-Neto, J.L.; Roush, W.R.; et al. Targeting Ergosterol Biosynthesis in Leishmania donovani: Essentiality of Sterol 14alpha-Demethylase. PLOS Negl. Trop. Dis. 2015, 9, e0003588. [Google Scholar] [CrossRef] [Green Version]
  48. McCall, L.-I.; Morton, J.T.; Bernatchez, J.A.; de Siqueira-Neto, J.L.; Knight, R.; Dorrestein, P.C.; McKerrow, J.H. Mass Spectrometry-Based Chemical Cartography of a Cardiac Parasitic Infection. Anal. Chem. 2017, 89, 10414–10421. [Google Scholar] [CrossRef]
  49. Melnik, A.V.; Vázquez-Baeza, Y.; Aksenov, A.A.; Hyde, E.; McAvoy, A.C.; Wang, M.; da Silva, R.R.; Protsyuk, I.; Wu, J.V.; Bouslimani, A.; et al. Molecular and Microbial Microenvironments in Chronically Diseased Lungs Associated with Cystic Fibrosis. mSystems 2019, 4. [Google Scholar] [CrossRef] [Green Version]
  50. Quinn, R.A.; Melnik, A.V.; Vrbanac, A.; Fu, T.; Patras, K.A.; Christy, M.P.; Bodai, Z.; Belda-Ferre, P.; Tripathi, A.; Chung, L.K.; et al. Global Chemical Effects of the Microbiome Include New Bile-Acid Conjugations. Nature 2020, 579, 123–129. [Google Scholar] [CrossRef]
  51. Pluskal, T.; Castillo, S.; Villar-Briones, A.; Orešič, M. MZmine 2: Modular Framework for Processing, Visualizing, and Analyzing Mass Spectrometry-Based Molecular Profile Data. BMC Bioinform. 2010, 11, 395. [Google Scholar] [CrossRef] [PubMed] [Green Version]
  52. Perez, F.; Granger, B.E. IPython: A System for Interactive Scientific Computing. Comput. Sci. Eng. 2007, 9, 21–29. [Google Scholar] [CrossRef]
  53. Caporaso, J.G.; Kuczynski, J.; Stombaugh, J.; Bittinger, K.; Bushman, F.D.; Costello, E.K.; Fierer, N.; Peña, A.G.; Goodrich, J.K.; Gordon, J.I.; et al. QIIME Allows Analysis of High-Throughput Community Sequencing Data. Nat. Methods 2010, 7, 335–336. [Google Scholar] [CrossRef] [Green Version]
  54. Bray, J.R.; Roger Bray, J.; Curtis, J.T. An Ordination of the Upland Forest Communities of Southern Wisconsin. Ecol. Monogr. 1957, 27, 325–349. [Google Scholar] [CrossRef]
  55. Faith, D.P.; Minchin, P.R.; Belbin, L. Compositional Dissimilarity as a Robust Measure of Ecological Distance. Theory Models Veg. Sci. 1987, 69, 57–68. [Google Scholar]
  56. Vázquez-Baeza, Y.; Pirrung, M.; Gonzalez, A.; Knight, R. EMPeror: A Tool for Visualizing High-Throughput Microbial Community Data. Gigascience 2013, 2, 16. [Google Scholar] [CrossRef] [PubMed] [Green Version]
  57. Phelan, V.V. Feature-Based Molecular Networking for Metabolite Annotation. In Computational Methods and Data Analysis for Metabolomics; Humana: New York, NY, USA, 2020; pp. 227–243. [Google Scholar]
  58. Nothias, L.F.; Petras, D.; Schmid, R.; Dührkop, K.; Rainer, J.; Sarvepalli, A.; Protsyuk, I.; Ernst, M.; Tsugawa, H.; Fleischauer, M.; et al. Feature-based molecular networking in the GNPS analysis environment. Nat. Methods 2020, 17, 905–908. [Google Scholar] [CrossRef]
  59. Shannon, P.; Markiel, A.; Ozier, O.; Baliga, N.S.; Wang, J.T.; Ramage, D.; Amin, N.; Schwikowski, B.; Ideker, T. Cytoscape: A Software Environment for Integrated Models of Biomolecular Interaction Networks. Genome Res. 2003, 13, 2498–2504. [Google Scholar] [CrossRef]
  60. Fahy, E.; Sud, M.; Cotter, D.; Subramaniam, S. LIPID MAPS Online Tools for Lipid Research. Nucleic Acids Res. 2007, 35, W606–W612. [Google Scholar] [CrossRef] [Green Version]
  61. Chambers, J.M. Graphical Methods for Data Analysis; Chapman and Hall/CRC: Wadsworth International Group: Boca Raton, FL, USA, 1983; ISBN 9780534980528. [Google Scholar]
  62. Dührkop, K.; Fleischauer, M.; Ludwig, M.; Aksenov, A.A.; Melnik, A.V.; Meusel, M.; Dorrestein, P.C.; Rousu, J.; Böcker, S. SIRIUS 4: A Rapid Tool for Turning Tandem Mass Spectra into Metabolite Structure Information. Nat. Methods 2019, 16, 299–302. [Google Scholar] [CrossRef] [Green Version]
Figure 1. Effect of in vivo L. major infection on host metabolite profile. (A) Sites of infection and sample collection. Lesion at the center of the infected ear is circled in blue. (B) PCoA analysis of aqueous extraction from infected and uninfected ear samples, showing overall differences in metabolite profiles between sampling sites: PERMANOVA p = 0.004, R2 = 0.288. (C) PCoA analysis of organic extraction from infected and uninfected ears, showing differences in global metabolite profiles between sampling sites: PERMANOVA p = 0.003, R2 = 0.248. (D) Representative metabolite decreased by infection at the site of the lesion: glutamine (Wilcoxon rank-sum test comparing infected ear center vs infected ear edge p = 0.008). (E) Representative metabolite increased only at infection-adjacent sites: PC(O-34:1), Wilcoxon rank-sum test comparing infected ear center vs infected ear edge p = 0.008. Non-overlapping boxplot notches indicate significantly different medians between groups.
Pathogens 10 00593 g001
Figure 2. Top 15 infection-modulated metabolites as identified by random forest. (A) Footpad aqueous extraction. (B) Footpad organic extraction. (C) Ear aqueous extraction. (D) Ear organic extraction.
Pathogens 10 00593 g002
Figure 3. PC subnetworks. PC family metabolites in the footpad organic extraction (A), footpad aqueous extraction (B), ear organic extraction (C) and ear aqueous extraction (D) molecular networks. Relative metabolite abundance in the presence of infection is shown in red, and absence of infection is blue.
Pathogens 10 00593 g003
Figure 4. (AF) PCs in the m/z range 200–299, 400–499, 500–599, 600–699, 700–799 and 800–899, respectively, change with infection and sampling position in the ear. (G) Total PC levels were increased at the site of infection in the ear. Non-overlapping boxplot notches indicate significantly different medians between groups.
Pathogens 10 00593 g004
Table 1. Top differential molecules for ear aqueous extraction as determined by random forest.
m/zRT (min)Predicted Molecular Formula (SIRIUS) or Spectral Match FormulaSpectral Match on GNPS/LIPID MAPS/Molecular NetworkingMass DifferencePPM ErrorCosine ScoreNumber of Matched Peaks for GNPS Spectral Matchp Value (Infected Center vs Uninfected Center) 1p Value (Infected Edge vs Uninfected Edge)p Values (Infected vs Uninfected)
Dysregulated in ear center
147.08150.34C5H10N2O3Glutamine0.0131140.0080.4210.001
169.06240.31C4H12N2O3SNA 2NANANANA0.0110.5480.011
330.13146.4C14H21N5O2 ([M+K]+)NANANANANA0.0080.0081.08 × 10−5
750.5435 35.06C34H17N9O9NANANANANA0.0080.0082.17 × 10−5
752.55855.07C40H73N5O8NANANANANA0.0080.0081.08 × 10−5
794.60526.13C46H84NO7PPC O-38:500150.0080.0081.08 × 10−5
Dysregulated in ear edge
261.14740.47C9H24N3O2S ([M+Na]+)NANANANANA0.0950.310.315
720.58874.7C40H82NO7PLPC 32:0 or LPC O-32:1;O or PC O-32:0NA2NANA0.0950.0080.28
744.59064.48C42H82NO7PLPC 34:2 or LPC O-34:3;O or PC O-34:2NA0.54NANA0.0080.0080.052
746.60524.78C42H84NO7PPC O-16:0/18:1041140.0320.0080.28
770.6054.58C44H84NO7PPC O-36:3NA1.04NANA0.3100.0080.218
772.62014.73C44H86NO7PPC O-36:2NA1.8NANA0.0160.0080.393
794.60514.42C46H84NO8PPC O-38:500150.0560.0080.481
796.62054.91C46H86NO7PPC O-38:4NA1.26NANA0.1510.0080.105
Dysregulated in both ear center and ear edge
155.04980.85C11H6ONANANANANA0.0080.2220.684
1 Test returns identical p-values when non-overlapping peak areas are obtained between samples in each group (due to identical ranks regardless of the specific peak areas);2 NA, not applicable (no spectral match in GNPS); 3 Bolding indicates that metabolite is also affected by infection in the footpad.
Table 2. Top differential molecules for ear organic extraction as determined by random forest.
m/zRT (min)Predicted Molecular Formula (SIRIUS) or Spectral Match FormulaSpectral Match on GNPSMass DifferencePPM ErrorCosine ScoreNumber of Matched Peaks for GNPS Spectral Matchp Values (Infected Center vs Uninfected Center) 1p Values (Infected Edge vs Uninfected Edge)p Values (Infected vs Uninfected)
Dysregulated in ear center
377.26793.53C11H34N10O3 ([M+Na]+)NA 2NANANANA0.0080.2220.043
744.58485.59C42H82NO7PLPC 34:2 or LPC O-34:3;O or PC O-34:2NA7.25NANA0.0110.0520.0003
768.5862 35.26C44H82NO7PPC O-36:4NA5.2NANA0.0080.0081.08 × 10−5
770.60195.7C44H84NO7PPC O-36:3NA5.06NANA0.0080.0950.0001
790.54245.43C45H76NO8PPC 37:7NA5.44NANA0.5480.6910.631
792.55745.71C45H78NO8PPC O-16:0/22:60.0180.8670.0120.6910.026
806.56825.42C46H80NO8PPC 38:6 or PC O-38:7;O0.02220.81180.00810.09
828.55165.44C48H78NO8PPC O-40:10;O or PC 40:9NA1.2NANA0.0080.6910.143
834.59945.91C48H84NO8PPC 40:6 or PC O-40:7;ONA1.56NANA0.0080.5480.353
854.56765.36C38H79N9O10SNANANANANA0.0560.2220.218
856.58265.87C43H73N11O7NANANANANA0.00810.105
856.58265.9C43H73N11O7NANANANANA0.0080.8410.075
1017.6873.04C45H84N20O7NANANANANA0.0080.1510.002
Dysregulated in ear edge
813.68455.27C46H92N4O5SNANANANANA0.0160.0080.912
Dysregulated in both ear center and ear edge
332.66112.29no prediction in SIRIUSNANANANANA0.0080.2220.0003
1 Test returns identical p-values when non-overlapping peak areas are obtained between samples in each group (due to identical ranks regardless of the specific peak areas); 2 NA, not applicable (no spectral match in GNPS); 3 Bolding indicates that metabolite is also affected by infection in the footpad.
Table 3. Top differential molecules for footpad aqueous extraction as determined by random forest.
m/zRT (min)Predicted Molecular Formula (SIRIUS) or Spectral Match FormulaSpectral Match on GNPS/LIPID MAPS/Molecular NetworkingMass DifferencePPM ErrorCosine ScoreNumber of Matched Peaks for GNPS Spectral Matchp Values 1
206.10674.51C7H16N3O2PNA 2NANANANA0.008
210.11212.74C12H15N2 ([M+Na]+)NANANANANA0.008
212.16512.75C12H21NO2NANANANANA0.008
230.17562.74C12H23NO3NANANANANA0.008
281.00522.55C9H13O4PS2NANANANANA0.008
303.23124.1C20H32O3 ([M+H-H2O]+)5,6-Epoxy-8Z,11Z,14Z-eicosatrienoic acid040.8980.008 3
327.23254.05C22H30O2NANANANANA0.008
331.26384.31C22H34O2NANANANANA0.008
368.25914.06C24H33NO2NANANANANA0.008
377.14612.41C14H24N4O6SNANANANANA0.012
377.26614.32C18H36N2O6NANANANANA0.008
425.33753.18C24H44N2O4NANANANANA0.008
508.37644.01C26H54NO6PPC(P-18:0/0:0)020.91100.008
522.28344.16C24H44NO9PNANANANANA0.008
549.22332.49C22H36N4O10SNANANANANA0.008
1 Test returns identical p-values when non-overlapping peak areas are obtained between samples in each group (due to identical ranks regardless of the specific peak areas.); 2 NA, not applicable (no spectral match in GNPS); 3 Bolding indicates that metabolite is also affected by infection in the ear.
Table 4. Top differential molecules for footpad organic extraction as determined by random forest.
m/zRT (min)Predicted Molecular Formula (SIRIUS) or Spectral Match FormulaSpectral Match on GNPS/LIPID MAPS/Molecular NetworkingMass DifferencePPM ErrorCosine ScoreNumber of Matched Peaks for GNPS Spectral Matchp Values 1
352.29374.71C16H40N4O2PNA 2NANANANA0.008 3
480.30972.81C23H46NO7PPE(18:1/0:0)NA2NANA0.008
519.48913.79C29H65N3O2PNANANANANA0.008
585.5343.53C33H68N4O4NANANANANA0.016
703.57524.7C40H75N6O2PNANANANANA0.008
720.58956.63C44H79N3OS ([M+Na]+)NANANANANA0.008
722.49837.85C42H69NO7 ([M+Na]+)NANANANANA0.095
744.58916.01C42H82NO7PLPC 34:2 or LPC O-34:3;O or PC O-34:2NA2NANA0.008
768.58855.89C44H82NO7PPC O-36:4NA2.21NANA0.008
794.60355.97C46H84NO7PPC O-38:5030.8170.008
796.61356.64C44H83N7O3 ([M+K]+)NANANANANA0.008
796.61826.59C46H86NO7PPC O-38:4NA4NANA0.008
811.66866.55C47H91N2O6PSM 42:3;O2NA0NANA0.008
813.68677.51C47H93N2O6PSM 18:1;O2/24:1040.9160.008
828.55215.36C37H78N7O11PNANANANANA0.008
1 Test returns identical p-values when non-overlapping peak areas are obtained between samples in each group (due to identical ranks regardless of the specific peak areas.); 2 NA, not applicable (no spectral match in GNPS); 3 Bolding indicates that metabolite is also affected by infection in the ear.
Table 5. LC gradient parameters.
Ear Aqueous Extraction
Start2% B
1 min2% B
1.5 min40% B
4 min98% B
5 min98% B
6 min2% B
7 min2% B
Ear Organic Extraction
Start2% B
1 min2% B
1.5 min60% B
5.5 min98% B
7.5 min98% B
8.5 min2% B
10.5 min2% B
Footpad Aqueous Extraction
Start2% B
1 min2% B
1.5 min40% B
6 min98% B
6.5 min98% B
7 min2% B
Footpad Organic Extraction
Start2% B
1 min2% B
1.5 min70% B
7 min98% B
8 min98% B
9 min2% B
10.5 min2% B
Table 6. MS parameters.
Detection ModePositive
Nebulizer gas pressure2 Bar
Capillary voltage4500 V
Ion source temperature200 °C
Dry gas flow9.0 L/min
Spectra rate acquisition3 spectra/s
Table 7. MZmine parameters.
Mass Detection
MS level 1: Noise level1 × 103
MS level 2: Noise level10
Mass detectorCentroid
Chromatogram Builder
Min time span0.06 min
Min peak height3 × 103
m/z tolerance1 × 10−6 or 10 ppm
Chromatogram Deconvolution
AlgorithmBaseline cutoff
Min peak height3 × 103
Peak duration range (min)0.06–2 min (ear),
0.01–7 min (footpad)
Baseline level1 × 102 (ear),
1.5 × 10³ (footpad)
m/z range for MS2 scan pairing (Da)0.01
RT range for MS2 scan pairing (min)0.2 min
Isotopic Peaks Grouper
m/z tolerance1 × 10−6 or 10 ppm
Retention time tolerance (absolute: min)0.05 min
Monotonic shapeEnabled
Maximum charge3
Representative isotopeMost intense
Join Aligner
m/z tolerance1 × 10−6 or 10 ppm
Weight for m/z7
Retention time tolerance (absolute: min)0.5 min
Weight for RT3
Manual Filtering
Min number of peaks per row3
RT range0.2–10.5 (ear organic and footpad),
0.2–6.9 (ear aqueous)
MS2required
Manual validation of peak shape
Gap-Filing
m/z tolerance1 × 10−6 or 10 ppm
RT tolerance0.5 min
Intensity tolerance30%
RT correctionEnabled
Publisher’s Note: MDPI stays neutral with regard to jurisdictional claims in published maps and institutional affiliations.

