Article

Tracking the Transcription Kinetic of SARS-CoV-2 in Human Cells by Reverse Transcription-Droplet Digital PCR

1
Medtimes Molecular Laboratory Limited, Hong Kong, China
2
The Jockey Club School of Public Health and Primary Care, Faculty of Medicine, The Chinese University of Hong Kong, Hong Kong, China
3
Li Ka Shing Institute of Health Sciences, Faculty of Medicine, The Chinese University of Hong Kong, Hong Kong, China
4
HKU-Pasteur Research Pole, Li Ka Shing Faculty of Medicine, The University of Hong Kong, Hong Kong, China
*
Authors to whom correspondence should be addressed.
Equal contribution.
Pathogens 2021, 10(10), 1274; https://doi.org/10.3390/pathogens10101274
Submission received: 31 August 2021 / Revised: 29 September 2021 / Accepted: 29 September 2021 / Published: 2 October 2021
(This article belongs to the Special Issue Pathogenesis of Emerging Zoonotic Viral Infections)

Abstract

:
Viral transcription is an essential step of SARS-CoV-2 infection after invasion into the target cells. Antiviral drugs such as remdesivir, which is used to treat COVID-19 patients, targets the viral RNA synthesis. Understanding the mechanism of viral transcription may help to develop new therapeutic treatment by perturbing virus replication. In this study, we established 28 ddPCR assays and designed specific primers/probe sets to detect the RNA levels of 15 NSP, 9 ORF, and 4 structural genes of SARS-CoV-2. The transcriptional kinetics of these viral genes were determined longitudinally from the beginning of infection to 12 h postinfection in Caco-2 cells. We found that SARS-CoV-2 takes around 6 h to hijack the cells before the initiation of viral transcription process in human cells. Our results may contribute to a deeper understanding of the mechanisms of SARS-CoV-2 infection.

1. Introduction

There have been more than 179 million COVID-19 cases around the globe and nearly 4 million associated deaths since the initial disease outbreak in late 2019 [1]. The causative agent that is responsible for the disease is a new and emerging strain of coronavirus, namely SARS-CoV-2 [2,3]. SARS-CoV-2 belongs to the beta group of coronaviruses, which is in the family of Coronaviridae. The architecture of SARS-CoV-2 has been studied in detail [4]. Inside each virion, there is a positive sense, single-stranded viral genome which is around 30 kb long. Its genome encodes for four major structural proteins: spike (S), envelope (E), matrix (M), and nucleocapsid (N); sixteen nonstructural proteins (nsp1 to nsp16); and ten accessory proteins (ORF1a/1ab, 3a/b, 6, 7a/b, 8, 9b, and 10) [4].
SARS-CoV-2 mainly replicates in the human respiratory tract after infection [5]. After invading into the target cells, the SARS-CoV-2 virus initiates translation of two major replicase polyproteins, the pp1a (ORF1a) and pp1ab (ORF1ab) from the ORF region of its positive sense RNA genome. Most of the transcription- and translation-dependent proteins such as papain-like proteases, 3C-like protease, helicase, and RNA-dependent RNA polymerase are encoded at these regions [6]. Formations of the replication and transcription complex further drive the transcription of subgenomic mRNAs (sgRNAs) and new viral RNA genome. The sgRNAs are responsible for the production of various viral proteins. Other than the structural proteins, it is known that the nonstructural proteins (NSP) and the open reading frame (ORF) proteins are also essential during the replication process. At the late stage of replication cycle, the translated structural proteins are translocated into endoplasmic reticulum (ER)/Golgi and assembled into a virion with the newly produced genomic viral RNA. The virion is then finally released from the cell by exocytosis [7].
The entire replication cycle of a coronavirus takes more than ten hours [8,9]. Although some studies has sought to determine the transcriptional profile of SARS-CoV-2 at selected time points of postinfection, the kinetic of the viral transcription in human cells is still yet to be completely resolved [10,11,12]. Droplet digital PCR (ddPCR) is recently used to quantify low abundance of SARS-CoV-2 subgenomic viral gene transcripts by its advantage of low template requirementfor the reaction [13]. Ultra sensitive clinical diagnosis is one of the major applications of ddPCR, in such case the assay can identify the COVID-19 patients through detecting low expression of viral genes from their specimens [14]. However, the concern is that the primers and probes used for the current detection may not be updated promptly, as mutations are frequently identified from the new variants of SARS-CoV-2 [15]. In this study, we designed primers/probes sets for the ddPCR that target different viral genes of SARS-CoV-2. The ddPCR assays were then used to track the transcriptional kinetic of the 15 NSP, 9 ORF, and 4 structural genes of SARS-CoV-2 during the initial replication cycle in Caco-2 cells, which is a human cell line that is susceptible for the replication of SARS-CoV-2.

2. Materials and Methods

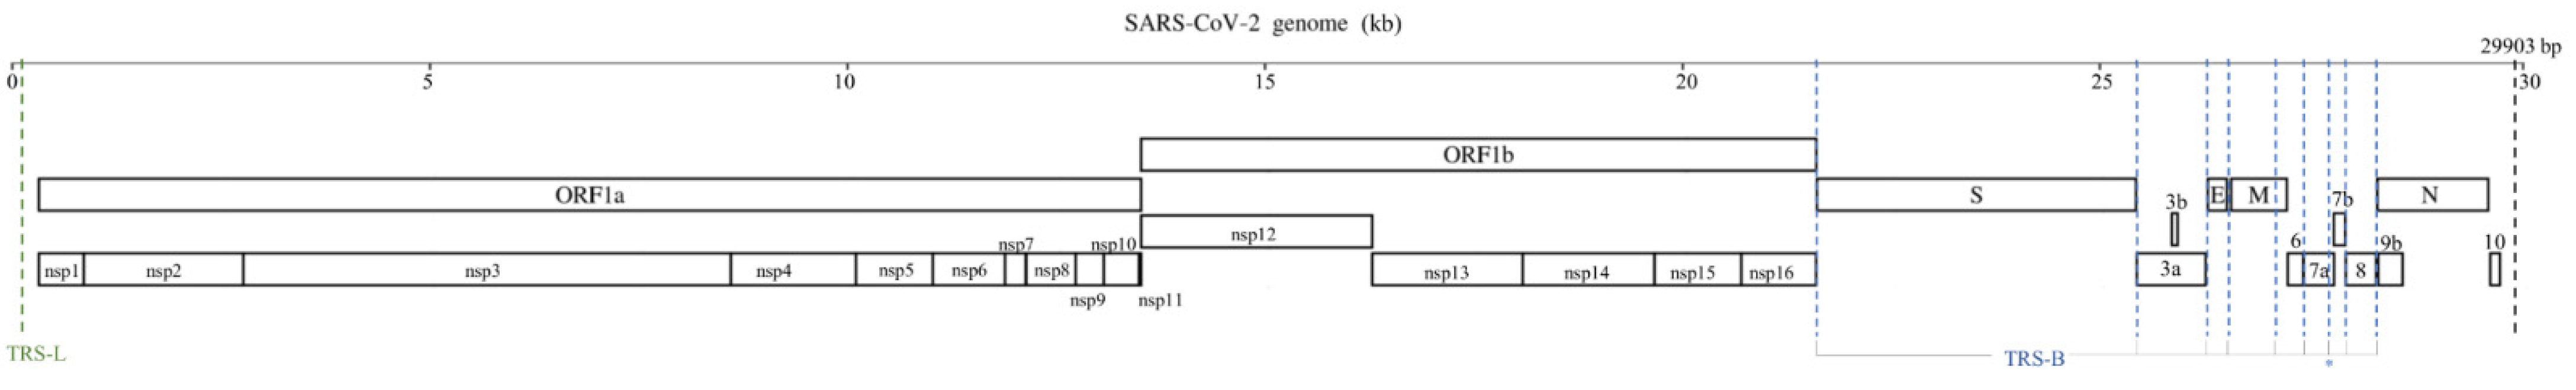
2.1. SARS-CoV-2 Sequences and Alignment

On 9 September 2020, 61,013 SARS-CoV-2 genome sequences were downloaded from GISAID, followed by MAFFT sequence alignment. Mutations from each viral gene were identified through the comparison to the sequence of BetaCoV/Hong Kong/VM20001061/2020 and 50 nucleotide positions with the highest mutation frequencies from each gene were determined. The viral gene mutation coordinates and their frequencies were annotated and summarized in Tables S1, S2 and S3.

2.2. Primers and Dual-Labeled Hydrolysis Probes

All the primer oligos and dual-labeled fluorescent probes were synthesized and purified by Life Technologies and Sangon Biotech (Shanghai). Human ribonuclease subunit p30 (RNase P) was used to serve as our endogenous control.

2.3. Viruses and Cells

The SARS-CoV-2 virus strain (BetaCoV/Hong Kong/VM20001061/2020) was propagated in Vero E6 cells and the infectious titer of the viral stock was determined by serially diluting the virus on the Vero E6 cells by plaque-forming unit (pfu). All the experiments of virus culture were carried out in the biosafety level 3 containment facility in the University of Hong Kong and fully in accordance with the laboratory biosecurity and biosafety guidelines.
Human Caco-2 cell lines were purchased from ATCC and grown in a T-75 flask (Greiner Bio-One CELLSTAR, Austria) with Dulbecco’s modified eagle medium (DMEM) that was supplemented with 10% fetal bovine serum (FBS) (GIBCO, USA), 2 mM HEPES (Gibco), 100 U/ml of penicillin, 100 µg/ml of streptomycin, and 1% of GlutaMax (Gibco, USA) and until 90% confluency. Cells were then dissociated with trysin-EDTA (GIBCO, USA) and seeded into a 24-well tissue culture plate (TPP, Switzerland) at a concentration of 0.5×10⁶ cells per well. Culture medium was then changed to 0% FBS–DMEM during and after the infection. All the cell cultures were incubated and grown at 37 °C and maintained with 5% CO2 in the incubator.

2.4. Virus Infection and Collection of Cell Lysate

Caco-2 cells were mock-infected or infected by SARS-CoV-2 at multiplicity of infection (MOI) of 0.01. After 15 min, the cells were either lysed by 350 µL of RNA lysis buffer (Buffer RLT, Qiagen, Germany) after washed twice with pre-warmed 1× PBS (T = 0) or further incubated for additional 45 min. At 1-h postinfection (hpi), the cells were washed with pre-warmed 1× PBS and replaced with fresh cell-culture medium (DMEM, 0% FBS). The infected cells were further incubated in 37 °C incubator and the total RNAs were then harvested by the RNA lysis buffer at 2, 4, 6, 8, 10 and 12 hpi. All cell lysates were then kept at −80 °C until RNA extraction.

2.5. Preparation of cDNA Templates

Total RNAs were extracted from the cell lysates by using the RNeasy Mini Kit (QIAGEN, Germany) following the manufactory’s protocol. In brief, 350 µL of the cell lysates containing buffer RLT were input for extraction and purified RNAs were eluted in 50 µL of RNase-free water. All RNAs extracted were then stored at −80 °C until use. Reverse transcription was performed to generate cDNA from total RNA by using the LunaScript® RT SuperMix Kit (BioLabs, New England). In brief, 16 µL of the purified RNAs were mixed with the 4 µL of the 5× reaction mix and incubated at 25 °C for 2 min for primer annealing, followed by cDNA synthesis at 55 °C for 10 min and enzyme inactivation at 95 °C for 1 min. cDNAs were then subsequently diluted in 1:20 with 1× TE buffer, pH 8.0 (Sigma-Aldrich, USA) and were kept at −20 °C until use.

2.6. Endogenous Control and Absolute Quantification by ddPCR

The copy numbers of the viral genes and the endogenous RNase P were absolutely quantified in the ddPCR system. To co-amplify the viral genes and endogenous control (RNase P gene) in the same reaction, we applied duplex TaqMan probes for the ddPCR and labeled them with 6-FAM and VIC fluorescent signals respectively [16]. In brief, 20 µL of a PCR reaction mix that contains 10 µL of 2× ddPCR Supermix for Probes (No dUTP), 2 µL of a primer/probe mixture (final concentration of each primer: approximately 900 nM; hydrolysis probe: approximately 250 nM), 3 µL of 1:20 diluted cDNA, and 5 µL of RNase–DNase-free water was prepared. The PCR reaction mix was then partitioned with droplet generation oil in a QX200™ Droplet Generator for droplets generation. The partitioned products (roughly 40 µL) were then transferred to a new 96-well PCR plate (0.2 mL) and amplified in a C1000 Touch Thermo Cycler by using the following cycling conditions: enzyme activation at 95 °C for 10 min, followed by 40 cycles of a two-stage-amplification at 94 °C for 30 s, at 60 °C for 1 min, and finally at 98 °C for 10 min. The partitioned droplets containing end-point fluorescent-labeled PCR products were then quantified immediately by QX200 Droplet Reader. Gating of the FAM/VIC counts was performed in QuantaSoft software according to the manufacturer instructions.

2.7. Validation of the Primers and Probes on Clinical Specimens by RT-QPCR

We selected 12 combined nasopharyngeal and throat swab clinical specimens that were previously laboratory confirmed as SARS-CoV-2-positive for the study. In brief, the viral RNA was extracted from 140 µL of viral transport medium by using the QIAamp Viral RNA Kit (QIAGEN, Germany) that following the manufacturer’s protocol and purified in 50 µL of buffer AVE. The synthesis of cDNA was performed as described in Section 2.5. The cDNAs were then diluted in 1:10 with 1× TE buffer, pH 8.0 (Sigma-Aldrich, USA), and kept at −20 °C until use. Quantitative real-time PCR was then performed by using the following sets of primers and probes: S, E, M, N, orf1a, orf1b, nsp1, nsp2, nsp3, nsp4, nsp5, nsp6, nsp7, nsp8, nsp9, nsp10, nsp12, nsp13, nsp14, nsp15, nsp16, orf3a, orf6, orf7a, orf7b, orf8, orf9b, orf10. Informed and written consents were obtained from all participants and the study was approved by the Medtimes Medical Group Ethics Review Board.
In brief, 10 µL of reaction mix containing 5 µL of 2× PerfeCTa qPCR ToughMix (Quantabio, USA); 1.5 µL of primer and probe mixture that comprised 400 nM each of the forward and reverse primers and 200 nM each of the fluorescent hydrolysis probes; 3 µL of 1:10 diluted cDNA; and 0.5 µL of rox reference dye was prepared for each reaction. The qPCR reaction mix was then transferred to a 0.1 mL 96-well qPCR plate (Applied Biosystems, USA). The viral gene templates were amplified and the fluorescent signal was acquired by the ViiA 7 Real-Time PCR System (Thermo Fisher Scientific, USA) using the following cycling conditions: initial denaturation at 95 °C for 1 min, followed by 45 cycles of a two-stage amplification at 95 °C for 2 s and at 60 °C for 12 s. QuantStudio™ Real-Time PCR Software v1.6.1 was then used for data analysis.

2.8. Data and Statistical Analysis
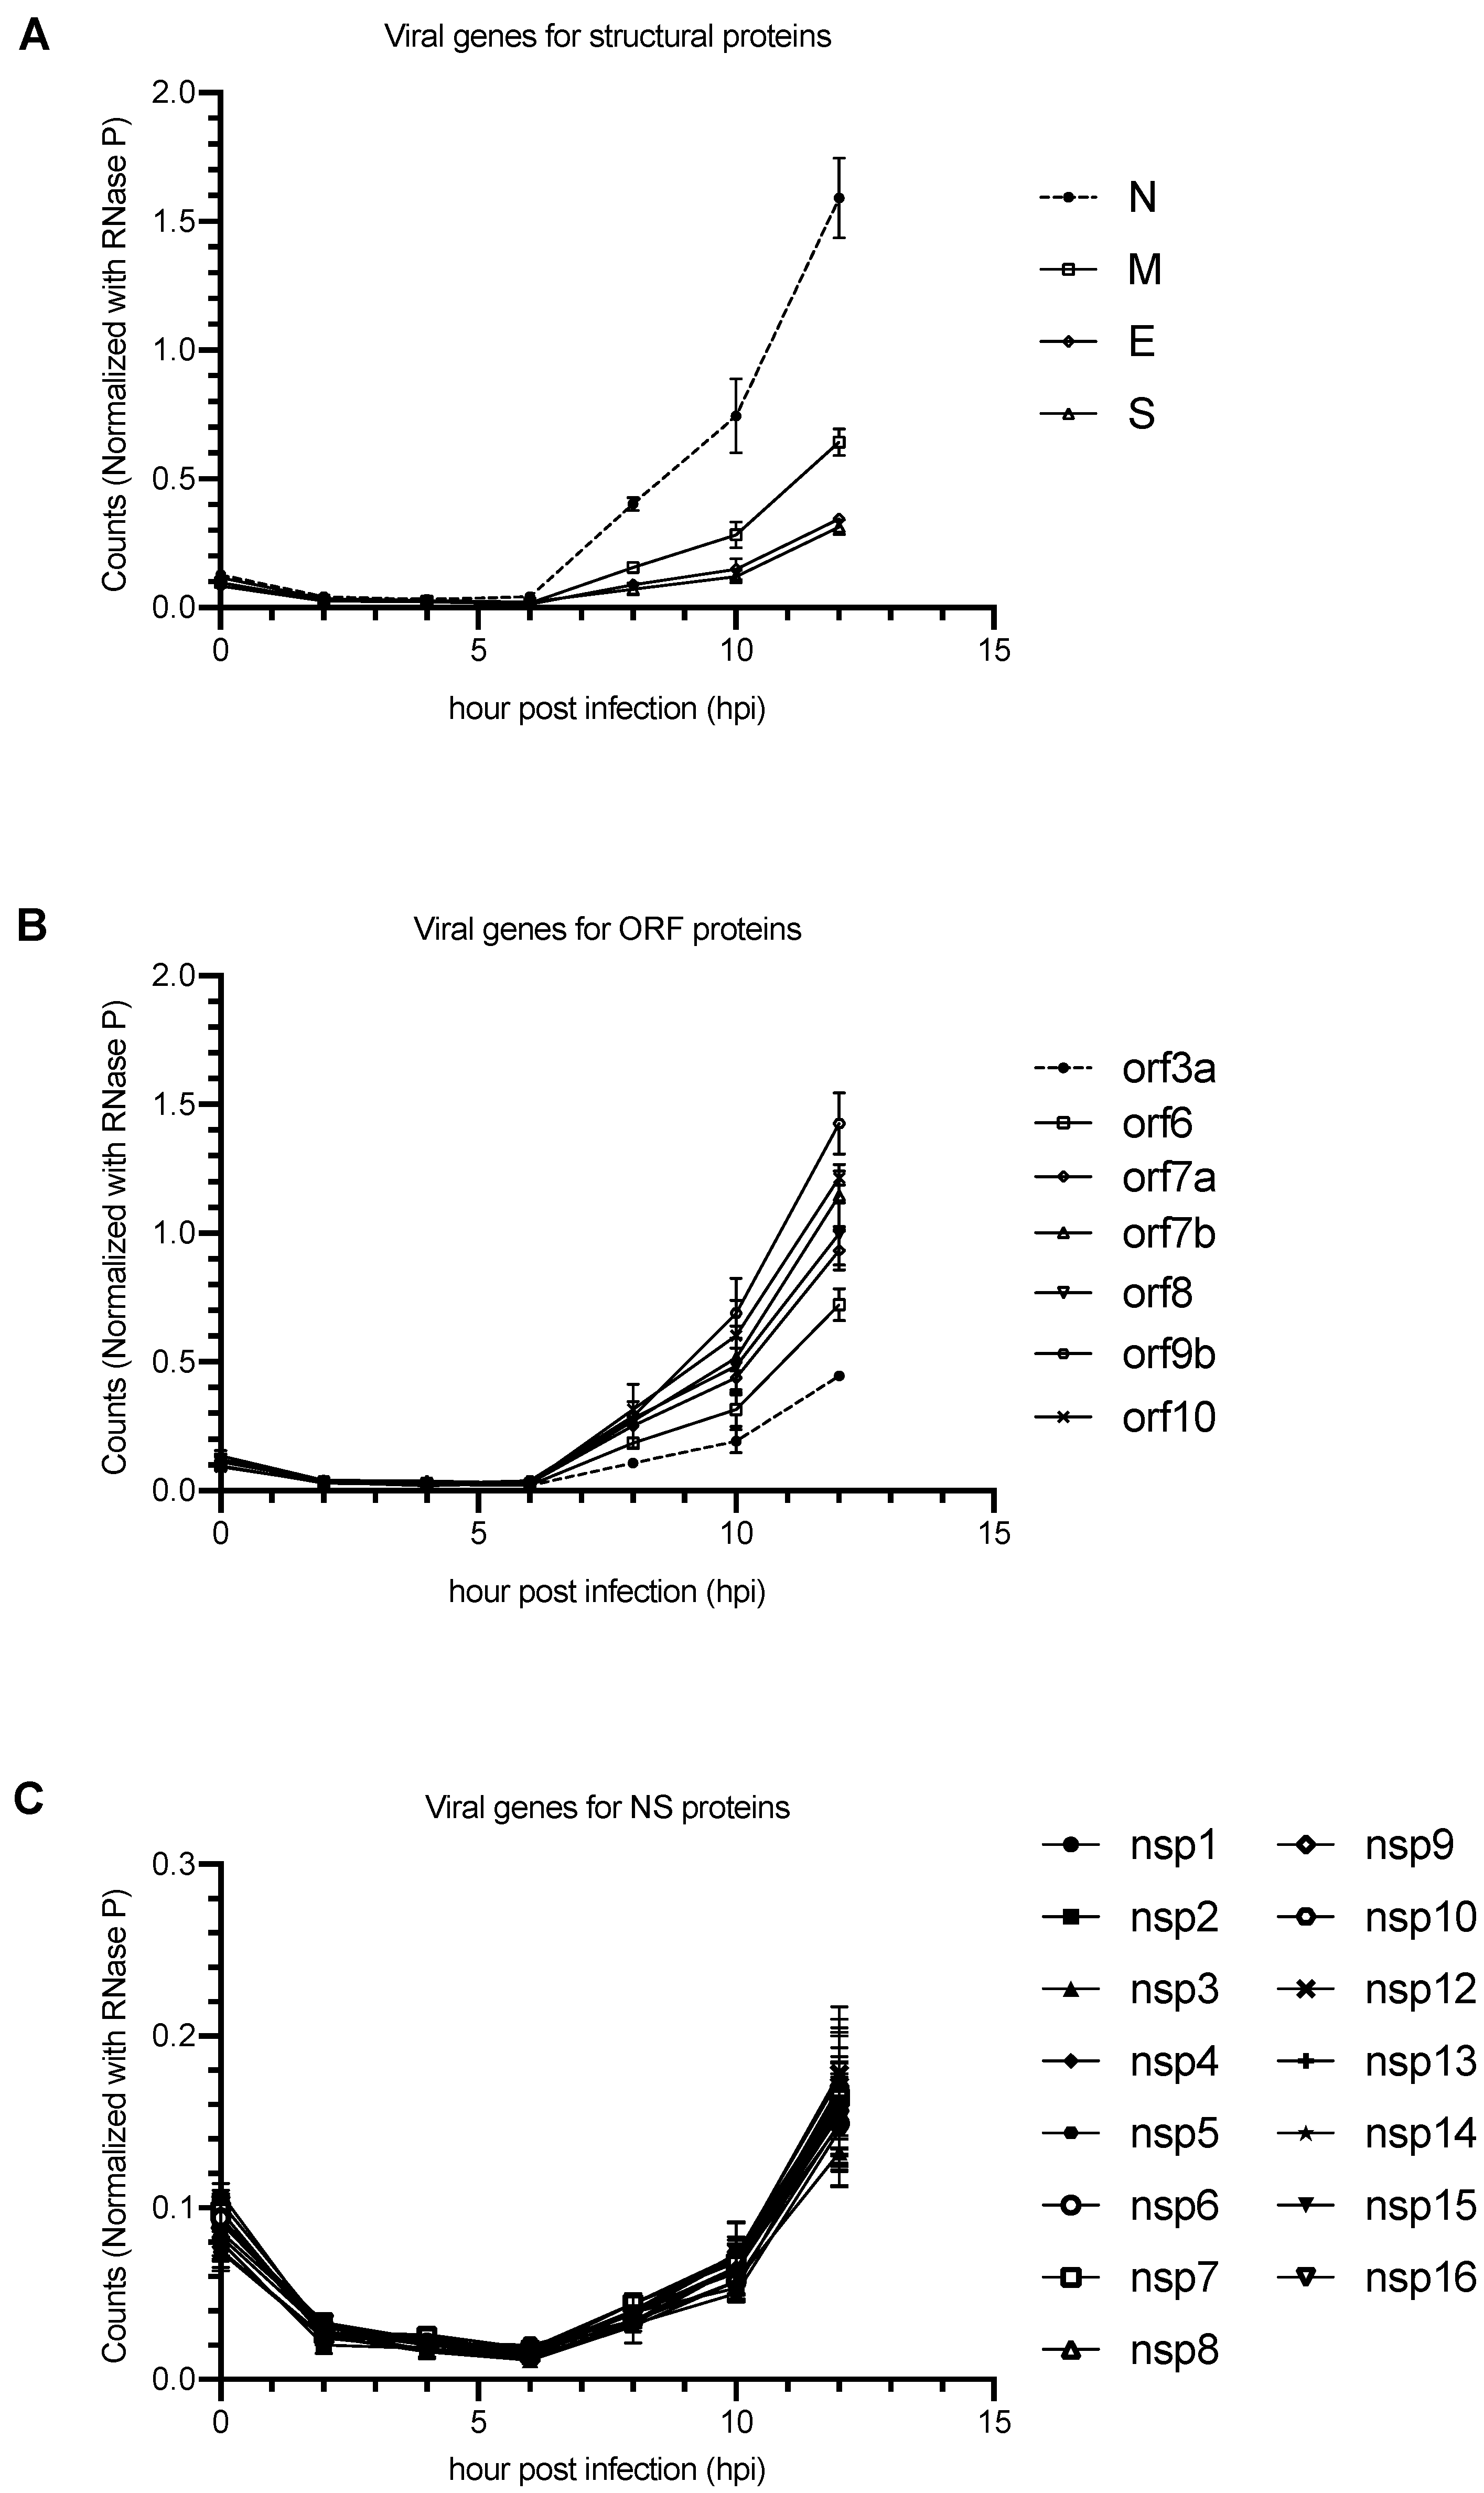
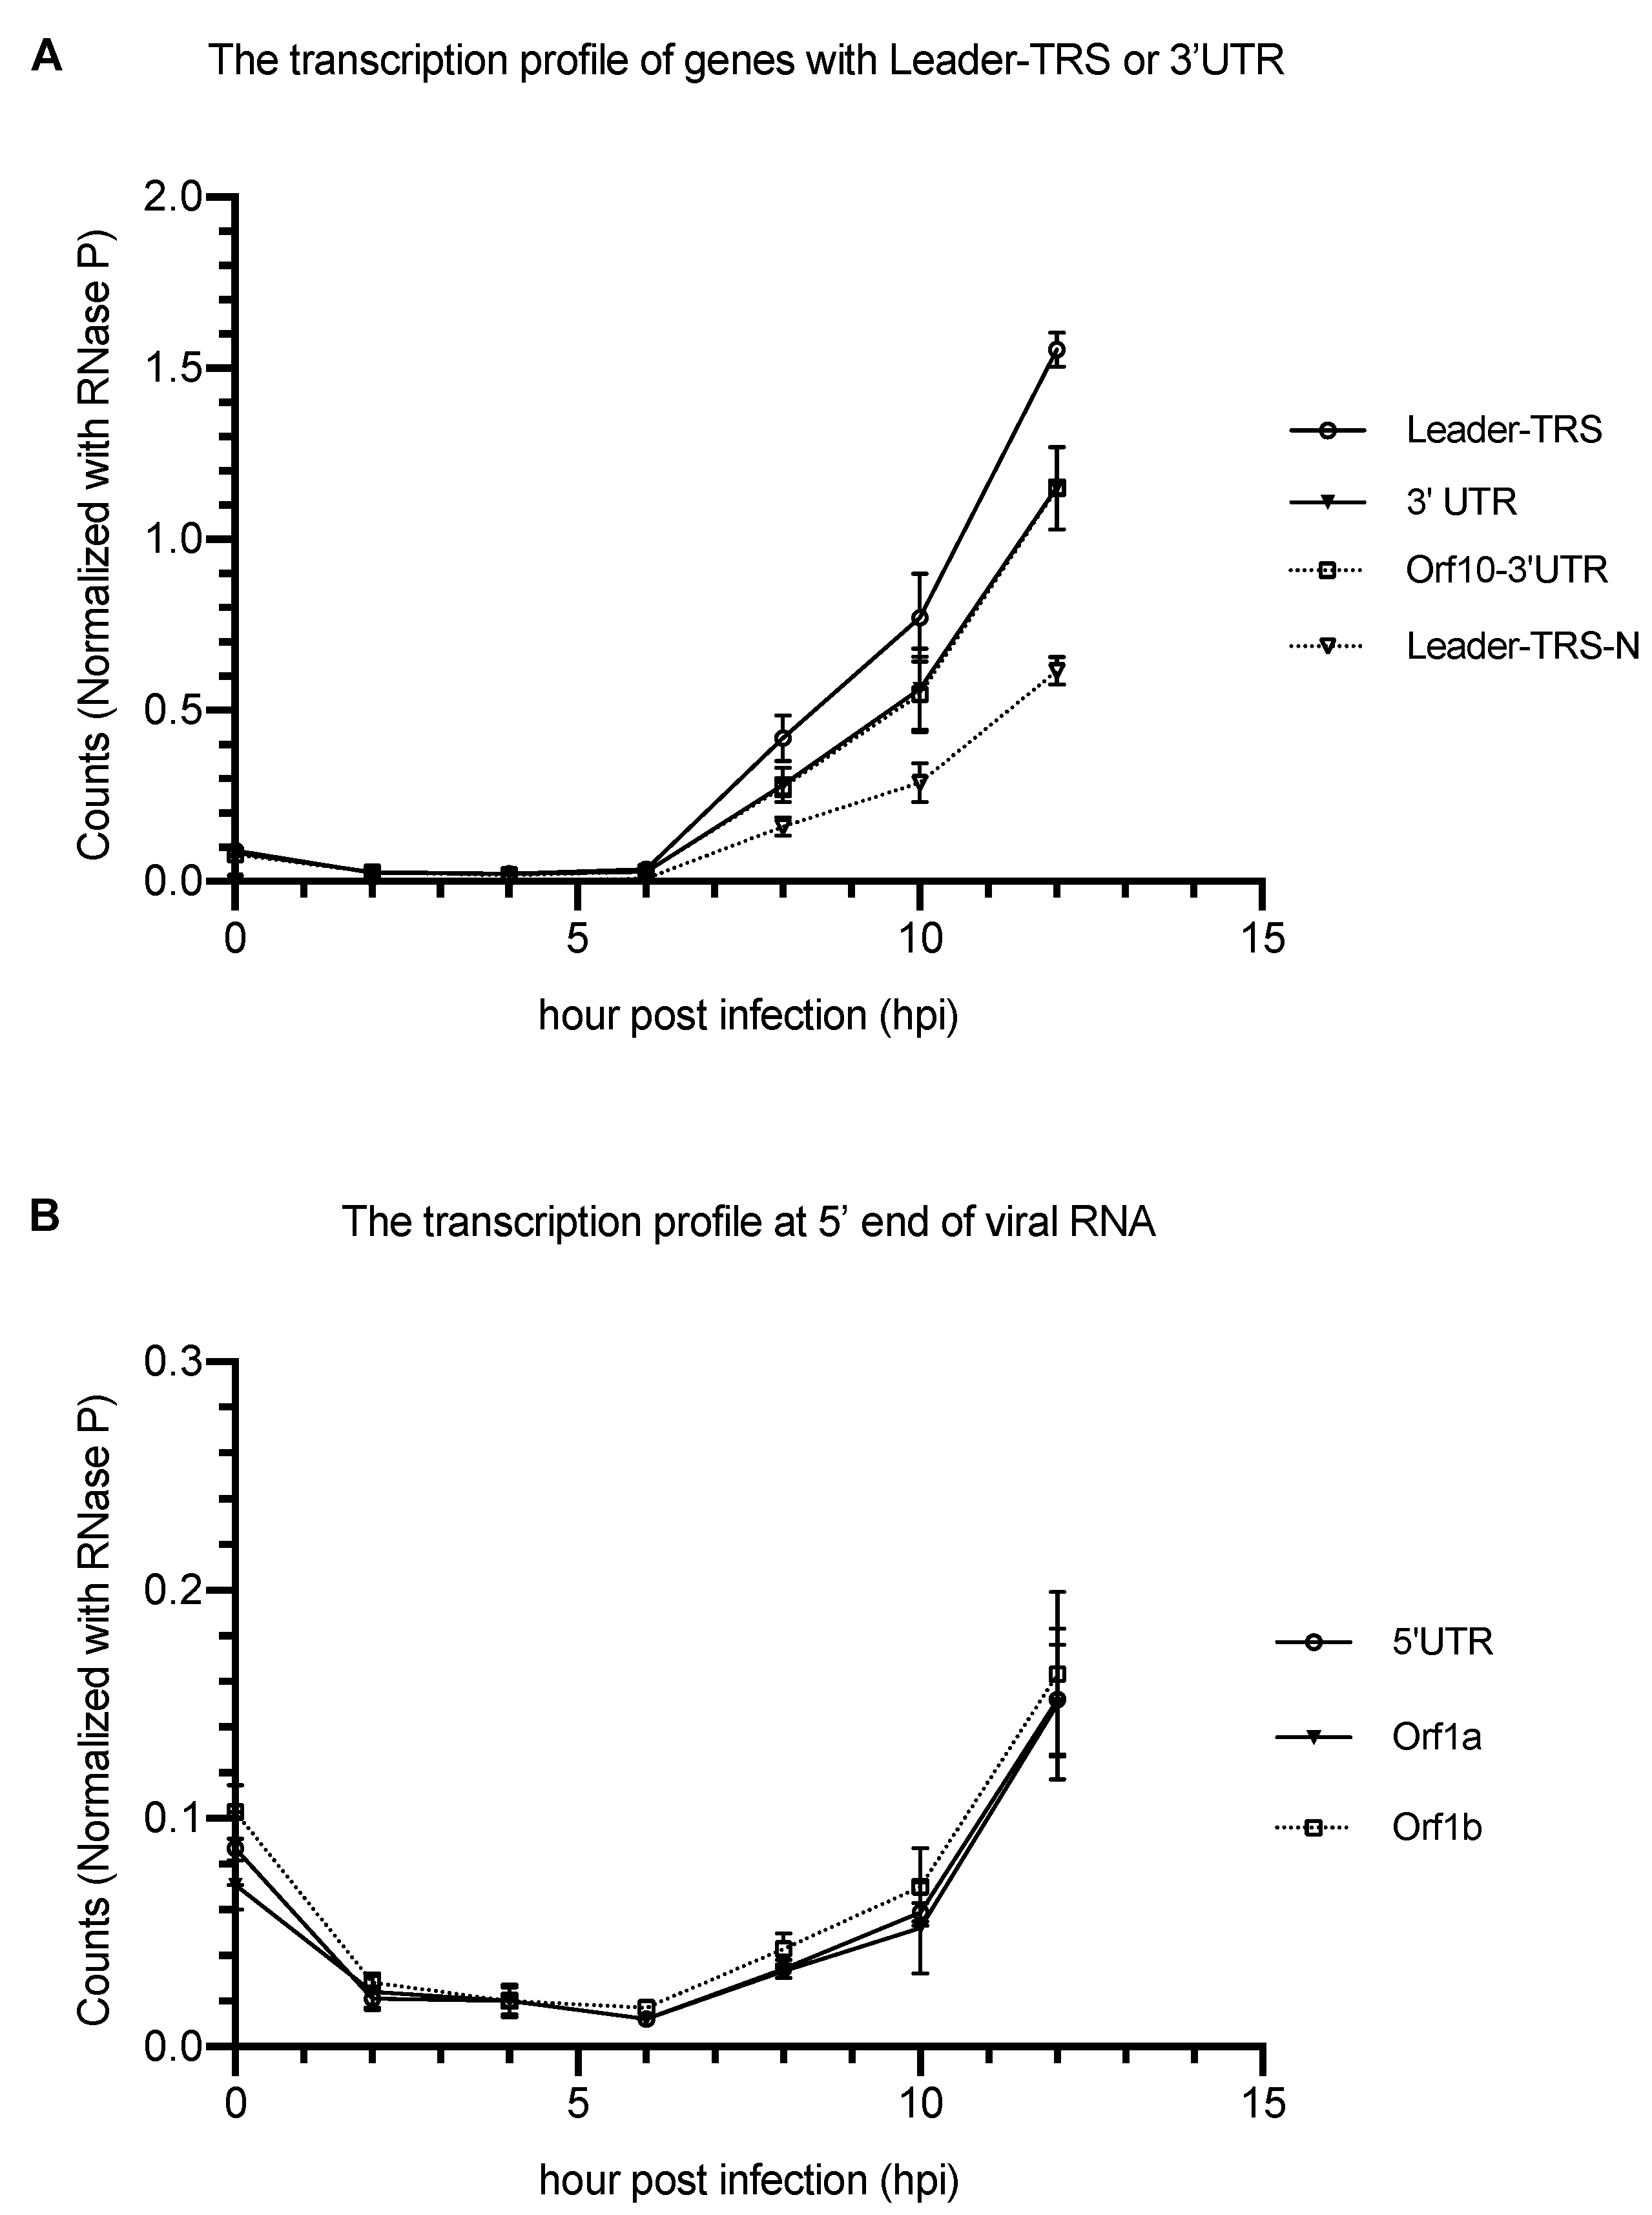
The one-way ANOVA statistics model was applied by using GraphPad Prism 9 (GraphPad Software Inc) and the viral gene copies were normalized with endogenous mRNA control of ribonuclease P protein subunit p30 gene (RNase P gene). The absolute counting strategy is being enumerated and listed below, while FAM signal represented the target viral genes, VIC signal represented the endogenous control, and FAM/VIC heterogeneous signal reflected the droplets containing both signals and that were being co-amplified.
Viral   RNA   gene   counts   per   copy   of   RNase   P   gene = ( FAM ) + ( FAM / VIC ) ( VIC ) + ( FAM / VIC )
To address the concern of amplification bias by using different primer/dual-labeled hydrolysis probe sets and resulting the counting discrimination, we additionally designed three sets of primers and probes on another conserve regions of nsp3 (B), S gene (B), and N gene (B). This aimed to determine the consistency of different primer/probe sets that targeting the same genes. Two-way ANOVA statistical analysis model was applied to assess the variations of primers and probes used. The difference was determined as significance when p < 0.05.

3. Results

There are totally 16 nonstructural proteins (nsp 1 to 16), 4 structural proteins (S, E, M, and N) and 10 accessory proteins (orf1a/ab, 3a/b, 6, 7a/b, 8, 9b, and 10) encoded by the viral genome of SARS-CoV-2 (Figure 1). To identify suitable target regions for the ddPCR, 61,013 of SARS-CoV-2 sequences were downloaded from GISAID and aligned. Twenty-eight sets of primers and dual-labeled hydrolysis probes that targeting the conserved regions of different viral genes, including 4 structural proteins, 15 nonstructural proteins, and 9 accessory proteins, were designed (Table 1). The ddPCR for Nsp11 and orf3b genes were not included due to their short coding lengths. Oligos for the orf1a and orf1ab were designed to target the overlapping regions with nsp 2/3 and nsp 12/13 respectively. Additionally, two sets of primers and probes were designed to target to the 5′ and 3′ untranslated regions (UTR) respectively. To analyze the transcription pattern of subgenomic viral RNAs (sgRNA) and understand how the leader sequences are fused to the open reading frames, three additional sets of primers and probes were designed to target the 1) Leader–TRS, 2) Leader–TRS–N gene and 3) orf10-3′ UTR respectively.
Human Caco-2 cells were infected by the SARS-CoV-2 and the total RNAs were collected at 15 min, and 2, 4, 6, 8, 10, and 12 h postinfection. The transcription levels of the viral genes were determined by ddPCR using the corresponding primers and probe. In general, the kinetics of the viral transcription pattern were similar among all viral genes (Figure 2A–C). There was a significant decrease of the viral RNA level from the beginning of the infection to 2 h postinfection. No significant change of viral transcription was found from 2 to 6 h after infection, while dramatic increase of the viral RNA was observed beyond 6 h postinfection. Similarly to other coronaviruses, transcription of N, Orf9b, and Orf10 were the most abundantly expressed among all viral genes encoded by the genome. This can be explained by the fact that their encoding regions are closer to the 3′ end of the viral genome than the other genes. Interestingly, we found no difference in the transcription among all NSP genes (Figure 2C). These results support that all the NSPs share one subgenome for their transcription. Reproducibility and performance of our ddPCR assays were further evaluated by using alternative sets of primers/probes that target different encoding regions of nsp3, N, and S. We showed that the alternative sets of primers/probes (nsp3 (B), N (B), and S(B)) did not lead to significant variation of our ddPCR results (Supplementary Figure S1).
Discontinuous viral transcription process is a hallmark of coronavirus that produces a set of nested 3′and 5′ co-terminal subgenomic RNAs for different viral genes. Since detection of N gene using our primer/probe set may also represent the subgenomic RNAs that are used for the transcription of other viral genes, we then sought to estimate the proportion of the N gene from the total transcription. We first determined the level of the total transcription from the infection using a primers/probe set which specifically targets the Leader–TRS region or 3′UTR. The transcription that is specific for N gene was then detected by another set of primers/probe that covers the regions of Leader, TRS, and N. We found that about 38.1–39.6% and 53.4–56.7% among the total transcription involving the Leader–TRS and 3′UTR are specific for the transcription of N gene respectively (Figure 3A). Recently, a study reported that the protein expression of pp1a is 1.4–2.2 times higher than pp1ab. We found that the transcription levels of the ORF1a and ORF1b are similar, which support the hypothesis that the cause of the difference in the protein expression may be due to stoichiometry (Figure 3B).
To further determine the performance of the primers/probe, the expression levels of the structural, NSP, and ORF genes from 12 clinical swab specimens were tested by real-time qPCR (Table 2). All of the target genes were able to be amplified by our primers/probe and detected by the assay. Similarly to the results of our in vitro experiments, N and ORF9b genes showed the highest level of expression among all the target genes in each specimen.

4. Discussion

Compared to traditional quantitative PCR (qPCR), ddPCR is a more sensitive assay for the detection of low levels of gene expression. Our ddPCR assays have the potential to be used for contact tracing so that COVID-19 patients can be identified during the early phase of their infections. The evolution of SARS-CoV-2 since the beginning of the outbreak has resulted in the emergence of variants of concern (VOCs) [15]. Some mutations such as the deletion at position 69/70del can cause a mismatch on the primer, which is used to target the S gene [15]. Moreover, the use of newly discovered drugs such as remdesivir or simeprevir may also cause escape mutations at the orf regions. Thus, these mutations may affect the accuracy of the diagnosis from detecting the viral nucleic acid. The primers and probes that we designed for detecting SARS-CoV-2 cover 15 NSP, 9 ORF, and 4 structural protein genes. All of them were designed and kept away from the highly variable positions of the SARS-CoV-2 genome and we expect that they may be useful for new variants detection in the coming future.
While the efficacy of remdesivir in humans is still suboptimal, structurally modification of this drug or identification of new compound will be one of the key directions for antiviral research. As we have demonstrated the kinetic of the transcription process of the SARS-CoV-2 in Caco-2 cells, our model may be useful for investigating the specific functions of new antiviral drugs such as delaying the incubation time before the initiation of viral transcription or reducing the transcription level, etc. Our study thus provides a model for evaluating the performance of any new antiviral drugs against the SARS-CoV-2 and their mechanism of action intensively.
The results from our infection model in human Caco-2 cells using digital droplet PCR assay has tracked the kinetic of the transcription profile of SARS-CoV-2 at the early cycle of replication. Although some studies also measured the transcription profile of this virus, primate origin cell lines, such as Vero cells, were used, which may not be physiologically relevant to the transcription property of SARS-CoV-2 in humans [10,11]. On the other hand, we traced the change of the viral transcription at every 2 h following 15 min after the infection. The results thus can provide a clear picture on how the viral transcription is being regulated during the first virus life cycle.
There was an obvious decrease of viral RNA at 2 h postinfection, suggesting that the input viral RNA was consumed for the translation after the entry step of SARS-CoV-2. It is known that the positive strand nature of the SARS-CoV-2 genomic RNA enables the virus to translate its own replicase–transcriptase-complex (RTC) by using host cell ribosomes [6]. Here, our data showed that SARS-CoV-2 requires about 6 h to hijack the host transcription machinery before it can further transcribe its subgenomic RNAs. We also found that there was absence of productive viral transcription in Caco-2 cells between 2 and 6 h postinfection. The study from Hofmann et al. showed that the viral transcription of bovine coronavirus (BCoV, beta-coronavirus) started at 3–4 h postinfection in human rectal tumor (HRT) cells [17]. The reason for the different transcription kinetics between the two coronaviruses will need to be further investigated. Moreover, it will be desirable to further explore the virology of the SARS-CoV-2 using primary lung epithelial cells or ex-vivo organoids.

5. Conclusions

In this study, we established 28 ddPCR assays with specific primers/probe sets to detect the transcription profiles of 15 NSP, 9 ORF, and 4 structural protein genes of SARS-CoV-2. The transcriptional kinetic of the viral genes of SARS-CoV-2 during the initial replication cycle in human cell was determined. We also found that SARS-CoV-2 takes around 6 h to hijack the cells before initiating a productive viral transcription process.

Supplementary Materials

The following are available online at https://www.mdpi.com/article/10.3390/pathogens10101274/s1, Figure S1: Primers and probes that designed on different conserve regions show no difference of results by ddPCR., Tables S1–S3: The identified viral mutations and their occurrence frequencies of the structural proteins (Table S1), non-structural proteins (Table S2) and accessary proteins (Table S3).

Author Contributions

Conceptualization, C.K.P.M. and C.-K.C.; methodology, C.K.P.M. and C.-K.C.; validation, K.-K.A., C.C., C.K.P.M. and C.-K.C.; formal analysis, K.-K.A., C.C., C.K.P.M., Y.-M.C., W.W.S.W., H.L. and C.-K.C.; investigation, K.-K.A., C.C., C.K.P.M. and C.-K.C.; resources, C.K.P.M. and C.-K.C.; data curation, C.K.P.M. and C.-K.C.; writing—original draft preparation, C.K.P.M. and C.-K.C.; writing—review and editing, K.-K.A., H.L., C.K.P.M. and C.-K.C.; visualization, C.K.P.M. and C.-K.C.; supervision, C.K.P.M. and C.-K.C.; funding acquisition, C.K.P.M. and C.-K.C. All authors have read and agreed to the published version of the manuscript.

Funding

This work is partially supported by Guangdong Province International Scientific and Technological Cooperation Projects (2020A0505100063), the National Research Foundation of Korea (NRF) grant funded through the Korea government (NRF-2018M3A9H4055203) and Calmette and Yersin scholarship from the Pasteur International Network Association (H.L.).

Institutional Review Board Statement

Informed and written consents were obtained from all participants and the study was approved by the Medtimes Medical Group Ethics Review Board.

Data Availability Statement

All data are reported in the manuscript and the supplementary materials.

Conflicts of Interest

K.K.A., Y.M.C., W.W.S.W. and C.K.C. are the employees of Medtimes Molecular Laboratory Limited, which is a privately-owned company in Hong Kong and provides SARS-CoV-2 diagnostic tests.

References

  1. WHO Website. Available online: https://www.who.int/emergencies/diseases/novel-coronavirus-2019 (accessed on 26 August 2021).
  2. Huang, C.; Wang, Y.; Li, X.; Ren, L.; Zhao, J.; Hu, Y.; Zhang, L.; Fan, G.; Xu, J.; Gu, X.; et al. Clinical features of patients infected with 2019 novel coronavirus in Wuhan, China. Lancet 2020, 395, 497–506. [Google Scholar] [CrossRef] [Green Version]
  3. Guan, W.J.; Ni, Z.Y.; Hu, Y.; Liang, W.H.; Ou, C.Q.; He, J.X.; Liu, L.; Shan, H.; Lei, C.L.; Hui, D.S.C.; et al. China Medical Treatment Expert Group for Covid-19. Clinical Characteristics of Coronavirus Disease 2019 in China. N. Engl. J. Med. 2020, 382, 1708–1720. [Google Scholar] [CrossRef] [PubMed]
  4. Mariano, G.; Farthing, R.J.; Lale-Farjat, S.L.M.; Bergeron, J.R.C. Structural Characterization of SARS-CoV-2: Where We Are, and Where We Need to Be. Front. Mol. Biosci. 2020, 7, 605236. [Google Scholar] [CrossRef] [PubMed]
  5. Hui, K.P.Y.; Cheung, M.C.; Perera, R.A.P.M.; Ng, K.C.; Bui, C.H.T.; Ho, J.C.W.; Ng, M.M.T.; Kuok, D.I.T.; Shih, K.C.; Tsao, S.W.; et al. Tropism, replication competence, and innate i mMune responses of the coronavirus SARS-CoV-2 in human respiratory tract and conjunctiva: An analysis in ex-vivo and in-vitro cultures. Lancet. Respir. Med. 2020, 8, 687–695. [Google Scholar] [CrossRef]
  6. V’kovski, P.; Kratzel, A.; Steiner, S.; Stalder, H.; Thiel, V. Coronavirus biology and replication: Implications for SARS-CoV-2. Nat. Rev. Microbiol. 2021, 19, 155–170. [Google Scholar] [CrossRef] [PubMed]
  7. Wong, N.A.; Saier, M.H., Jr. The SARS-Coronavirus Infection Cycle: A Survey of Viral Membrane Proteins, Their Functional Interactions and Pathogenesis. Int. J. Mol. Sci. 2021, 22, 1308. [Google Scholar] [CrossRef] [PubMed]
  8. Knoops, K.; Kikkert, M.; Worm, S.H.; Zevenhoven-Dobbe, J.C.; van der Meer, Y.; Koster, A.J.; Mo mMaas, A.M.; Snijder, E.J. Sars-coronavirus replication is supported by a reticulovesicular network of modified endoplasmic reticulum. PLoS Biol. 2008, 6, e226. [Google Scholar] [CrossRef] [PubMed]
  9. Snijder, E.J.; Limpens, R.; de Wilde, A.H.; de Jong, A.W.M.; Zevenhoven-Dobbe, J.C.; Maier, H.J.; Faas, F.; Koster, A.J.; Barcena, M. A unifying structural and functional model of the coronavirus replication organelle: Tracking down rna synthesis. PLoS Biol. 2020, 18, e3000715. [Google Scholar] [CrossRef] [PubMed]
  10. Telwatte, S.; Martin, H.A.; Marczak, R.; Fozouni, P.; Vallejo-Gracia, A.; Kumar, G.R.; Murray, V.; Lee, S.; Ott, M.; Wong, J.K.; et al. Novel RT-ddPCR assays for measuring the levels of subgenomic and genomic SARS-CoV-2 transcripts. Methods. 2021, 18, S1046-2023(21)00103-1. [Google Scholar] [CrossRef]
  11. Telwatte, S.; Kumar, N.; Vallejo-Gracia, A.; Kumar, G.R.; Lu, C.M.; Ott, M.; Wong, J.K.; Yukl, S.A. Novel RT-ddPCR Assays for determining the transcriptional profile of SARS-CoV-2. J. Virol. Methods. 2021, 114115. [Google Scholar] [CrossRef] [PubMed]
  12. Kim, D.; Lee, J.Y.; Yang, J.S.; Kim, J.W.; Kim, V.N.; Chang, H. The Architecture of SARS-CoV-2 Transcriptome. Cell 2021, 181, 914–921.e10. [Google Scholar] [CrossRef] [PubMed]
  13. Taylor, S.C.; Laperriere, G.; Germain, H. Droplet Digital PCR versus qPCR for gene expression analysis with low abundant targets: From variable nonsense to publication quality data. Sci. Rep. 2017, 7, 2409. [Google Scholar] [CrossRef] [PubMed] [Green Version]
  14. Kim, K.B.; Choi, H.; Lee, G.D.; Lee, J.; Lee, S.; Kim, Y.; Cho, S.Y.; Lee, D.G.; Kim, M. Analytical and Clinical Performance of Droplet Digital PCR in the Detection and Quantification of SARS-CoV-2. Mol. Diagn. Ther. 2021. In press. [Google Scholar]
  15. Zella, D.; Giovanetti, M.; Benedetti, F.; Unali, F.; Spoto, S.; Guarino, M.; Angeletti, S.; Ciccozzi, M. The variants question: What is the problem? J. Med. Virol. 2021. In press. [Google Scholar] [CrossRef] [PubMed]
  16. Nyaruaba, R.; Li, C.; Mwaliko, C.; Mwau, M.; Odiwuor, N.; Muturi, E.; Muema, C.; Xiong, J.; Li, J.; Yu, J.; et al. Developing multiplex ddPCR assays for SARS-CoV-2 detection based on probe mix and amplitude based multiplexing. Expert Rev. Mol. Diagn. 2021, 21, 119–129. [Google Scholar] [CrossRef] [PubMed]
  17. Hofmann, M.A.; Sethna, P.B.; Brian, D.A. Bovine coronavirus mRNA replication continues throughout persistent infection in cell culture. J. Virol. 1990, 64, 4108–4114. [Google Scholar] [CrossRef] [PubMed] [Green Version]
Figure 1. Genomic arrangement and coordinates of SARS-CoV-2. The encoding regions of different viral genes of SARS-CoV-2 (29,903bp, NC_045512) are shown. There are 16 nonstructural proteins (nsps 1 to 16) encoded by orf1a and orf1b, 4 structural proteins (S, E, M, and N), and 8 accessory proteins (orf3a/b, 6, 7a/b, 8, 9b, and 10). The transcription regulatory sequences (TRS) that is located after the Leader sequences (TRS-L) is highlighted in green dash lines. The TRS that is located before each individual open reading frame (TRS-B) are highlighted in blue dash lines.
Pathogens 10 01274 g001
Figure 2. Transcription profiles of different viral genes of SARS-CoV-2 in Caco-2 cells. Human Caco-2 cells were infected by the SARS-CoV-2 at a moi of 0.01 and the total RNA was collected at 15 min (0), and 2, 4, 6, 8, 10, and 12 h after infection. The transcription levels of the viral genes were determined by ddPCR using corresponding primers and probe. (A) Structural genes, (B) ORF genes, (C) NSP genes. All counts were normalized with endogenous control (RNase P gene).
Pathogens 10 01274 g002
Figure 3. Transcription profiles at the 3′ and 5′ end of the viral RNA in Caco-2 cells. Human Caco-2 cells were infected by the SARS-CoV-2 at a moi of 0.01 and the total RNA was collected at 15 min (0), and 2, 4, 6, 8, 10, and 12 h after infection. The transcription levels of the viral genes were determined by ddPCR using corresponding primers and probe. (A) The transcription quantification of the Leader–TRS, 3′ UTR, Orf10-3′ UTR and Leader-TRS-N. (B) The transcription quantification of orf1a (nsp2–3), orf1b (nsp12–13), and the 5′ UTR. All the counts were normalized with endogenous control (RNase P gene).
Pathogens 10 01274 g003
Table 1. Primers and probes for ddPCR.
Gene CategoriesTarget RegionsPrimer/ProbeSequence (5′ to 3′)Position Amplicon Size
Structural ProteinsS (A)ForwardGTGACATCTCTGGCATTAATGC25062–25173112
ReverseCCAAGTTCTTGGAGATCGATGAG
ProbeTGGCAACCTCATTGAGGCGGTC
EForwardGGTACGTTAATAGTTAATAGCGTAC26272–26395124
ReverseGACTCACGTTAACAATATTGCAG
ProbeTCCTTACTGCGCTTCGATTGTGTG
MForwardGTGGACATCTTCGTATTGCTG26959–27081123
ReverseCACGCTGCGAAGCTCCCAA
ProbeCAACAGTGATTTCTTTAGGCAGGTCC
N (A)ForwardGAAGTCACACCTTCGGGAAC29240–2932384
Reverse GACTTGATCTTTGAAATTTGGATCT
ProbeTGGTTGACCTACACAGGTGCCATC
Nonstructural Proteins (NSP)orf1a (nsp2–3)ForwardCCCTTGCACCTAATATGATGG2667–276296
ReverseCTTCTATCACAGTGTCATCACC
ProbeCTCAAAGGCGGTGCACCAACAAAG
orf1b (nsp12–13)ForwardCACTTCAAGGTATTGGGAACC16173–16304132
ReverseGGTCTACGTATGCAAGCACC
ProbeCAGTCTTACAGGCTGTTGGGGCTT
nsp1ForwardTTCAACGAGAAAACACACGTCC287–407121
ReverseCTTTAAGATGTTGACGTGCCTC
ProbeCTTTGGAGACTCCGTGGAGGAGG
nsp2ForwardGTATTAACGGGCTTATGTTGCTC2616–270691
ReverseGTGAAGGTATTGTTTGTTACCATC
ProbeCAGAAAAGTACTGTGCCCTTGCACC
nsp3 (A)ForwardGACATAGAAGTTACTGGCGATAG8249–8367119
ReverseGCATTAATATGACGCGCACTAC
ProbeCATGACACCCCGTGACCTTGG
nsp4ForwardGCTACAGAGAAGCTGCTTGTT9939–10051113
Reverse CAAAACAGCTGAGGTGATAGAG
ProbeCATCAGAACCTGAGTTACTGAAGTC
nsp5ForwardGGAGTTCATGCTGGCACAGA10562–10685124
ReverseCAGCGTACAACCAAGCTAAAAC
ProbeACAAGCAGCTGGTACGGACACAAC
nsp6ForwardGTGTTATGTATGCATCAGCTGTAG11310–1140495
Reverse ATTCATAAGTGTCCACACTCTCC
ProbeCACCATCATCATACACAGTTCTTGC
nsp7ForwardGTCAGATGTAAAGTGCACATCAG11851–1194595
ReverseACTGGACACATTGAGCCCACA
ProbeCTCAGTTTTGCAACAACTCAGAGTAG
nsp8ForwardGGCTAAATCTGAATTTGACCGTG12223–1229674
Reverse GGGTCATAGCTTGATCAGCC
ProbeCCAACTTACGTTGCATGGCTGCA
nsp9ForwardCTAAGAGTGATGGAACTGGTAC12855–1293884
ReverseCTTTAGGACCTTTAGGTGTGTCT
ProbeCCTACAAGGTGGTTCCAGTTCTG
nsp10ForwardTGCTGTAGATGCTGCTAAAGCT13025–1316988
ReverseTGTGTGTACACAACATCTTAACAC
ProbeTGGTTGTCCCCCACTAGCTAGA
nsp12ForwardGTCATGTGTGGCGGTTCACT15439–1551072
ReverseAGCATAAGCAGTTGTGGCATC
ProbeCCTGATGAGGTTCCACCTGGTTTAAC
nsp13ForwardCTATAGGTCCAGACATGTTCCTC17528–1760275
Reverse CCAAAGCACTCACAGTGTCAAC
ProbeCAGCAGGACAACGCCGACAAGTTC
nsp14ForwardGTATAACACGTTGCAATTTAGGTG19457–19604148
ReverseGTGTTCCAGAGGTTATAAGTATC
ProbeTCAGCTGGCTTTAGCTTGTGGGTT
nsp15ForwardGCATTTGAGCTTTGGGCTAAGC19780–1986182
Reverse CAGCAATGTCCACACCCAAAT
ProbeCAACATTAAACCAGTACCAGAGGTG
nsp16ForwardCAGGTACAGCTGTTTTAAGACAG20897–2097781
Reverse CATCAGAGACAAAGTCATTAAGATC
ProbeCAGCGTACCCGTAGGCAACC
Accessory Proteinsorf3aForwardCAAGGTGAAATCAAGGATGCTAC25441–2551777
ReverseGGGAGTGAGGCTTGTATCGG
ProbeCTTCAGATTTTGTTCGCGCTACTGC
orf6ForwardGTTTCATCTCGTTGACTTTCAGG27204–2728986
ReverseCAAGATTCCAAATGGAAACTTTAAAAG
ProbeCCTCATAATAATTAGTAATATCTCTGC
orf7aForwardGCTTTAGCACTCAATTTGCTTTTGC27566–2764075
Reverse AAACTGATCTGGCACGTAACTG
ProbeTGTCCTGACGGCGTAAAACACGTC
orf7bForwardGCTTTTTAGCCTTTCTGCTATTCC27790–2788495
ReverseGGCGTGACAAGTTTCATTATGATC
ProbeCTTTTGGTTCTCACTTGAACTGC
orf8ForwardCAGCACCTTTAATTGAATTGTGC28054–28193140
ReverseCACTACAAGACTACCCAATTTAGG
ProbeCCCATTCAGTACATCGATATCGG
orf9bForwardCCCAATAATACTGCGTCTTGG28409–2849284
ReverseTGGAACGCCTTGTCCTCGAG
ProbeCACCGCTCTCACTCAACATGGC
orf10ForwardTGGGCTATATAAACGTTTTCGCT29559–2964284
ReverseGTGCTATGTAGTTACGAGAATTC
ProbeCCGTTTACGATATATAGTCTACTC
OthersLeader–TRSForwardTTAAAGGTTTATACCTTCCCAGG2–7574
ReverseGTTCGTTTAGAGAACAGATCTAC
ProbeAACAAACCAACCAACTTTCGATCTCT
5′ UTRForwardGACAGGACACGAGTAACTCG155–22975
ReverseTGCTGATGATCGGCTGCAAC
ProbeCTGCAGGCTGCTTACGGTTTCG
3′ UTRForwardCACCACATTTTCACCGAGGC29719–2979577
ReverseCCATATAGGCAGCTCTCCC
ProbeCTGTACACTCGATCGTACTCCGC
Leader–TRS–NForwardCCCAGGTAACAAACCAACCAAC19–28332N/A
ReverseGGTCCACCAAACGTAATGCG
ProbeCCCCAAAATCAGCGAAATGCACC
orf10-3′ UTRForwardGAATTCTCGTAACTACATAGCAC29620–29743124
ReverseGCGTGGCCTCGGTGAAAATG
ProbeCATTAGGGAGGACTTGAAAGAGCC
S (B)ForwardGTTCTTGTGGATCCTGCTGC25305–2537874
ReverseGTAATGTAATTTGACTCCTTTGAGC
ProbeTGATGAAGACGACTCTGAGCCAG
N (B)ForwardCTCATCACGTAGTCGCAACAG28831–28940110
ReverseGCAGCAAAGCAAGAGCAGCA
ProbeCCTGCTAGAATGGCTGGCAATGGC
nsp3 (B)ForwardCGTTAAAGATTTCATGTCATTGTCTG8407–8513107
ReverseCTTGTCTAGTAGTTGCACATGTC
ProbeCTACGAAAACAAATACGTAGTGCTGCT
Endogenous ControlsRNase PForwardAGATTTGGACCTGCGAGCG28–11487
ReverseGCAACAACTGAATAGCCAAGG
ProbeTTCTGACCTGAAGGCTCTGCGCG
S(B), N(B), and nsp3(B): the alternative sets of primers/probes.
Table 2. CT value of the clinical specimens using the primers and probe designed in this study.
Sample (CT Value)
123456789101112
S14.616.915.925.124.525.826.626.419.516.615.713.7
E17.519.918.428.127.728.829.929.422.319.318.016.5
M17.719.619.127.826.129.029.829.522.319.518.816.9
N12.815.415.522.823.624.625.125.417.113.913.311.9
orf1a14.416.515.624.324.524.926.526.319.716.715.813.4
orf1b13.416.215.724.023.725.125.625.619.316.415.513.4
nsp114.016.615.624.424.225.626.026.419.816.916.013.7
nsp214.917.416.625.224.426.026.326.820.317.516.814.2
nsp314.817.216.724.923.726.026.026.619.917.316.413.9
nsp415.818.018.026.324.426.927.627.521.118.317.515.1
nsp515.418.018.125.624.426.827.627.821.118.417.615.2
nsp618.519.519.628.028.328.730.530.523.720.520.917.7
nsp715.517.616.825.424.525.927.226.920.917.917.315.0
nsp814.317.116.324.924.425.526.526.320.217.416.814.2
nsp915.017.416.625.425.226.326.827.320.617.917.314.7
nsp1014.917.617.325.425.426.527.227.520.818.017.214.7
nsp1214.917.717.425.625.026.227.126.520.518.117.514.8
nsp1314.016.616.324.424.024.926.227.219.717.016.213.9
nsp1414.116.816.624.524.225.426.226.219.817.016.213.9
nsp1515.618.017.525.925.826.627.427.221.118.417.515.3
nsp1613.616.415.924.223.524.625.825.419.416.415.613.6
orf3a15.317.315.625.125.625.827.427.419.516.515.813.9
orf616.818.918.027.228.128.929.929.621.018.117.715.6
orf7a13.316.215.424.024.525.226.225.818.315.014.412.7
orf7b13.815.914.823.924.325.125.925.617.914.814.612.3
orf814.216.515.224.124.625.326.525.920.217.216.514.9
orf9b12.814.713.922.623.523.725.324.815.712.913.010.6
orf1016.017.916.925.727.327.229.228.519.816.416.014.6
Publisher’s Note: MDPI stays neutral with regard to jurisdictional claims in published maps and institutional affiliations.

