Drug Resistance in Filarial Parasites Does Not Affect Mosquito Vectorial Capacity

 , ,
, , 
Abstract
1. Introduction
2. Results
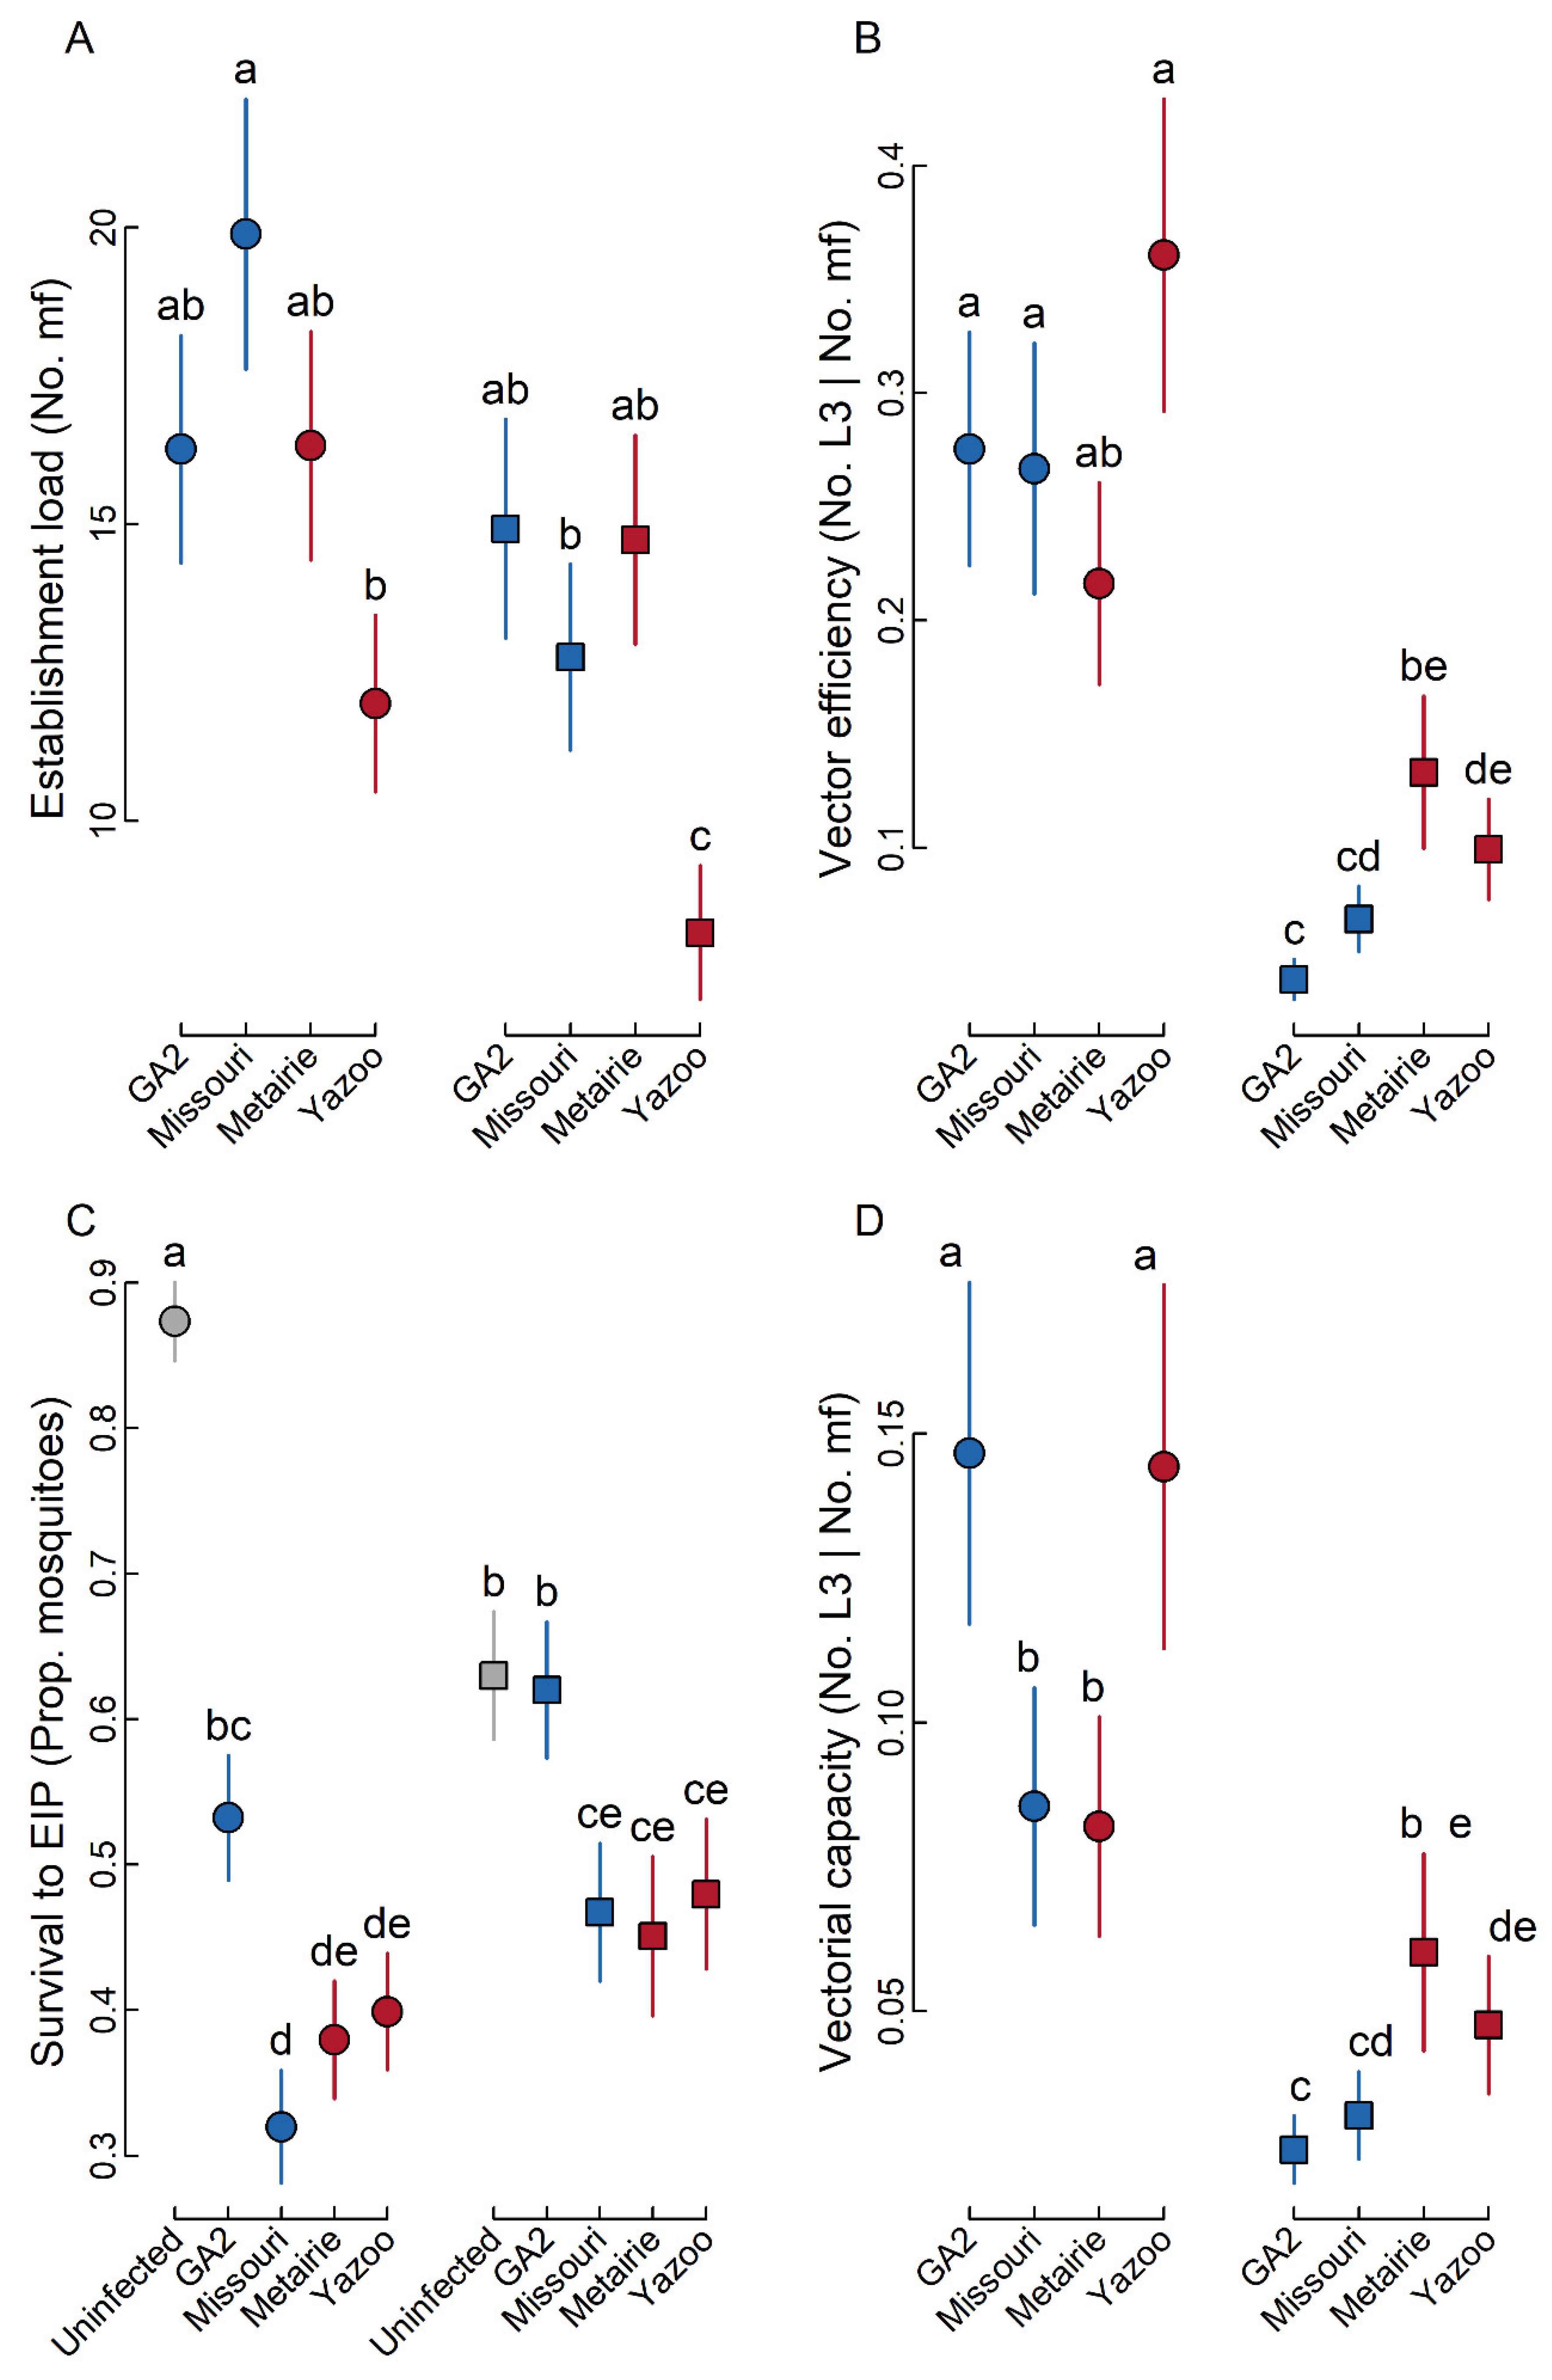
2.1. Establishment Load
2.2. Vector Efficiency
2.3. Survival to EIP
2.4. Vectorial Capacity
3. Discussion
4. Materials and Methods
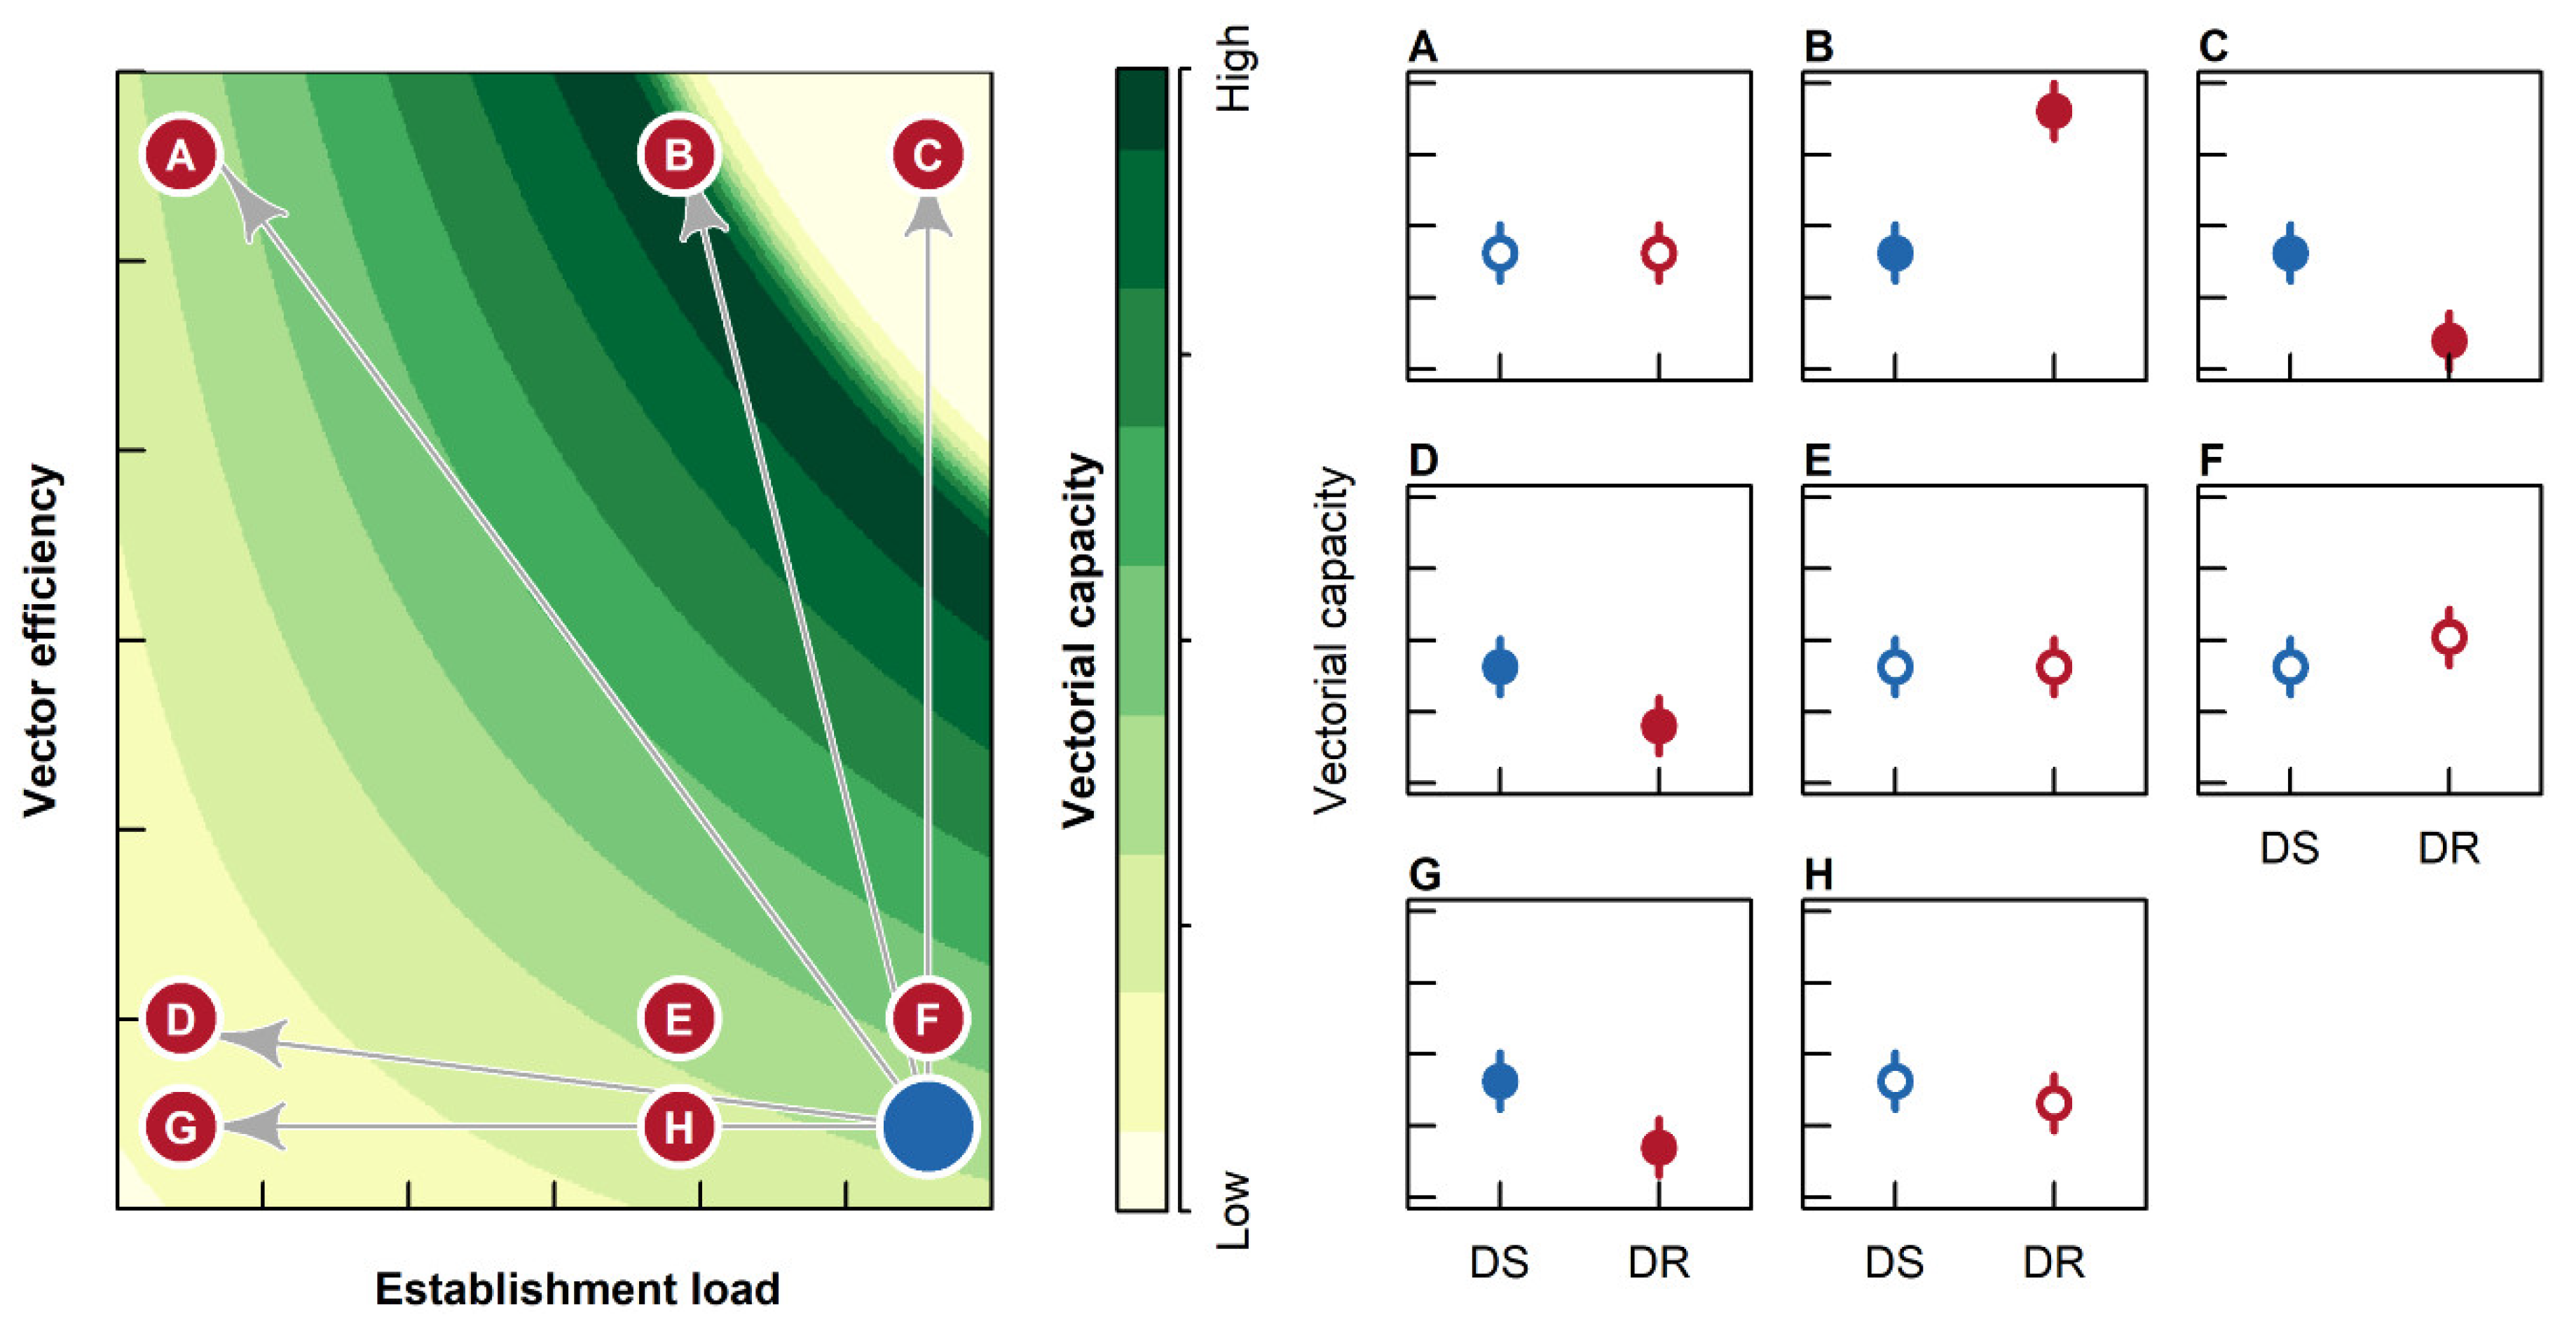
4.1. Simulation Model
4.2. Experimental Procedures
4.2.1. Establishment Load
4.2.2. Vector Efficiency
4.2.3. Survival to EIP
4.3. Study System
4.4. Data Analyses
4.4.1. Establishment Load
4.4.2. Vector Efficiency
4.4.3. Survival to EIP
4.4.4. Vectorial Capacity
Author Contributions
Funding
Acknowledgments
Conflicts of Interest
References
- WHO. Global Vector Control Response 2017–2030; World Health Organization: Geneva, Switzerland, 2017. [Google Scholar]
- Bhatt, S.; Weiss, D.J.; Cameron, E.; Bisanzio, D.; Mappin, B.; Dalrymple, U.; Battle, K.E.; Moyes, C.L.; Henry, A.; Eckhoff, P.A.; et al. The Effect of Malaria Control on Plasmodium falciparum in Africa between 2000 and 2015. Nature 2015, 526, 207. [Google Scholar] [CrossRef] [PubMed]
- Cibulskis, R.E.; Alonso, P.; Aponte, J.; Aregawi, M.; Barrette, A.; Bergeron, L.; Fergus, C.A.; Knox, T.; Lynch, M.; Patouillard, E.; et al. Malaria: Global progress 2000–2015 and Future Challenges. Infect. Dis. Poverty 2016, 5. [Google Scholar] [CrossRef] [PubMed]
- Cromwell, E.A.; Schmidt, C.A.; Kwong, K.T.; Pigott, D.M.; Mupfasoni, D.; Biswas, G.; Shirude, S.; Hill, E.; Donkers, K.M.; Abdoli, A.; et al. The Global Distribution of Lymphatic Filariasis, 2000–2018: A Geospatial Analysis. Lancet Glob. Health 2020, 8, e1186–e1194. [Google Scholar] [CrossRef]
- Conrad, M.D.; Rosenthal, P.J. Antimalarial Drug Resistance in Africa: The Calm before the Storm? Lancet Infect. Dis. 2019, 19, E338–E351. [Google Scholar] [CrossRef]
- Churcher, T.; Chanda, E.; Coetzee, M.; Davenport, M.; Diabate, A.; Djimde, A.; Dondorp, A.M.; Donnelly, M.; Hemingway, J.; Huijben, S.; et al. malERA: An Updated Research Agenda for Insecticide and Drug Resistance in Malaria Elimination and Eradication. PLoS Med. 2017, 14. [Google Scholar] [CrossRef]
- Misra-Bhattacharya, S.; Shahab, M. Progress in the Treatment and Control of Lymphatic Filariasis. In Lymphatic Filariasis: Epidemiology, Treatment and Prevention—The Indian Perspective; Tyagi, B.K., Ed.; Springer: Singapore, 2018; pp. 47–58. [Google Scholar]
- Long, G.H.; Graham, A.L. Consequences of Immunopathology for Pathogen Virulence Evolution and Public Health: Malaria as a Case Study. Evol. Appl. 2011, 4, 278–291. [Google Scholar] [CrossRef]
- Eisenstein, M. The Riddle of Resistance. Nature 2017, 543, S50–S51. [Google Scholar] [CrossRef]
- Webster, J.P.; Gower, C.M.; Norton, A.J. Evolutionary Concepts in Predicting and Evaluating the Impact of Mass Chemotherapy Schistosomiasis Control Programmes on Parasites and their Hosts. Evol. Appl. 2008, 1, 66–83. [Google Scholar] [CrossRef]
- Goodman, C.D.; Siregar, J.E.; Mollard, V.; Vega-Rodriguez, J.; Syafruddin, D.; Matsuoka, H.; Matsuzaki, M.; Toyama, T.; Sturm, A.; Cozijnsen, A.; et al. Parasites Resistant to the Antimalarial Atovaquone Fail to Transmit by Mosquitoes. Science 2016, 352, 349–353. [Google Scholar] [CrossRef]
- Ferguson, H.M.; Read, A.F. Why is the Effect of Malaria Parasites on Mosquito Survival still Unresolved? Trends Parasitol. 2002, 18, 256–261. [Google Scholar] [CrossRef]
- Erickson, S.M.; Xi, Z.; Mayhew, G.F.; Ramirez, J.L.; Aliota, M.T.; Christensen, B.M.; Dimopoulos, G. Mosquito Infection Responses to Developing Filarial Worms. PLoS Negl. Trop. Dis. 2009, 3, e529. [Google Scholar] [CrossRef] [PubMed]
- Dharmarajan, G.; Walker, K.D.; Lehmann, T. Variation in Tolerance to Parasites Affects Vectorial Capacity of Natural Asian Tiger Mosquito Populations. Curr. Biol. 2019, 29, 3946–3953. [Google Scholar] [CrossRef] [PubMed]
- McCall, J.W.; Genchi, C.; Kramer, L.H.; Guerrero, J.; Venco, L. Chapter 4 Heartworm Disease in Animals and Humans. In Advances in Parasitology; Academic Press: Cambridge, Massachusetts, UK, 2008; Volume 6610, pp. 193–285. [Google Scholar] [CrossRef]
- Bowman, D.D.; Atkins, C.E. Heartworm Biology, Treatment, and Control. Vet. Clin. N. Am. Small Anim. Pract. 2009, 39, 1127–1158. [Google Scholar] [CrossRef] [PubMed]
- McCall, J.W. The Role of Arthropods in the Development of Animal—Models for Filariasis Research. J. Ga. Entomol. Soc. 1981, 16, 283–293. [Google Scholar]
- Bowman, D.; Little, S.E.; Lorentzen, L.; Shields, J.; Sullivan, M.P.; Carlin, E.P. Prevalence and Geographic Distribution of Dirofilaria immitis, Borrelia burgdorferi, Ehrlichia canis, and Anaplasma phagocytophilum in Dogs in the United States: Results of a National Clinic-based Serologic Survey. Vet. Parasitol. 2009, 160, 138–148. [Google Scholar] [CrossRef]
- Wolstenholme, A.J.; Evans, C.C.; Jimenez, P.D.; Moorhead, A.R. The Emergence of Macrocyclic Lactone Resistance in the Canine Heartworm Dirofilaria immitis. Parasitology 2015, 142, 1249–1259. [Google Scholar] [CrossRef]
- Geary, T.G.; Bourguinat, C.; Prichard, R.K. Evidence for Macrocyclic Lactone Anthelmintic Resistance in Dirofilaria immitis. Top. Companion Anim. Med. 2011, 26, 186–192. [Google Scholar] [CrossRef]
- Lee, A.C.; Montgomery, S.P.; Theis, J.H.; Blagburn, B.L.; Eberhard, M.L. Public Health Issues Concerning the Widespread Distribution of Canine Heartworm Disease. Trends Parasitol. 2010, 26, 168–173. [Google Scholar] [CrossRef]
- Bowman, D.D.; Mannella, C. Macrocyclic lactones and Dirofilaria immitis Microfilariae. Top. Companion Anim. Med. 2011, 26, 160–172. [Google Scholar] [CrossRef]
- Berrafato, T.; Coates, R.; Reaves, B.J.; Kulke, D.; Wolstenholme, A.J. Macrocyclic Lactone Anthelmintic-induced Leukocyte Binding to Dirofilaria immitis Microfilariae: Influence of the Drug Resistance Status of the Parasite. Int. J. Parasitol. Drug Resist. 2019, 10, 45–50. [Google Scholar] [CrossRef]
- Sanchez, J.; Dharmarajan, G.; George, M.M.; Pulaski, C.; Wolstenholme, A.J.; Gilleard, J.S.; Kaplan, R.M. Using Population Genetics to Examine Relationships of Dirofilaria immitis based on both Macrocyclic Lactone-Resistance Status and Geography. Vet. Parasitol. 2020, 283, 10. [Google Scholar] [CrossRef] [PubMed]
- Bowman, D.D. Heartworms, macrocyclic lactones, and the specter of resistance to prevention in the United States. Parasites Vectors 2012, 5, 10. [Google Scholar] [CrossRef] [PubMed]
- Ertabaklar, H.; Malatyali, E.; Ertug, S. Drug Resistance in Parasitic Diseases. Eur. J. 2020, 26, 1–5. [Google Scholar] [CrossRef]
- Kaplan, R.M. Drug Resistance in Nematodes of Veterinary Importance: A Status Report. Trends Parasitol. 2004, 20, 477–481. [Google Scholar] [CrossRef] [PubMed]
- Mharakurwa, S.; Sialumano, M.; Liu, K.; Scott, A.; Thuma, P. Selection for Chloroquine-sensitive Plasmodium falciparum by Wild Anopheles arabiensis in Southern Zambia. Malar. J. 2013, 12, 6. [Google Scholar] [CrossRef] [PubMed]
- Mackinnon, M.J.; Marsh, K. The Selection Landscape of Malaria Parasites. Science 2010, 328, 866–871. [Google Scholar] [CrossRef]
- Edgerton, E.B.; McCrea, A.R.; Berry, C.T.; Kwok, J.Y.; Thompson, L.K.; Watson, B.; Fuller, E.M.; Nolan, T.J.; Lok, J.B.; Povelones, M. Activation of Mosquito Immunity Blocks the Development of Transmission-stage Filarial Nematodes. Proc. Natl. Acad. Sci. USA 2020, 117, 3711–3717. [Google Scholar] [CrossRef]
- Spence, P.J.; Jarra, W.; Levy, P.; Reid, A.J.; Chappell, L.; Brugat, T.; Sanders, M.; Berriman, M.; Langhorne, J. Vector Transmission Regulates Immune Control of Plasmodium Virulence. Nature 2013, 498, 228. [Google Scholar] [CrossRef]
- Pitts, R.J. A Blood-free Protein Meal Supporting Oogenesis in the Asian Tiger Mosquito, Aedes albopictus (Skuse). J. Insect Physiol. 2014, 64, 1–6. [Google Scholar] [CrossRef]
- Johnson, P. Miscellaneous Functions for GLMMs. 2016. Available online: https://github.com/pcdjohnson/GLMMmisc (accessed on 8 February 2020).
- Michalski, M.L.; Griffiths, K.G.; Williams, S.A.; Kaplan, R.M.; Moorhead, A.R. The NIH-NIAID Filariasis Research Reagent Resource Center. PLoS Negl. Trop. Dis. 2011, 5, e1261. [Google Scholar] [CrossRef]
- Buxton, B.A.; Mullen, G.R. Comparative Susceptibility of 4 Strains of Aedes aegypti (Diptera, Culicidae) to Infection with Dirofilaria immitis. J. Med. Entomol. 1981, 18, 434–440. [Google Scholar] [CrossRef]
- Lai, C.H.; Tung, K.C.; Ooi, H.K.; Wang, J.S. Competence of Aedes albopictus and Culex quinquefasciatus as Vector of Dirofilaria immitis after Blood Meal with Different Microfilarial Density. Vet. Parasitol. 2000, 90, 231–237. [Google Scholar] [CrossRef]
- Bartholomay, L.C.; Michel, K. Mosquito Immunobiology: The Intersection of Vector Health and Vector Competence. Annu. Rev. Entomol. 2018, 63, 145–167. [Google Scholar] [CrossRef] [PubMed]
- Hampshire, V.A. Evaluation of Efficacy of Heartworm Preventive Products at the FDA. Vet. Parasitol. 2005, 133, 191–195. [Google Scholar] [CrossRef]
- Bourguinat, C.; Keller, K.; Bhan, A.; Peregrine, A.; Geary, T.; Prichard, R. Macrocyclic Lactone Resistance in Dirofilaria immitis. Vet. Parasitol. 2011, 181, 388–392. [Google Scholar] [CrossRef]
- Pulaski, C.N.; Malone, J.B.; Bourguinat, C.; Prichard, R.; Geary, T.; Ward, D.; Klei, T.R.; Guidry, T.; Smith, G.; Delcambre, B.; et al. Establishment of Macrocyclic Lactone Resistant Dirofilaria immitis Isolates in Experimentally Infected Laboratory Dogs. Parasites Vectors 2014, 7, 9. [Google Scholar] [CrossRef]
- Bates, D.; Mächler, M.; Bolker, B.; Walker, S. Fitting Linear Mixed-Effects Models Using lme4. J. Stat. Softw. 2015, 67, 48. [Google Scholar] [CrossRef]
- Lenth, R.V. Least-Squares Means: The R Package lsmeans. J. Stat. Softw. 2016, 69, 33. [Google Scholar] [CrossRef]
- Shipley, B. Cause and Correlation in Biology: A User’s Guide to Path Analysis, Structural Equations and Causal Inference with R; Cambridge University Press: Cambridge, UK, 2016. [Google Scholar]
- Lefcheck, J.S. PIECEWISESEM: Piecewise Structural Equation Modeling in R for Ecology, Evolution, and Systematics. Methods Ecol. Evol. 2016, 7, 573–579. [Google Scholar] [CrossRef]
- Shipley, B. The AIC Model Selection Method Applied to Path Analytic Models Compared using a D-Separation Test. Ecology 2013, 94, 560–564. [Google Scholar] [CrossRef]
- Murphy, M. Semeff: Automatic Calculation of Effects for Piecewise Structural Equation Models. 2020. Available online: https://CRAN.R-project.org/package=semEff (accessed on 21 October 2020).
- Soetaert, K. Diagram: Functions for Visualising Simple Graphs (Networks), Plotting Flow Diagrams. 2020. Available online: https://CRAN.R-project.org/package=diagram (accessed on 21 October 2020).
- Breheny, P.; Burchett, W. Visualization of Regression Models Using visreg. R J. 2017, 9, 56–71. [Google Scholar] [CrossRef]


Publisher’s Note: MDPI stays neutral with regard to jurisdictional claims in published maps and institutional affiliations. |
© 2020 by the authors. Licensee MDPI, Basel, Switzerland. This article is an open access article distributed under the terms and conditions of the Creative Commons Attribution (CC BY) license (http://creativecommons.org/licenses/by/4.0/).
Share and Cite
Neff, E.; Evans, C.C.; Jimenez Castro, P.D.; Kaplan, R.M.; Dharmarajan, G. Drug Resistance in Filarial Parasites Does Not Affect Mosquito Vectorial Capacity. Pathogens 2021, 10, 2. https://doi.org/10.3390/pathogens10010002
Neff E, Evans CC, Jimenez Castro PD, Kaplan RM, Dharmarajan G. Drug Resistance in Filarial Parasites Does Not Affect Mosquito Vectorial Capacity. Pathogens. 2021; 10(1):2. https://doi.org/10.3390/pathogens10010002
Chicago/Turabian StyleNeff, Erik, Christopher C. Evans, Pablo D. Jimenez Castro, Ray M. Kaplan, and Guha Dharmarajan. 2021. "Drug Resistance in Filarial Parasites Does Not Affect Mosquito Vectorial Capacity" Pathogens 10, no. 1: 2. https://doi.org/10.3390/pathogens10010002
APA StyleNeff, E., Evans, C. C., Jimenez Castro, P. D., Kaplan, R. M., & Dharmarajan, G. (2021). Drug Resistance in Filarial Parasites Does Not Affect Mosquito Vectorial Capacity. Pathogens, 10(1), 2. https://doi.org/10.3390/pathogens10010002