Need for an Integrated Deprived Area “Slum” Mapping System (IDEAMAPS) in Low- and Middle-Income Countries (LMICs)

 ,
,  , ,
, ,  , , ,
, , ,  ,
,  , , and
Abstract

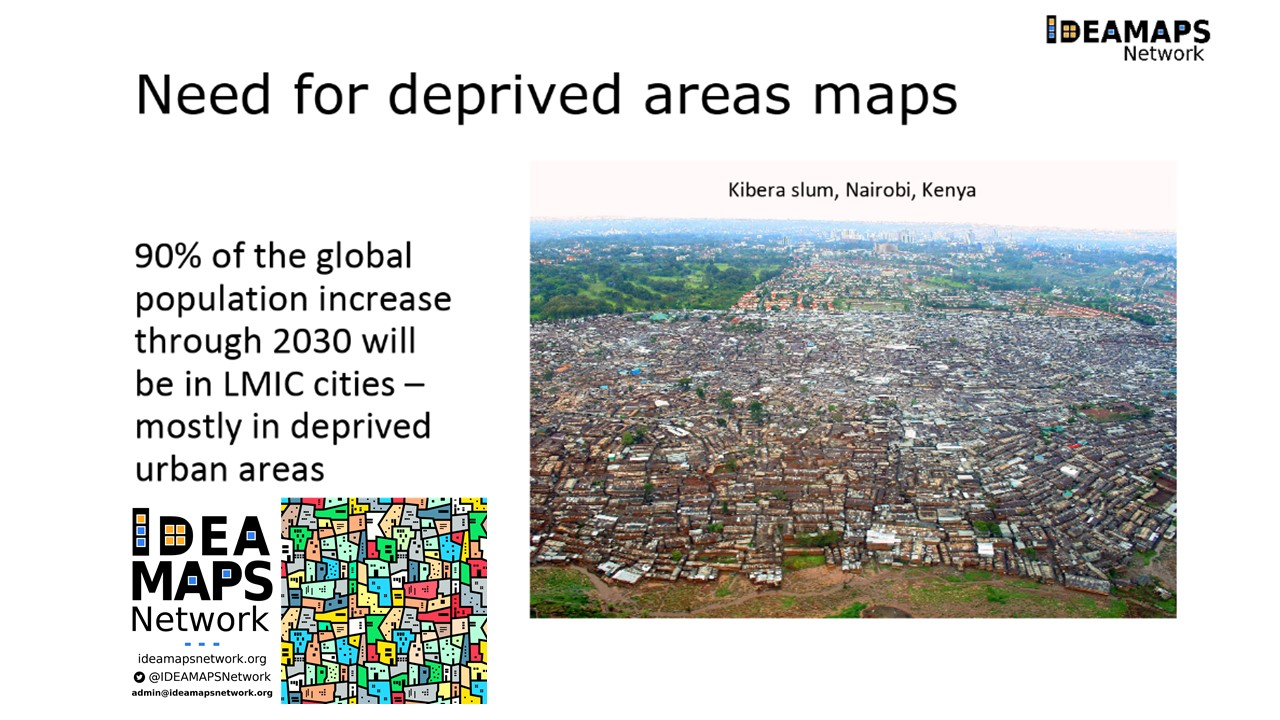
1. Introduction
2. Need for an Integrated Deprived Area Mapping System (IDEAMAPS)
2.1. Requirements for Area Deprivation Mapping
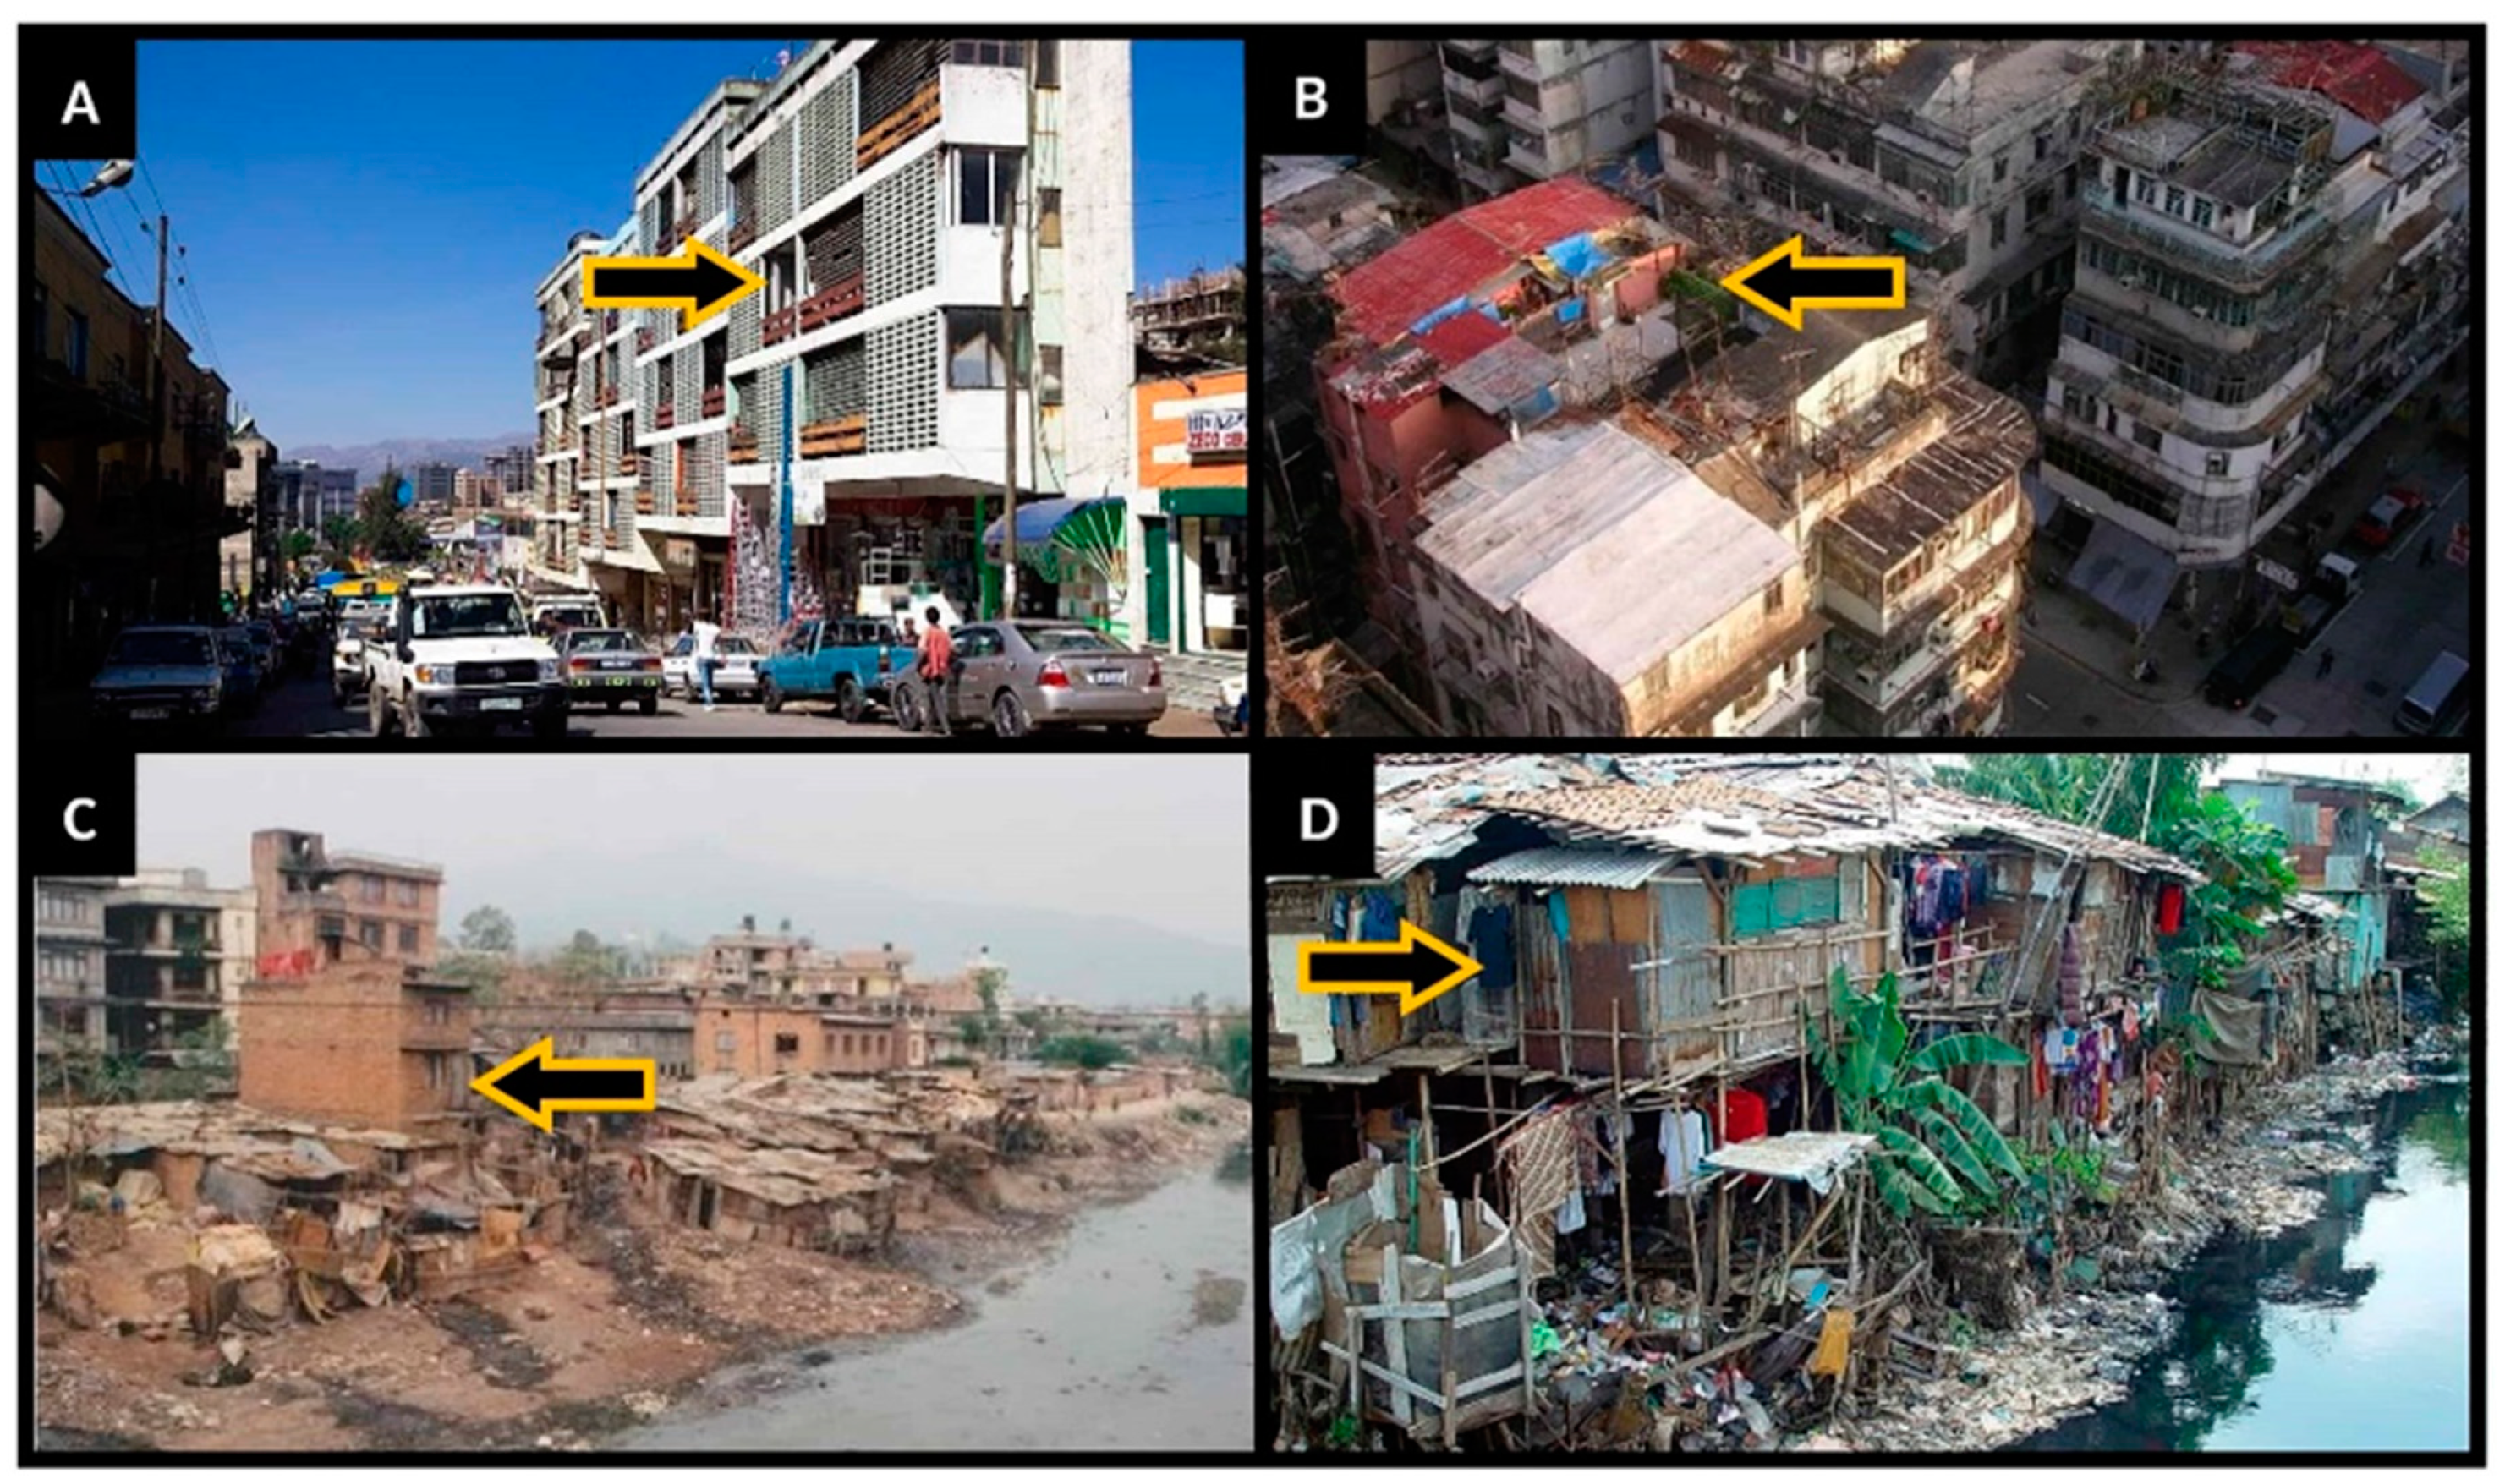
- Reflective of area physical characteristicsDeprived urban areas are often characterized by their morphology in the urban environment. Physical indicators of area deprivation include building size, shape, and height; road and other access networks; building density; settlement shape; and settlement location with respect to public green or blue spaces, steep slopes, flood zones, and proximity to railways and high voltage power lines (Kohli et al. 2012).
- Reflective of area social characteristicsDeprived urban areas are characterized by a wide range of features in the social environment. Social indicators of neighborhood deprivation may include crime levels; presence and practices of law enforcement; coverage and quality of solid waste, water, sanitation, and power systems; proximity and accessibility to schools, health facilities, shops, employment, and public infrastructure; and social capital derived from community-based organizations and among neighbors with shared identities (Lilford et al. 2019).
- Context dependentThe physical and social characteristics that define a given deprived area differ across cities and countries and even within the same neighborhood (Kuffer et al. 2016). Furthermore, neighborhoods are not static in that the specific characteristics that define deprivation at a moment in time change as the neighborhood evolves and policies and social forces unfold (Mahabir et al. 2018b).
- Comparable across cities and countriesTo adequately support national planning and programs, and to be used in global initiatives such as the SDGs, a level of consistency in deprived urban area definitions are needed across cities and countries (Ezeh et al. 2017).
- Updated frequently with timely dataDeprived urban areas are highly dynamic and can be transformed over very short periods. As deprived areas transition through different development stages, from low- to high-density, and as they experience major shifts in population due to demolitions or “overnight invasions” of new residents, frequent updates to deprived area maps are needed based on very timely data (Mahabir et al. 2018b). Further, areas previously classified as deprived need to be able to be classified as non-deprived as infrastructure and services improve, sometimes because of gentrification.
- Protective of individual privacy, and vulnerable populationsGiven the relatively high spatio-temporal resolution of neighborhood maps, approaches must ensure individual privacy in EO and other data, as well as transparency in the mapping methods. For example, public release of ultra high resolution drone imagery which shows trash piles behind property walls or inside roofless latrines is considered sensitive by citizens and should probably be avoided (Gevaert et al. 2018). There may additionally be a need to selectively filter or obfuscate exact boundaries of deprived areas to protect already vulnerable populations (Thomson et al. 2019).
- Developed via an inclusive multi-stakeholder processUrban “slums” do not emerge at random. The existence of deprived urban areas reflects histories of social inequality, exclusion, and/or oppression. For a deprived area to transition into a place that is “inclusive, safe, resilient and sustainable,” the policies and social attitudes that permitted its formation need to be addressed. Neighborhood transformation requires the involvement of communities, local authorities, and national governments (Ezeh et al. 2017; Lilford et al. 2017).
2.2. Existing Approaches to Area Deprivation Mapping
2.2.1. Aggregated “Slum Households” Approach
2.2.2. Field-Based Mapping
2.2.3. Human (Visual) Imagery Interpretation Approach
2.2.4. Machine Learning Imagery Classification Approach
3. Case Studies: Methods and Results
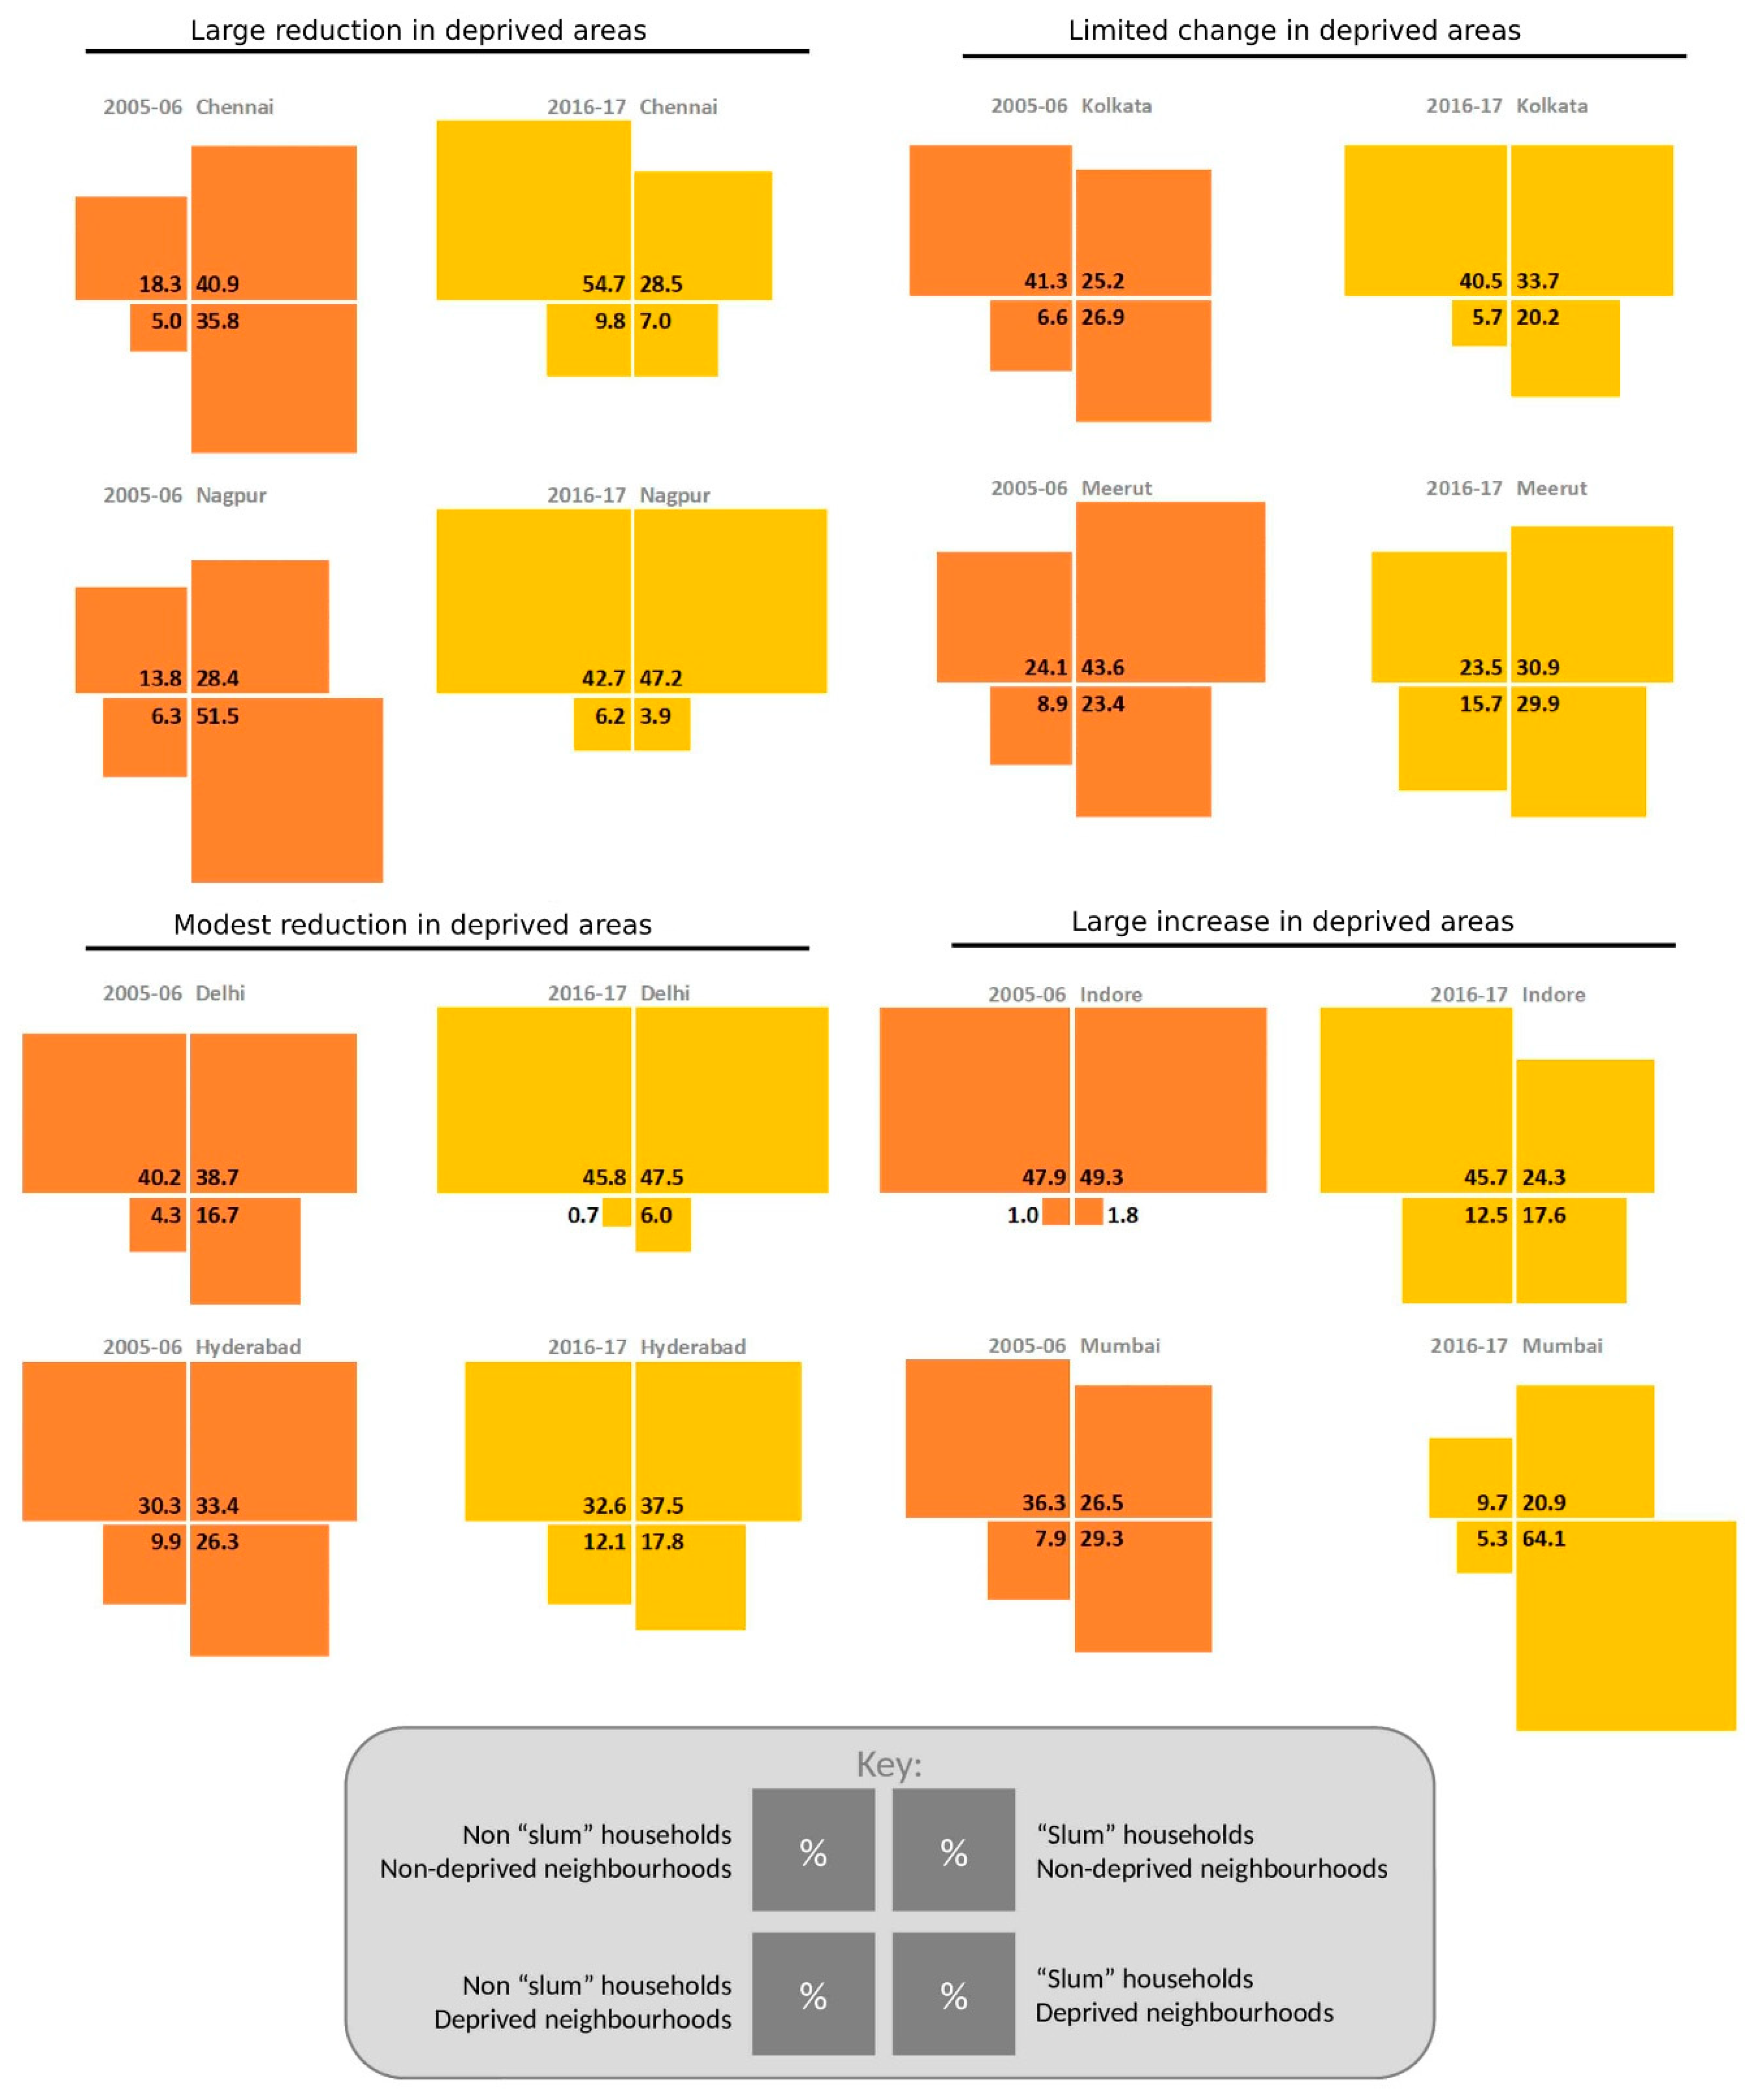
3.1. Eight Cities, India
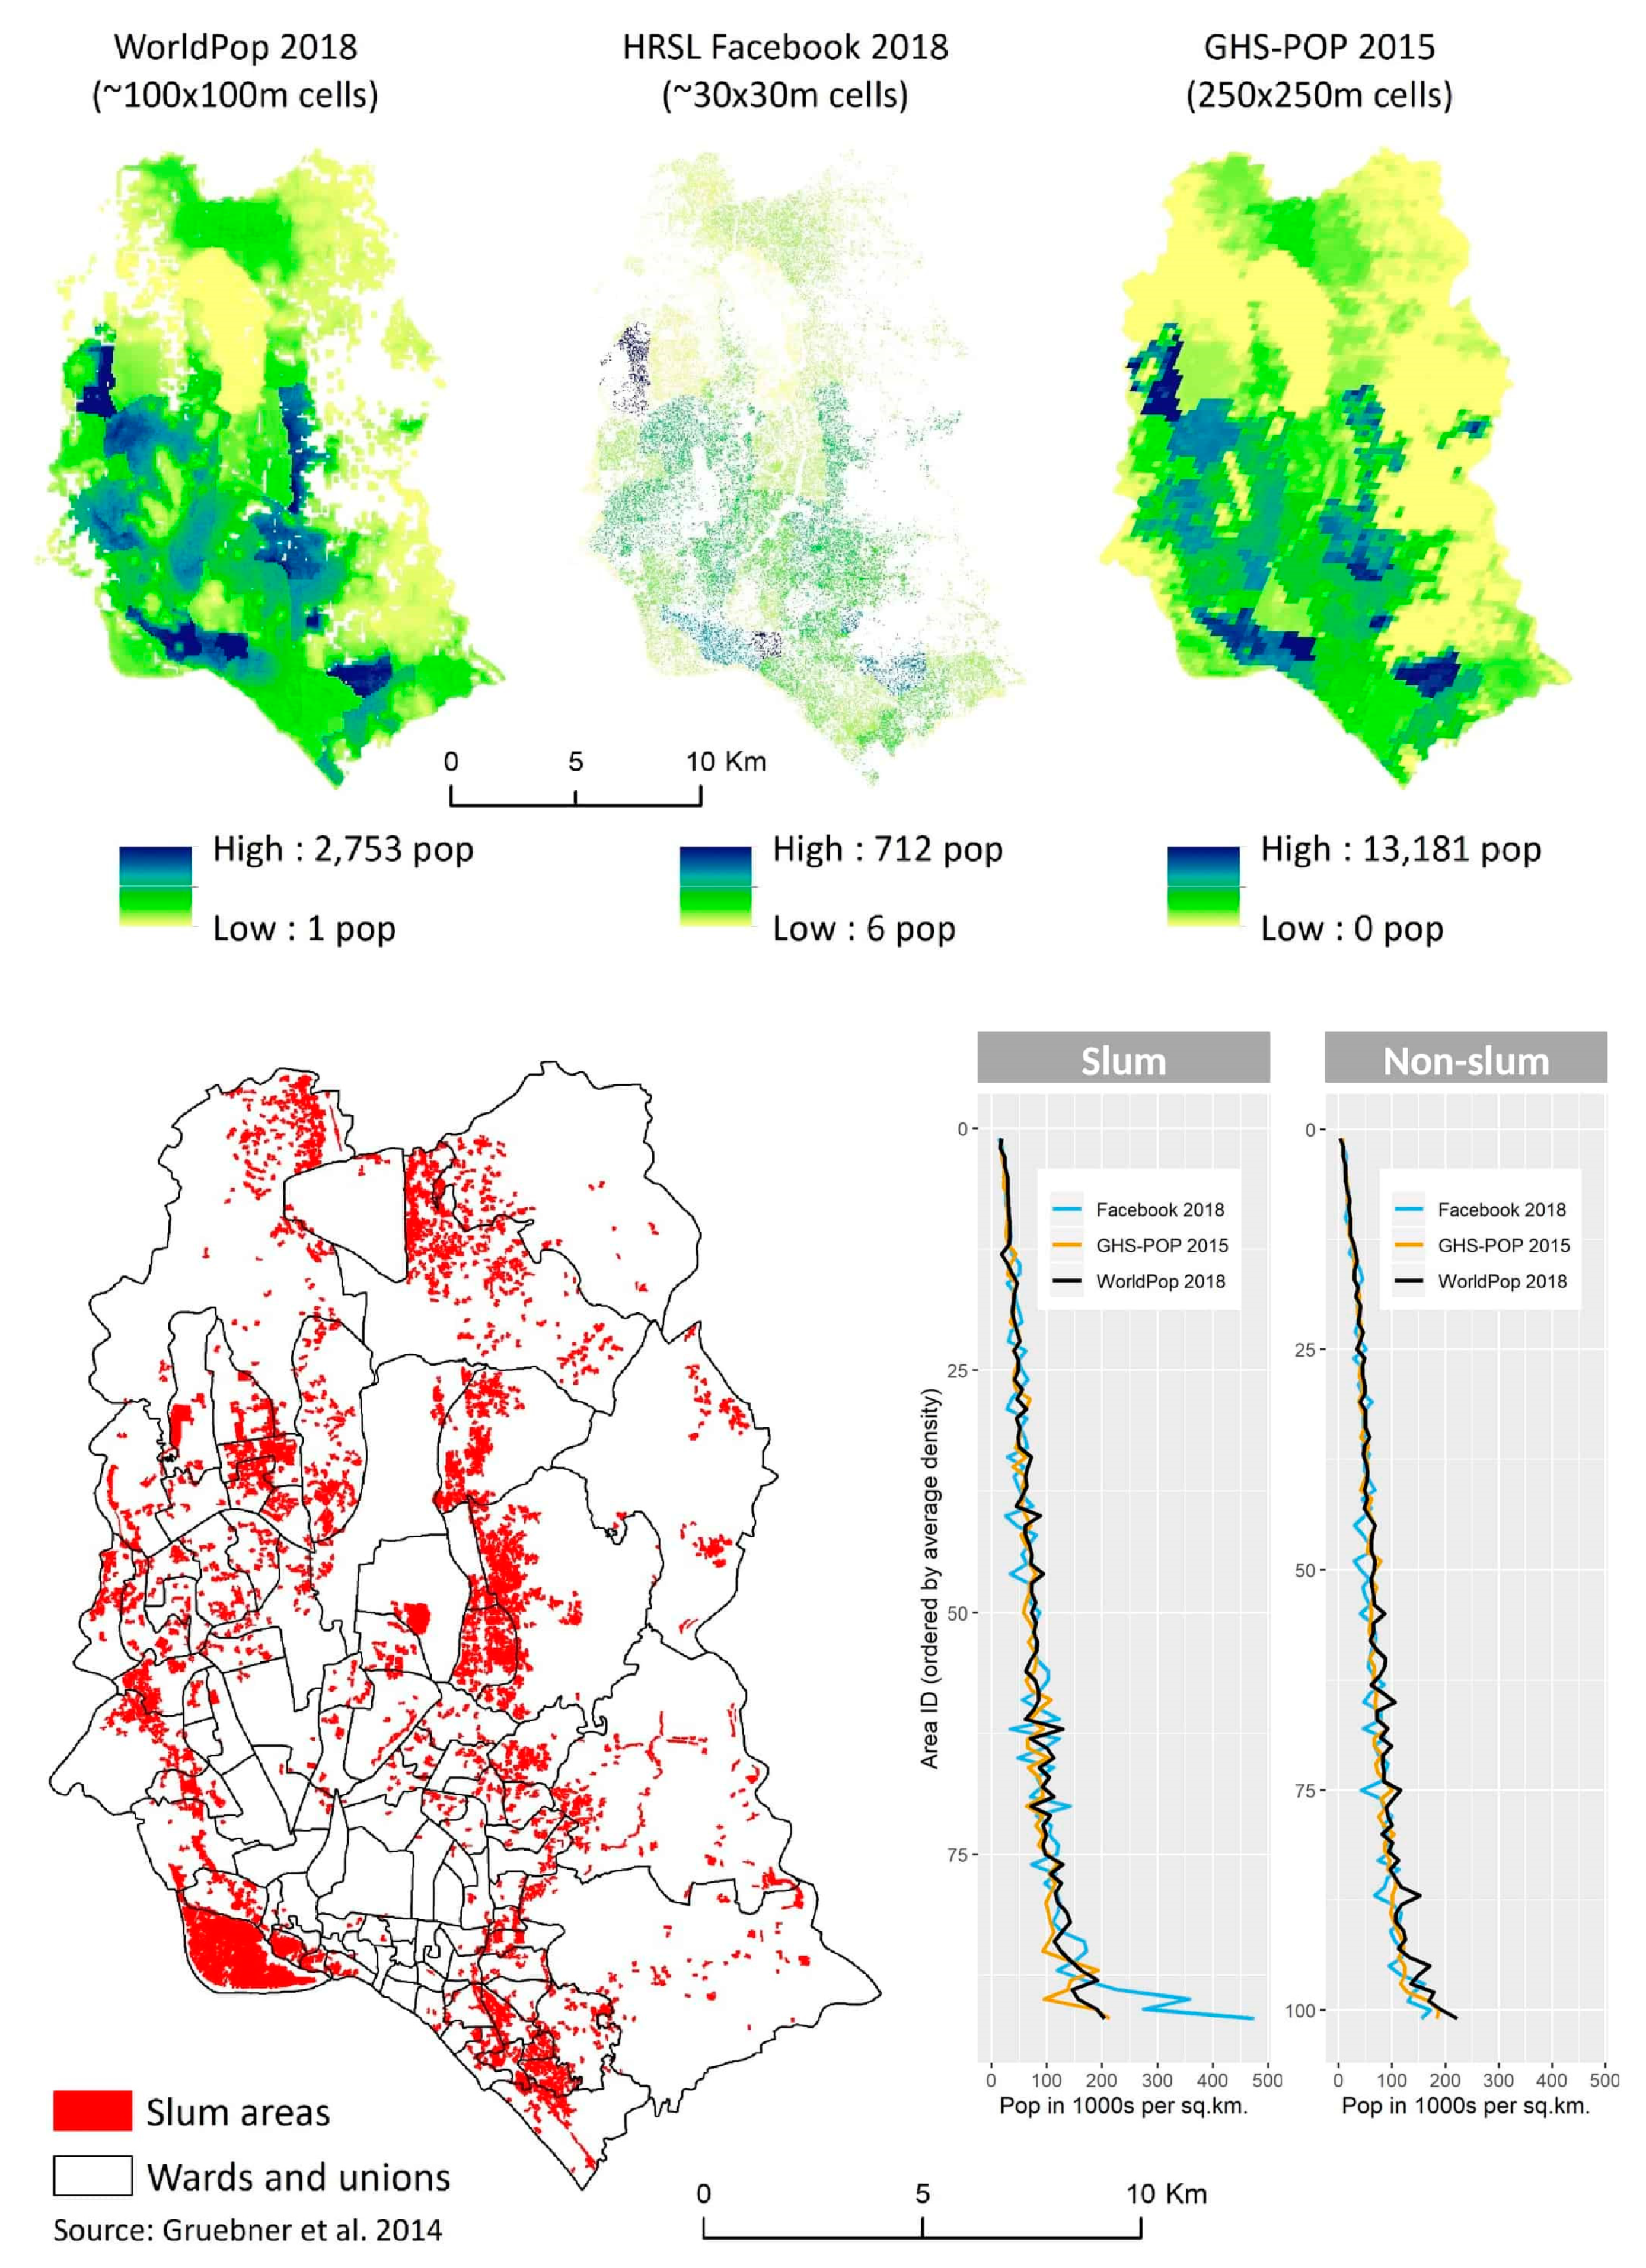
3.2. Dhaka, Bangladesh
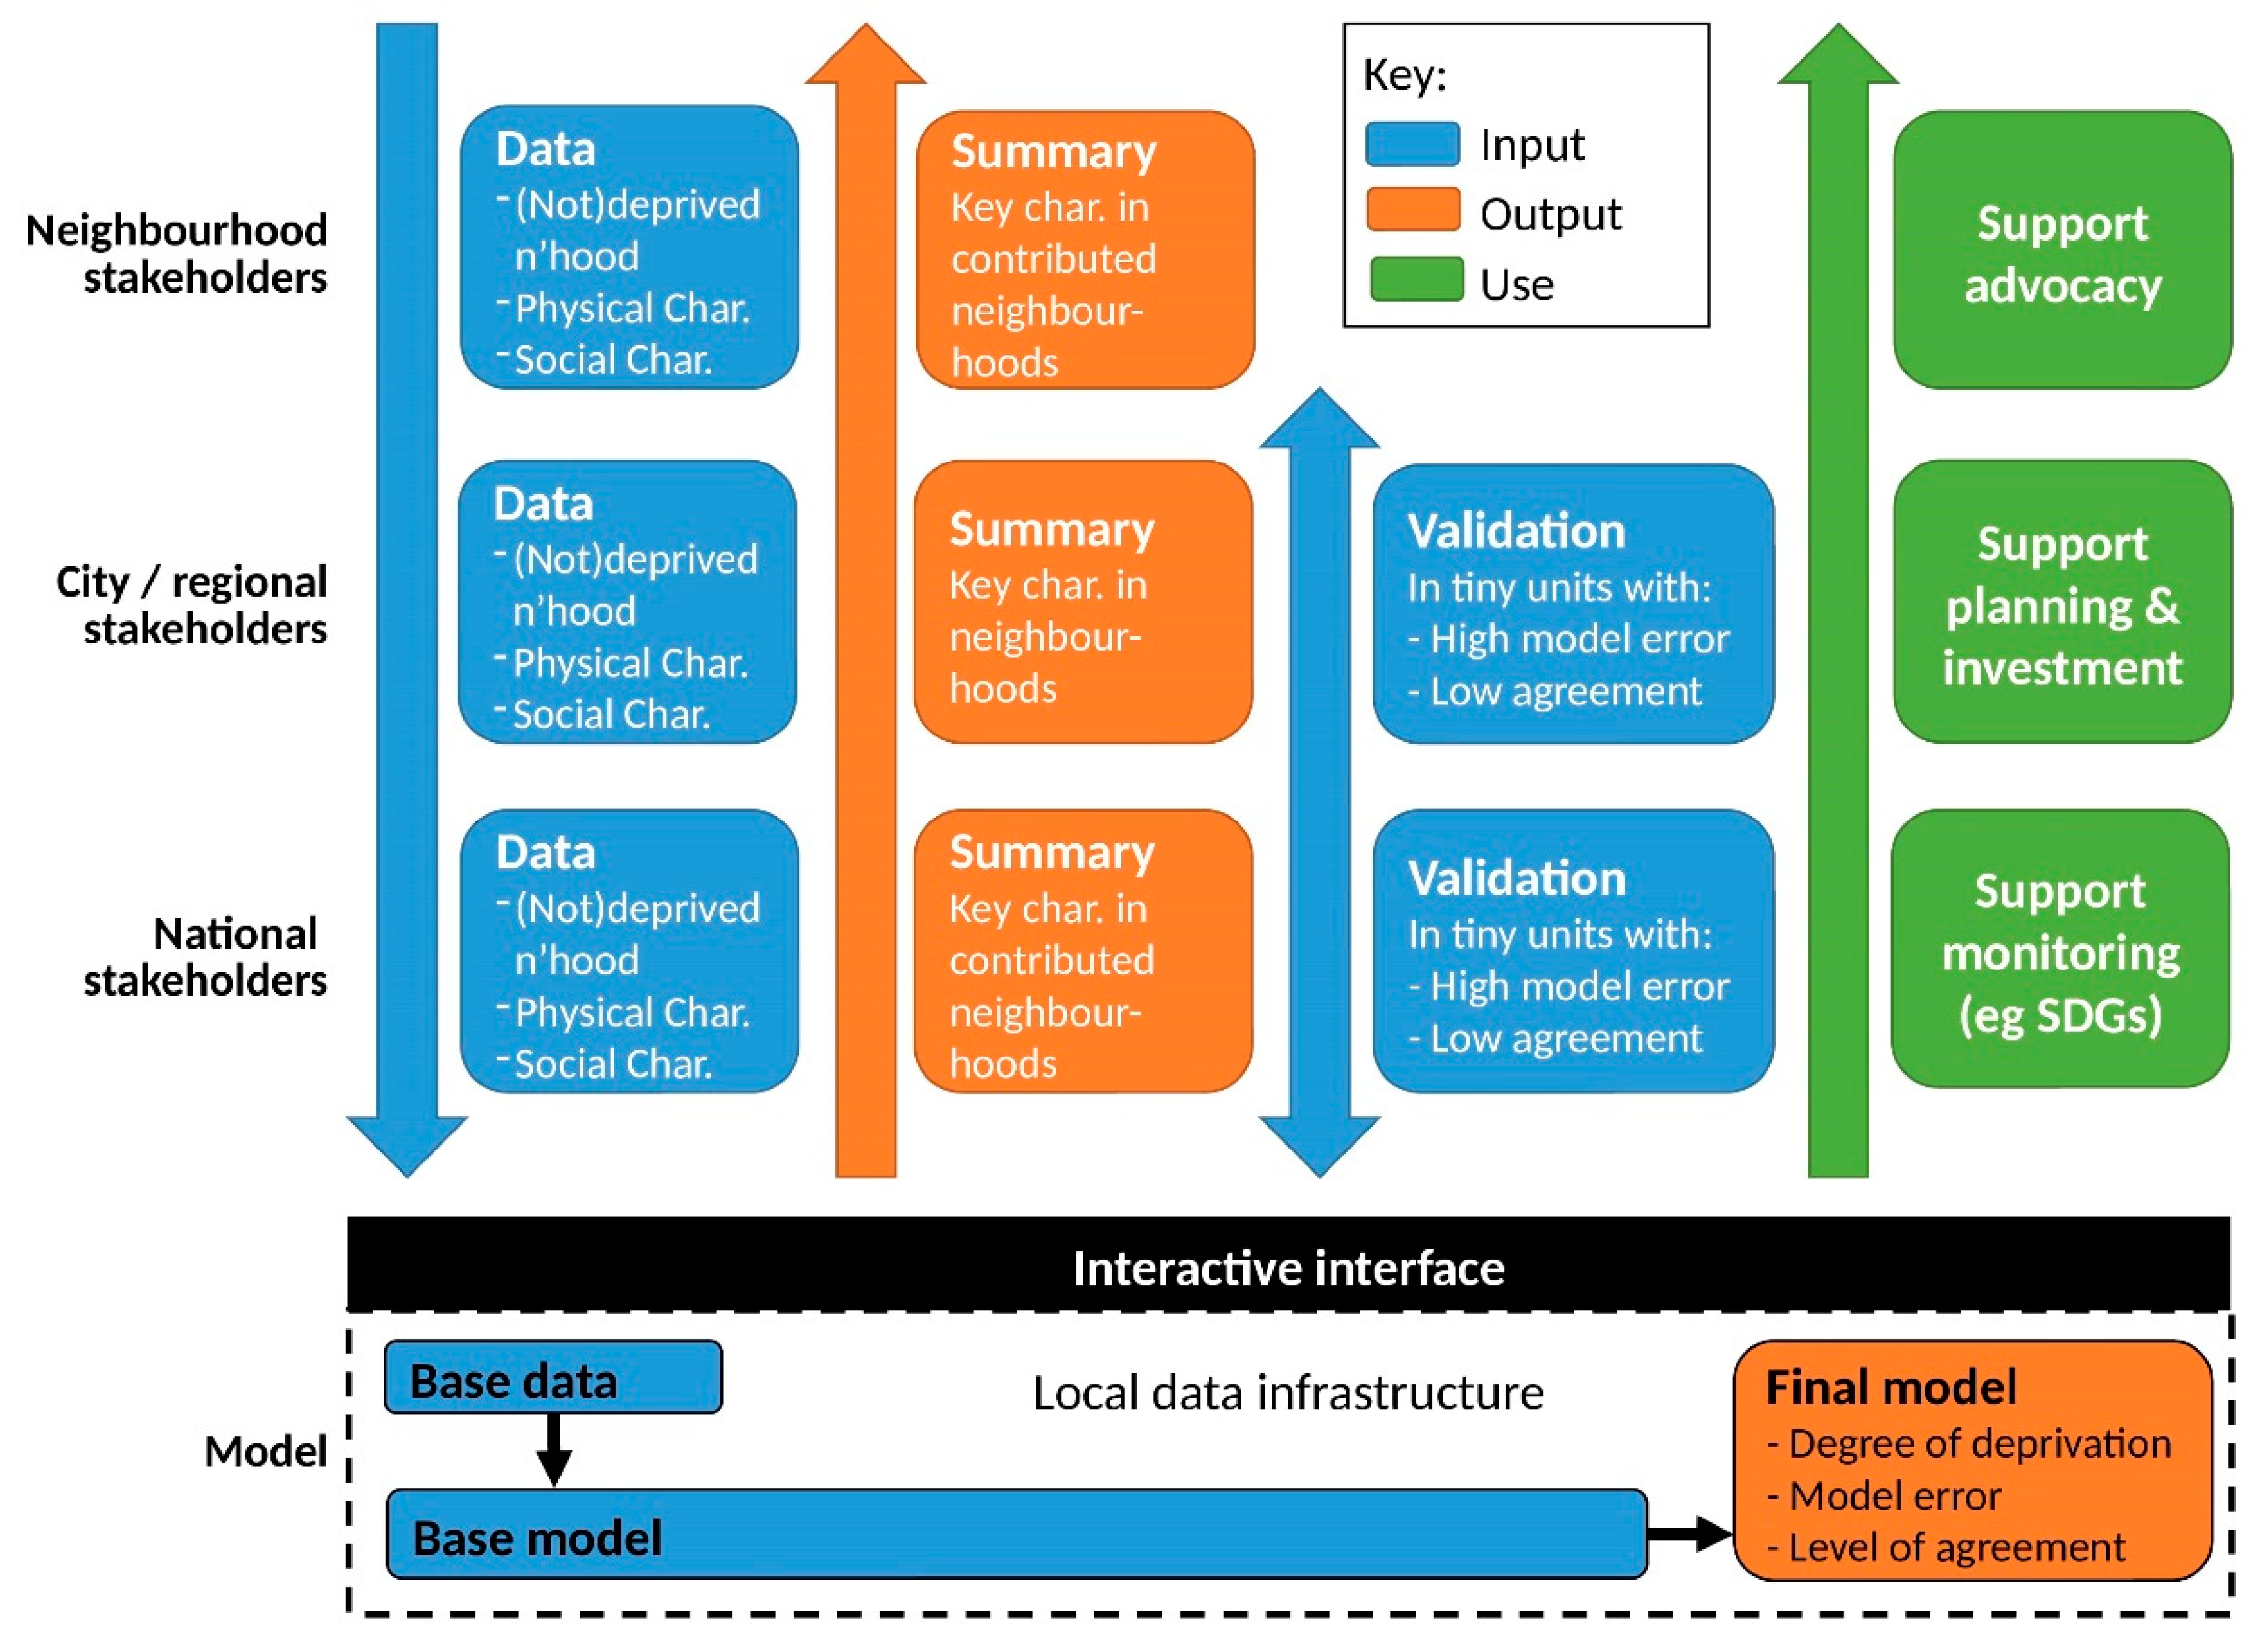
4. IDEAMAPS Framework
- leverages continual contributions of updated data from an ecosystem of national and local stakeholders,
- reflects the social and political realities on the ground, and
- provides a simple interface with predefined geospatial models allowing users to decide which datasets are suitable to model neighborhood deprivation for their specific needs, generating an up-to-date custom map on demand.
5. Discussion
6. Conclusions
Author Contributions
Funding
Acknowledgments
Conflicts of Interest
References
- Albuquerque, J. P. de, and A. A. de Almeida. 2020. Modes of engagement: reframing ‘sensing’ and data generation in citizen science for empowering relationships. In Toxic Truths: Environmental Justice and Citizen Science in a Post Truth Age. Edited by T. Davies and A. Mah. Manchester: Manchester University Press. [Google Scholar]
- Angeles, Gustavo, Peter Lance, Janine Barden-o Fallon, Nazrul Islam, AQM Mahbub, and Nurul Islam Nazem. 2009. The 2005 Census and Mapping of Slums in Bangladesh: Design, Select Results and Application. International Journal of Health Geographics 8: 1–19. [Google Scholar] [CrossRef]
- Bramante, James F., and Durairaju Kumaran Raju. 2013. Predicting the Distribution of Informal Camps Established by the Displaced after a Catastrophic Disaster, Port-Au-Prince, Haiti. Applied Geography 40: 30–39. [Google Scholar] [CrossRef]
- Chitekwe-Biti, Beth, Patience Mudimu, George Masimba Nyama, and Takudzwa Jera. 2012. Developing an Informal Settlement Upgrading Protocol in Zimbabwe—The Epworth Story. Environment and Urbanization 24: 131–48. [Google Scholar] [CrossRef]
- Engstrom, Ryan, Caetlin Ofiesh, David Rain, Henry Jewell, and John Weeks. 2013. Defining Neighborhood Boundaries for Urban Health Research in Developing Countries: A Case Study of Accra, Ghana. Journal of Maps 9: 36–42. [Google Scholar] [CrossRef] [PubMed]
- European Commission. 2017. Global Human Settlement Population Model (GHS-POP). Available online: http://ghsl.jrc.ec.europa.eu/ghs_pop.php (accessed on 5 May 2020).
- Ezeh, Alex, Oyinlola Oyebode, David Satterthwaite, Yen-Fu Chen, Robert Ndugwa, Jo Sartori, Blessing Mberu, G. J. Melendez-Torres, Tilahun Haregu, Samuel I. Watson, and et al. 2017. The History, Geography, and Sociology of Slums and the Health Problems of People Who Live in Slums. The Lancet 389: 547–58. [Google Scholar] [CrossRef]
- Facebook. 2020. Population Density Maps. Data for Good. Available online: https://dataforgood.fb.com/tools/population-density-maps/ (accessed on 5 May 2020).
- Fink, Günther, Isabel Günther, and Kenneth Hill. 2014. Slum Residence and Child Health in Developing Countries. Demography 51: 1175–97. [Google Scholar] [CrossRef]
- Friesen, John, Hannes Taubenböck, Michael Wurm, and Peter F. Pelz. 2018. The Similar Size of Slums. Habitat International 73: 79–88. [Google Scholar] [CrossRef]
- Friesen, John, Victoria Friesen, Ingo Dietrich, and Peter F. Pelz. 2020. Slums, Space, and State of Health—A Link between Settlement Morphology and Health Data. International Journal of Environmental Research and Public Health 17: 2022. [Google Scholar] [CrossRef]
- Gevaert, Caroline M., Richard Sliuzas, Claudio Persello, and George Vosselman. 2018. Evaluating the Societal Impact of Using Drones to Support Urban Upgrading Projects. ISPRS International Journal of Geo-Information 7: 91. [Google Scholar] [CrossRef]
- Global Land Tool Network. 2017. Social Tenure Domain Model. Available online: https://stdm.gltn.net/ (accessed on 5 May 2020).
- Gruebner, Oliver, Jonathan Sachs, Anika Nockert, Michael Frings, Md. Mobarak Hossain Khan, Tobia Lakes, and Patrick Hostert. 2014. Mapping the Slums of Dhaka from 2006 to 2010. Dataset Papers in Science 2014: 1–7. [Google Scholar] [CrossRef]
- Ibrahim, Mohamed R., Helena Titheridge, Tao Cheng, and James Haworth. 2019. PredictSLUMS: A New Model for Identifying and Predicting Informal Settlements and Slums in Cities from Street Intersections Using Machine Learning. Computers, Environment and Urban Systems 76: 31–56. [Google Scholar] [CrossRef]
- IDEAMAPS Network. 2020. Home. Available online: www.ideamapsnetwork.org (accessed on 5 May 2020).
- IIPS, ICF International. 2017. National Family Health Survey (NFHS-4) 2015-16: India. Mumbai India. Available online: https://dhsprogram.com/pubs/pdf/FR339/FR339.pdf (accessed on 5 May 2020).
- IIPS, and Macro International. 2007. National Family Health Survey (NFHS-3), 2005–06: India. Vol. I. Mumbai India. Available online: https://dhsprogram.com/pubs/pdf/FRIND3/FRIND3-Vol1AndVol2.pdf (accessed on 5 May 2020).
- Improving Health in Slums Collaborative. 2019. A protocol for a multi-site, spatially- referenced household survey in slum settings: methods for access, sampling frame construction, sampling, and field data collection. BMC Medical Research Methodology 19: 109. [Google Scholar] [CrossRef] [PubMed]
- Islam, Nazrul, A. Q. M. Mahbub, Nurul. I. Nazem, Gustavo Angeles, and Peter Lance. 2006. Slums of Urban Bangladesh: Mapping and Census, 2005. Dhaka: Center for Urban Studies. ISBN 978-0-9842585-6-7. [Google Scholar]
- Kohli, Divyani, Richard Sliuzas, Norman Kerle, and Alfred Stein. 2012. An Ontology of Slums for Image-Based Classification. Computers, Environment and Urban Systems 36: 154–63. [Google Scholar] [CrossRef]
- Kohli, Divyani, Alfred Stein, and Richard Sliuzas. 2016a. Uncertainty Analysis for Image Interpretations of Urban Slums. Computers, Environment and Urban Systems 60: 37–49. [Google Scholar] [CrossRef]
- Kohli, Divyani, Richard Sliuzas, and Alfred Stein. 2016b. Urban Slum Detection Using Texture and Spatial Metrics Derived from Satellite Imagery. Journal of Spatial Science 61: 405–26. [Google Scholar] [CrossRef]
- Kuffer, Monika, Joana Barros, and Richard V. Sliuzas. 2014. The Development of a Morphological Unplanned Settlement Index Using Very-High-Resolution (VHR) Imagery. Computers, Environment and Urban Systems 48: 138–52. [Google Scholar] [CrossRef]
- Kuffer, Monika, Karin Pfeffer, and Richard Sliuzas. 2016. Slums from Space—15 Years of Slum Mapping Using Remote Sensing. Remote Sensing 8: 455. [Google Scholar] [CrossRef]
- Kuffer, Monika, Jiong Wang, Michael Nagenborg, Karin Pfeffer, Divyani Kohli, Richard Sliuzas, and Claudio Persello. 2018. The Scope of Earth-Observation to Improve the Consistency of the SDG Slum Indicator. ISPRS International Journal of Geo-Information 7: 428. [Google Scholar] [CrossRef]
- Lemma, Tsion, Richard Sliuzas, and Monika Kuffer. 2006. Participatory Approach to Monitoring Slum Conditions: An Example from Ethiopia. In Mapping for Change: Practice, Technologies and Communication: Proceedings of the International Conference on Participatory Spatial Information Management and Communication. Edited by Giacomo Rambaldi, Jon Corbett, Rachel Olson, Mike McCall, Julius Muchemi, Peter K. Kyem, Daniel Weiner and Robert Chambers. London: IIED, pp. 58–66. [Google Scholar]
- Leonita, Gina, Monika Kuffer, Richard Sliuzas, and Claudio Persello. 2018. Machine Learning-Based Slum Mapping in Support of Slum Upgrading Programs: The Case of Bandung City, Indonesia. Remote Sensing 10: 1522. [Google Scholar] [CrossRef]
- Leyk, Stefan, Andrea E. Gaughan, Susana B. Adamo, Alex de Sherbinin, Deborah Balk, Sergio Freire, and Amy Rose. 2019. Allocating People to Pixels: A Review of Large-Scale Gridded Population Data Products and Their Fitness for Use. Earth System Science Data Discussions 11: 1385–409. [Google Scholar] [CrossRef]
- Lilford, Richard J., Oyinlola Oyebode, David Satterthwaite, Yen-Fu Chen, Blessing Mberu, Samuel I Watson, and Jo Sartori. 2017. Improving the Health and Welfare of People Who Live in Slums. The Lancet 389: 559–70. [Google Scholar] [CrossRef]
- Lilford, Richard, Catherine Kyobutungi, Robert Ndugwa, Jo Sartori, Samuel I. Watson, Richard Sliuzas, Monika Kuffer, Timothy Hofer, Joao Porto de Albuquerque, and Alex Ezeh. 2019. Because Space Matters: Conceptual Framework to Help Distinguish Slum from Non-Slum Urban Areas. BMJ Global Health 4: e001267. [Google Scholar] [CrossRef] [PubMed]
- Mahabir, Ron, Andrew Crooks, Arie Croitoru, and Peggy Agouris. 2016. The Study of Slums as Social and Physical Constructs: Challenges and Emerging Research Opportunities. Regional Studies, Regional Science 3: 399–419. [Google Scholar] [CrossRef]
- Mahabir, Ron, Peggy Agouris, Anthony Stefanidis, Arie Croitoru, and Andrew T. Crooks. 2018a. Detecting and Mapping Slums Using Open Data: A Case Study in Kenya Detecting and Mapping Slums Using Open Data: A Case Study in Kenya. International Journal of Digital Earth, 1–25. [Google Scholar] [CrossRef]
- Mahabir, Ron, Arie Croitoru, Andrew Crooks, Peggy Agouris, and Anthony Stefanidis. 2018b. A Critical Review of High and Very High-Resolution Remote Sensing Approaches for Detecting and Mapping Slums: Trends, Challenges and Emerging Opportunities. Urban Science 2: 8. [Google Scholar] [CrossRef]
- Map Kibera Trust. 2009. Map Kibera. Available online: https://mapkibera.org (accessed on 5 May 2020).
- Mayne, Alan. 2017. Slums: The History of a Global Injustice. London: Reaktion Books Ltd. [Google Scholar]
- MHUPA. 2013. State of Slums in India: A Statistical Compendium. Mumbai India. Available online: http://nbo.nic.in/pdf/Slums_in_India_Compendium_English_Version.pdf (accessed on 5 May 2020).
- Nairobi City County. 2018. Mukuru SPA Project. Available online: https://www.muungano.net/mukuru-spa (accessed on 5 May 2020).
- Nuissl, Henning, and Dirk Heinrichs. 2013. Slums: Perspectives on the Definition, the Appraisal and the Management of an Urban Phenomenon. Journal of the Geographical Society of Berlin 144: 105–16. [Google Scholar] [CrossRef]
- Ortiz, Isabel, and Matthew Cummins. 2011. Global Inequality: Beyond the Bottom Billion—A Rapid Review of Income Distribution in 141 Countries. Available online: https://ssrn.com/abstract=1805046 (accessed on 5 May 2020).
- Panek, Jiri, and Lenka Sobotova. 2015. Community Mapping in Urban Informal Settlements: Examples from Nairobi, Kenya. Electronic Journal of Information Systems in Developing Countries 68: 1–13. [Google Scholar] [CrossRef]
- Pratomo, Jati, Monika Kuffer, Javier Martinez, and Divyani Kohli. 2017. Coupling Uncertainties with Accuracy Assessment in Object-Based Slum Detections, Case Study: Jakarta, Indonesia. Remote Sensing 9: 1–17. [Google Scholar] [CrossRef]
- Roy, Ananya. 2009. Why India Cannot Plan Its Cities: Informality, Insurgence and the Idiom of Urbanization. Planning Theory 8: 76–87. [Google Scholar] [CrossRef]
- Sliuzas, Richard, Gora Mboup, and Alex de Sherbinin. 2008. Report of the Expert Group Meeting on Slum Identification and Mapping. Available online: https://www.alnap.org/help-library/report-of-the-expert-group-meeting-on-slum-identification-and-mapping (accessed on 5 May 2020).
- Slum Dwellers International. 2016. Know Your City. Available online: http://knowyourcity.info/explore-our-data/ (accessed on 5 May 2020).
- Thomson, Dana R., Catherine Linard, Sabine Vanhuysse, Jessica E. Steele, Michal Shimoni, Jose Siri, Waleska Taixera Caiaffa, Megumi Rosenberg, Eléonore Wolff, Taïs Grippa, and et al. 2019. Extending Data for Urban Health Decision-Making: A Menu of New and Potential Neighborhood-Level Health Determinants Datasets in LMICs. Journal of Urban Health, 1–23. [Google Scholar] [CrossRef]
- Turley, Ruth, Ruhi Saith, Nandita Bhan, Eva Rehfuess, and Ben Carter. 2013. Slum Upgrading Strategies and Their Effects on Health and Socio-Economic Outcomes: A Systematic Review. Cochrane Collaboration Library. pp. 1–176. Available online: www.cochranelibrary.com/cdsr/doi/10.1002/14651858.CD010067.pub2/pdf/CDSR/CD010067/CD010067.pdf (accessed on 5 May 2020).
- UN-DESA. 2018. Sustainable Development Goals. Sustain Development Knowledge Platform. Available online: https://sustainabledevelopment.un.org/sdgs (accessed on 5 May 2020).
- UN-DESA. 2019. World Urbanization Prospects: The 2019 Revision. Available online: https://population.un.org/wup/DataQuery/ (accessed on 5 May 2020).
- UN-Habitat. 2003. The Challenge of Slums: Global Report on Human Settlements 2003. London: UN-Habitat. [Google Scholar] [CrossRef]
- UN-Habitat. 2007. Slums: Some Definitions; Nairobi: UN-Habitat. Available online: http://mirror.unhabitat.org/documents/media_centre/sowcr2006/SOWCR5.pdf (accessed on 5 May 2020).
- UN-Habitat. 2017. Distinguishing Slum from Non-Slum Areas to Identify Occupants’ Issues. Available online: https://unhabitat.org/distinguishing-slum-from-non-slum-areas-to-identify-occupants-issues/ (accessed on 5 May 2020).
- UN-Habitat, United Nations Statistics Division, and Cities Alliance. 2002. Expert Group Meeting on Urban Indicators: Secure Tenure, Slums and Global Sample of Cities. Nairobi: UN-Habitat. [Google Scholar]
- UTEP Consortium. 2019. Urban TEP. Available online: https://urban-tep.eu/#! (accessed on 5 May 2020).
- Verma, Deepank, Arnab Jana, and Krithi Ramamritham. 2019. Transfer Learning Approach to Map Urban Slums Using High and Medium Resolution Satellite Imagery. Habitat International 88: 101981. [Google Scholar] [CrossRef]
- Weeks, John R., Arthur Getis, Douglas A. Stow, Allan G. Hill, David Rain, Ryan Engstrom, Justin Stoler, Christopher Lippitt, Marta Jankowska, Anna Carla Lopez-Carr, and et al. 2012. Connecting the Dots Between Health, Poverty and Place in Accra, Ghana. Annals of the American Association of Geographers 102: 932–41. [Google Scholar] [CrossRef] [PubMed]
- WorldPop. 2020. WorldPop-Global UN-Adjusted 2000–2020. Available online: https://www.worldpop.org/geodata/listing?id=69 (accessed on 5 May 2020).
- Wurm, Michael, and Hannes Taubenböck. 2019. Detecting Social Groups from Space—Assessment of Remote Sensing-Based Mapped Morphological Slums Using Income Data. Remote Sensing Letters 9: 443–56. [Google Scholar] [CrossRef]


| Deprived Area | “Slum Household” |
|---|---|
| Reflects social, environmental, and ecological risk factors to health and wellbeing above and beyond household and individual characteristics | Reflects household poverty risk factors to individual health and wellbeing |
Indicators include:
| Indicators include:
|
| IDEAMAPS Requirements | Aggregated “Slum” Households | Field-Based Mapping | Human (Visual) Image Interpretation | Machine Image Classification |
|---|---|---|---|---|
| 1. Reflective of area physical characteristics | ✖ | ✔ | ✔ | ✔ |
| 2. Reflective of area social characteristics | ? | ✔ | ? | ? |
| 3. Context dependent | ✖ | ✔ | ? | ? |
| 4. Comparable across cities and countries | ✔ | ✖ | ✖ | ✔ |
| 5. Updated frequently with timely data | ✖ | ✖ | ✖ | ✔ |
| 6. Protective of individual privacy, and vulnerable populations | ✔ | ✔ | ? | ? |
| 7. Developed via an inclusive multi-stakeholder process | ✖ | ✖ | ✖ | ✖ |
| Population | Slum | Non-Slum |
|---|---|---|
| Total (%) | ||
| WorldPop 2018 | 1,394,977 (12.1) | 10,097,443 (87.9) |
| Facebook 2018 | 1,442,960 (13.4) | 9,324,747 (86.6) |
| GHS-POP 2015 | 1,236,851 (11.5) | 9,520,949 (88.5) |
| Area (sq. km.) | 25.8 | 281.1 |
| Density per sq. km. | ||
| WorldPop 2018 | 54,027 | 35,919 |
| Facebook 2018 | 55,885 | 33,170 |
| GHS-POP 2015 | 47,902 | 33,868 |
© 2020 by the authors. Licensee MDPI, Basel, Switzerland. This article is an open access article distributed under the terms and conditions of the Creative Commons Attribution (CC BY) license (http://creativecommons.org/licenses/by/4.0/).
Share and Cite
Thomson, D.R.; Kuffer, M.; Boo, G.; Hati, B.; Grippa, T.; Elsey, H.; Linard, C.; Mahabir, R.; Kyobutungi, C.; Maviti, J.; et al. Need for an Integrated Deprived Area “Slum” Mapping System (IDEAMAPS) in Low- and Middle-Income Countries (LMICs). Soc. Sci. 2020, 9, 80. https://doi.org/10.3390/socsci9050080
Thomson DR, Kuffer M, Boo G, Hati B, Grippa T, Elsey H, Linard C, Mahabir R, Kyobutungi C, Maviti J, et al. Need for an Integrated Deprived Area “Slum” Mapping System (IDEAMAPS) in Low- and Middle-Income Countries (LMICs). Social Sciences. 2020; 9(5):80. https://doi.org/10.3390/socsci9050080
Chicago/Turabian StyleThomson, Dana R., Monika Kuffer, Gianluca Boo, Beatrice Hati, Tais Grippa, Helen Elsey, Catherine Linard, Ron Mahabir, Catherine Kyobutungi, Joshua Maviti, and et al. 2020. "Need for an Integrated Deprived Area “Slum” Mapping System (IDEAMAPS) in Low- and Middle-Income Countries (LMICs)" Social Sciences 9, no. 5: 80. https://doi.org/10.3390/socsci9050080
APA StyleThomson, D. R., Kuffer, M., Boo, G., Hati, B., Grippa, T., Elsey, H., Linard, C., Mahabir, R., Kyobutungi, C., Maviti, J., Mwaniki, D., Ndugwa, R., Makau, J., Sliuzas, R., Cheruiyot, S., Nyambuga, K., Mboga, N., Kimani, N. W., de Albuquerque, J. P., & Kabaria, C. (2020). Need for an Integrated Deprived Area “Slum” Mapping System (IDEAMAPS) in Low- and Middle-Income Countries (LMICs). Social Sciences, 9(5), 80. https://doi.org/10.3390/socsci9050080