Community Planning Perspective and Its Role within the Social Policy of the Municipalities


Abstract
:1. Introduction
1.1. Community Planning
1.2. Current Research in Community Planning Policy
2. Results
2.1. Results A
2.2. Results B
3. Discussion
4. Materials and Methods
Author Contributions
Funding
Conflicts of Interest
References
- Anderson, E. James. 2010. Public Policy Making—An Introduction. Boston: Wadsworth. [Google Scholar]
- Andersson, Neil. 2011. Building the community voice into planning: 25 years of methods development in social audit. BMC Health Services Research 11: S1. [Google Scholar] [CrossRef] [PubMed]
- Angeles, C. Leonora, Olga Shcherbyna, and John Foster. 2014. Lessons from Comprehensive Social Plan Development. Plan Canada 54: 16–22. [Google Scholar]
- Brinkerhoff, Derick W., and Benjamin L. Crosby. 2002. Managing Policy Reform. Bloomfield: Kumarian Press. [Google Scholar]
- Garnett, Bernice R., Josefine Wendel, Chandra Banks, Ardeene Goodridge, Richard Harding, Robin Harris, Karen Hacker, and Virginia R. Chomitz. 2015. Challenges of Data Dissemination Efforts Within a Community—Based Participatory Project About Persistent Racial Disparities in Excess Weight. Progress in Community Health Partnerships 9: 289–98. [Google Scholar] [CrossRef] [PubMed]
- Khan, Anisur Rahman, and Shahriar Khandaker. 2016. A Critical Insight into Policy Implementation and Implementation Performance. Public Policy and Administration 15: 538–48. [Google Scholar]
- May, Peter. 1993. Mandate Design and Implementation: Enhancing Implementation Efforts and Shaping Regulatory Styles. Journal of Policy Analysis and Management 12: 634–63. [Google Scholar] [CrossRef]
- Mazmanian, Daniel A., and Paul A. Sabatier. 1989. Implementation and Public Policy. Lanham: University Press of America. [Google Scholar]
- Pearce, Laurie. 2003. Disaster Managment and Community Planning, and Public Participation: How to Achieve Sustabinable Hazard Mitigation. Natural Hazards 28: 211–28. [Google Scholar] [CrossRef]
- Pilát, Miroslav. 2015. Community Planning of Social Services in Current Theory and Practice. Praha: Portál, ISBN 978-80-262-0932-4. [Google Scholar]
- Sabatier, Paul A. 1988. An advocacy coalition framework of policy change and role of policy-oriented learning therein. Policy Science 21: 129–68. [Google Scholar] [CrossRef]
- Santilli, Alycia, Amy Carroll-Scot, and Jeanette R. Ickovics. 2016. Applying Communtiy Organizing Principles to Assess Health Needs in New Haven, Connecticut. American Journal of Public Health 106: 841–47. [Google Scholar] [CrossRef] [PubMed]
- Siemiatycki, Matti. 2007. What´s the Secret? Journal of the American Planning Association 73: 388–403. [Google Scholar] [CrossRef]
- Statistical Office of Slovak Republic. 2019. Demographic and Social Statistics. Available online: http://datacube.statistics.sk/TM1WebSK/ (accessed on 9 June 2019).
- Stewart, Joseph, David M. Hedge, and James P. Lester. 2008. Public Policy: An Evolutionary Approach. Boston: Thomson Wordsworth. [Google Scholar]
- Wates, Nick. 2014. The Community Planning Handbook, 2nd ed. London and New York: Taylor & Francis. [Google Scholar]
| 1 | Till 5 April 2019, there exist 140 self-government units with the statute of a city at the territory of the Slovak Republic (Statistical Office of Slovak Republic 2019). |


| Stakeholder | Actor |
|---|---|
| Self-government | Employees of the city office, deputies (members of political parties, independent deputies), members of the relevant commissions (deputies, experts, the public) |
| Social services provider | Public service provider, non-public social service provider (individuals representing a particular facility, individuals, group representing social service providers) |
| Social services recipient | Social service clients (individual, group representing a particular facility, individual, group representing a group of client equipment) |
| Experts | Methodology of community planning, statistical analysts, expert guarantor |
| Institutions, organizations | Public and private educational institutions, public and private health institutions, non-governmental organizations, civic associations, interest organizations, non-profit organizations from the social sphere, police, schools |
| Public | Individual, a group representing target population groups, population—inhabitants of the city |
| Administrative Model | Participatory Model |
|---|---|
| Hierarchical | Equality of actors |
| Directive | Consensual |
| Unilateral decision-making | Joint decision-making |
| Formalization of certain activities | Real performance of all activities |
| Non-transparent and incomprehensible | Transparent and comprehensible |
| Underestimating of local resources | Maximum utilization of local resources |
| Preference for expert organizations | Real participation of users and the public |
| Limitation or exclusion of users | Effort to involve marginalized groups |
| Authors | Design of Study | Type of Community Planning/Area | Actors | Outcomes/Methods |
|---|---|---|---|---|
| Andersson (2011) | Article/Research/Methods | Single sectoral/health | Planners at policy level/providers/users in household | Reducing of too much evidence, decisions depend on political interests and political cycles, social audit reduces arbitrariness of planning decisions, social audit training supported by a customized Masters programme |
| Wates (2014) | Handbook/ Manual | Cross-sectoral/ Multi-area | Local governments/local people/ organisations | Additional resources, improve decision-making process, improve access to funding, local people empowerment, strength cooperation, improve education, better insights into communities, improvement of environment shaping |
| Santilli et al. (2016) | Article/Research | Single sectoral/Health | Non-profit organisations/local community/ Research Institution/Aiming groups of peoples | Improvement of community approach method, improvement of the recruitment of participants, enhanced cooperation between stakeholders, increased quality of outputs and recommendations, new visions and projects |
| Garnett et al. (2015) | Article/Research/Methods | Single sectoral/Health | Community coalition/ Non-profit organisations/ Aiming group of people | Increased community engagement, local community empowerment, better understandings of problems, developing of new approaches and strategies |
| Angeles et al. (2014) | Article/ Comaparative analysis/Case Studies | Single sectoral/Social Services | Local government/ municipalities/ local community/ organisations/ providers | Broad comparative perspective, revealing of common features about plan development, implementation, monitoring, reporting and evaluating |
| Pearce (2003) | Article/Case Study | Cross-sectoral/ Multi-area | Local government representatives/ council/property owners/local community | Sustainable hazard mitigation when public is integrated and participate, better problems understanding |
| Siemiatycki (2007) | Article/Case Study | Single sectoral/Rail Infrastructure | Public-private partnership, local community | Improvement of transparent partnership, improvement of better understanding |
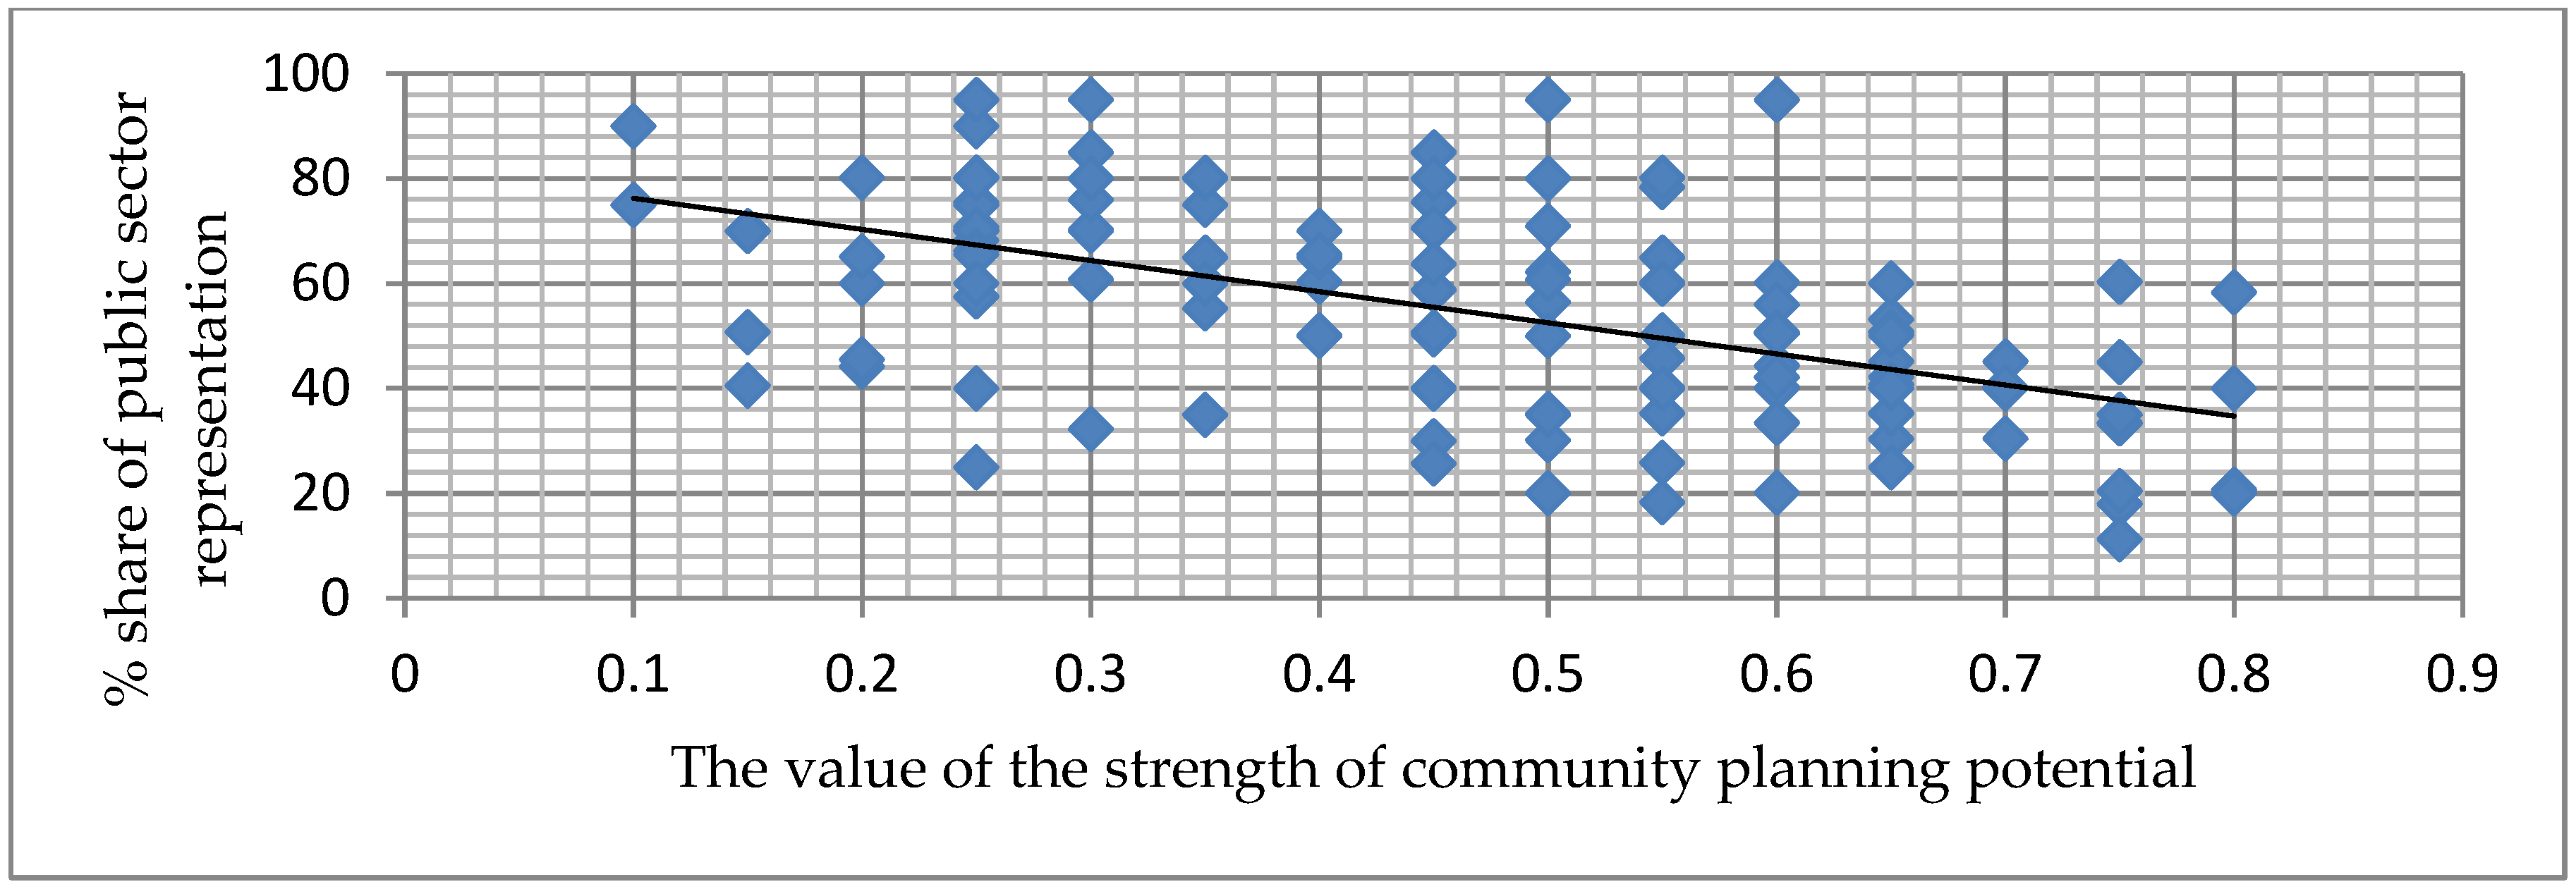
| SUMMARY OUTPUT | |||||
|---|---|---|---|---|---|
| Regression Statistics | |||||
| Multiple R | 0.544953 | ||||
| Observations | 140 | ||||
| ANOVA | |||||
| df | SS | MS | F | Significance F | |
| Regression | 1 | 1.344847 | 1.344847 | 58.29435 | 3.38 × 10⁻¹² |
| Total | 139 | 4.5285 | |||
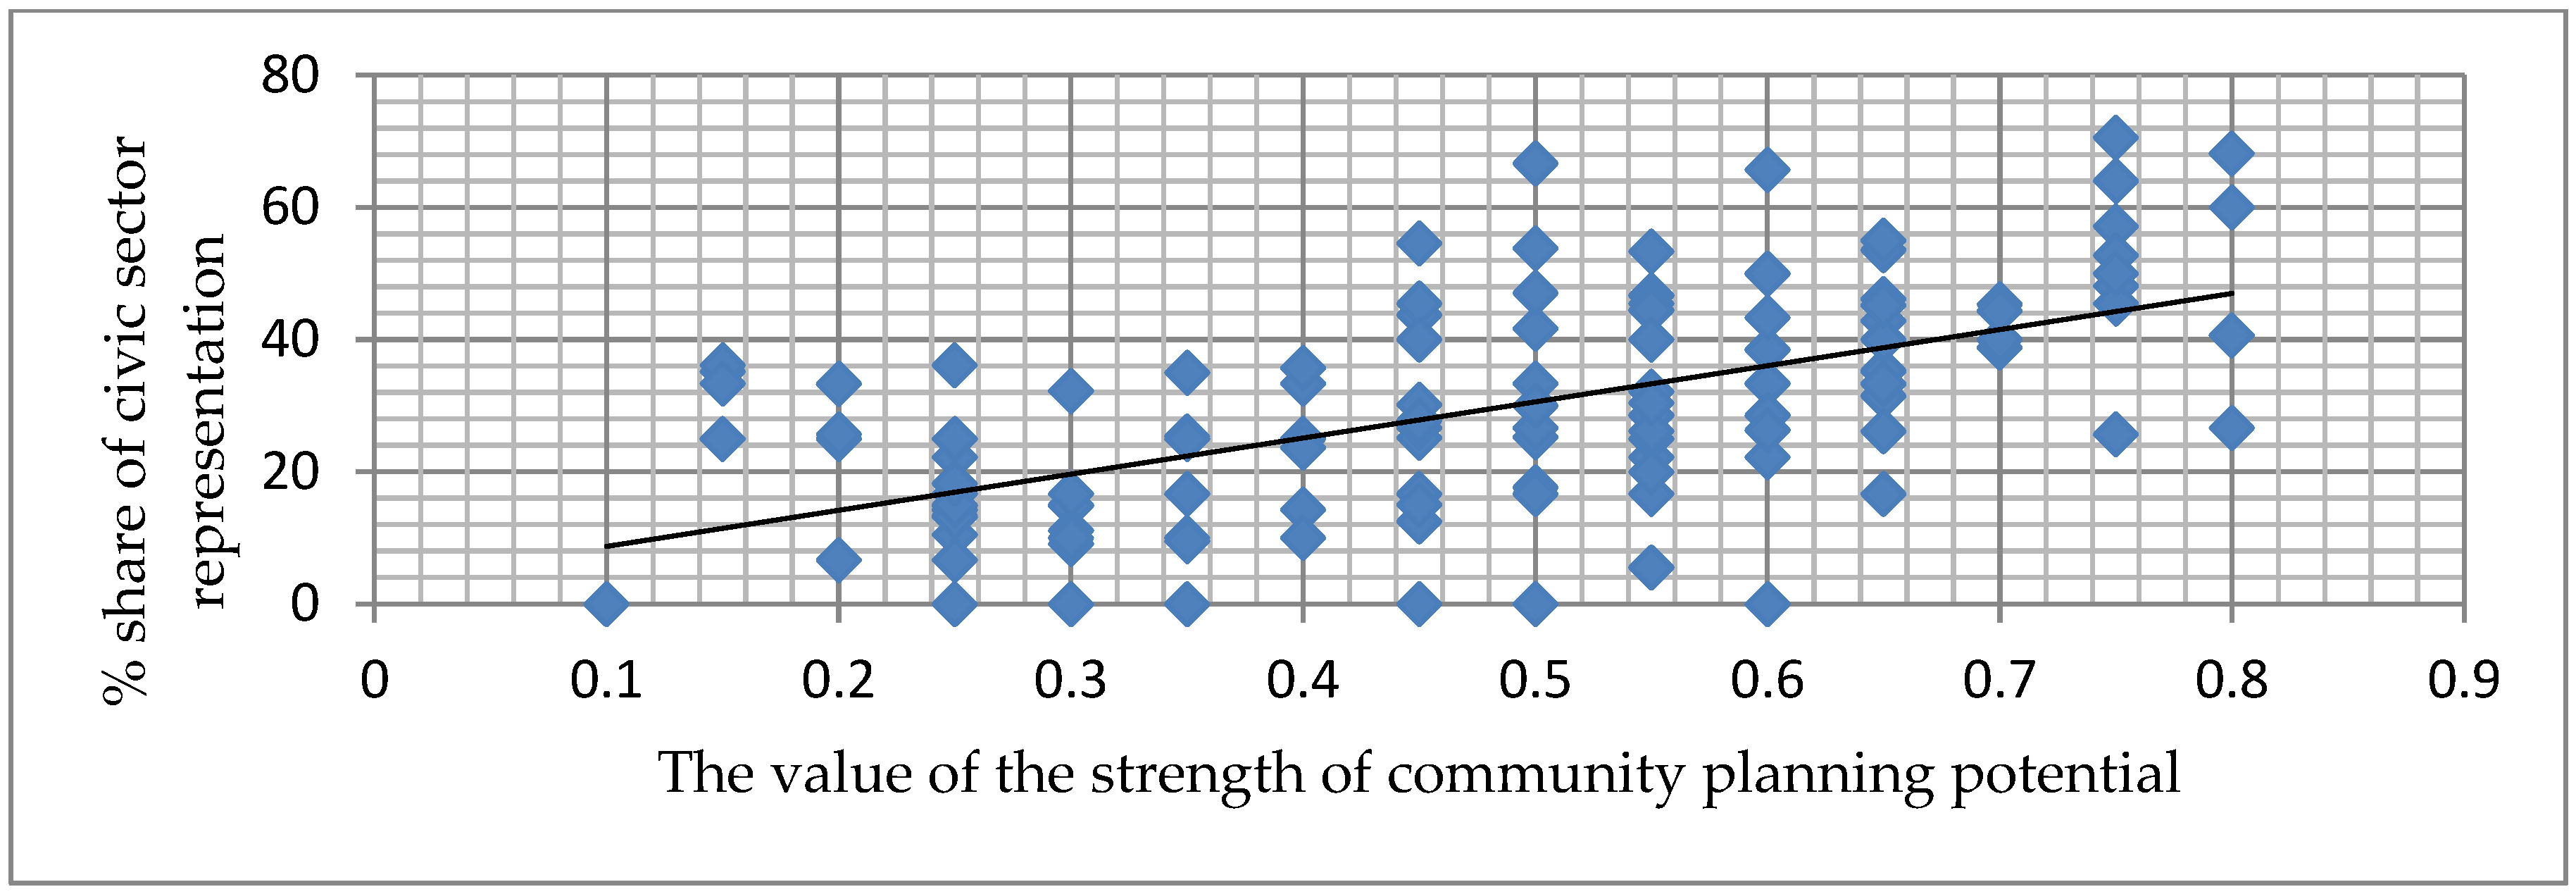
| SUMMARY OUTPUT | |||||
|---|---|---|---|---|---|
| Regression Statistics | |||||
| Multiple R | 0.59344 | ||||
| Observations | 140 | ||||
| ANOVA | |||||
| df | SS | MS | F | Significance F | |
| Regression | 1 | 1.594806 | 1.594806 | 75.01916 | 1.1 × 10⁻¹⁴ |
| Total | 139 | 4.5285 | |||
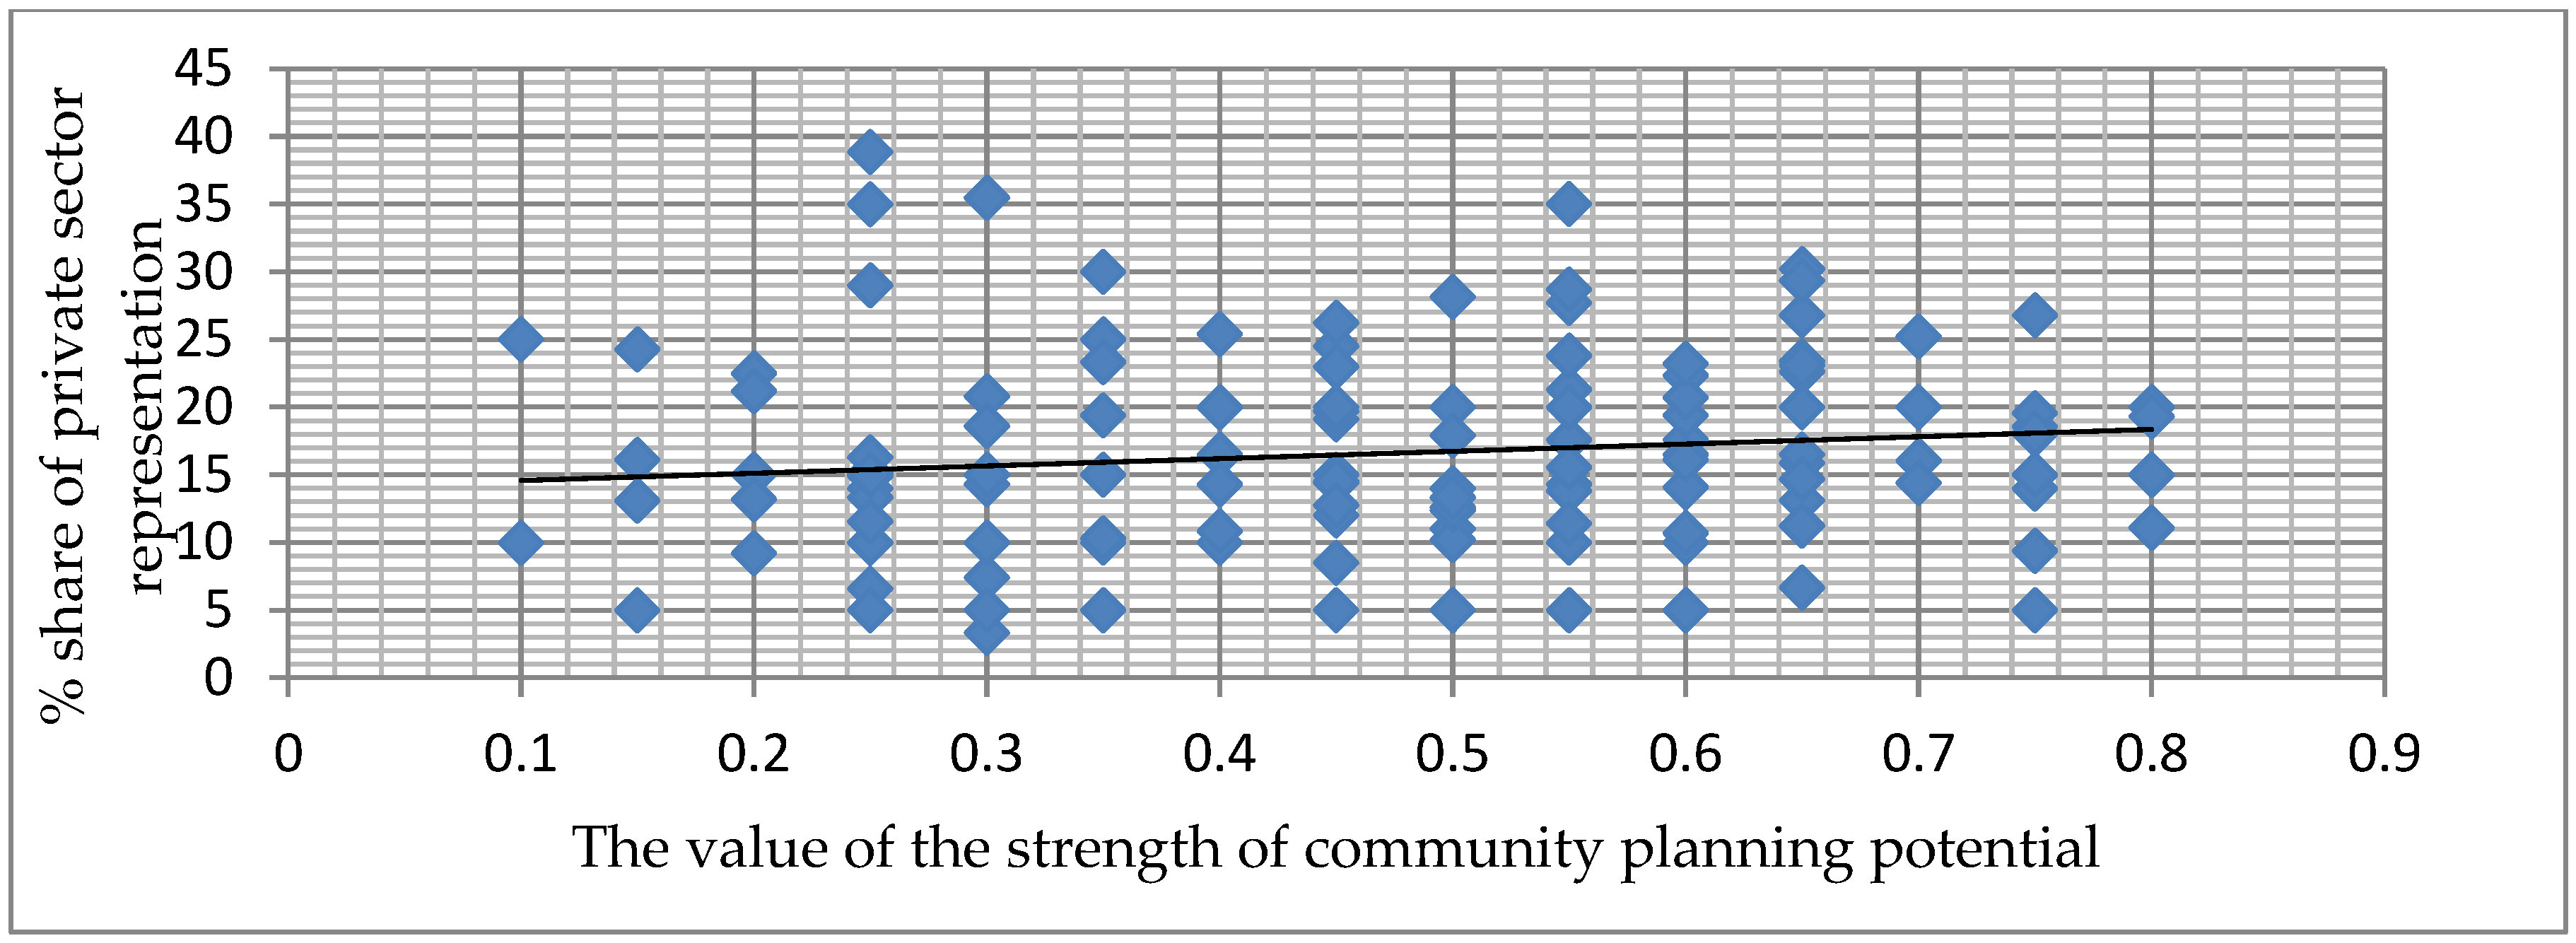
| SUMMARY OUTPUT | |||||
|---|---|---|---|---|---|
| Regression Statistics | |||||
| Multiple R | 0.13497 | ||||
| Observations | 140 | ||||
| ANOVA | |||||
| df | SS | MS | F | Significance F | |
| Regression | 1 | 0.082495 | 0.082495 | 2.560569 | 0.111846 |
| Total | 139 | 4.5285 | |||
| Experiences with Community Planning | Community Planning Potential | Total | |||
|---|---|---|---|---|---|
| 0–0.1: Very Low | 0.11–0.33: Low | 0.34–0.66: Middle | 0.67–1: High | ||
| 0–5 years | 1 | 25.00 | 42 | 6 | 74 |
| 1.35% | 33.78% | 56.76% | 8.11% | 100.00% | |
| 33.33% | 67.57% | 50.60% | 35.29% | 52.86% | |
| 6–9 years | 1 | 11 | 31 | 5 | 48 |
| 2.08% | 22.92% | 64.58% | 10.42% | 100.00% | |
| 33.33% | 29.73% | 37.35% | 29.41% | 34.29% | |
| 10 and more years | 1 | 1 | 10 | 6 | 18 |
| 5.56% | 5.56% | 55.56% | 33.33% | 100.00% | |
| 33.33% | 2.70% | 12.05% | 35.29% | 12.86% | |
| 0.71% | 0.71% | 7.14% | 4.29% | 12.86% | |
| Total | 3 | 37 | 83 | 17 | 140 |
| 2.14% | 26.43% | 59.29% | 12.14% | 100.00% | |
| 100.00% | 100.00% | 100.00% | 100.00% | 100.00% | |
| 2.14% | 26.43% | 59.29% | 12.14% | 100.00% | |
| R | R Square | Adjusted R Square | Std. Error of the Estimate | ||
| 0.21 | 0.04 | 0.04 | 0.65 | ||
| Sum of Squares | df | Mean Square | F | Sig. | |
| Regression | 2.66 | 1 | 2.66 | 6.27 | 0.013 |
| Residual | 58.51 | 138 | 0.42 | ||
| Total | 61.17 | 139 | |||
| Experiences as Manager | Community Planning Potential | Total | |||
|---|---|---|---|---|---|
| 0–0.1: Very Low | 0.11–0.33: Low | 0.34–0.66: Middle | 0.67–1: High | ||
| 0–9 years | 2 | 17 | 43.00 | 6 | 68 |
| 2.94% | 25.00% | 63.24% | 8.82% | 100.00% | |
| 66.67% | 45.95% | 51.81% | 35.29% | 48.57% | |
| 10–19 years | 1 | 17 | 26 | 6 | 50 |
| 2.00% | 34.00% | 52.00% | 12.00% | 100.00% | |
| 33.33% | 45.95% | 31.33% | 35.29% | 35.71% | |
| 20 and more years | 0 | 3 | 14 | 5 | 22 |
| 0.00% | 13.64% | 63.64% | 22.73% | 100.00% | |
| 0.00% | 8.11% | 16.87% | 29.41% | 15.71% | |
| Total | 3 | 37 | 83 | 17 | 140 |
| 2.14% | 26.43% | 59.29% | 12.14% | 100.00% | |
| 100.00% | 100.00% | 100.00% | 100.00% | 100.00% | |
| R | R Square | Adjusted R Square | Std. Error of the Estimate | ||
| 0.12 | 0.02 | 0.01 | 0.66 | ||
| Sum of Squares | df | Mean Square | F | Sig. | |
| Regression | 0.96 | 1 | 0.96 | 2.19 | 0.14 |
| Residual | 60.22 | 138 | 0.44 | ||
| Total | 61.17 | 139 | |||
| Experiences in Public Administration | KPSS Potential | Total | |||
|---|---|---|---|---|---|
| 0–0.1: Very Low | 0.11–0.33: Low | 0.34–0.66: Middle | 0.67–1: High | ||
| 0–9 years | 1 | 10 | 25 | 4 | 40 |
| 2.50% | 25.00% | 62.50% | 10.00% | 100.00% | |
| 33.33% | 27.03% | 30.12% | 23.53% | 28.57% | |
| 10–19 years | 1 | 20 | 25 | 7 | 53 |
| 1.89% | 37.74% | 47.17% | 13.21% | 100.00% | |
| 33.33% | 54.05% | 30.12% | 41.18% | 37.86% | |
| 20–29 years | 1 | 5 | 30 | 2 | 38 |
| 2.63% | 13.16% | 78.95% | 5.26% | 100.00% | |
| 33.33% | 13.51% | 36.14% | 11.76% | 27.14% | |
| 30 or more years | 0.00% | 2 | 3 | 4 | 9 |
| 0.00% | 22.20% | 33.30% | 44.40% | 100.00% | |
| 5.41% | 3.61% | 23.53% | 6.43% | ||
| Total | 3 | 37 | 83 | 17 | 140 |
| 2.14% | 26.43% | 59.29% | 12.14% | 100.00% | |
| 100.00% | 100.00% | 100.00% | 100.00% | 100.00% | |
| R | R Square | Adjusted R Square | Std. Error of the Estimate | ||
| 0.12 | 0.01 | 0.01 | 0.66 | ||
| Sum of Squares | Df | Mean Square | F | Sig. | |
| Regression | 0.89 | 1 | 0.89 | 2.03 | 0.15 |
| Residual | 60.29 | 138 | 0.44 | ||
| Total | 61.17 | 139 | |||
| Participant | Measurement | Outcomes | Study Design |
|---|---|---|---|
| actors sectors public private civic community | planning participation impact effect influence forcing | Engaging Practice involving decision-making process developing social services plan model of participation | Comparative Methodological Case studies Research |
© 2019 by the authors. Licensee MDPI, Basel, Switzerland. This article is an open access article distributed under the terms and conditions of the Creative Commons Attribution (CC BY) license (http://creativecommons.org/licenses/by/4.0/).
Share and Cite
Butoracova Sindleryova, I.; Garaj, M.; Dancisinova, L. Community Planning Perspective and Its Role within the Social Policy of the Municipalities. Soc. Sci. 2019, 8, 183. https://doi.org/10.3390/socsci8060183
Butoracova Sindleryova I, Garaj M, Dancisinova L. Community Planning Perspective and Its Role within the Social Policy of the Municipalities. Social Sciences. 2019; 8(6):183. https://doi.org/10.3390/socsci8060183
Chicago/Turabian StyleButoracova Sindleryova, Ivana, Michal Garaj, and Lucia Dancisinova. 2019. "Community Planning Perspective and Its Role within the Social Policy of the Municipalities" Social Sciences 8, no. 6: 183. https://doi.org/10.3390/socsci8060183
APA StyleButoracova Sindleryova, I., Garaj, M., & Dancisinova, L. (2019). Community Planning Perspective and Its Role within the Social Policy of the Municipalities. Social Sciences, 8(6), 183. https://doi.org/10.3390/socsci8060183