1. Introduction
In the labor market, the pairing process is key. There is an increasing discrepancy between the qualifications of the labor force and the qualification requirements of vacant jobs. In economic theory, this situation is called ‘structural unemployment’. Structural unemployment arises when the supply of jobs for a certain type of profession or demanding a certain educational level does not correspond to the demand for this type of profession or the supply of workers with this educational level. The level of education of a potential or current worker or the field in which they graduate does not correspond to the qualification requirements of the position (
Howell 2005;
Karpíšek 1999;
Samuelson and Nordhaus 2008). This discrepancy in the labor market arises primarily as a result of structural changes in the economy, where some sectors are expanding, and others are disappearing or declining. However, it is also created as early as during the actual process of education, where the fields of study generate an insufficient number of qualified people for the given profession or industry (
Trhlíková et al. 2006;
Brown et al. 2003;
Redor 1999). Plesník et al. notes that continuously educating the workforce and increasing its spatial mobility are key to reducing structural unemployment (
Plesník 2007;
Holman 2001). However, this recommendation is suitable for fields with less demanding qualification requirements and no high specialization. Continuous education is based on the idea of so-called lifelong learning, i.e., the systematic development of individuals in all stages of their life. Experts distinguish three types of education, namely: formal, non-formal, and informal. Formal education is represented by the school education system, which is structured into primary, secondary (with or without graduation) and tertiary (higher education in a bachelor’s, master’s or doctoral degree) levels of education of an individual. Non-formal education is represented by the process of vocational education. Informal education is a form of self-education in which an individual acquires knowledge and skills through self-study (
Bočková 2000;
Severová 2011;
Bills 2004;
Bureš 2007). The economists from the Chicago School and their representative G.S.
Becker (
1964) do not portray education as a form of consumption, but rather consider the cost of education as a form of investment. The individual thus expects a certain return on their investment and anticipates future benefits (e.g., in the form of higher wages). Qualifications, or professional qualifications, are used to indicate a particular person’s ability to practice a given profession. They indicate that a person possesses a certain level of professional training, education and knowledge in a particular field or profession (
Schultz 1971). Qualifications consist of professional and general competencies. The qualification requirements of the Health and Social Care sector are high, and the individual professions are subject to requirements for increasing the level of formal education. The professional concentration of a sector shows to what degree a given sector is professionally homogeneous or heterogeneous, whereby the concentration is high if one or very few professions in the given sector have a dominant position in relation to the other professions. The average length of the period of education is an indicator that evaluates the individual levels of study by their difficulty expressed in terms of time; the time is the number of years spent studying at a given level of education (
Mazouch and Fisher 2011). Economic theory views the elimination of disparities within regions differently, depending on the schools of economics. Liberals have favored an endogenous approach to regional development, whereby, in their opinion, it is not necessary to interfere in market processes. Under this conception, regional policy is governed by instruments that increase the mobility of labor forces and applies the approach of “the workers go where the work is” (
Malinovský and Sucháček 2006;
Maier and Tödtling 1998). As opposed to that, Keynesians have favored an exogenous approach to regional development and have emphasized the need for government interventions in the market mechanism, primarily in order to support market processes; which should be thereby regulated in such a way so that increases do not occur in disparities within the regions. The main instruments are thus steps to support the inflow of investments into problematic regions, i.e., the idea of “the work goes where the people are” (
Myrdal 1957;
Hirschman 1958). Marxists asserted the need for the planning and steering of spatial development, i.e., the utilization of a centrally planned economy, and ignoring market processes (
Hampl 2001). The currently preferred modern transformed endogenous paradigm then places an emphasis primarily on the internal potential of individual regions, as well as the subjects found within them, and tends to pay rather less attention to divergent spatial development processes (
Lundvall 1992;
Florida 1995;
Saxenian 1994;
Piore and Sabel 1984). Regional disparities are to serve as a certain signal of the quality of the environment and the subjects within the individual areas of the country. According to the modern transformed endogenous approach to regional development, the key thing is primarily support for an environment in which small and midsize businesses, innovations, education and the development of human capital will thrive; as well as increasing the quality of local and regional institutions, maintaining competitiveness, and, at the same time, cooperation among entities (
Blažek and Uhlíř 2002).
The Health and Social Care sector fits the theory of unbalanced growth. As a sector that is slower in productivity growth, it will tend to absorb more of the labor force. Given that public sector institutions generally provide services for which workforce productivity stagnates in time, there are reasonable concerns about their future development and existence. In this context, one of the most significant contributions of expert discussions is the concept of the model of unbalanced growth, which was put forward by the American professor of economics, William J. Baumol, in the 1960s. Baumol and Bowen’s book,
Baumol and Bowen 1966, is an analysis that follows the effect of delays in productivity. It is based on assuming the possibility of dividing the economy according to long-term changes in productivity. Activities manifesting long-term constant productivity tend to increase the income deficit, while the empirical data from various periods show that the income deficit grows faster than the general price level. The macroeconomic model of unbalanced growth assumes the division of every economy into two basic sectors, with the main criterion for the division being the technical infrastructure of production. Technologically-progressive sectors include economic activities that are characterized by long-term productivity growth. The reasons for this growth are mostly innovations (mainly technological), improvements in work skills, an increase in management efficiency, economies of scale, etc., while human labor is seen as a tool for achieving output. A sector that is not technologically progressive includes economic activities that are characterized by stagnating productivity, while human labor is usually the final output, or rather its integral part. In their article “Unbalanced Growth Revisited: Asymptotic Stagnancy and New Evidence”, William J. Baumol together with Sue Anne Battey Blackman and Edward N. Wolf (
Baumol et al. 1985) revised their original model. In terms of terminology, the activities with sporadic productivity growth or even with zero productivity growth are newly referred to as a stagnating sector. In addition to the stagnant and progressive sectors, there is the new concept of an asymptotically stagnant sector, which is characterized by its variability over time. As in the private service sector, the public service sector is characterized by stagnating labor productivity. This fact is supported by the claim that the same amount of workforce is always producing the same real value. A slight increase can then be explained, for example, by an absolute increase in the population of the given economy, as it can be assumed that production in the public service sector reflects the constant needs of consumers in the given economy. In the Health and Social Care sector, and in connection with the demand for workforce in this sector, demographic development and the aging of the population of the given country play a significant role, increasing the demand for services (labor and resources) in the area of healthcare. Another possible determinant is the growth of wages and salaries in the given country, and thus economic growth, when consumers increase their demand for services. Demographic development, the number of newborns, the number of students in the given field, the level of remuneration in the given profession, and the rigidity of the labor market primarily influence the labor supply in healthcare. Among other things, Baumol assumes that due to the effort to maintain the given production, there will be a significant spillover of labor capacity in favor of non-progressive activities while, at the same time, there will be considerable pressure in the form of a slowdown of total economic growth. Theoretically, the increase in labor capacity in the public service sector can be explained by population growth in the given country as well as by the increase in the gross domestic product, including real tax revenues, which can in return provide more services over time. As labor productivity in the public service sector has been constant over the long term, it is clear that production growth brings with it an increase in labor capacity.
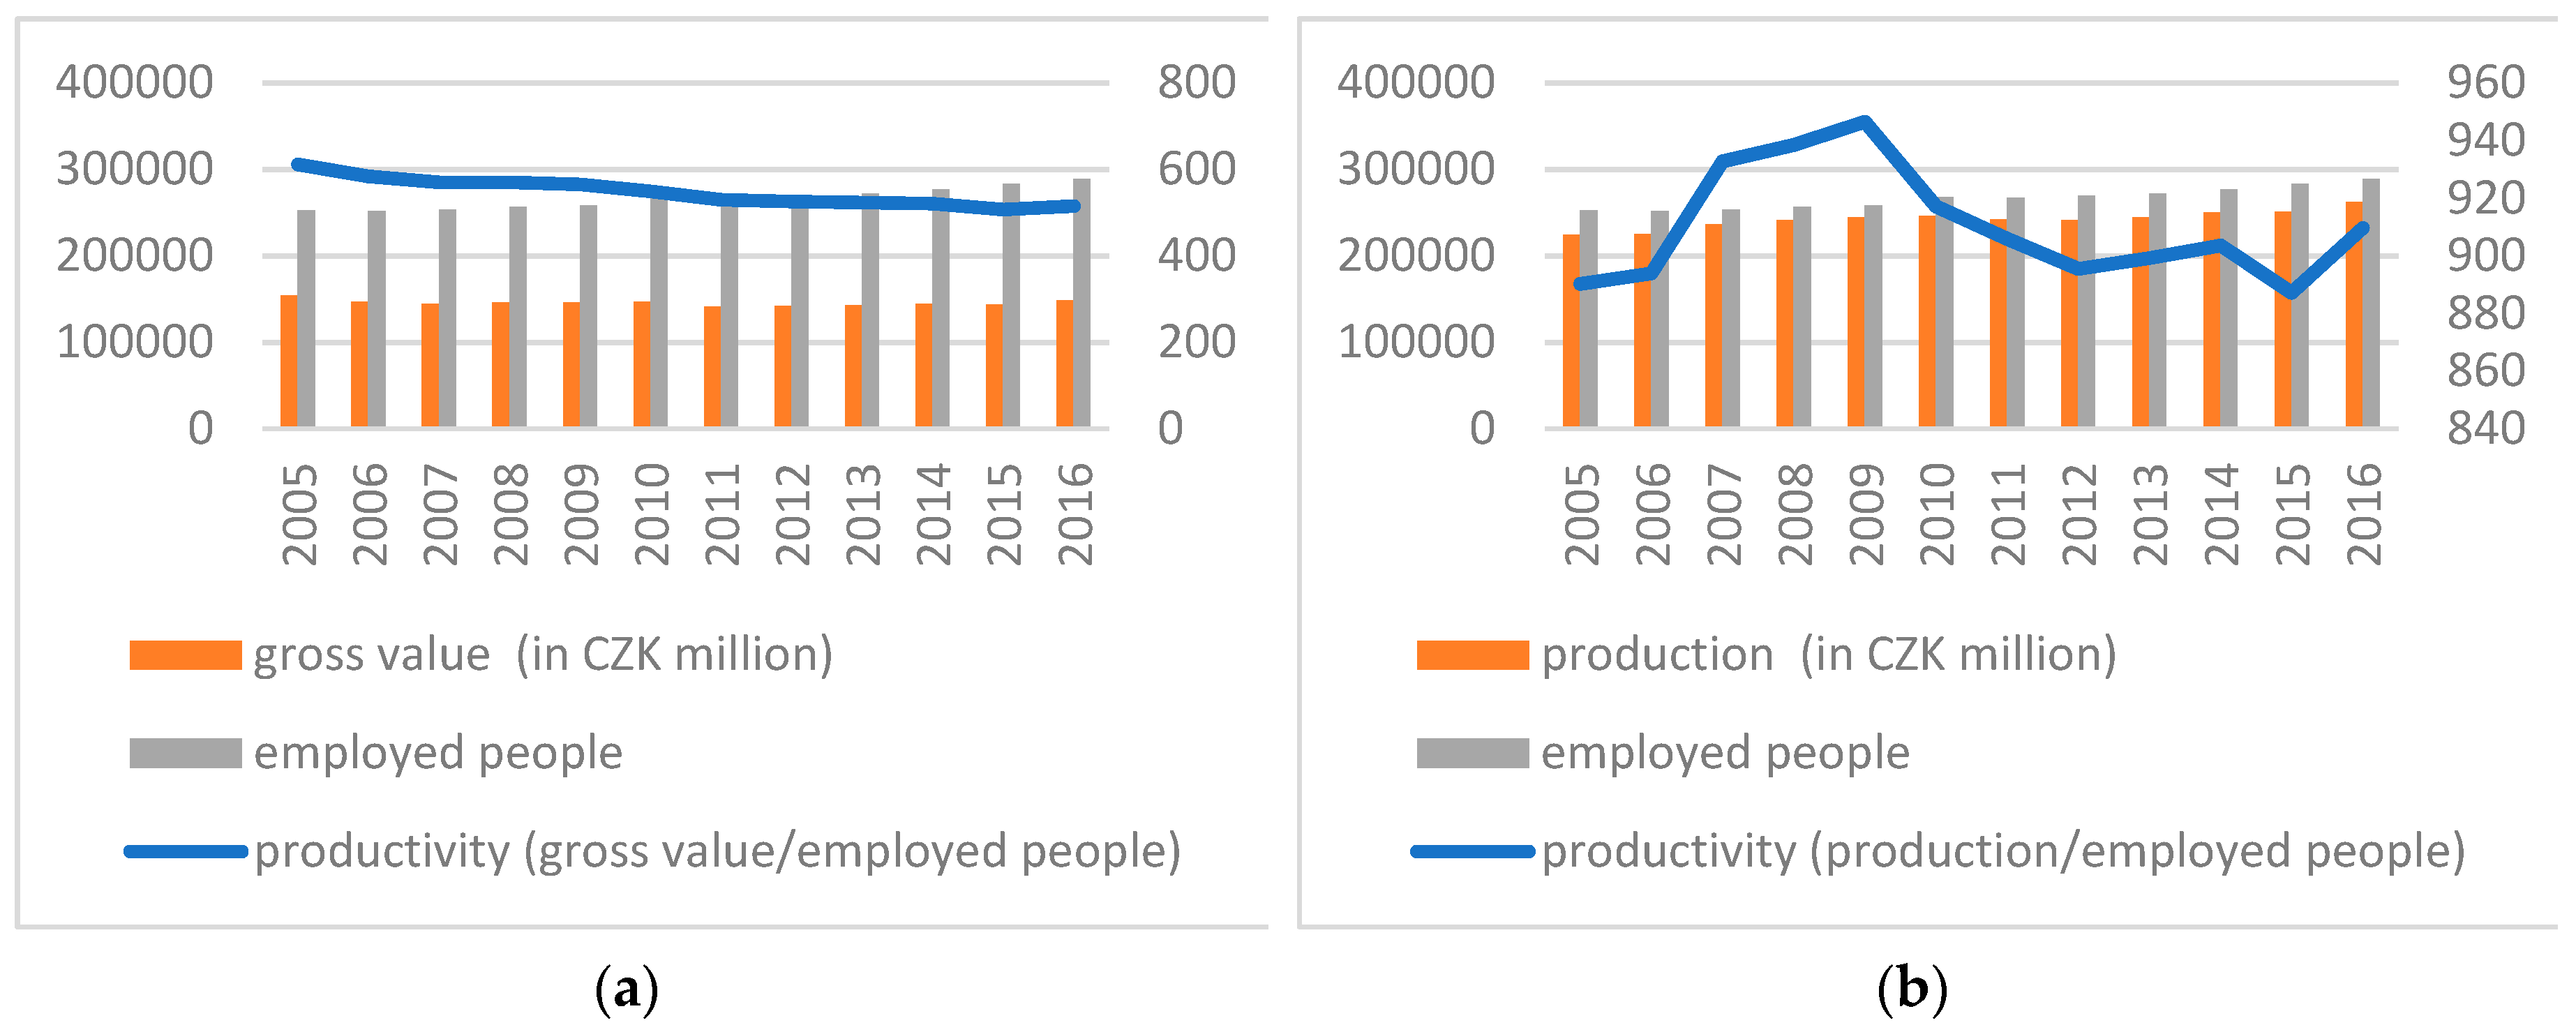
In
Figure 1a, the left axis represents the development of gross value added at constant prices (reference year 2010, in CZK millions) and the number of employed people, while the right axis shows the productivity curve, i.e., the ratio of the quantities from the left axis. The left axis in
Figure 1b shows the development of production at constant prices (reference year 2010, in CZK millions) and the number of people employed, while the right axis shows the productivity curve, i.e., the ratio of quantities from the left axis (
Český statistický úřad 2018c,
2018e [online]). In the Czech Republic, the Health and Social Care sector shows decreasing productivity based on the calculation of gross value added per employee, and stagnating productivity based on the calculation of output per employee.
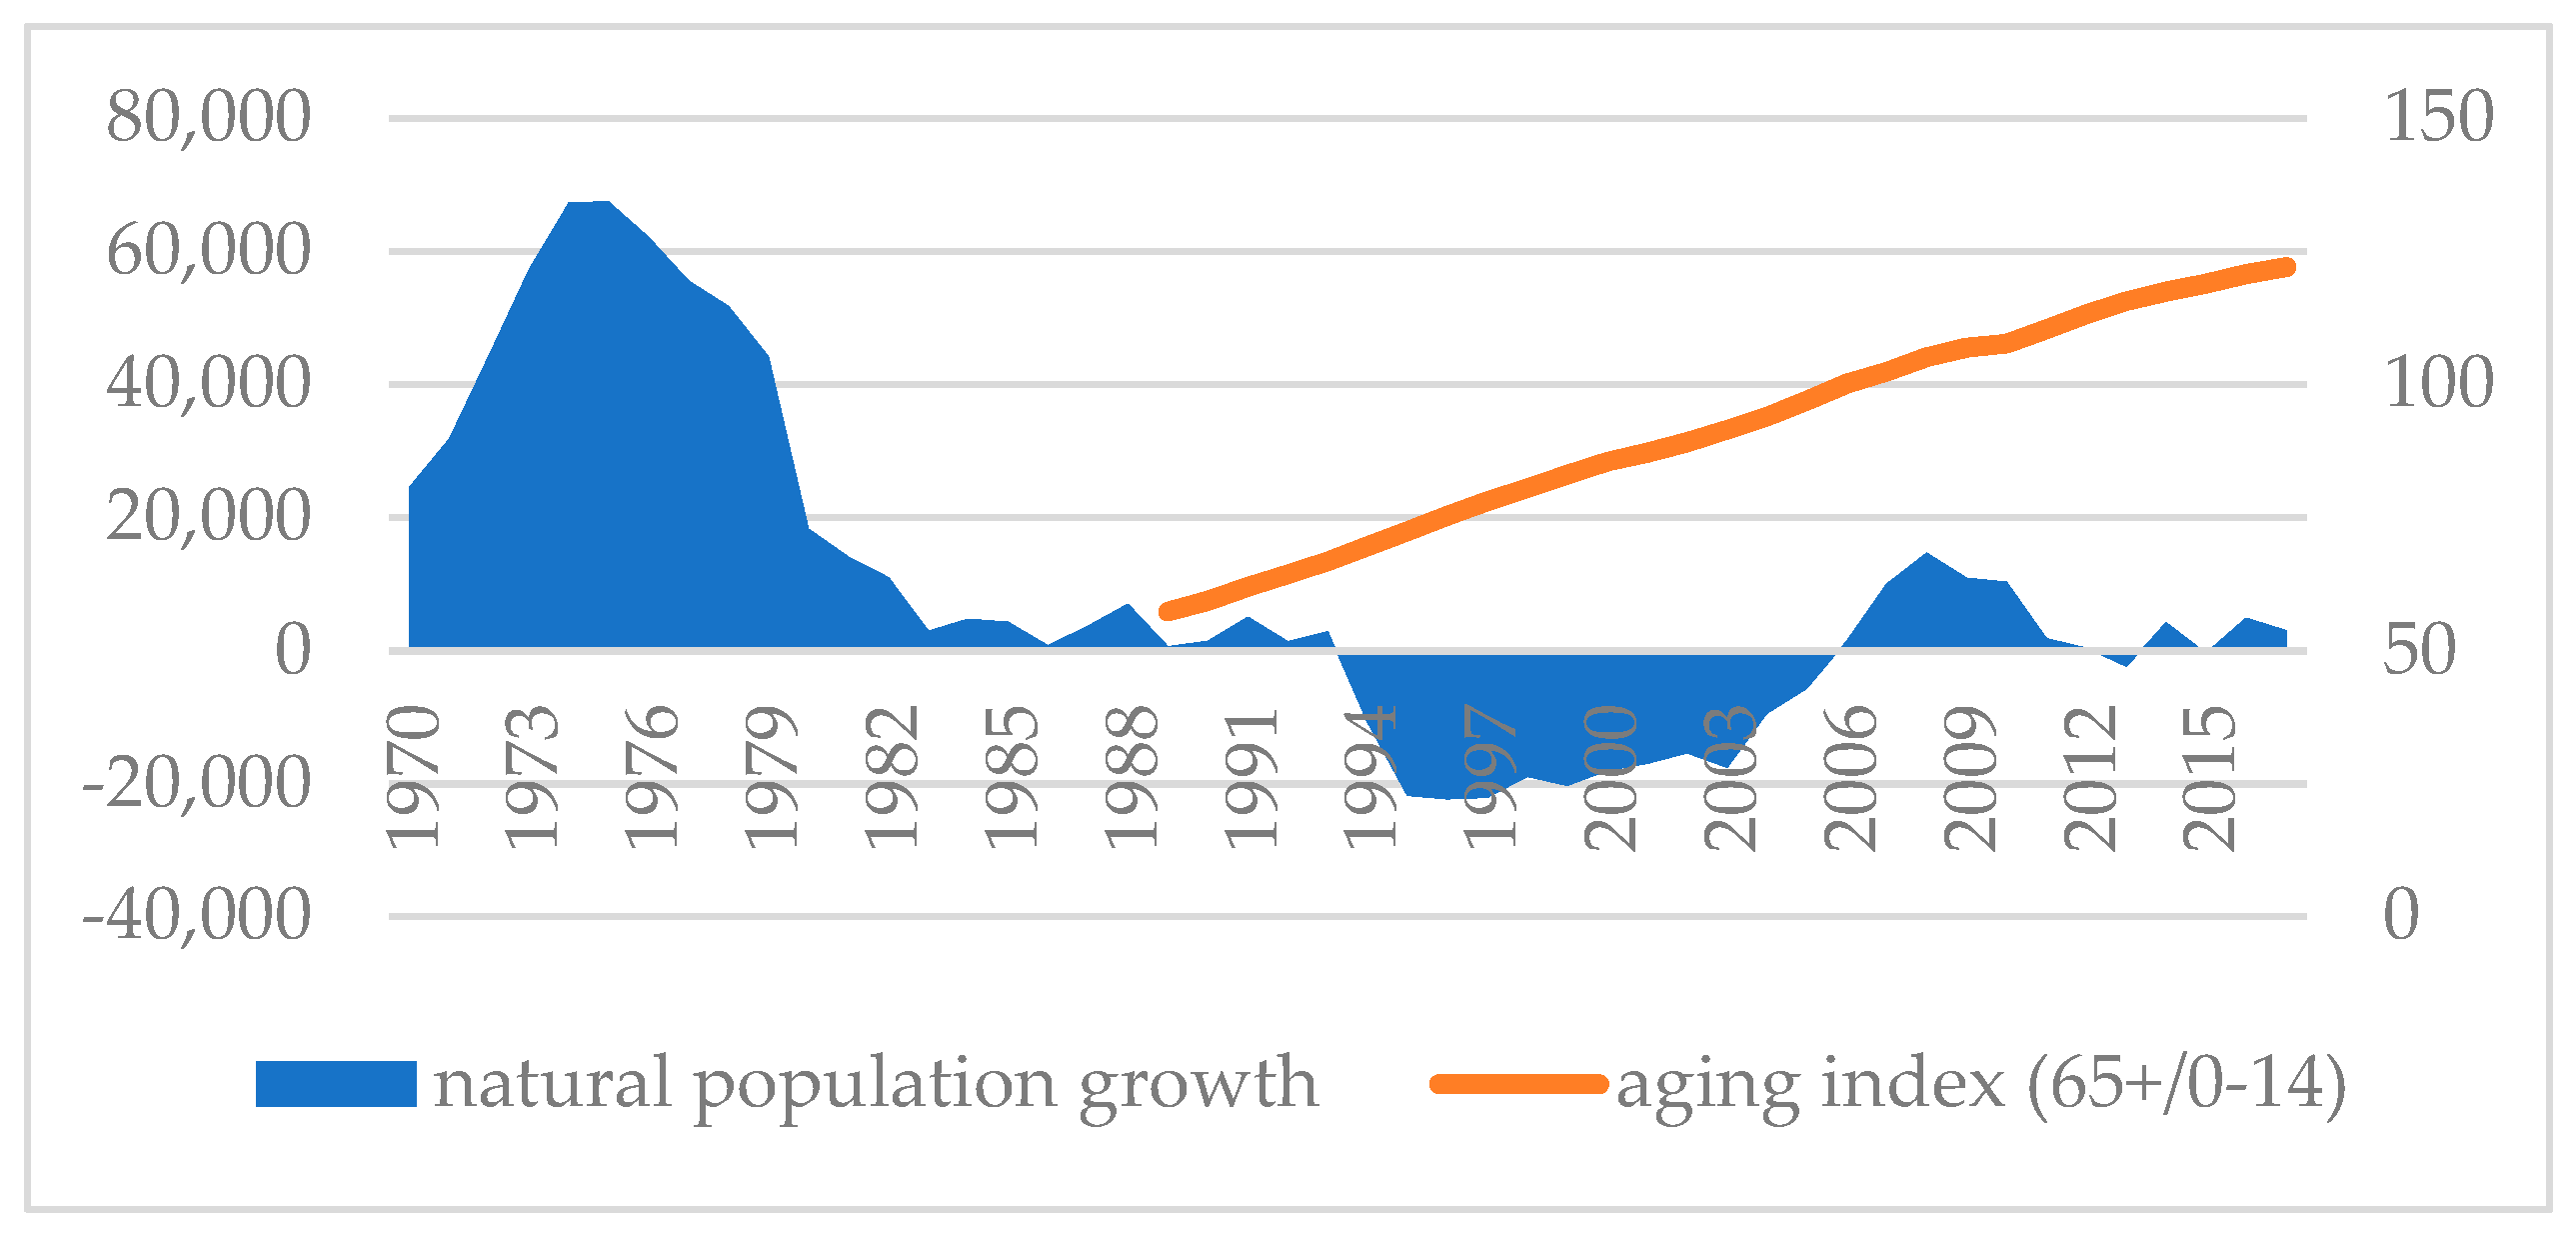
Demographic projections for the Czech Republic assume that in future years there will be a gradual increase in the number of people aged 65 and over. At the same time, the share of people in retirement in the total population is expected to exceed one fifth by 2020. Together with the ever-growing median age, this will place further demands for the increase of employment in health and social care. The total increase between 2008 and 2020 is anticipated to be very high—from 328,000 people in 2008 to 386,000 in 2020 (an increase of 18%). In the following years, the number of people employed in private health organizations will increase. Currently, the Czech Republic comes near to last in Europe in terms of this indicator. Among the most demanded professions will be primarily nurses, general practitioners and clinical doctors, dental experts, physiotherapists and psychology experts. In the short term, for example, a growing demand for staff in the areas of gynecology and obstetrics is anticipated. However, with the anticipated decline in the birth rate, this trend will soon be reversed in the coming years. The lack of other hospital support staff will remain a great problem in healthcare. Foreign workers will often be the only option for employers. In
Figure 2 (
Český statistický úřad 2018a [online]), the secondary data from the Czech Statistical Office illustrate a negative demographic development and a natural decrease in the population of the Czech Republic between 1993 and 2005, while from 1983 on there were very low annual increases in the Czech Republic’s population. The right axis depicts trends in the ageing index (the ratio of people over 65 to those aged 0–14, in %), which points to a significant rate of population aging. From 1989 to 2016, the aging index increased by 113%. This is caused by higher life expectancy and also by the declining birth rate.
The systematic use of prognostic models has its place in the area of the future needs of the labor market. The European Union in particular, emphasizes the importance of forecasting the needs of the labor market as a tool for maintaining balance on the labor market and preventing structural unemployment. Predicting the necessary labor force is common practice and a necessary element of maintaining balance on the market in Germany, the Netherlands, Great Britain, the United States of America and France. In the Czech Republic, medium-term prognoses have a brief tradition and the model is currently at the development stage. The prognosis of labor market requirements for certain qualifications is conducted by the National Observatory of Employment and Training, with financial help from the Ministry of Labor and Social Affairs and the European Social Fund. In creating the model, the National Observatory of Employment and Training cooperates with the Research Institute for Labor and Social Affairs and the Centre for Economic Research and Graduate Education (CERGE-EI). For their prognosis, they used a model called ROA-CERGE. The model was taken from the Netherlands and modified for the environment of the Czech economy. Currently, selected economic sectors are analyzed in the Czech Republic (sector studies). Namely, studies have been conducted for the energy, electro-technical and ICT services sectors for the 2012–2020 period. The model further analyses the future development of economic sectors, anticipated future demand in the professional and educational structure and the anticipated future labor supply for individual professions and at certain levels of education. The supply side of the labor market is represented by a demographic model, or demographic projection, and it is mainly an estimate of the number of graduates in the professional, sector and qualification groups. The demand side consists of the number of vacancies for a certain level of education and particular professions. These vacancies are differentiated as newly created jobs that did not previously exist, and vacancies that are made available again due to existing staff entering their post-productive age. With regard to this differentiation, expanded demand (newly created jobs) and replacement demand (newly vacated jobs) are defined. Furthermore, the ROA-CERGE model works with “substitution demand”, which represents demand for labor with a certain level of education for jobs that are characterized by this particular level of education. The quality-quantity model compares the anticipated supply with the anticipated demand on the labor market. The methods used in the model are: (a) monitoring of the labor market, (b) quantitative forecasts, (c) expert scenarios, (d) sectors studies, (e) shift-share analysis. Monitoring is carried out by means of statistical surveys conducted within the Labor Force Sample Survey. The quantitative forecasts are created using econometric and mathematical models; the statistical method of trend extrapolation is frequently used. Scenarios elaborated by experts are the pessimistic, baseline (realistic) and optimistic scenarios, which supplement the statistical and econometric models. Sector studies predict changes in sectors, expansion and downturn, employment trends and the number of jobs, the emergence and disappearance of individual professions in the sector; and they identify imbalance on the labor market in the individual sectors. Shift-share analysis identifies the main causes of the increase and decrease in employment in a single sector, a certain type of profession or a particular qualification level (
Výzkumný ústav práce a sociálních věcí 2018 [online]). So far, this prognostic model does not provide outputs for forecasts on the regional level.
Practicing medical and non-medical health professions requires professional competence, which is defined by Act No. 96/2004 Coll. (amendment No. 201/2017), on conditions for the attainment and the recognition of professional qualifications to pursue non-medical healthcare related professions and to pursue other related activities and to provide medical care, and on the amendment of some other related acts. The four major professions in the Health and Social Care sector in the Czech Republic are classified according to CZ_ISCO: general nurses and midwives without a specialization (ISCO_322); general nurses and midwives with a specialization (ISCO_222); physicians and other healthcare specialists, with the exception of general nurses with a specialization (ISCO_22); and health professionals with the exception of general nurses without a specialization (ISCO_32) (
Český statistický úřad 2018b [online];
Národní ústav pro vzdělávání 2018a,
Národní ústav pro vzdělávání 2018b,
Národní ústav pro vzdělávání 2018c [online];
Národní vzdělávací fond 2018 [online]):
● General nurses and midwives without a specialization (ISCO_322)
According to expert estimates, in the group General Nurses and Midwives without specialization; there will be changes in the structure of the sector by 2025, together with an internal change in professional structures within individual sectors. By 2025, the number of job positions is anticipated to increase by approximately 2000, i.e., by about 4% between 2016 and 2025; and at the same time, by 2025 approximately 8000 people are expected to leave their posts in this occupational group (primarily due to retirement). In total, it is anticipated that by 2025 approximately 10,000 vacancies will need to be filled. The largest number of people are employed in Prague. Of all people employed in this occupational group, 13% work in this region. About another 13% work in the Moravian-Silesian Region, over 12% in the Central Bohemian Region, almost 10% in the Ústí Region and over 8% in the Vysočina Region. Compared to other groups of professions, the geographical concentration of this occupational group is below average in the regions of the Czech Republic. The geographical exclusivity of this occupational group is low in the Czech Republic. The largest share this occupational group has in the total number of people employed regionally is in the Vysočina Region, where general nurses and midwives without specialization make up 1% of all people employed in the region. The majority of people in this occupational group work in the region they live in; regional mobility is very low in this occupational group. There are 4.1% of people who work in a different region, which is 1.9% less than the average for the whole of the Czech Republic. Make up 0.7% of the total number of employed people in the Czech Republic, and in the European Union this occupational group makes up 1.2% of all employed people. The country with the highest percentage of employed people in this group is Germany, which has almost 3.5% (followed by Finland, Slovakia, Belgium, Croatia, Austria, Italy, Luxembourg, Estonia, Slovenia and France, which are above the EU 28 average). The average length of the educational period for people employed in this profession is 12.3 years. People with secondary education make up the largest proportion in this occupational group (86%), and people with tertiary education make up 13% (of which 55% have a bachelor’s degree). The qualification requirements of the jobs are 5.45 points in the Czech Republic and 5.46 points in the EU. People with a secondary education made up the largest proportion of this occupational group, and people with tertiary education made up the second largest part of this group.
● General nurses and midwives with a specialization (ISCO_222)
By 2025, an increase of approximately 6000 (i.e., about 10%) in the number of staff is anticipated for the occupational group General Nurses and Midwives with specialization, and by this time, approximately 19,000 people should have left their jobs (mainly to retire). In total, it is anticipated that by 2025 approximately 25,000 job vacancies will need to be filled. The largest number of people are employed in Prague. Of all people employed in this occupational group; 17% work in this region. Over 14% work in the South Moravian Region, almost 10% in the Moravian-Silesian Region, almost 9% in the Central Bohemian Region and over 7% in the South Bohemian Region. Compared to other occupational groups, the geographical concentration of this group is average in the regions of the Czech Republic. The geographical exclusivity of this occupational group is below average in the Czech Republic. The largest share this occupational group has in the total number of people employed regionally is in the South Moravian Region, where it makes up over 1% of all people employed in the region. 4.8% of people work in a different region, which is 1.1% less than the average for the whole of the Czech Republic. The share of general nurses and midwives with a specialization in the total number of employed people in the Czech Republic is 1.3%, and in the European Union it is 1.0% of all employed people. The country with the highest percentage of employed people in this category is Ireland, which has almost 3.4% (followed by Denmark, Sweden, Great Britain, Latvia, Malta, Poland, the Netherlands, Spain, Bulgaria, Belgium, the Czech Republic and Portugal, which are all above the EU 28 average). The average length of the educational period for all people employed in this occupational group is 13 years; the most frequent level of education is secondary education with graduation (68%), and 32% of people have tertiary education (of which 47% have a bachelor’s degree). The qualification requirements of these jobs are 6.38 points in the Czech Republic and 6.37 points in the EU.
● Physicians and other healthcare specialists, with the exception of general nurses with a specialization (ISCO_22)
An increase in the number of jobs is anticipated in the occupational group Physicians and other healthcare specialists, with the exception of general nurses with a specialization by 2025. Between 2016 and 2025, their number should increase by approximately 7000, i.e., by approximately 10%; and at the same time, approximately 20,000 people are expected to leave their jobs. It is anticipated that by 2025, a total of about 27,000 job vacancies will need to be filled. The greatest number of people from this occupational group is employed in Prague of all people employed in this occupational group; 21% work in this region. Over 12% work in the South Moravian Region, almost 11% in the Central Bohemian Region, over 8% in the Ústí Region and almost 8% in the Moravian-Silesian Region. Compared to other occupational groups, the geographical concentration of this group is above average in the regions of the Czech Republic. The geographical exclusivity of this occupational group is below average in the Czech Republic. In the Pardubice Region, this occupational group has the largest share in the total number of people employed regionally, making up over 2% of all people employed in the region. There are 8.2% of people who work in a different region, which is 2.3% more than the average for the whole of the Czech Republic. Physicians and other healthcare specialists, with the exception of general nurses with a specialization make up 1.4% of the total number of employed people in the Czech Republic, and 1.8% of all employed people in the EU 28. The country with the highest percentage of employed people is Belgium, which has almost 3.7% (followed by Spain, Greece, Denmark, the Netherlands, Luxembourg, Germany, Sweden, Malta, France, Slovenia and the United Kingdom, which are above the EU 28 average). The average length of the educational period for all people employed in this occupational group is 17.1 years, and all people in the group have tertiary education. The qualification requirements of these jobs are 6.94 points in the Czech Republic and 6.96 points in the EU.
● Health professionals with the exception of general nurses without a specialization (ISCO_32)
An increase in the number of jobs is anticipated for the occupational group Health professionals with the exception of general nurses without a specialization by 2025. Between 2016 and 2025, their number should increase by approximately 2000, i.e., by approximately 3%; and at the same time, approximately 13,000 should leave their jobs (mainly to retire). It is anticipated that by 2025, a total of 15,000 job vacancies will need to be filled. Again, the largest number of people are employed in Prague. Of all people employed in this occupational group 21% work in this region. Over 12% work in the South Moravian Region, over 10% in the Central Boh emian Region, almost 10% in the Moravian-Silesian Region and almost 7% in the Ústí Region. Compared to other occupational groups, the geographical concentration of this group is above average in the regions of the Czech Republic. The geographical exclusivity of this occupational group is low in the Czech Republic. This occupational group has the largest share in the total number of people employed regionally in Prague, where it makes up over 1% of all people employed in the region. There is a total of 4.9% of people who work in a different region, which is 1.0% less than the average for the whole of the Czech Republic. Health professionals, with the exception of general nurses without a specialization make up 1.1% of the total number of employed people in the Czech Republic, and 1.5% of all employed people on average in the European Union. The country with the highest percentage of employed people in this category is Germany, which has almost 3% (followed by the Netherlands, Austria, Finland, Italy and Hungary, which are above the EU 28 average). The average length of the educational period for all people employed in this occupational group is 13.2 years; people with secondary education make up the largest proportion of this occupation group (62%), and people with tertiary education make up 36%. The qualification requirements of these jobs are 5.59 points in the Czech Republic and 5.56 points in the EU.
In their 1976 research report to the European Commission, “The Potential for Substituting Manpower for Energy”, Walter Stahel and Genevieve Reday sketched the vision of an economy in loops (or circular economy) and its impact on job creation, economic competitiveness, resource savings, and waste prevention (
Cradle to Cradle 2018 [online]). The report was published in 1982 as the book Jobs for Tomorrow: The Potential for Substituting Manpower for Energy (
Korhonen et al. 2018 [online]). Promoting a circular economy was identified as national policy in China’s 11th five-year plan starting in 2006 (
Zhijun and Nailing 2007 [online]). In January 2012, a report was released entitled Towards the Circular Economy: Economic and business rationale for an accelerated transition. The report, commissioned by the Ellen MacArthur Foundation and developed by McKinsey & Company to consider the economic and business opportunity for the transition to a restorative, circular model. The report details the potential for significant benefits across the EU (
Ellen MacArthur Foundation 2012 [online]). According to the European Commission, moving from a linear to a circular economy means strengthening Europe’s competitiveness, reducing dependence on primary raw materials and creating jobs. The fundamentals of this concept can be found in Cradle to Cradle: Remaking the Way We Make Things from the German chemist Michael Braungart and American architect William McDonough. The great challenge of circular economy is to overcome the linear “taking, doing and liquidating” economic model (
Govindan and Hasanagic 2018 [online]). According to
Kirchherr et al. (
2017), a circular economy is most frequently depicted as a combination of reduce, reuse, and recycle activities. This regenerative approach is in contrast to the traditional linear economy, which has a ‘take, make, dispose’ model of production.
Section 2 describes Materials and Methods. In
Section 3; Results, the development of employed people is further predicted for the Czech Republic and its regions and the usability of the workforce in key professions in the sector is compared across the European Union.
Section 4 contains the Discussion.
3. Results
3.1. Data
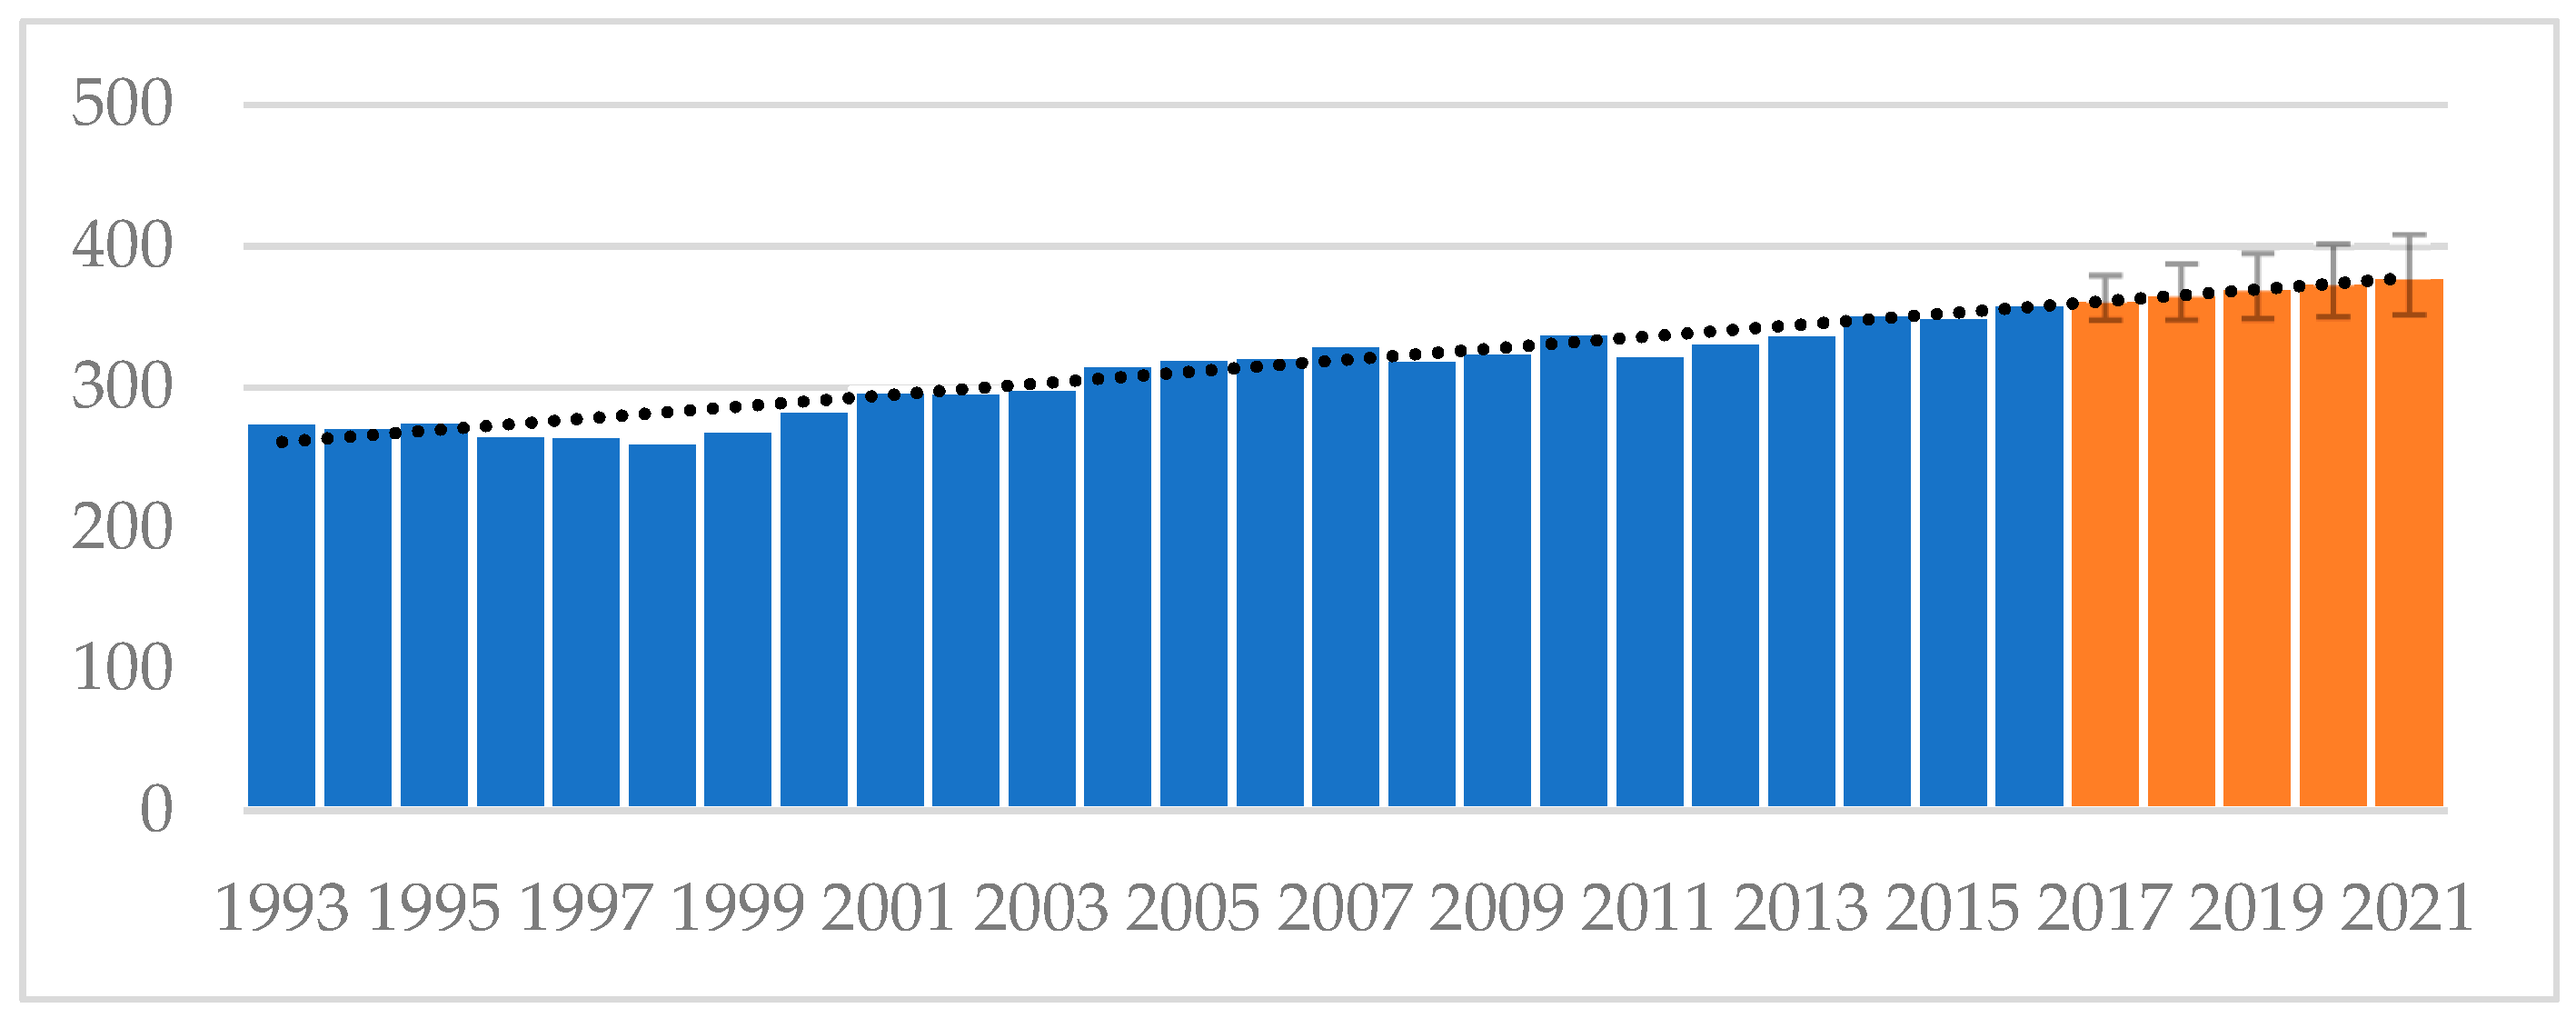
The trend for the number of people employed in the Health and Social Care sector in the Czech Republic from 1993 to 2016 (in thousands of people) is shown in
Figure 3 (
Český statistický úřad 2018e [online]). The time series has a increasing linear trend, and the double exponential smoothing method is thus used. Considering its length of 23 observations, this time series is extended by five periods until 2021. The prediction of the trend for the given variable is shown in orange and contains confidence intervals (95%). The predicted series for the whole of the Czech Republic shows a slightly increasing trend in the short-term horizon. The MAPE value is 0.02, so the trend was appropriately selected. The prediction results for the individual years are as follows: 2017—363.59 thousand people; 2018—367.73 thousand people; 2019—371.87 thousand people; 2020—376.01 thousand people; 2021—379.33 thousand people. The sector thus has an expansionary trend.
The Czech Republic is further disaggregated into individual NUTS3 regions. The number of people employed in the individual regions in the Health and Social Care sector is monitored. The regions with the following designations enter the analysis: the Capital City of Prague (PHA), Central Bohemian Region (STRC), South Bohemian Region (JIHC), Olomouc Region (OLM), Zlín Region (ZLN), Plzeň Region, Hradec Králové Region, Liberec Region, Karlovy Vary Region (KAR), Ústí nad Labem Region (UST), Pardubice Region (PAR), Vysočina Region (VYS), South Moravian Region (JIHM), and the Moravian-Silesian Region (MOSL).
The number of people employed in the monitored sector varies in the different regions of the Czech Republic, mainly because of the size of the individual regions and the representation of health institutions. As can be clearly seen in
Figure 4 (
Český statistický úřad 2018e [online]), the Capital City of Prague has the largest absolute number of people employed in the sector in the entire monitored period 1993–2016 (46,200 people in 2016) and is followed by the Moravian-Silesian Region (44,800 thousand people in 2016), the South Moravian Region (40,300 people in 2016), and finally, the Central Bohemia Region (45,100 people in 2016). Conversely, the Liberec Region (15,600 people in 2016) and the Karlovy Vary Region (13,200 people in 2016) had the lowest numbers of people employed in the sector in the monitored period. The other regions each have between 15,000–25,000 people in the entire monitored period. On the basis of this data, four major regions of employment in the given sector in the Czech Republic can be identified in the long-term horizon—the Capital City of Prague, the Moravian-Silesian Region, the South Moravian Region, and the Central Bohemian Region.
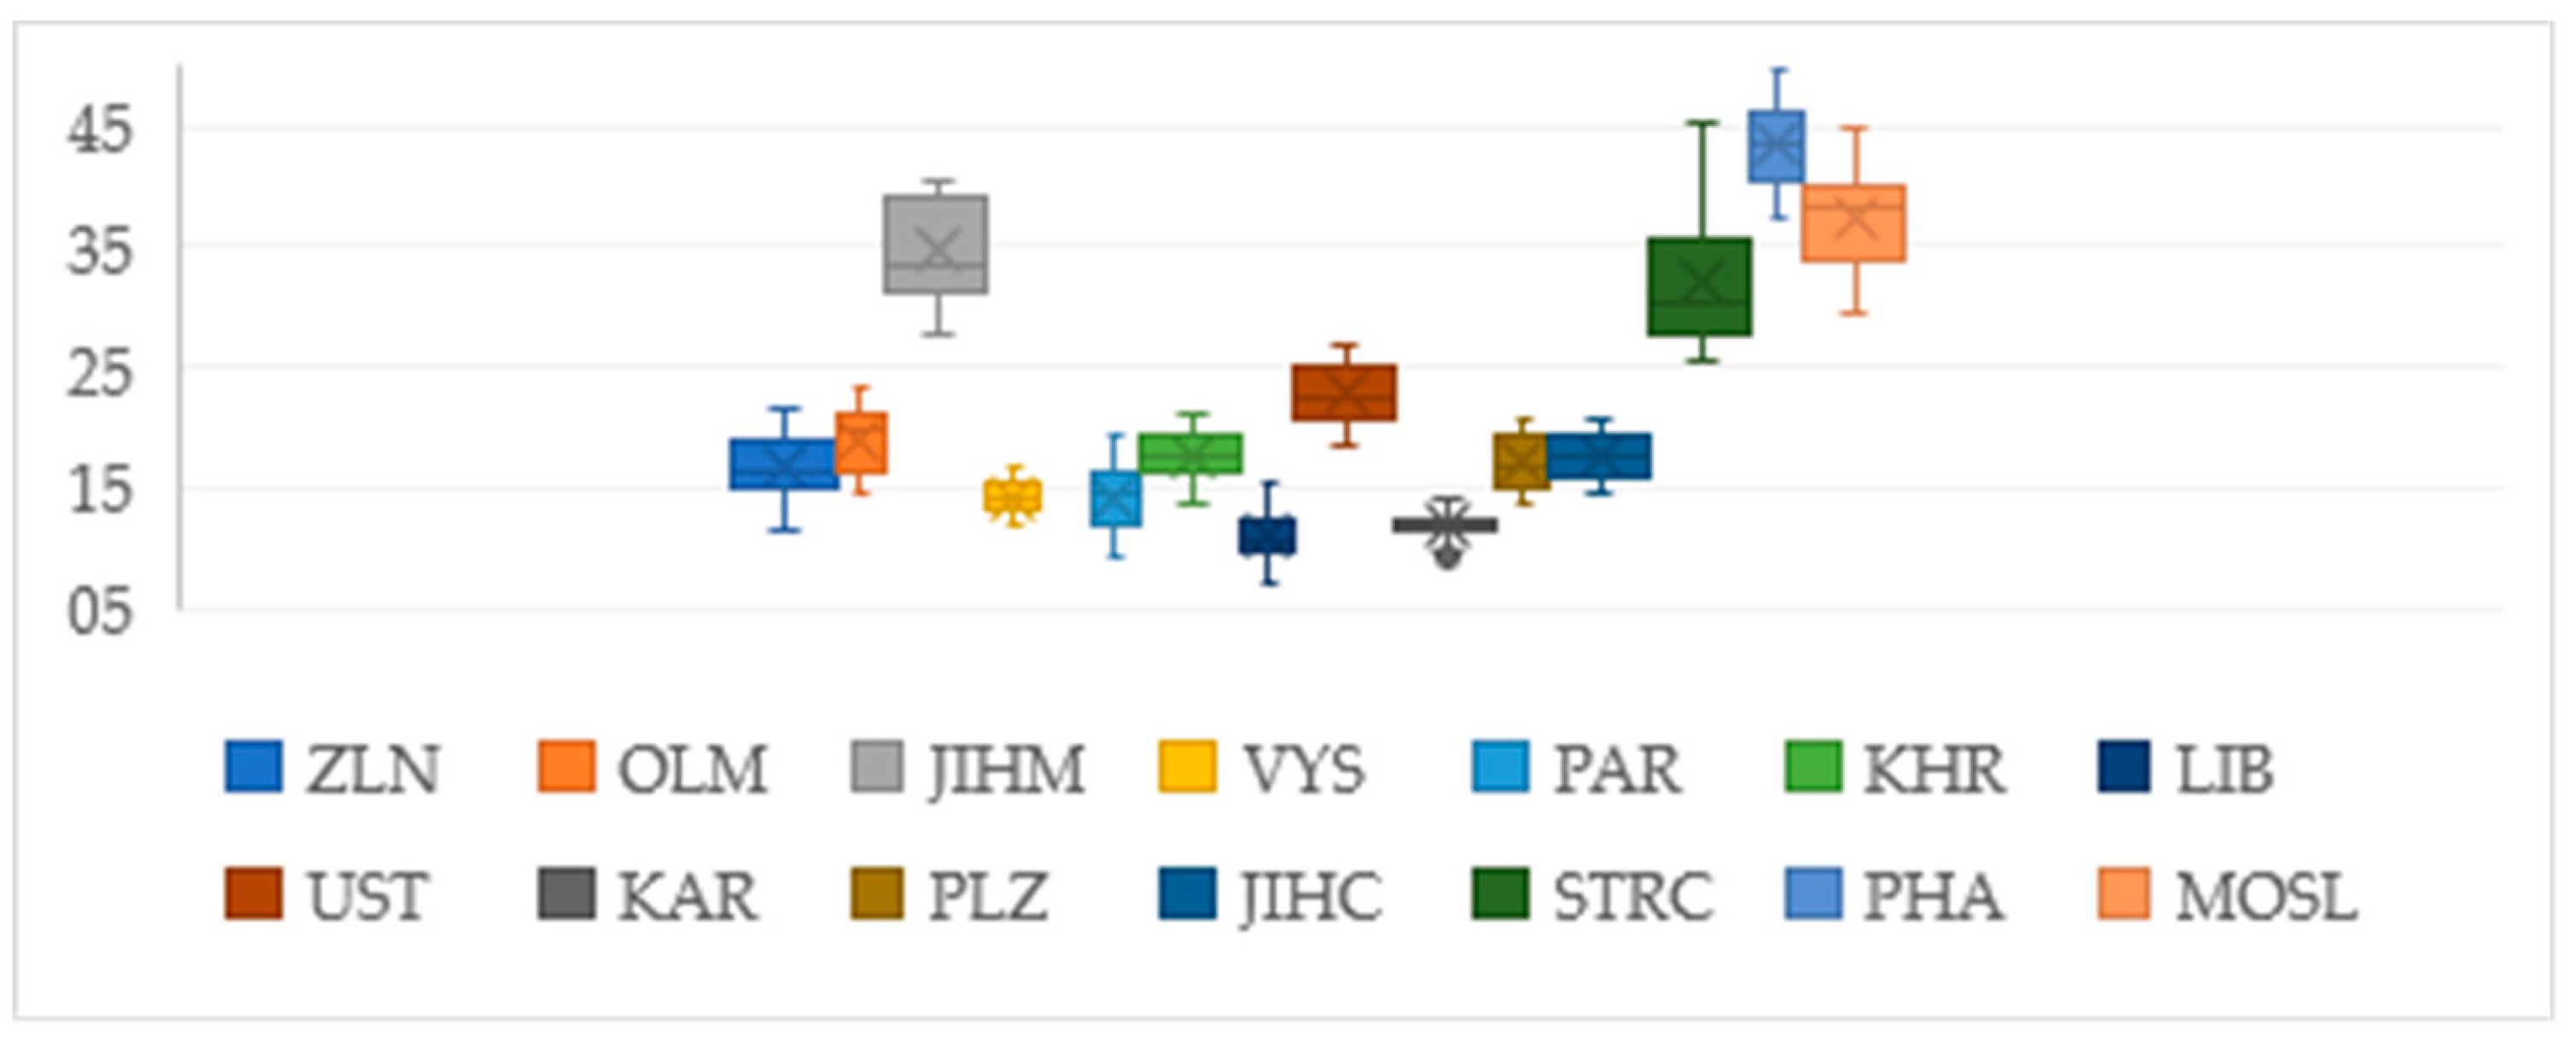
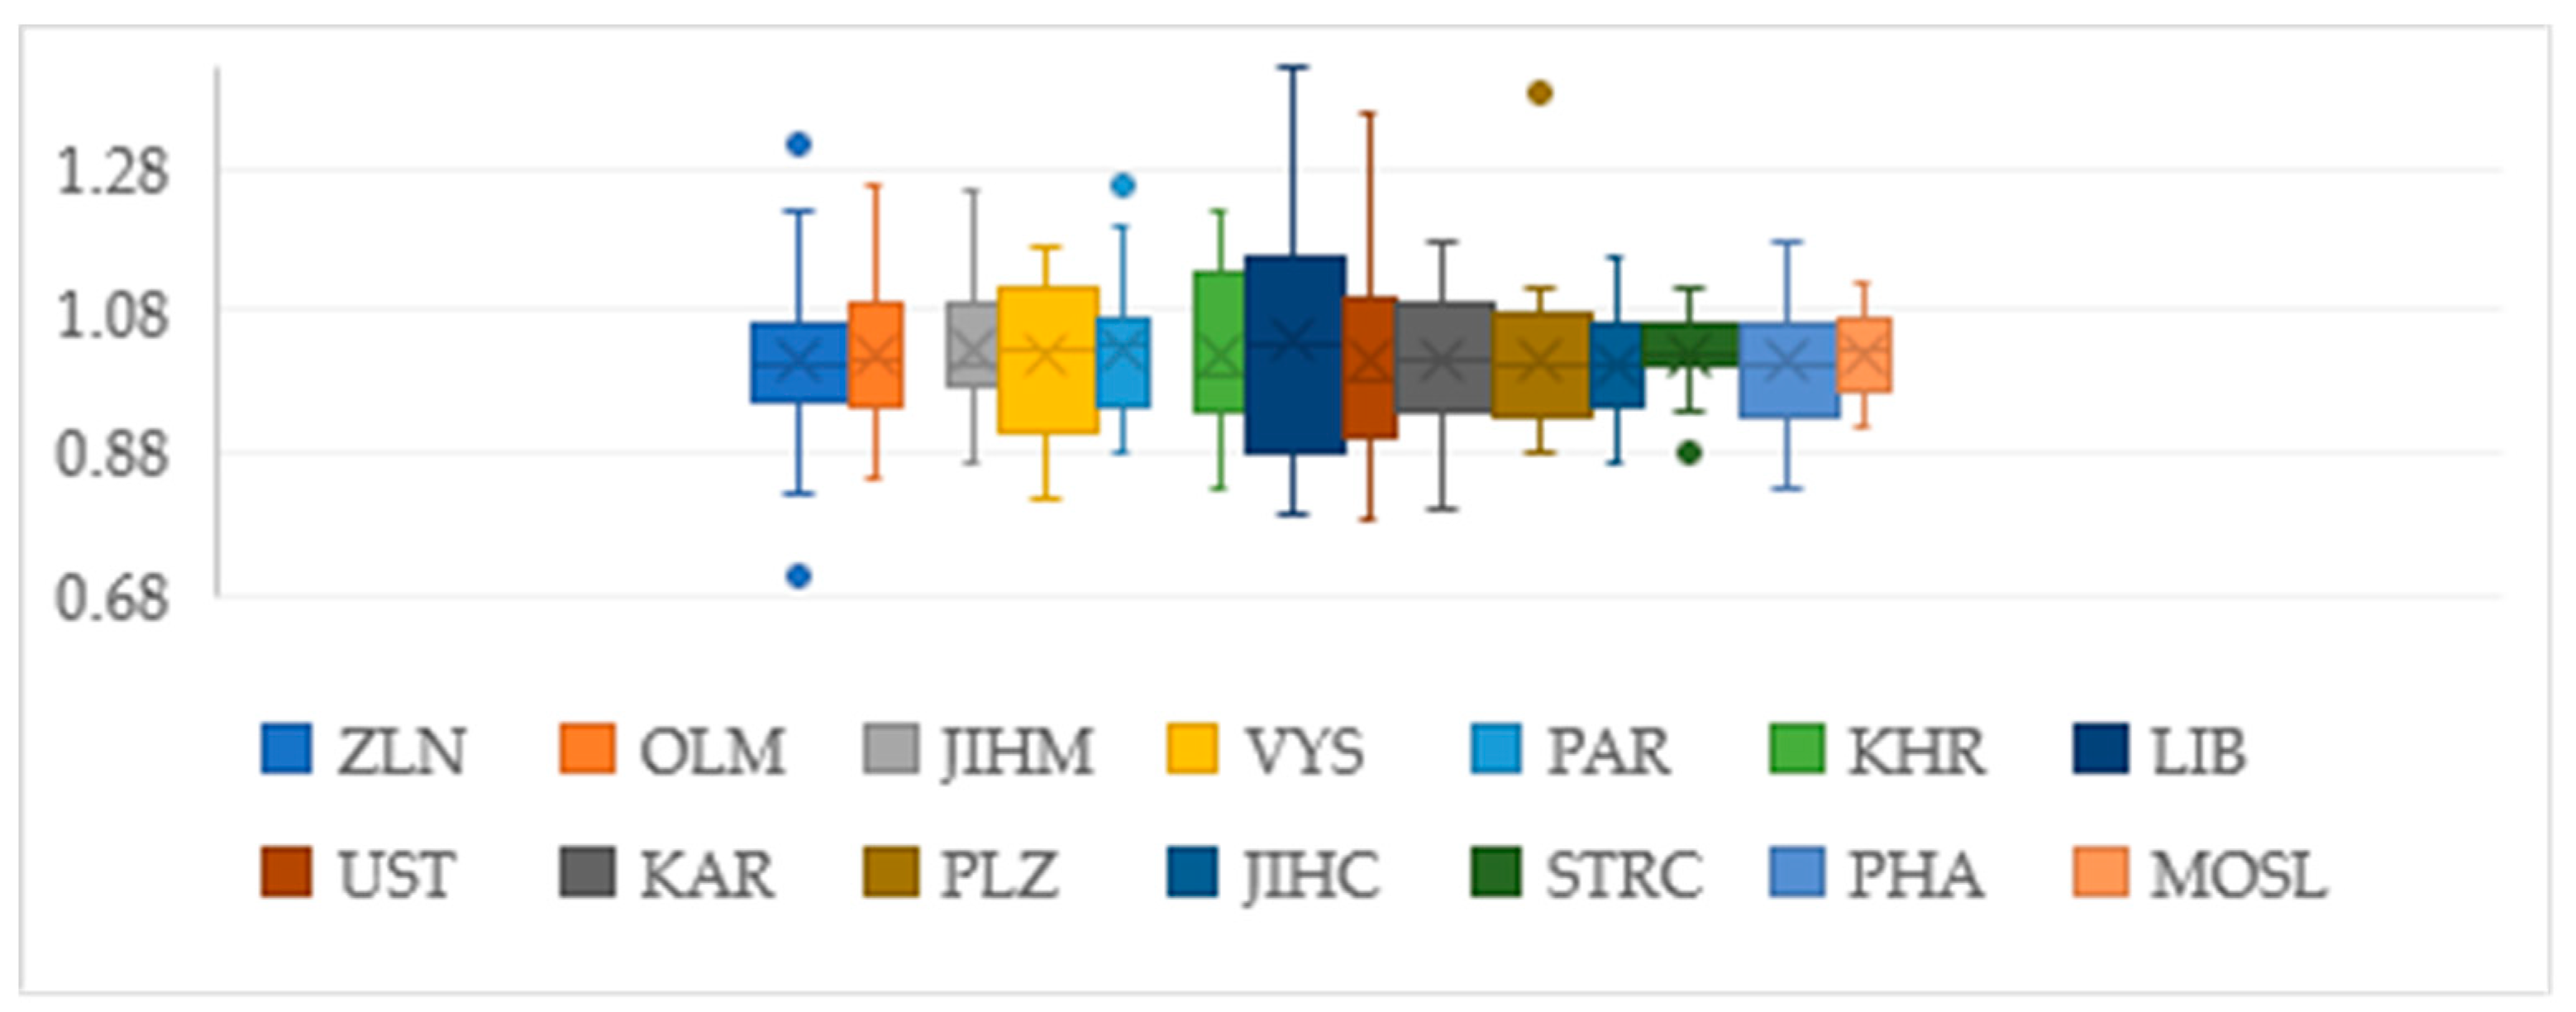
However, if we convert the absolute values in individual years to relative values, in the form of year-on-year changes, and use chain indices, i.e., the year-on-year rates of change, the regional trends for the given variable in the Health and Social Care sector show a different course. The boxplots in
Figure 5 show the median of chain indices (year-on-year changes). The time series was divided into two monitored periods (namely 1993–2016 and 2004–2016) so that the development trend over the last decade is taken into account for the monitored variable. For the entire monitored period of 1993 to 2016 (
Figure 4), the region with the highest rate of growth in the number of employed people is the Liberec Region, which has long had the highest rate of growth (average +3.81%, median +2.86%), followed by the Pardubice Region (average +2.84%, median +2.89%), the Moravia-Silesia Region (average +2.05%, median +2.46%) and, finally, the Central Bohemian Region (+1.95% average, median +1.92%). By shortening the time series to the period 2004–2016, it can be seen which region has a high rate of growth compared to the other regions in recent years, when the economic recession was manifested. If the time series is shortened, it can be said that the regions with the highest rate of growth are the Central Bohemian Region (average +1.96%, median +4.45%) and the Liberec Region (average + 2.15%, median +4.36%). Both regions had a significantly higher rate of growth in the monitored period than the rest of the regions, and their year-on-year declines were not as steep as they were for the other regions. Year-on-year declines of both expanding regions were recorded only in 2008 and 2012, and they had a significant rate of growth in the following years (the most significant year-on-year growth occurred in 2009, 2013, and 2016 for the Central Bohemian Region and in 2008, 2013, 2015 and 2016 for the Liberec Region). It can thus be said that these two regions are the most expanding regions in the Health and Social Care sector, regardless of the economic recession. Other important regions in the last decade are the Vysočina Region, the Ústí nad Labem Region and the Moravian-Silesian Region.
The four important regions with the highest number of employees (PHA, MOSL, STRC and JIHM), the two regions with the lowest number of employees (LIB, KAR), and the two regions with the highest employment growth rate were thus selected for the prediction. The time series extrapolation is applied to Prague, the Moravian-Silesian Region, the South Moravian Region (the highest number of employed people), the Central Bohemian Region (the fourth highest number of employed people and the second highest growth rate), the Liberec Region (with the second lowest number of employed people and the highest growth rate) and the Karlovy Vary Region (with the lowest number of employed people.). The time series for the period 1993–2016 is extended by five periods, i.e., from 2017 to 2021.
3.2. Prediction
Double exponential smoothing was used to predict the values. From the results (
Table 1), it is clear that all the regions will have a growing trend until the year 2021.
In the past, the Capital City of Prague has had large fluctuations in the number of employed people, and its predicted growth is slight (2.24% increase over the entire predicted period), while the prediction for the Central Bohemian Region shows a rapid rate of growth (19%); this region could assume a dominant position as early as the year 2018. The Moravian-Silesian Region has the third highest number of employees and the fourth highest rate of growth (a 4.7% increase over the entire predicted period). The South Moravian Region has the fourth highest number of employed people and the third highest rate of growth (5% increase over the entire predicted period). The Liberec Region has the second lowest number of employees and the second highest rate of growth (6.3% increase over the entire predicted period). The Karlovy Vary Region has the lowest number of employees and its predicted values rise only slightly (2.7% increase over the entire predicted period).
3.3. Cluster Analysis of Homogeneity
A cluster analysis, which groups the countries into homogeneous clusters and identifies the differences between the clusters, is used to compare the Czech Republic with other EU countries and for the quantitative representation of the selected professions (the qualitative aspect) in the Health and Social Care sector.
Employees in sector Q as a share of the total number of employed people in the country (EMPL_Q) in %,
Share of employed physicians and other healthcare specialists, with the exception of general nurses with a specialization (ISCO_22) in %,
Share of employed general nurses and midwives with a specialization (ISCO_222) in %,
Share of employed health professionals, with the exception of nurses without a specialization (ISCO_32) in %,
Share of employed general nurses and midwives without a specialization (ISCO_322) in %.
Given that the indicators have the same units of measurement, it was not necessary to standardize the data before entering it into cluster analyses by using the Z-score transformation, and the data entering the cluster analysis are thus percentage values. The year 2016 was studied. In the analysis, the EU countries are designated as follows: Belgium BE, Bulgaria BG, Czech Republic CZ, Denmark DK, Germany DE, Estonia EE, Ireland IE, Greece EL, Spain EC, Croatia HR, Italy IT, Cyprus CY, Latvia LV, Lithuania LT, Hungary HU, Malta MT, Austria AT, Poland PL, Portugal PT, Romania RO, Slovenia SI, Slovakia SK, Finland FI, Sweden SE, United Kingdom UK, Luxembourg LU, France FR, and the Netherlands NL.
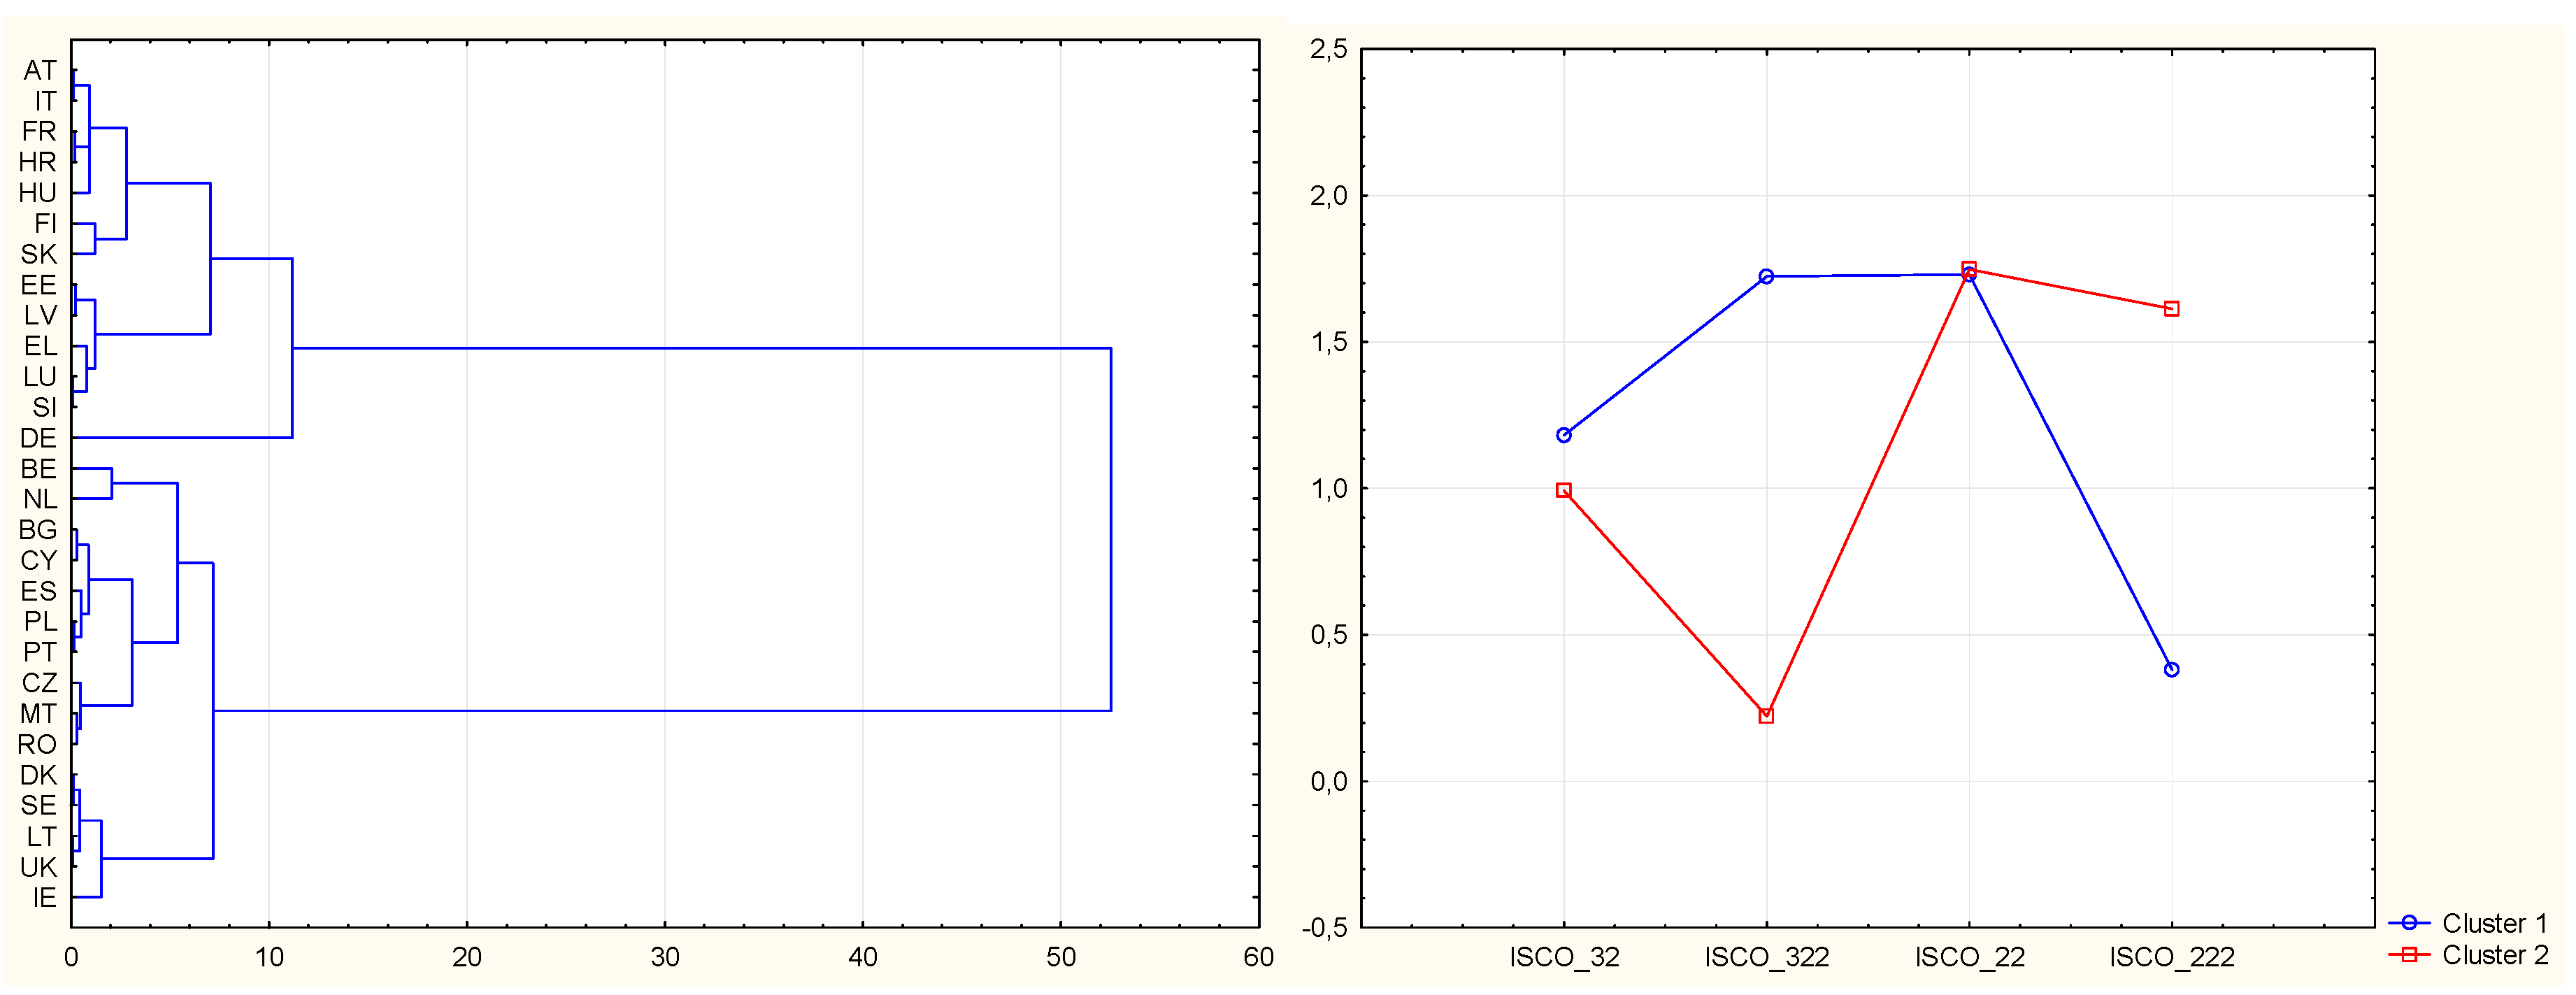
The squared Euclidean distances were determined for the individual countries using Ward’s method. Based on the analysis of the metric distances and the dendrogram evaluation, the creation of two very important clusters can be recommended. Two clusters are thus left for the K-Means clustering technique, and the differences are identified. Data in
Figure 6 are from
Český statistický úřad 2018d [online], own processing in program STATISTICA.
Cluster 1 (Italy, France, Croatia, Hungary, Finland, Slovakia, Estonia, Lithuania, Greece, Luxembourg, Slovenia and Germany) has the highest share of people employed in the professions of general nurse and midwife without a specialization ISCO_322 (1.7%); conversely, it has a low share of people employed in the professions of general nurse and midwife with a specialization ISCO_222 (0.48%). The share of employed health professionals is very close to the second cluster and makes up 1.15%, and the share of employed physicians is almost homogeneous for all countries and makes up 1.7%.
Cluster 2 (Belgium, Netherlands, Bulgaria, Cyprus, Spain, Poland, Portugal, the Czech Republic, Malta, Romania, Denmark, Sweden, Latvia, Great Britain and Ireland) has the lowest share of people employed in the professions of general nurse and midwife without a specialization ISCO_322 (0.3%); conversely, it has a high share of people employed in the professions of general nurse and midwife with a specialization ISCO_222 (1.6%). The share of employed health professionals is very close to the first cluster and makes up 1%, and the share of employed physicians is almost homogeneous for all countries and makes up 1.7%.
For a more detailed international analysis, it would be possible to create up to eight individual clusters for the given countries. However, due to the number of variables, the two basic clusters with the longest metric distance were selected.


