Article

Waste-to-Energy Conversion in Havana: Technical and Economic Analysis

by
Junior Lorenzo Llanes
1,* and
Efstratios Kalogirou
2
1
Chemical Engineering Department, Technological University of Havana (Cujae), Havana 11500, Cuba
2
Waste-to-Energy International Expert, 15780 Athens, Greece
*
Author to whom correspondence should be addressed.
Soc. Sci. 2019, 8(4), 119; https://doi.org/10.3390/socsci8040119
Submission received: 12 February 2019 / Revised: 26 March 2019 / Accepted: 1 April 2019 / Published: 16 April 2019
(This article belongs to the Special Issue Social and Economic Aspects of Waste Management)

Abstract

:
Havana has the highest population and consequently generation of municipal solid wastes (MSW) in Cuba. In Havana, the final deposition method for MSW is mainly landfills. However, in most cases, they exceed their lifetime of operation becoming in reality dumpsites without energy recovery from wastes. In this regard, waste-to-energy is a well-established technology for MSW treatment. The aim of this work was to carry out a techno-economic assessment for a proposed waste-to-energy plant in the city of Havana. A step-wise methodology based on two process analysis tools (i.e., Excel and Aspen Plus models) was used for the technical evaluation. Simulation results are in agreement with data from real plants, showing that it is possible to produce 227.1 GWh of electricity per year, representing 6% of the current demand in Havana. The economic analysis showed the feasibility of the project with a net present value of 35,483,853 USD. Results from the sensitivity analyses show the effect of the economy of scale when changes in low heating value were considered. Finally, a hypothetical best scenario was studied considering the net effect on the average Cuban salary.

1. Introduction

Nowadays, one of the challenges that must be faced by a growing society is its waste management. According to the World Bank, 1.3 billion tons per year of municipal solid wastes (MSW) are generated globally, which is expected double by 2025 (Hoornweg and Bhada-Tata 2012). The main reasons for the increasing generation rate are linked to fast population growth and technological development. On the other hand, more than a half of MSW are disposed in dumpsites and/or landfills, carrying out three fundamental problems (i.e., availability of cultivable land, health hazard and loss of energy potential) (Wilson et al. 2015).
In low- and middle-income countries (e.g., in Latin American and The Caribbean), this situation is even more difficult. It is not possible to ensure access to a proper waste management system addressed to eliminate uncontrolled disposal and burning. It is a priority for local governments to promote innovative and effective initiatives toward a sustainable system regarding solid waste management (Wilson et al. 2015). Increasingly important is the role of sustainable waste management as part of sustainable development in the policies of many countries of Latin America and The Caribbean (LAC) (Psomopoulos and Themelis 2014).
To gain significant improvements in the MSW management system, it is essential to develop a strategy, i.e., to set the targets and goals as well as to establish the stages during the system operation. It can be seeing as a guideline for all participants (i.e., policy makers, citizens, investors, etc.) involved in MSW management (Rousta et al. 2015). 
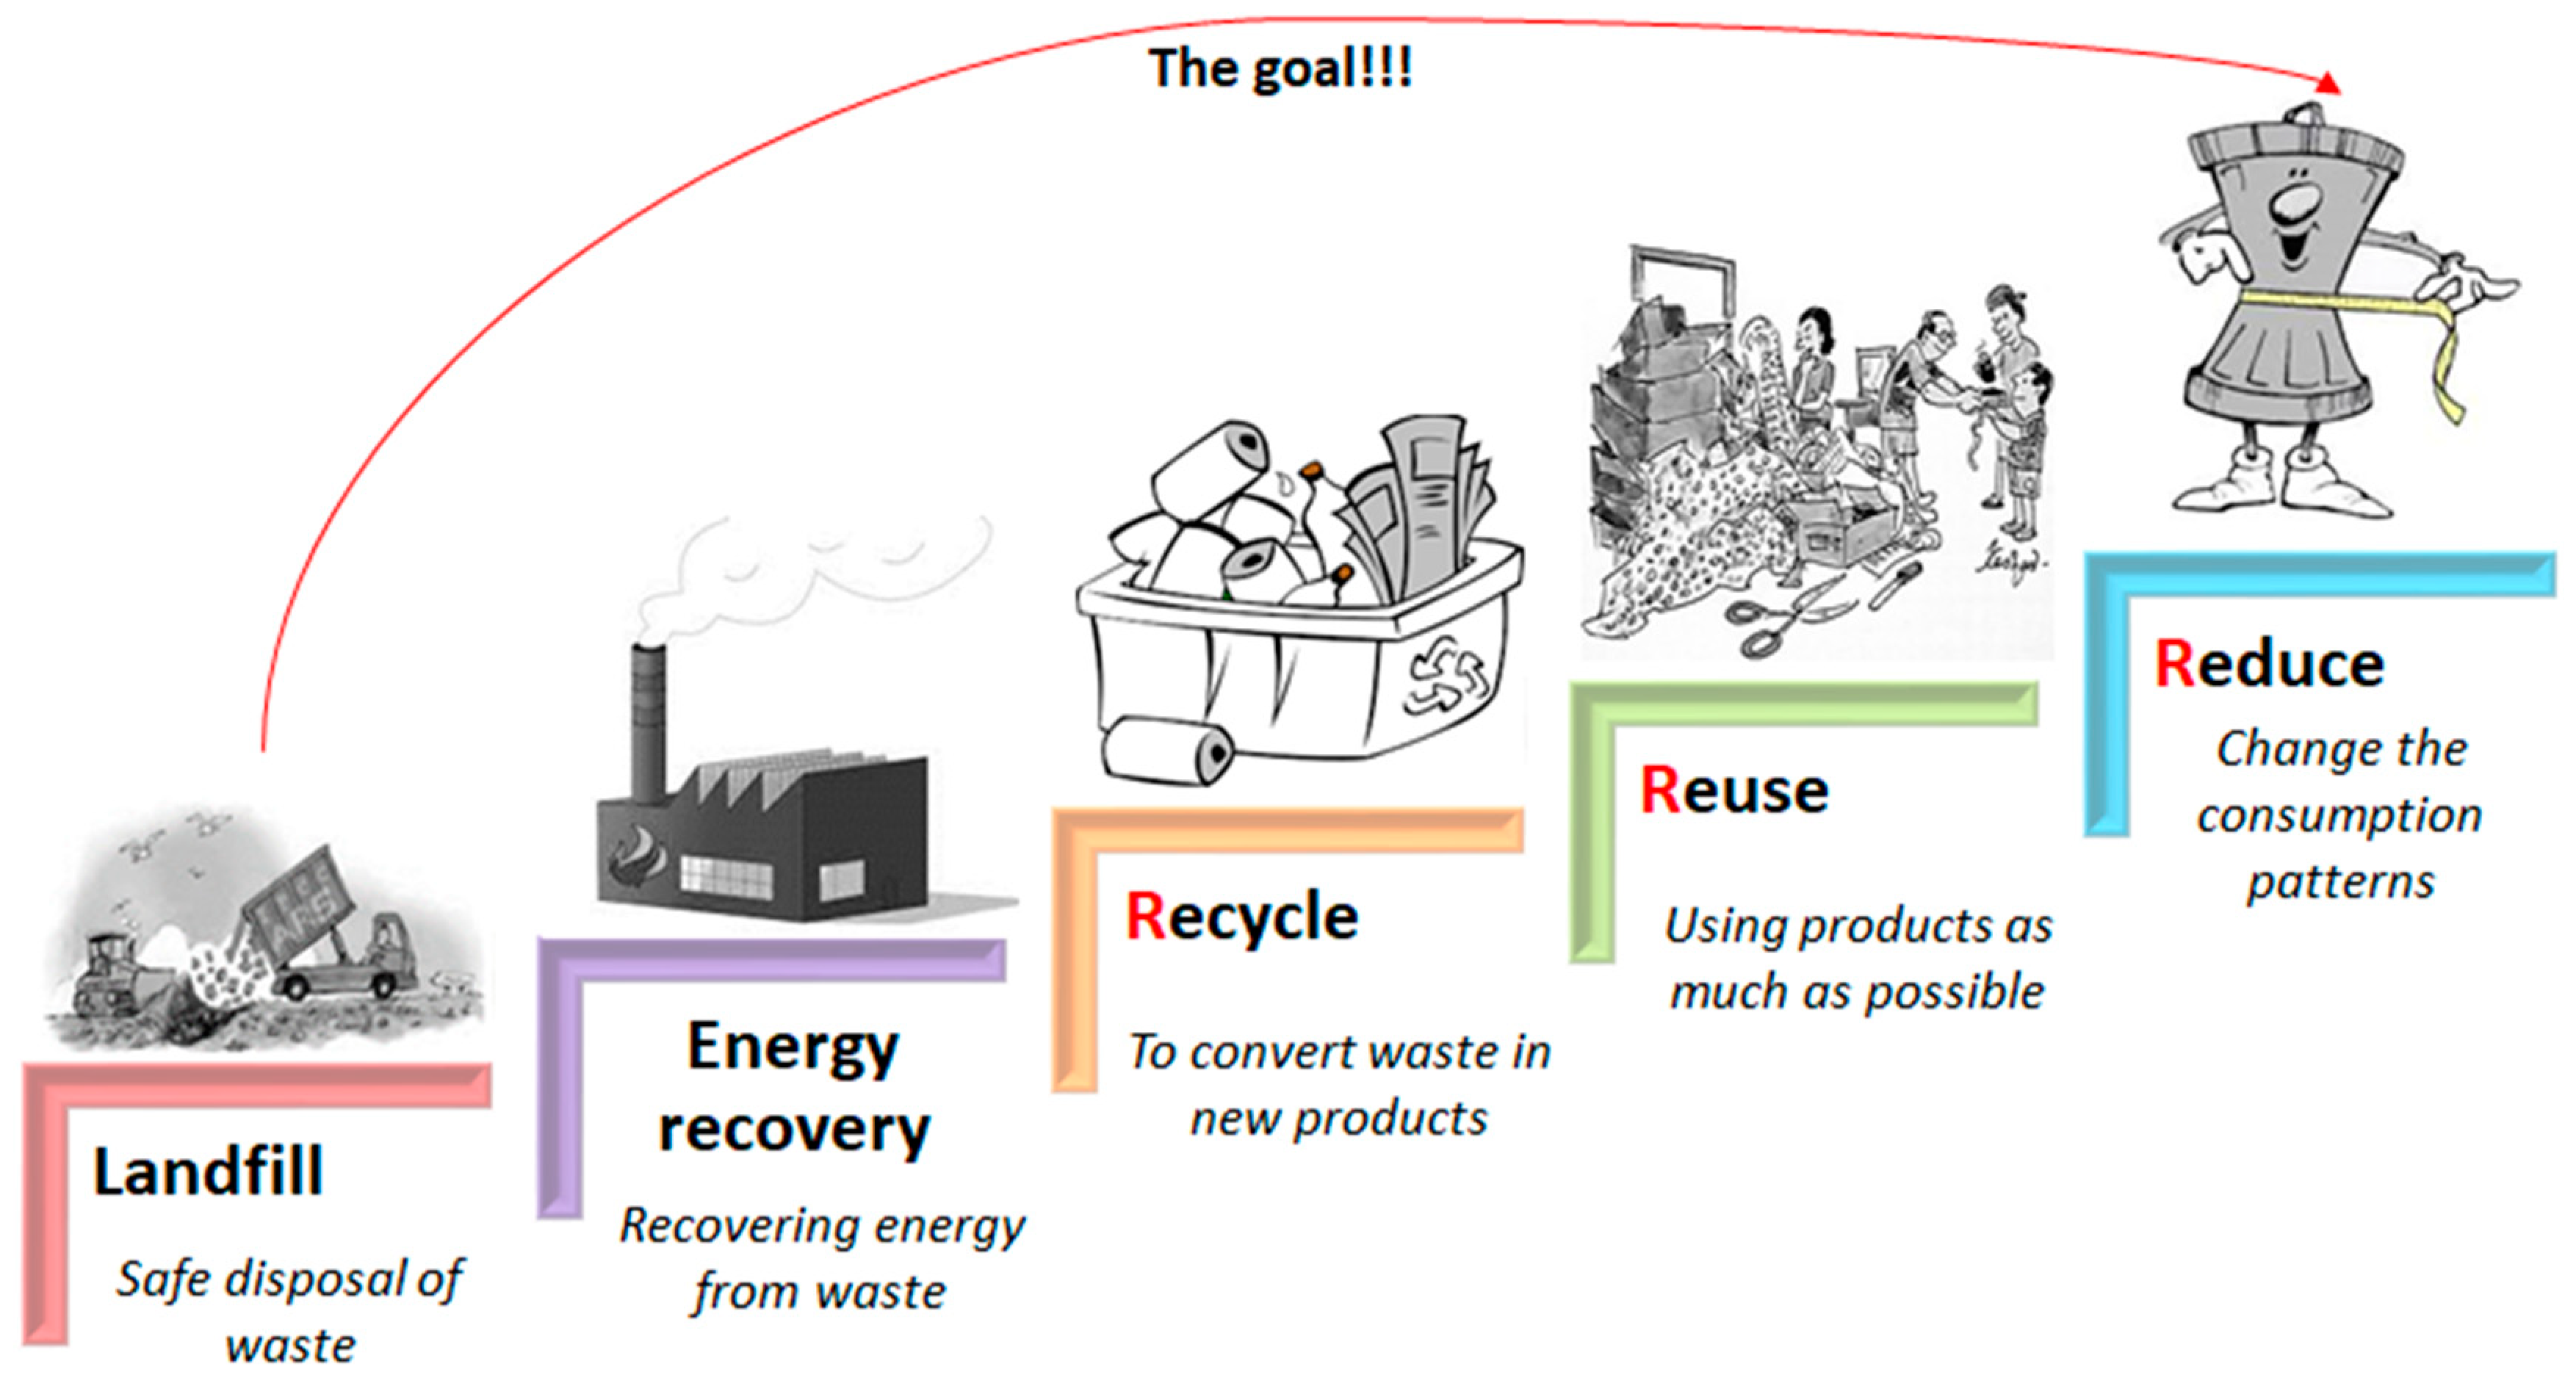
Figure 1 shows the well-known waste management hierarchy, which was established as the strategy to guide all actors in MSW management in the European Union (European Commission 2008).
In Figure 1, the three highest levels in waste management are represented by the so-called 3Rs (i.e., reduce, reuse, recycle). Its role is the material flow minimization by decreasing the amount of waste or transforming the materials in new products by recycling to reduce both raw materials and energy. If the 3Rs implementation it is not possible, the waste should be converted into a valuable product, e.g., energy (Rousta et al. 2015). However, even when the implementation level of the 3Rs is high, in practice, there is a large fraction of MSW that must be treated to recover its energy content (Themelis et al. 2013).
According to the International Renewable Energy Agency, the capacity for power generation from municipal wastes in the world was around 11,540 MW in 2018 (IRENA 2018). Energy recovery from waste could be carried out by two main routes (i.e., biological and thermal). The biological route is based on the biogas production as energy source from organic wastes. On the other hand, during the thermal route, the waste is prepared as refuse-derived-fuel for combustion, gasification or pyrolysis to produce electricity, heating or both (Rousta et al. 2015; Nordi et al. 2017).
Combustion (as waste-to-energy in the present work) can be classified as the most common thermal treatment where the mass and volume of waste can be reduced by 70% and 90%, respectively (Gohlke and Martin 2007; Nixon et al. 2013; Kalogirou 2017). Even though waste-to-energy (WTE) is nowadays considered as an attrsactive option for waste treatment in developed countries such as US, Japan and EU (Psomopoulos et al. 2009; Kumar and Samadder 2017), it still has low presence in underdeveloped countries. Developing WTE facilities in low- and middle-income countries implies scale-up in the level of complexity in waste management systems which are already deficient. 
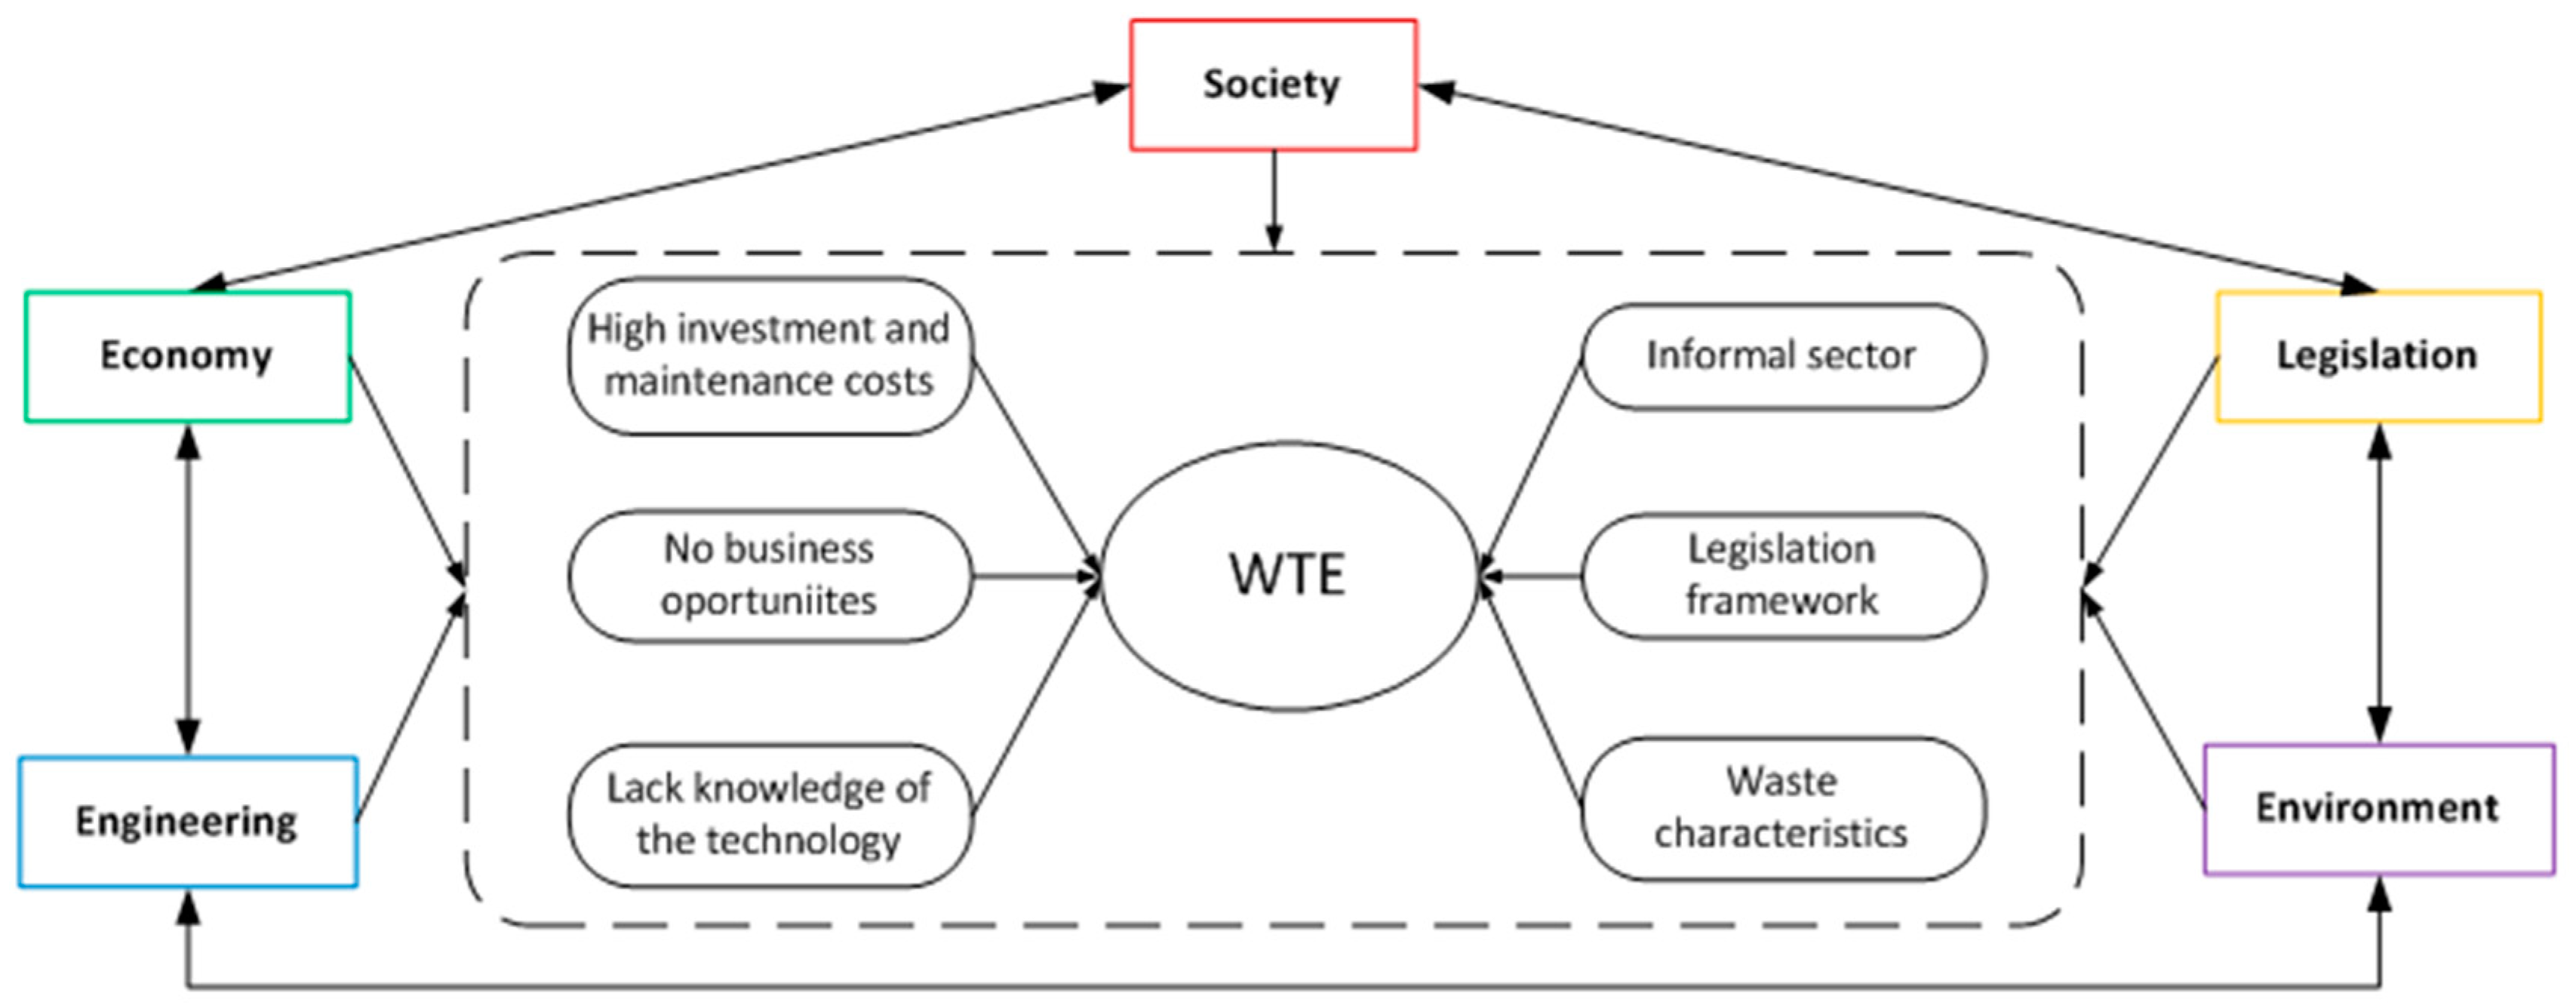
Figure 2 shows the main disciplines involved in waste management system (i.e., society, engineering, economy, legislation, and environment) (Rousta et al. 2015) and the barriers that should be overcome for them to develop a reliable WTE project in underdeveloped countries.
Legal and environmental aspects are closely related in WTE, being necessary a legal framework to ensure certain degree of legacy and legitimacy to the project. Emissions standards and other environmental prescriptions require laws and regulatory controls by certified public authorities. Even though, in most underdeveloped countries, environmental laws exist, specific regulations concerning WTE are not always included.
Main challenges for engineering disciplines are the variations in the caloric value of the waste, mainly due to high moisture content and changes in consumption patterns, compared with developed countries. On the other hand, an experienced and certified staff is required for plant operation and maintenance. Economic aspects are related to the high investment and operating costs, which cannot be recovered by existing waste fees and generated additional income from energy sales alone. Social impact over the informal sector should be carefully studied, since these persons are dependent on the availability of recyclables in the waste. In Figure 2, it is clear that technology transfer from developed scenarios (e.g., EU, Japan, and US) for WTE to low- and middle-income countries could not meet the financial, waste composition and local capacity expectations if the interactions of all disciplines involved are not properly studied.
In LAC, only three incineration plants (waste-to-energy plants) are currently in operation: in Bermuda, Martinique and Saint Barthelme Islands. The capacities range from 1.5 t⋅h−1 to 7 t⋅h−1. The plants on Bermuda and Martinique can supply ~3% and 4% of the electricity demand on those islands, respectively. It should be mentioned that these three island are overseas territories of France and England, countries with economic resources and experience for implementing waste-to-energy (Themelis et al. 2013).
Even though there are no WTE plants in any other countries in LAC, many studies have been carried out to study the potential of this technology in the region. Three study cases (i.e., Toluca, Valparaiso, and Buenos Aires) were presented by Themelis et al. (2013). Results show that, for the city of Toluca (Mexico), it is possible to produce 96 GWh yearly based in a plant capacity of 160,000 tons of waste per year, being necessary to increase the gate fee three times compared to the base conditions to get profits. For the case of Valparaiso in Chili, a plant with a capacity of 336,000 tons of waste per year is projected. The generation capacity in this case is 182 GWh per year. Results from the technical and environmental evaluation show the benefits of the plant. However, it is not possible to obtain economic benefits from the investment at the current prices of gate fee and electricity in Chili. Finally, a plant with a processing capacity of 1 million tons per year for the city of Buenos Aires (Argentina) is also considered. The electricity generation is estimated at ~605 GWh per year. It is concluded that, for the project to be feasible, the gate fee should be higher than the current landfilling cost, unless a reduction in capital expenses to less than 6% could be reached (Themelis et al. 2013).
The biological and thermal routes are studied for the evaluation of the energy recovery potential from MSW in Ecuador. Regarding WTE plants, the potential is estimated at ~3 GWh per year. No economic assessment is carried out to integrate the technical and financial results (
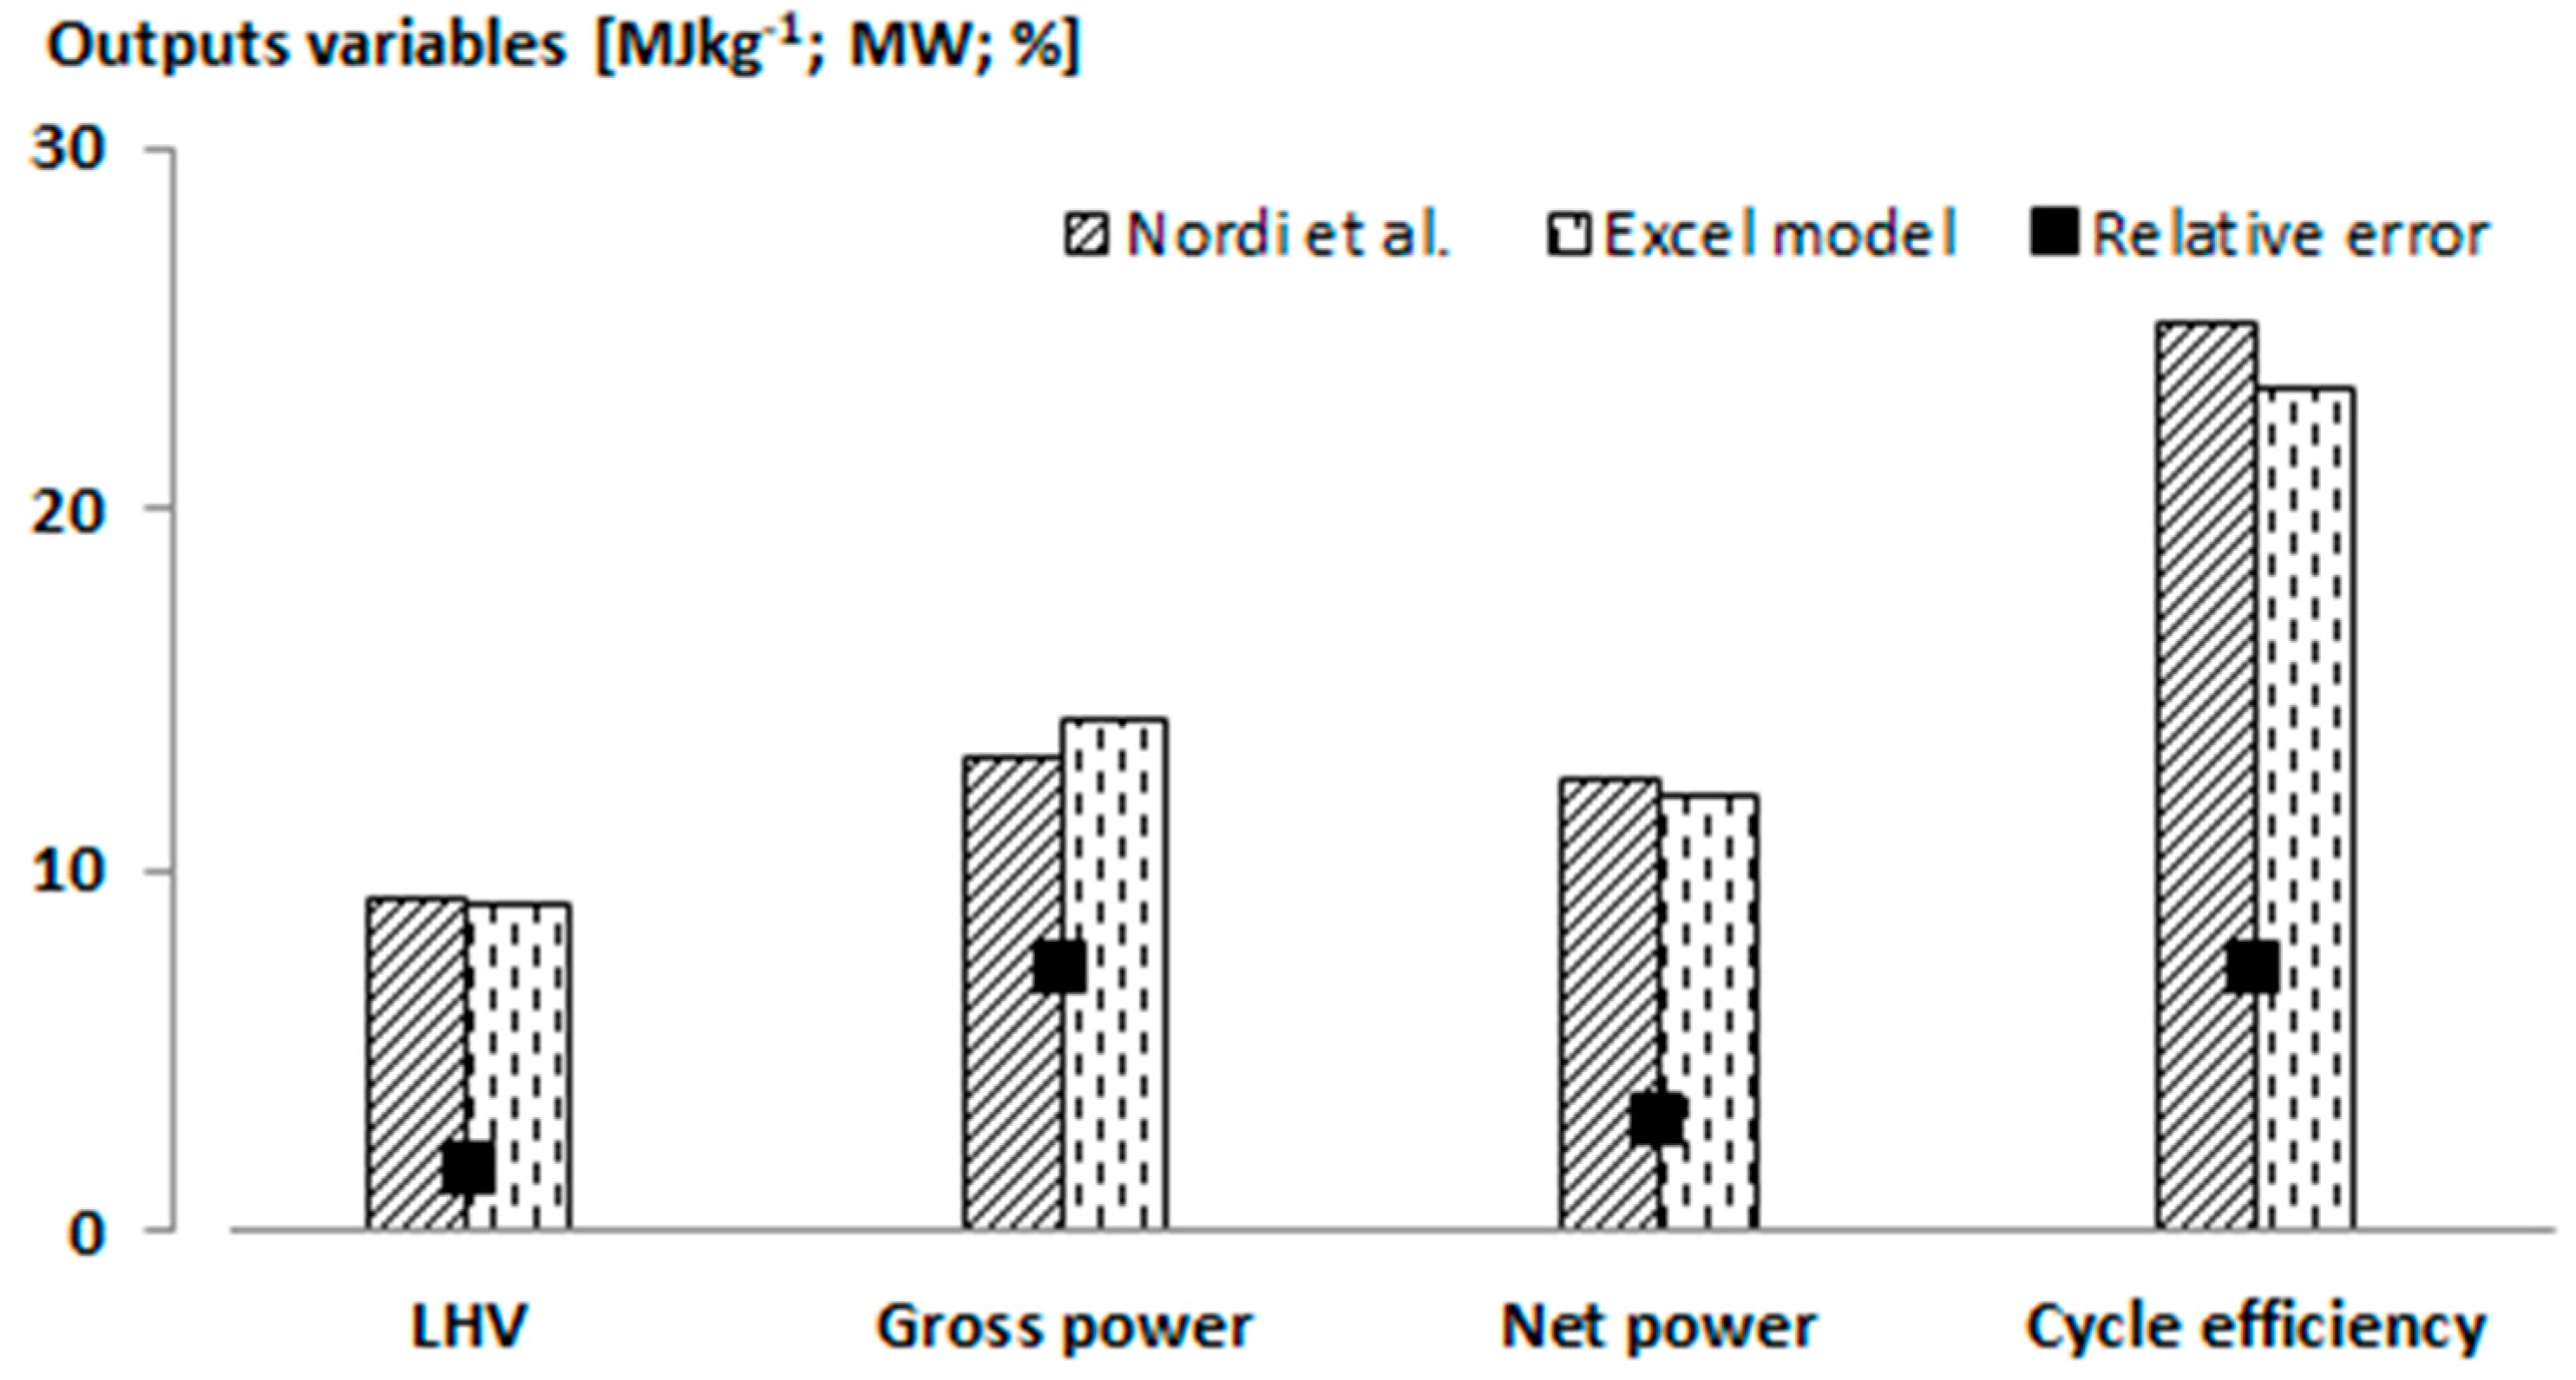
Vargas and Espinoza 2013). Recently, the electricity generation through a steam cycle from MSW in Santo André city (Brazilian State of São Paulo) ia carried out (Nordi et al. 2017). In this work, the influence of the MSW composition on the cycle performance ia studied. In all the cases presented, it is concluded that the lower are the moisture and inert contents, the better is the cycle performance. The financial assessment shows that, for a fixed gate fee, the electricity price should vary between 60 and 150 USD per MWh for the WTE project to be feasible.
Cuba is the biggest island in the Caribbean; however, this does not mean that compared with the rest of the neighboring islands there is enough space for landfilling. Tourism is one of the main income sources to the Cuban economy as well as waste generation sector. Regarding the energy mix, only 4% of the electricity generated is based on renewable sources, while the other 96% is shared by fuel oil and natural gas (ONEI 2017). These facts impose the necessity to move toward more sustainable waste management and energy generation systems. In this context, WTE should play a key role as treatment method as well as renewable energy source.
WTE has proven to be a better option for waste treatment compared with landfilling, providing cleaner electricity, heat and final disposal for MSW. A large reduction in waste volume can be achieved, reducing surface requirements, waste toxicity and the impact on groundwater due to formed leachate. Depending on the composition of the combustible fraction, MSW can be considered as a renewable energy source, having a direct impact on the greenhouse gases balance. The more MSW is diverted from landfills to WTE plants, the less waste is biologically degraded, reducing methane and carbon dioxide emissions. In addition, carbon dioxide emissions can be reduced even more by substituting fossil fuels as a primary energy source in power plants. It is estimated that the combustion of 1 metric ton of MSW in modern WTE plants can save the utilization of 1 barrel of oil (Psomopoulos et al. 2009). WTE provides an integrated solution to meet both the waste management, in terms of environmental and sanitary requirements, as well as energy generation goals.
With 2,129,553 inhabitants reported in 2017 (ONEI 2018), Havana has the highest population in Cuba and is the capital of the republic. It is one of the top tourist destinations as well as the place where many process industries are sited. In 2017, the volume of waste generated in the City of Havana represented ~25% of the amount generated in the entire country (ONEI 2018). In Havana, the final deposition method for MSW is mainly landfills. However, in most of cases, the operation lifetime is exceeded, becoming in real dumpsites without energy recovery.
Many studies regarding MSW management in the city of Havana have been carried out (López Torres et al. 2004; Espinosa Lloréns et al. 2007; Espinosa Lloréns et al. 2005; NIPPON KOEI 2007). The first physicochemical characterization of the three biggest landfills in Havana shows that the heating value varied in the range from 7.1 to 12 MJ⋅kg−1 in the biggest dumpsite of the city. However, no information about the gravimetric composition is reported (Espinosa Lloréns et al. 2005). Regarding energy recovery, the biogas generation from the organic fraction of MSW has been studied, showing that it is possible to recover the investment in three years (López Torres et al. 2004). The most recent characterization of MSW in Havana was carried out in collaboration with the Japan International Cooperation Agency in 2007 (NIPPON KOEI 2007). In this study, the results are based on the gravimetric composition; an Integrated Solid Waste Management Strategy is also presented. Despite different alternative being considered in the strategy, none of them include WTE as an integral part.
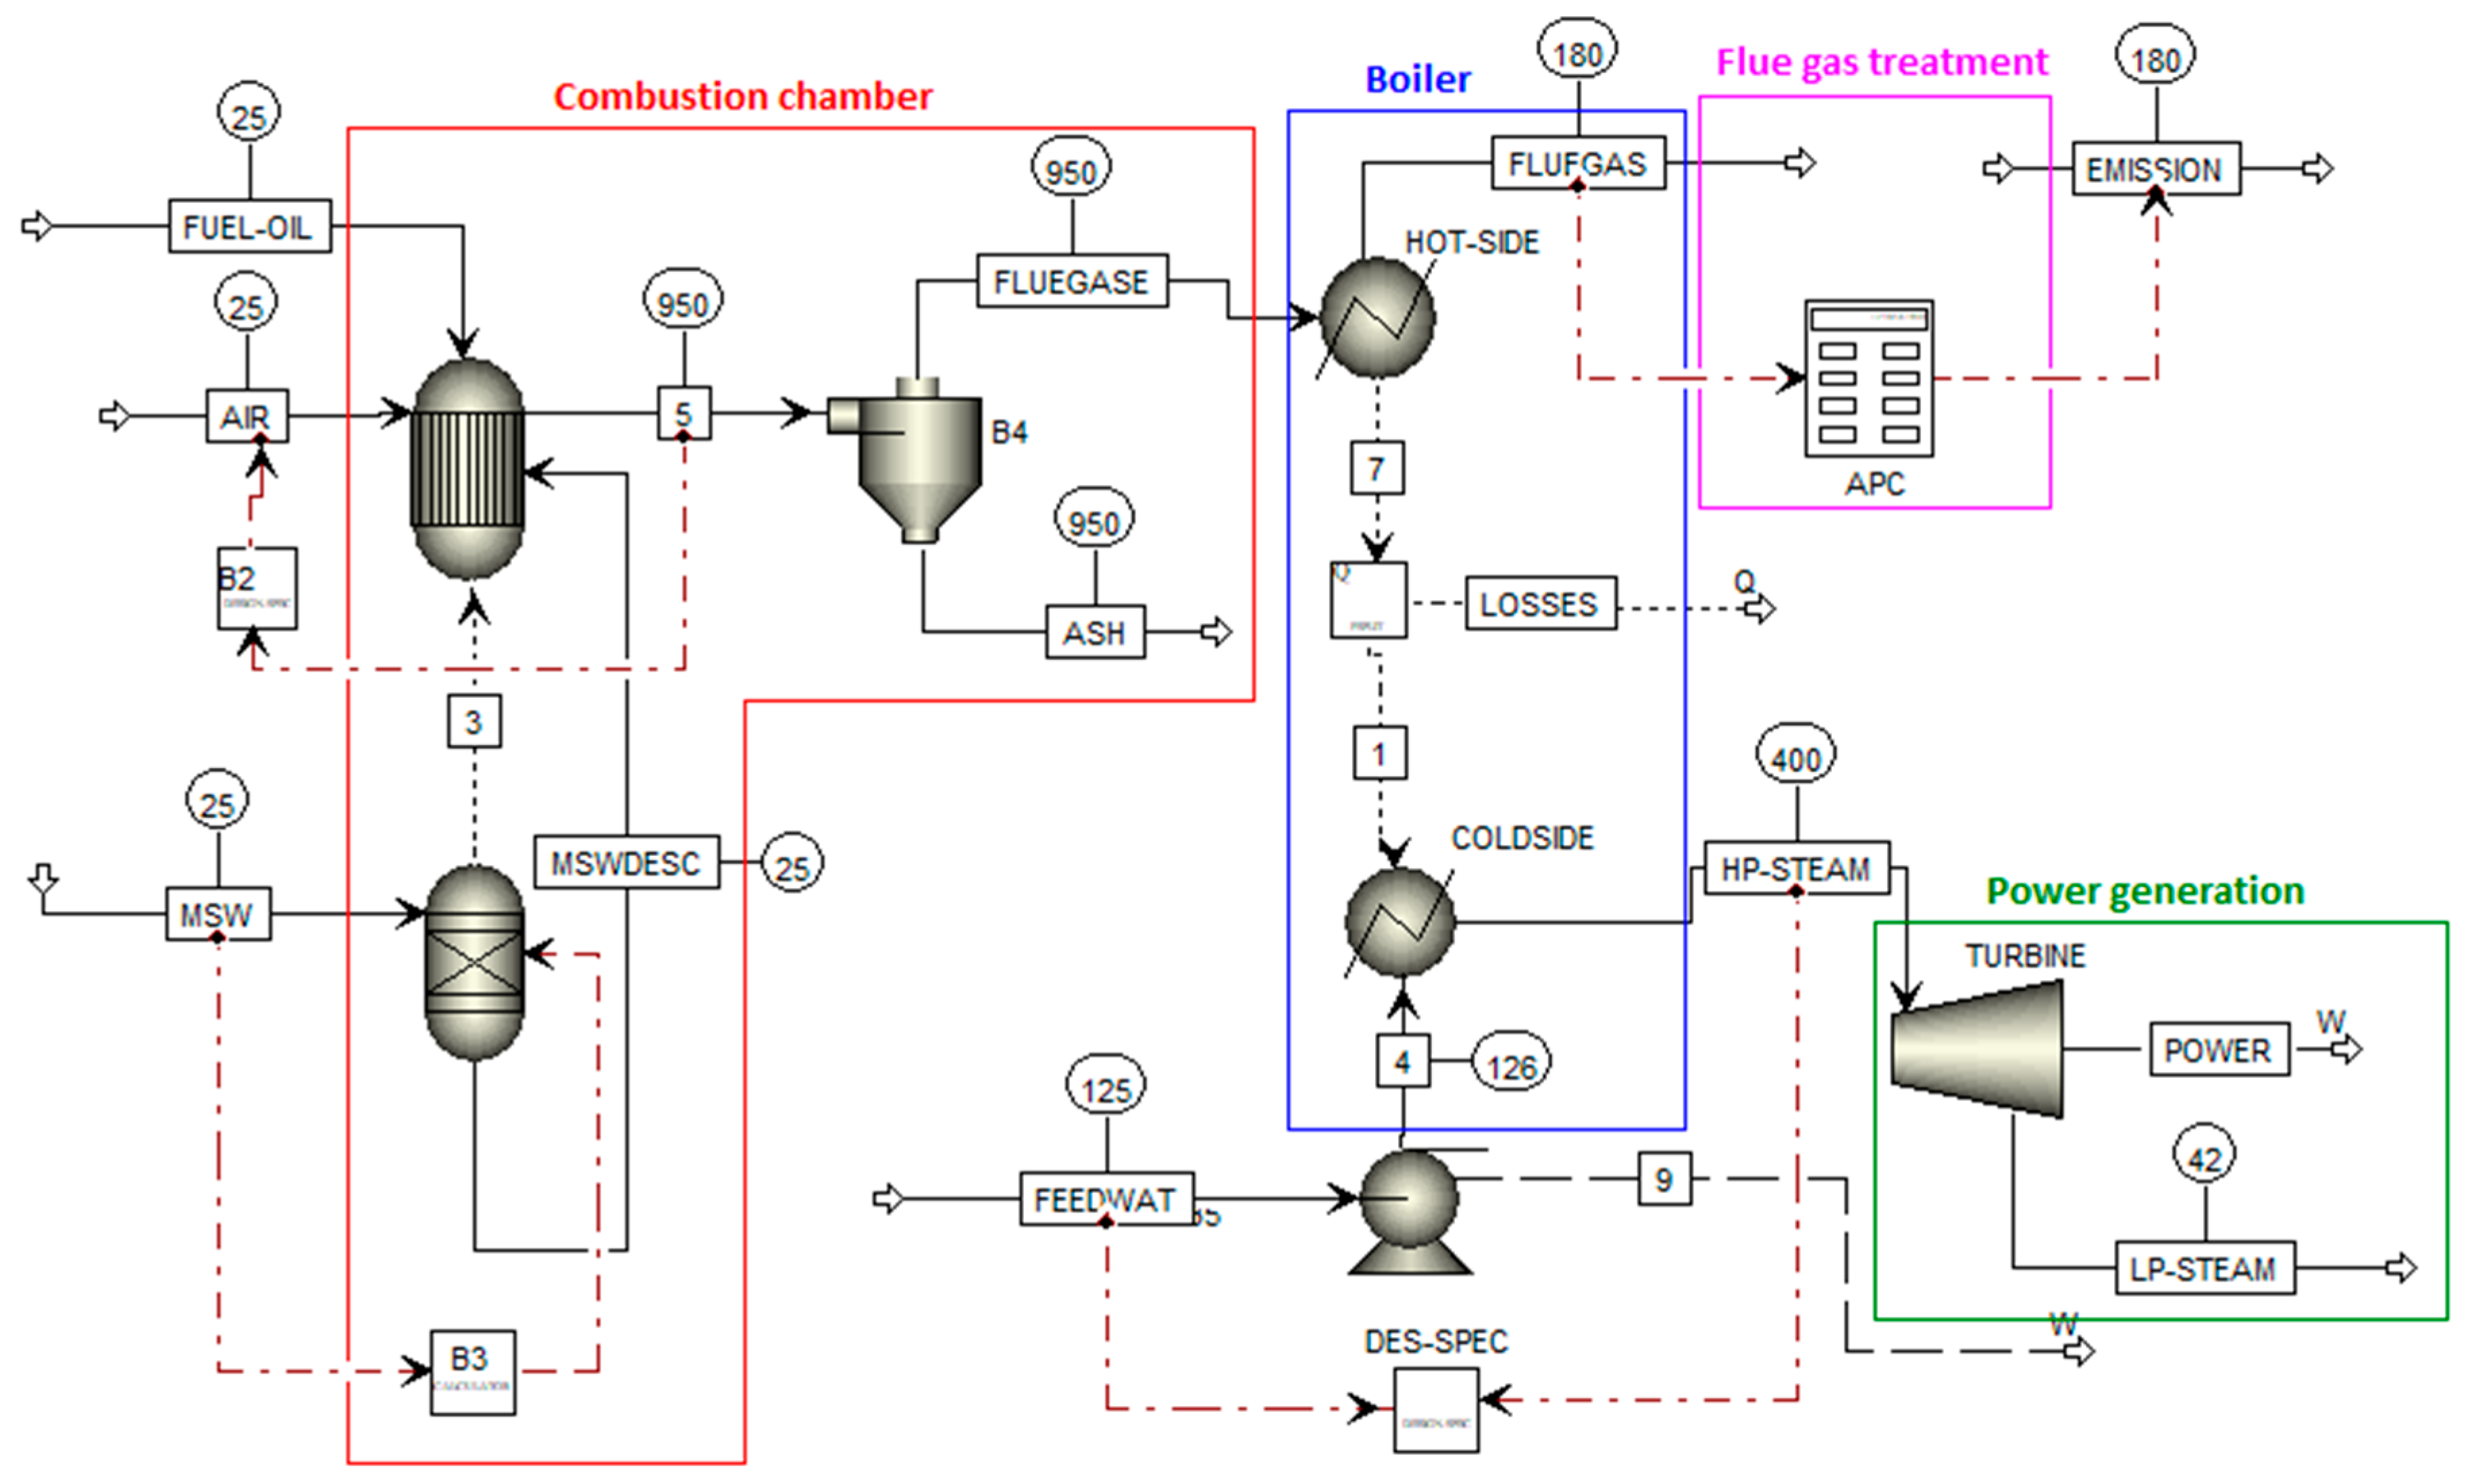
Modern design of WTE plants should be seen as a combination of techno-economic and ecological aspects. Design methods aided by computer-simulation tools are required to achieve this goal. Computer-aided process simulation tools can handle high volume of calculations quickly and with a high level of accuracy, allowing design engineers to focus on other tasks such as alternative assessments. Nowadays, process simulation is extensively used to forecast the behavior of physicochemical processes for a given number of inputs (Elyas and Foo 2017). The development of process simulation models for WTE technologies allows the prefeasibility and optimization analyses as support for design decisions.
Aspen Plus® is one of the most powerful frameworks for process simulation, design, optimization, sensitivity and economic analyses that allows great flexibility compared with other process simulator. It is successfully applied in many applications involving thermo-chemical conversion of biomass, coal and MSW (Haydary 2018). Aspen Plus allows solving the material and energy balances to determine stream compositions, energy flows and physical properties among other parameters. In contrast with Aspen Plus, for which a certain level of knowledge about the interface is required, Excel sheets in many cases are preferred among engineers. The main advantage of Excel is that the calculation sheets can be customized by the user making easier the user-tool interaction. It is very useful for carrying out preliminary studies based on general data.
The particular case of Cuba (socialist economy), where waste management is subsidized by the government (no gate fee is paid by the citizens) and the electricity prices are lower compared to other Latin and Caribbean countries, makes it suitable as special case to study the development of WTE. The Cuban reality is different to those present in other Latin American and Caribbean cities discussed above. In this regard, the aim of this work was to carry out a techno-economic assessment of a WTE plant in the City of Havana. To reach this goal, two process simulation tools (i.e., Excel and Aspen Plus) were used to accomplish the technical evaluation. All calculations were based on the estimated low heating value (LHV) from the waste composition. Finally, the financial performance was assessed to analyze the feasibility of the project. It should be mentioned that, to the authors’ best knowledge, this first time that WTE technology is considered as a waste treatment in Cuba and particularly in Havana.

2. Results and Discussion

2.1. Composition and Low Heating Value Determination

Waste composition affects not only the physical characteristics of the waste (i.e., density, moisture, and calorific value) but also the way that waste management is carried out. Table 1 shows the elemental composition calculated of the MSW in Havana. Regarding the moisture content, the result is in correspondence with the high level of organics in the gravimetric composition. For low- and middle-income countries such as Cuba, the waste is wetter, reducing the caloric value.
According to Equations (1) and (2), the LHV was about 7.74 MJ kg−1. To the author’s best knowledge, no experimental analyses have been carried out for the determination of the LHV of MSW in Havana, thus it was not possible to validate the obtained result. Nevertheless, this value was in the range of 4.5–10 MJ⋅kg−1 obtained for moisture contents from 37% to 60% (Liu et al. 1996; Nordi et al. 2017). Compared with other Latin American countries, the obtained value of LHV was the lowest one. This means that it is not possible to burn the waste without auxiliary fuel. However, it is possible to develop feasible WtE projects with LHV in the range of 5–7 MJ⋅kg−1 (Psomopoulos and Themelis 2014; Kalogirou 2017).

2.2. Excel Model Validation

The Excel model applied in this work has been tested with data from many real plants, showing good fitting between the plant parameters and the model outputs (Kalogirou 2017). The validity of previous results obtained from the Excel model has been recognized by waste-to-energy industry experts worldwide (Earth Engineering Center 2018). Despite this, a validation procedure was carried out to test the accuracy of the model. Data from Nordi et al. (2017) were used for this purpose. Figure 3 shows the comparison between the Excel model and the model applied by Nordi et al. Results from the Excel model are in agreement with those obtained by Nordi et al. For the thermodynamic variables, a relative error less than 10% was obtained for all variables, showing a high level of accuracy.
Economic analysis was also performed during the validation process. Table 2 shows the results for the main parameters considered. In Table 2, the electricity price is the one that makes equal to zero the net present value, following the same method as Nordi et al. As can be seen, differences between the two models were less than 10%. Based on the technical and economic results, the validity of the model was accepted.

2.3. Thermodynamic Evaluation

Based on the Excel and Aspen Plus models the technical evaluation of a WTE plant in the city of Havana was carried out. For this, a plant capacity of 400,000 tons of waste per year was considered. After having validated the Excel model, it was considered as baseline for technical analysis as well as to validate the results from the Aspen Plus model. Table 3 shows the results from the main outputs in both models.
Regarding the quality of the results from the Aspen Plus model, these can be classified as medium quantitative accuracy (within ±30%). Nevertheless, the simulations could be considered as accurate (Batstone and Keller 2003). The highest difference between the models corresponded to the gross electricity generated. One of the reasons for this behavior is because in the Aspen model the electricity is calculated from the heat content in the flue gases at the exit of the combustion chamber. On the other hand, the subroutine in the Excel model is based on the LHV of the waste and typical efficiency values. In regard to the net electrical efficiency, common values are in the range from 18% to 26% (Gohlke 2009; Friege and Fendel 2011). Based on the results presented above, it can be concluded that the Excel and Aspen Plus models can predict the performance of the plant with a high level of accuracy.
One important parameter is the amount of useful energy (i.e., electrical) that can be obtained per ton of processed wastes. This value can vary from one country or region to another, being less than 280 kWh⋅twaste−1 in China and between 500 kWh⋅twaste−1 and 650 kWh⋅twaste−1 in Europe (Kalogirou 2017). From the results in Table 3, it can be concluded that values predicted from both models were consistent with those obtained for European plants, where the LHV is closer to the one calculated for the city of Havana.
Once the electricity generation was calculated, it was possible to estimate the percentage of the electrical demand in Havana that can be supplied by the WTE plant. According to values reported by the National Electrical Union in Cuba, the electricity consumed in 2016 in the city of Havana was 3626.5 GWh (ONEI 2017). This means that it would be possible to cover ~6% of this demand by mean of WTE (incineration) technology. Waste-to-energy can be considered as a renewable energy source considering that more than 50% of the waste is organic matter. In this regard, it can contribute to obtaining 24% renewables in the energy mix in Cuba by 2030 stated by the government in the Guidelines of the Economic and Social Policy of the Party and the Revolution (Suarez et al. 2016).
The R1 indicator was above the 0.65 threshold in both models considered for energy recovery according to the Directive 2008/98/EC (European Commission 2008), moving-up the WTE plant in Havana in the waste hierarchy from a disposal to an energy-recovery method. Even though the R1 criterion is only applied to European countries, it should be pointed that it helps assist WTE plants to get legal status. This is especially important in places where the specifics of the WTE technologies are not fully understood by the decision makers (Vakalis et al. 2018).

2.4. Environmental Impact

Capital importance should be given to the environmental impact of the waste-to-energy plant. It should be mentioned that, in both models, state-of-the-art gas cleaning systems are considered for estimate the removal efficiencies. In Table 4, the results obtained in both models as well the limits for pollutant emissions in the European countries are shown. According to both models, the plant can meet the environmental requirements regarding the air emissions. For the particular case of the Excel model, the results are expressed as a final stream. The difference in all cases was 10%, which can be considered acceptable for the objective of the model.
Regarding the Aspen model, it was possible to determine both the raw gas and the cleaned streams. In Table 4, it can be seen that values predicted for the model are in agreement with data from real plants as well as the limits for emissions. In regard to halides (i.e., HCl and HF) and Hg, the model could not predict their composition in the raw gas because no data are reported in the waste characterization. Unlike the Excel model, which is based on the amount of waste, the Aspen model depends of waste composition (i.e., proximate and ultimate analyses), being necessary an accurate characterization for reaching better results. Regarding dioxins, it is known that almost the entire amount fed along the waste is destroyed in the combustion process, being newly synthetized in the boiler (Vehlow 2013; Hunsinger et al. 2002). Due to the complexity of the chemical synthesis of dioxins, most Aspen models developed for waste-to-energy simulation do not consider this process (Ding et al. 2018; Jannelli and Minutillo 2007; Cimini et al. 2005).

2.5. Financial Assessment

Regarding the revenues, about 60% of the total corresponded to the electricity sales and 37.5% to the gate fee. Performance indicators like the internal rate of return (IRR), net present value (NPV) and the payback period (PBP) showed the capacity of the project to pay the initial investment. The IRR was almost twice the value of the debt interest rate and the PBP was less than half of the life time of the plant. The rest of the economic results are presented in Table 5.

Sensitivity Analyses

To study the financial performance of the proposed waste-to-energy project under different scenarios (i.e., lower/higher LHV, operation and capital costs, and scale), it was useful to carry out sensitivity analyses. This is a way to consider the uncertainty during the project evaluation. Figure 4 shows the results from two sensitivity analyses carried out in the present work. In Figure 4a, the LHV of the MSW was varied considering the most common range of operation as well as the plant capacity. The figure presents the effect of the economy of scale: the lower is the LHV, the larger should the plant capacity be for reaching profits. In the prefeasibility stage, Figure 4a could be a useful tool to consider in advance of more detailed calculations.
For the particular case of Cuba, if other provinces were considered for developing a WTE plant, from the results in Figure 4a, it is clear that at least 300,000 tons of waste per year should be fed to the plant. Nowadays, only the city of Havana generates this amount of waste. This does not mean that no small projects can be developed in cities such as Holguin, which generates around one half of the amount in Havana according to data reported in (ONEI 2018). In this case, different alternatives to increase the LHV (e.g., drying and sorting) could be considered. However, the consequent raise in the capital and operational costs must be considered.
As presented in Section 3.1, changes in the amount of MSW and its composition over the time should be considered. Assuming a reduction of ~13% in the population of the City of Havana toward 2035 (ONE 2011), the amount of waste generated would be ~473,368 tons per year. For this amount of waste and the same LHV calculated in Section 2.1, Figure 4a shows that the NPV will remain positive, even for a capacity of 300,000 tons of waste per year. On the other hand, Figure 4a could be used to estimate the effect of composition changes over the time by mean of variation in LHV, as discussed in Section 3.1. From the results in Figure 4a, the LHV that makes the NPV zero is around 6.5 MJ⋅kg−1, representing a reduction of 16% with respect to the LHV obtained in Section 2.1. Even though considerable changes in waste composition in the city are not expected in the future, it is mandatory to carry out on-site data collection to improve the accuracy of the predictions.
In Figure 4b, different scenarios for both gate and electricity fees are presented. According to the results, the proposed investment was more sensible to the electricity fee (higher slope) than the gate fee. For a gate fee reduction of 30% with respect to the base conditions, the new value was lower than the average range of 13–20 USD⋅t−1 for Latin American countries (Psomopoulos and Themelis 2014). Nevertheless, the project was still profitable despite a reduction in the NPV of 67%. If a gate fee of 13 USD⋅t−1 as well as the generation rate of waste per inhabitant in Havana were considered, the cost of gate fee yearly per person would be around 3.3 USD. Considering the exchange rate from USD to CUP (Peso Cubano), it represents ~82 CUP per year. The average wage in the city of Havana is 848 CUP monthly (ONEI 2018), thus less than 1% of this value should be paid by residents as waste management charge. This should be considered during social consulting if policies are going to be promoted to increase charges for waste disposition.
On the other hand, particular attention should be given to electricity price. In Cuba, most of the electricity produced is subsidized by the government, making the Cuban tariffs inexpensive compared with other Caribbean countries. The key point to understand is the low average salaries of the city residents (~34 USD) (ONEI 2018). For the base conditions assumed in this work, Havana residents consuming 65 kWh per month would pay 39 USD, which is more than the average monthly salary. This makes the project infeasible unless part of the electricity price was paid by the government and the rest by the citizens. Even in the worst scenario for electricity sales in Figure 4b, the price would remain high for Havana residents, becoming an obstacle to overcome for investors and policy makers.
The only way to make the price of electricity cheaper is increasing the gate fee assumed in the project. In such way, an increase of 50% of the gate fee and a reduction of the same amount for electricity fee were considered as a new case. Results show an NPV of 24,435,880 USD with an IRR of 12.4%. With this new scenario, the charge for waste management was raised up to 2% of the monthly salary. However, significant reductions of expenses for Havana residents were achieved in comparison to the base case.

3. Materials and Methods

3.1. Determination of the Generation Rate, Composition and Low Heating Value

Figure 5 shows the methodology applied in this work to carry out the technical and economic analysis of a WTE plant in Havana. Two different tools were used in this study (i.e., Microsoft Excel® and Aspen Plus®). The first step was the determination of the generation rate and composition of the MSW in the City of Havana. According to the data reported by the Japan International Cooperation Agency (JICA), the generation rate per inhabitant is ~0.7 kg⋅day−1 (NIPPON KOEI 2007). In 2017, the City of Havana population was 2,129,553 according to the National Statistics and Information Office (i.e., ONEI in Spanish) of Cuba (ONEI 2018), resulting in ~1490 t⋅day−1 of wastes (~544,100 t⋅year−1) assuming same generation rate determined by JICA.
Figure 6 shows the gravimetric characterization of MSW in the City of Havana assumed in the present work. Values in Figure 6 are the same reported by JICA after a material flows methodology was applied to characterize the MSW of the city (NIPPON KOEI 2007). According to Tchobanoglous and Kreith (2002), the material flows methodology provides data in long-term trends and is based on annual basis. Thus, it was considered that data provided by JICA were suitable for carry out the prefeasibility study of a WTE plant in the City of Havana. Administrative barriers as well as the cost to carry out this kind of studies have made an update of the gravimetric characterization of MSW with a more current time cut impossible.
Many factors can affect the amount of MSW generated as well as its gravimetric composition (e.g., changes in population, income level, and economic activities) (Tchobanoglous and Kreith 2002). These factors should be considered carefully when new waste management strategies are under study, with remarkable importance for the case of WTE technology. In the following, a few comments about how they could impact on the generation rate and composition of MSW in the City of Havana over the time are presented:
  • Changes in population: Contrary to the global trend, the population in the City of Havana will decrease between 10% and 13% toward 2035 (ONE 2011). It is clear that the lower is the population, the lower is the MSW generation (fewer people implies less consumption and less waste). To present a reliable, stable and confident project to investors, it is mandatory to ensure a minimum flow (operational capacity) of waste over the time (Kalogirou 2017).
  • Income level: It is related with the consumption patterns and therefore can cause variations in the waste composition. Cuba has a low gross domestic product (GDP) and consequently low personal expenditure rate. Even though the estimations show a slight increase in the GDP, the real impact on the Cuban population is not visible yet. For this, changes in waste composition are not expected in the long-term due to changes in income levels.
  • Economic activities: Toward the future, two main activities can vary significantly. Estimations show an increase in the touristic sector causing a raise in the waste generation and probably in its composition. The second one is the private sector, mainly as a source of service jobs with a low development in the manufacturing field. Changes in generation patterns of papers, plastics and food wastes can be expected.
From the comments above, it can be concluded that a high deviation in waste generation and composition in the present with respect to values reported by JICA in 2007 is not expected. One of the parameters that can be greatly affected by changes in composition is the LHV of the waste. The consideration of LHV changes is a way to measure effect of waste composition in a long-term. For this, in the present work, changes in generation rates and LHV were considered through sensitivity analyses.
Once the amount of waste generated and its composition were established, the next step in the methodology was the calculation of the elemental composition. Based on the gravimetric characterization, the elemental composition (ultimate analysis) was estimated according to data reported in literature (Tchobanoglous and Kreith 2002; Tchobanoglous et al. 1993). To complete the proximate analysis, the volatile matter content was calculated according to (Tchobanoglous et al. 1993). Finally, the fixed carbon was calculated as the difference between 100 and the sum of the moisture volatile matter and ash contents.
The low heating value (LHV) is a crucial factor in the determination of the feasibility of waste-to-energy projects. The calculation of this parameter is important for estimating the energetic potential of MSW once the characterization is done. In the present work both the high heating value (HHV) and the LHV were calculated according to Equations (1) and (2) (Kathiravale et al. 2003). In Equations (1) and (2), HHV and LHV are obtained in kJkgwaste−1 on wet basis. Values of %C, %H, %N, %S represent the elemental composition in the ultimate analysis. The moisture content is expressed as %W.
H H V = ( 1 % W 100 ) × [ 337.3 ( % C ) + 1442.3 ( % H % O 8 ) 93.04 ( % N ) ] + 23.26 ( % S )
L H V = H H V 24.4 ( % W + 9 % H )

3.2. Excel Model

The calculated LHV represents an input to the thermodynamic model implemented in Microsoft Excel, called hereafter WTE tool. The model represents a state-of-the-art multiparameter tool for the prefeasibility studies of waste-to-energy projects. The WTE tool considers multiple parameters such as the composition of the MSW, lower heating value, gross domestic product (GDP), level of development by countries and climate conditions. It should be mentioned that it is possible to consider the LHV as an output in the model if the gravimetric characterization is known.
Regarding the thermodynamic characteristics, the WTE tool considers different parameters (i.e., steam parameters, efficiency indexes, the combined heat and power, and electricity production) (Kalogirou 2017). The determination of the so-called R1 criterion is also included. The formula for its calculation is yearly basis and depends on the produced electricity and heat as equivalent energy, the energy in the waste, fossil fuel consumed and other auxiliary energy streams (European Commission 2008). Calculations of gross electricity production as well as net electrical efficiency were based on Equations (3)–(5). The net electricity was calculated as the difference between the gross electricity and the plant self-consumption. The model has been validated in different scenarios in real WTE plants. Table 6 shows the main inputs to the WTE tool considered in this study.
T h energy = L H V × m waste
G elect = ( T h energy + Fuel ) × η boiler × η turbine × η genertor × δ
η elect = Net   electricity T h energy + Fuel × 100
where Thenergy is the theoretical energy content of the waste (MJ); mwaste is the mass of waste fed to the plant (kg); Gelect is the gross electricity production (GWh); ηi is the efficiency of the boiler, the turbine of the generator; ηelect is the net electrical efficiency; Fuel is the energy content of the additional fuel (MJ); and δ is the unit conversion factor.
Furthermore, the WTE tool provides an estimation of the environmental impact due to the operation of a WTE plant. For waste-to-energy projects, this is a key factor to be considered, mainly due to the social perception and acceptance of the technology (Kalogirou 2017). Emission factors shown in Table 6 were determined considering the flue gases volumetric flow and the emission limits established by the European Union (European Commission 2008). Typical range for stack gases volumetric flow in WTE plants is 5500–7000 Nm3⋅twaste−1 (Johnke 1999).

3.3. Aspen Plus Model

Figure 7 shows the flowsheet of the Aspen Plus model implemented in the present work. The main four stages of the MSW incineration (i.e., combustion, heat recovery, flue gas treatment, and power generation) are highlighted in the figure. The first step for the model implementation in Aspen Plus® v9.0 (Aspen Technology Inc. 2016) is the definition of the components and the determination of the physiscal properties. In this case, all components from the ultimate analysis as well as the products obtained during the combustion process were considered as conventional (they participate in phase equilibrium calculations). Nonconventional solid components are materials that are not pure chemical species and do not participate in equilibrium phase calculations, such as MSW. They are characterized in terms of empirical factors referred to as component attributes (i.e., ultanal, proxanal, and sulfanal) from the ultimate, proximate and sulfanate analyses. Two nonconventional components (i.e., MSW and Ash) were created in the present work.
The property method chosen for properties estimation was the Ideal (Ideal gas and Raoult’s Law) since the process involves the conventional components such as H2O, N2, O2, and CO2. Ideal property method yields good results for modeling systems at high temperature and low pressures, such as standard combustion processes (Elyas and Foo 2017). For building the simulation flowsheet, the reactor models from the model palette in Aspen were selected for the simulation of the combustion chamber. The decomposition processes of MSW in its main constituents (i.e., ultimate analysis) and the combustion process were simulated using RYield and RGibbs reactors, respectively. The main products considered in the combustion process were H2O, N2, NO, NO2, O2, H2, C (solid), CO, CO2, Cl2, HCl, S, SO2, and SO3 (Ding et al. 2018). In RGibbs reactor model, a minimum in the Gibbs free energy is considered once the equilibrium is established in the reacting system. This allows RGibbs reactor to predict the product composition even when the reaction stoichiometry is unknown and equilibrium conditions are assumed. RGibbs reactor has been successfully applied in combustion and gasification processes of nonconventional solids like biomass, coal and MSW (Haydary 2018). As shown in Figure 7, Stream 5 was separated into two substreams by mean of Module B4 (substream splitter) to obtained the raw gas (mixed stream) and the ash stream (nonconventional stream).
An excess air equal to 100% was assumed; the same value has been adopted in previous studies (Chang and Huang 2001; Nordi et al. 2017). To keep the temperature of the combustion chamber higher than 850 °C, an additional stream of 1 kg of fuel per ton of waste was fed to the RGibbs reactor; the same value was assumed in the Excel model (Kalogirou 2017). The heat recovery system for steam generation was simulated using two Heater modules, one of them as a heater (i.e., hot side in the boiler) and the other one as a cooler (i.e., cold site in the boiler). The steam parameters (i.e., 400 °C and 4 MPa) were adopted from typical values of WTE plants (Kalogirou 2017; Ding et al. 2018; Athanasiou et al. 2015). The temperature of exhausted gases was settled as 180 °C. The steam produced was fed to a single steam turbine module, with a discharge pressure of 8 kPa. The isentropic and mechanical efficiencies were assumed as 85% and 98% respectively.
The simulation of the flue gas cleaning system was carried out in Block Calculator. Data from the exhausted gases stream were imported as input variable to the model programmed in Block Calculator. The calculation subroutine was implemented in FORTRAN and was based on correlation factors between emissions and the amount of waste fed to the plant (Kalogirou 2017).

3.4. Economic Evaluation

After the thermodynamic evaluation (technical analysis) of the plant was done, the economic performance of the project was considered. The economic model allowed determining the return on investment based on the input and output data obtained in the previous steps. Two sources of revenues were considered in the model: gate fee (USD⋅t−1) and energy sale (USD⋅kWh−1). On the other hand, operational expenses (i.e., labor, maintenance, and consumables) and capital expenses were determined. Once the annual revenues and operating expenses were determined, the earnings before interest, taxes, depreciation, and amortization were calculated. By subtracting all other financial and tax considerations (depreciation, interest payments, taxes, etc.), which were out of scope of this study, net profit was calculated. From the net profit value, the free cash flow to equity was calculated (Kalogirou 2017). Table 7 shows the main parameters that were considered in the financial model. Data in Table 7 were based on the fact that Cuba is an underdeveloped country.

4. Conclusions

Considering the necessity to develop a better solid waste management system in the City of Havana, a preliminary study of waste-to-energy was evaluated. A step-wise methodology consisting in the determination of the waste generation rate, composition and low heating value as first stages was applied. The estimated low heating value was 7.74 MJ⋅kg−1, which is higher than the minimum value required for a feasible waste to energy plant. Following, two different tools (i.e., Excel and Aspen Plus) were used to develop the technical and economic study. Results from the Excel model showed that it is possible to produce 227.1 GWh yearly with a net electrical efficiency of 22.3% considering a steam cycle producing only electricity, being in agreement with real plants with the same capacity. Differences between the models were not higher than 13%, which can be considered as acceptable according to the objective of the study, being possible to use them to develop other prefeasibility studies in the future. The R1 factor was higher than 0.65, showing that a waste-to-energy plant in Havana can be considered as an energy recovery method. Additionally, the percentage of the electrical demand in the city of Havana that could be satisfied by the proposed project was determined, yielding 6% of the total demand.
The financial performance of the project showed that waste-to-energy scenario seems to be feasible for the case of Havana. Dynamic indicators were taken into consideration for the assessment and the main results show that it is possible to recover the investment in less than half the project’s life time. Results from the sensitivity analyses show the effect of the economy of scale when low heating value was changed. This takes on special importance for the particular case of Cuba if other cities would be considered for waste-to-energy projects. On the other hand, the proposed project was more sensible to the electricity fee than to the gate fee. Considering the impact of electricity prices on monthly salaries of Cuban people, the best scenario could be the one increasing the gate fee by 50% and reducing the electricity prices the same amount with respect to the base conditions of this work.

Author Contributions

Conceptualization, J.L.L. and E.K.; Data curation, E.K.; Formal analysis, J.L.L. and E.K.; Investigation, J.L.L. and E.K.; Methodology, J.L.L. and E.K.; Software, J.L.L. and E.K.; Supervision, E.K.; Validation, J.L.L. and E.K.; Visualization, J.L.L.; Writing—original draft, J.L.L. and E.K.; Writing—review & editing, J.L.L. and E.K.

Funding

This research received no external funding. The APC was funded by the Knowledge Unlatched initiative.

Conflicts of Interest

The authors declare no conflict of interest.

References

  1. Aspen Technology Inc. 2016. Aspen Plus Version 9.0. In User Guide. Bedford: Aspen Technology Inc. [Google Scholar]
  2. Athanasiou, Costas J., Angeelos D. Tsalkidis, Efstratios Kalogirou, and Evangelos A. Voudrias. 2015. Feasibility analysis of municipal solid waste mass burning in the Region of East Macedonia–Thrace in Greece. Waste Management & Research 33: 561–69. [Google Scholar] [CrossRef]
  3. Batstone, Damien J., and Jurg Keller. 2003. Industrial applications of the IWA anaerobic digestion model No. 1 (ADM1). Water Science and Technology 47: 199–206. [Google Scholar] [CrossRef] [PubMed]
  4. Chang, Moo Been, and Chien Kun Huang. 2001. Characteristics of energy flow in municipal solid waste incinerator. Journal of Environmental Engineering 127: 78–81. [Google Scholar] [CrossRef]
  5. Cimini, Silvano, Marina Prisciandaro, and Diego Barba. 2005. Simulation of a waste incineration process with flue-gas cleaning and heat recovery sections using Aspen Plus. Waste Management 25: 171–75. [Google Scholar] [CrossRef]
  6. Ding, Guangchao, Boshu He, Yang Cao, Chaojun Wang, Liangbin Su, Zhipeng Duan, Jingge Song, Wenxiao Tong, and Xuezheng Li. 2018. Process simulation and optimization of municipal solid waste fired power plant with oxygen/carbon dioxide combustion for near zero carbon dioxide emission. Energy Conversion and Management 157: 157–68. [Google Scholar] [CrossRef]
  7. Earth Engineering Center. 2018. WTERT 2018 Meeting. Available online: http://www.seas.columbia.edu/earth/wtert/index.html (accessed on 21 February 2019).
  8. Elyas, Rafil, and Dominic Chwan Yee Foo. 2017. Introduction to Process Simulation. In Chemical Engineering Process Simulation. Edited by Dominic Chwan Yee Foo. Cambridge: Elsevier, pp. 1–5. [Google Scholar]
  9. Espinosa Lloréns, Ma del C., Matilde López Torres, Haydee Álvarez, Alexis Pellón Arrechea, Jorge Alejandro García, Rigoberto Escobedo Acosta, Oneida Correa Senciales, Xiomara Rodríguez Petit, Yadiana León, and Yamilé Álvarez Llaguno. 2005. Characterization of Municipal Solid Waste in the City of Havana, an approach for the solution of an environmental problem. Revista CENIC. Ciencias Biológicas 36: 1–9. (In Spanish). [Google Scholar]
  10. Espinosa Lloréns, María del Carmen, Matilde López Torres, Alexis Pellón Arrechea, Rogelio Mayarí Navarro, and Alejandro Fernández Colomina. 2007. The organic fraction of municipal solid wastes as a potential source of biogas production. Revista CENIC. Ciencias Biológicas 38: 33–36. (In Spanish). [Google Scholar]
  11. European Commission. 2008. Directive 2008/98/EC of the European Parliament and of the Council of 19 November 2008 on waste. Official Journal of the European Union L 312: 22. [Google Scholar]
  12. Friege, Henning, and Ansgar Fendel. 2011. Competition of different methods for recovering energy from waste. Waste Management & Research 29: S30–S38. [Google Scholar] [CrossRef]
  13. Gohlke, Oliver. 2009. Efficiency of energy recovery from municipal solid waste and the resultant effect on the greenhouse gas balance. Waste Management & Research 27: 894–906. [Google Scholar] [CrossRef]
  14. Gohlke, Oliver, and Johannes Martin. 2007. Drivers for innovation in waste-to-energy technology. Waste Management & Research 25: 214–19. [Google Scholar] [CrossRef]
  15. Haydary, Juma. 2018. Chemical Process Design and Simulation: Aspen Plus and Aspen Hysys Applications, 1st ed. Hoboken: Wiley-AIChE, pp. 101–10. [Google Scholar]
  16. Hoornweg, Daniel, and Perinaz Bhada-Tata. 2012. What a waste: A global review of solid waste management. In Urban Development Series Knowledge Papers. Edited by World Bank. Washington: World Bank, pp. 8–12. [Google Scholar]
  17. Hunsinger, Hans, K. Jay, and Juergen Vehlow. 2002. Formation and destruction of PCDD/F inside a grate furnace. Chemosphere 46: 1263–72. [Google Scholar] [CrossRef]
  18. IRENA. 2018. Renewable Capacity Statistics 2018. Edited by International Renewable Energy Agency. Abu Dhabi: IRENA. [Google Scholar]
  19. Jannelli, Elio, and M. Minutillo. 2007. Simulation of the flue gas cleaning system of an RDF incineration power plant. Waste Management 27: 684–90. [Google Scholar] [CrossRef] [PubMed]
  20. Johnke, Bernt. 1999. Emissions from waste incineration. Background paper for Expert meeting on good practice in inventory preparation: Emissions from waste. IPCC/OECD/IEA National Greenhouse Gas Inventories Programme. Unpublished work. [Google Scholar]
  21. Kalogirou, Efstratios N. 2017. Waste-to-Energy Technologies and Global Applications, 1st ed. Boca Raton: CRC Press. [Google Scholar]
  22. Kathiravale, Sivapalan, Muhd Noor Muhd Yunus, Kamaruzzaman Sopian, Abd Halim Samsuddin, and R. A. Rahman. 2003. Modeling the heating value of Municipal Solid Waste. Fuel 82: 1119–25. [Google Scholar] [CrossRef]
  23. Kumar, Atul, and Sukha Ranjan Samadder. 2017. A review on technological options of waste to energy for effective management of municipal solid waste. Waste Management 69: 407–22. [Google Scholar] [CrossRef]
  24. Liu, Juin-I., Rajendra D. Paode, and Thomas M. Holsen. 1996. Modeling the energy content of municipal solid waste using multiple regression analysis. Journal of the Air & Waste Management Association 46: 650–56. [Google Scholar] [CrossRef]
  25. López Torres, Matilde, María del Carmen Espinosa Lloréns, and Jesús Delgado. 2004. Technological development in the integrated management of solid wastes in Cuba. Revista CENIC. Ciencias Biológicas 35: 59–61. (In Spanish). [Google Scholar]
  26. NIPPON KOEI, CO, LTD. 2007. Study of the Integral Management Plan for Urban Solid Waste in the City of Havana. Havana: Japan International Cooperation Agency. (In Spanish) [Google Scholar]
  27. Nixon, Jonathan Daniel, Daniel G. Wright, Prasanta Kumar Dey, Sadhan Kumar Ghosh, and Philip Andrew Davies. 2013. A comparative assessment of waste incinerators in the UK. Waste Management 33: 2234–44. [Google Scholar] [CrossRef] [PubMed]
  28. Nordi, Guilherme Henrique, Reynaldo Palacios-Bereche, Antonio Garrido Gallego, and Silvia Azucena Nebra. 2017. Electricity production from municipal solid waste in Brazil. Waste Management & Research 35: 709–20. [Google Scholar] [CrossRef]
  29. ONE. 2011. Proyections of the Cuban Population 2011–2035. Edited by the National Statistical Office. Havana: National Statistical Office. (In Spanish) [Google Scholar]
  30. ONEI. 2017. Electricity in Cuba. Selected Indicators. Edited by the National Statistics and Information Office. Havana: National Statistics and Information Office. (In Spanish) [Google Scholar]
  31. ONEI. 2018. Statistical Yearbook of Cuba 2017. Edited by the National Statistics and Information Office. Havana: National Statistics and Information Office. (In Spanish) [Google Scholar]
  32. Psomopoulos, Constantinos S., and Nickolas J. Themelis. 2014. A guidebook for sustainable waste management in Latin America. Waste management. Paper presented at International Resource Recovery Congress Waste-to-Energy, Vienna, Austria, September 18–19; pp. 8–9. [Google Scholar]
  33. Psomopoulos, Constantinos S., A. Bourka, and Nickolas J. Themelis. 2009. Waste-to-energy: A review of the status and benefits in USA. Waste Management 29: 1718–24. [Google Scholar] [CrossRef]
  34. Rousta, Kamran, Mohammad J. Taherzadeh, and Tobias Richards. 2015. An Overview of Solid Waste Management toward Zero Landfill a Swedish Model. In Resource Recovery to Approach Zero Municipal Waste. Edited by Mohammad J. Taherzadeh and Tobias Richards. Boca Raton: CRC Press, pp. 1–20. [Google Scholar]
  35. Suarez, Jose A., Pedro A. Beaton, Ronoldys Faxas, and Carlos A. Luengo. 2016. The state and prospects of renewable energy in Cuba. Energy Sources, Part B: Economics, Planning, and Policy 11: 111–17. [Google Scholar] [CrossRef]
  36. Tchobanoglous, George, and Frank Kreith. 2002. Handbook of Solid Waste Management, 2nd ed. New York: McGraw-Hill. [Google Scholar]
  37. Tchobanoglous, George, Hilary Theisen, Samuel A. Vigil, and Victor M. Alaniz. 1993. Integrated Solid Waste Management: Engineering Principles and Management Issues. New York: McGraw-Hill, vol. 949. [Google Scholar]
  38. Themelis, Nickolas J., María E. Díaz Barriga, Paula Estevez, and María G. Velasco. 2013. Guidebook for the Application of Waste-to-Energy Technologies in Latin America and the Caribbean. Edited by EEC/IDB WTE Guidebook. New York: Earth Engineering Center of Columbia University. [Google Scholar]
  39. Vakalis, Stergios, Konstantinos Moustakas, and Maria Loizidou. 2018. Introduction of the trapezoidal thermodynamic technique method for measuring and mapping the efficiency of waste-to-energy plants: A potential replacement to the R1 formula. Waste Management & Research 36: 810–17. [Google Scholar] [CrossRef]
  40. Vargas, Gabriela, and Fabián Espinoza. 2013. Potential of waste-to-energy implementation in Ecuador. International Journal of Energy Engineering 3: 279–86. [Google Scholar] [CrossRef]
  41. Vehlow, J. 2013. Transformation of waste combustion facilities from major polluters to pollution sinks. In Waste to Energy Conversion Technology. Edited by Naomi B. Klinghoffer and Marco J. Castaldi. Cambridge: Woodhead Publishing, pp. 195–99. [Google Scholar]
  42. Vehlow, J. 2015. Air pollution control systems in WtE units: An overview. Waste Management 37: 58–74. [Google Scholar] [CrossRef] [PubMed]
  43. Wilson, David Curran, Ljiljana Rodic, Prasad Modak, Reka Soos, A. Carpintero, K. Velis, Mona Iyer, and Otto Simonett. 2015. Global Waste Management Outlook. Nairobi: UNEP. [Google Scholar]
Figure 1. Hierarchy for waste management strategy.
Socsci 08 00119 g001
Figure 2. Disciplines and barriers considered for WTE in low- and middle-income countries.
Socsci 08 00119 g002
Figure 3. Outputs comparison between the Excel model and the model applied by Nordi et al. (2017).
Socsci 08 00119 g003
Figure 4. Results from the sensitivity analyses: (a) effect of the LHV on the NPV of the project; and (b) impact of gate fee and electricity prices variations on the NPV.
Socsci 08 00119 g004aSocsci 08 00119 g004b
Figure 5. Methodology applied to evaluate a waste-to-energy plant in Havana.
Socsci 08 00119 g005
Figure 6. Gravimetric composition of MSW in Havana.
Socsci 08 00119 g006
Figure 7. Flowsheet of the Aspen Plus model for the prefeasibility study of WTE plant in the City of Havana.
Socsci 08 00119 g007
Table 1. Proximate and ultimate analyses composition of MSW in Havana.
Proximate Analysis 1Composition (%)Ultimate Analysis 2Composition (%)
Moisture46.54Carbon 44.43
Volatile matter69.10Hydrogen5.73
Ash 16.52Oxygen31.5
Fixed carbon2.4Nitrogen1.6
Sulfur0.22
Ash16.52
1 Dry basis except for moisture; 2 dry basis.
Table 2. Main parameter considered for economic validation.
ParametersPresent WorkNordi et al. 2017Relative Error (%)
Capex [USD⋅t−1]6806209.67
Opex [USD⋅t−1]23.422.92.18
Electricity price [USD⋅MWh−1]10194.37.10
Table 3. Thermodynamic parameters from Excel and Aspen Plus models.
ParametersExcelAspen PlusDifference (%)
Gross electricity (GWh) 227.1255.912.69
Electricity to the grid (GWh)193.1207.37.35
Electricity per ton of waste (kWh/t) 567.8639.812.69
Net electrical efficiency (%)22.321.593.18
R1 factor (dimensionless)0.69710.769910.44
Table 4. Emissions for a large-scale waste-to-energy plant in Havana.
EmissionsRaw Gas 1EU 2,3ExcelAspen Plus
Raw Cleaned
NOx (mgNm−3)200–400200190264.579.4
SO2 (mgNm−3)150–500504523269.6
CO (mgNm−3)<10–3050-<1<1
PM (mgNm−3)103–500010910.610.6
HCl (mgNm−3)500–2000109-10.6
HF (mgNm−3)1–1010.9-1.1
Dioxins (ngNm−3)1–1010−10.09-0.11
Hg (mgNm−3)0.1–0.50.050.045-0.06
1Vehlow (2015), 2 European limits, 3 273 K, 101.3 kPa, 11 vol % O2.
Table 5. Financial performance of the waste-to-energy project.
ParametersValue
Operational expenses [USD⋅year−1]7,882,000
Capital expenses [USD]126,000,000
Gate fee [USD⋅year−1]7,200,000
Electricity sale [USD⋅year−1]11,583,224
Income from metals [USD⋅year−1]400,000
IRR [%]11.87
NPV [USD]35,483,853
PBP [years]11.4
Table 6. Inputs to the WTE tool.
InputsValue
Waste amount (t)400,000
Waste composition 1-
Energy outputElectricity only
Steam temperature (°C)400
Steam pressure (Mpa)4
Boiler efficiency (%)82
Fuel supplied (kg⋅twaste−1)1
Emissions factors
Dioxins (mg⋅twaste−1)0.0007
Particles (g⋅twaste−1)70
HCl (g⋅twaste−1)70
HF (g⋅twaste−1)7
SO2 (g⋅twaste−1)350
NOx (g⋅twaste−1)1400
Hg (g⋅twaste−1)0.35
Metals (g⋅twaste−1)3.5
1 See Figure 5.
Table 7. Parameters considered in the financial model.
ParametersValue (€t−1)ParametersValue
Operational expenses1 Gate fee (USD⋅t−1)18
Labor cost2.3Electricity price (USD⋅kWh−1)0.60
Consumables3Loan life (years)25
Residual treatment5.5Debt interest (%)6
Others1.1
Capital expenses315
1 Maintenance costs: 2.2% of capital expenses.

