1. Introduction
Population growth in large urban centers, as well as the shift to a modern consumer lifestyle, has resulted in the production of large quantities of MSW. Concentration of waste is a major issue in such societies and the proper management of this is imperative and necessary (
Psomopoulos and Themelis 2014;
DEFRA 2014).
The World Bank has estimated that 2.01 billion tons of MSW are generated annually and this figure is expected to reach 3.40 billion tons by 2050 (
World Bank 2018). Taking into consideration the previous decades, it is assumed that the Gross Domestic Product (GDP) is strictly linked to waste generation. Municipal solid waste among countries of the European Union has increased appreciably over the years, and specifically for the time period from 1995 to 2008 there was an increase in the ratio of MSW produced per capita, from 474 kg to 521 kg as GDP was also in growth (
EUROSTAT 2014). However, in the years following this, this trend has changed. In some of the areas under investigation, such as Scandinavia, GPD increase and increase of MSW seems to be disconnected (
EUROSTAT 2019c). This increase of municipal solid wastes, in conjunction with increased urbanization, has lead the European Union to set Directive 2008/98/EC which delineates a Waste Management Framework (
Gamberini et al. 2013). Thus, a four-step Waste Management Hierarchy is adopted, giving priority to the prevention and reduction of the waste followed by recycling and composting, energy recovery and finally treatment and disposal on the available sanitary landfills. This management hierarchy must be introduced in each member state’s national waste management laws. Therefore, composting, increased recycling rates, as well as the reuse of household waste are priorities for Sustainable Waste Management which could also lead to Sustainable Development (
Ezeah and Roberts 2012;
Gamberini et al. 2013). Furthermore, a decreased ratio of MSW generation is observed after the year 2008 when the European Union directive was enacted.
The existence of an ideal waste treatment method cannot be achieved (
Christensen 2011). Any proposed area for the installation of a waste treatment method needs to meet different factors and should be managed in a proper manner for achieving the best results (
Themelis et al. 2013). However, for a proper waste management treatment method in each country, a range of criteria such as environmental, social and economic factors should be addressed.
Several studies have been published in order to find out if any correlation exists between social and economic factors and the production and treatment of MSW.
Giannakitsidou et al. (
2016) showed that there is a correlation between several treatment methods of MSW and the GDP, Human Development Index (HDI) and Social Progress Index (SPI) factors. GDP index is the best of three for use as prediction mean for future quantity of MSW. SPI relates mostly to the adopted technological method, while HDI can be used to design recycling plans. According to
Malinauskaite et al. (
2017), political, economic, environmental, technological and educational factors may affect the selected waste management methods. More precisely, in the case of economic factors, countries with a low GDP rate have adopted landfilling as the main MSW treatment method.
Salim and Hassan (
2009), in their research, discovered a stochastic trend between PPP and relative population growth. However, a literature review revealed that a study conducted taking into consideration the impact of PPP on MSW treatment methods is not available.
PPP is an economic indicator that can be used in order to compare the cost of goods between two different countries. According to Organisation for Economic Cooperation and Development (
OECD 2019), Purchase Power Parity is defined as:
“PPPs are the rates of currency conversion that equalize the purchasing power of different currencies by eliminating the differences in price levels between countries. In their simplest form, PPPs are simply price relatives which show the ratio of the prices in national currencies of the same good or service in different countries.”
This factor indicates the power of money when two or more countries are in comparison. A calculation of PPP can be achieved through the following equation:
where
S defines the exchange rate of currency 1 to currency 2,
P1 represents the cost of goods X in currency 1 and
P2 represents the cost of goods X in currency 2. Generally, it is an exchange rate factor to express the currency power of a country over the currency power of another country. However there are differences between the nominal exchange rate and PPP rate. For instance, GDP per capita in India in 2003 was 1700 USD on nominal exchange rates, however, when based on PPP rates, GDP per capita was 3600 USD. This may have a significant impact on several aspects of company strategy, from wages of employees to the final location of the facility (
Liang 2013). Euro (€) is the official currency of 19 countries out of 28. What should be highlighted is the high value of PPP (see
Table 1) in the countries where Euro (€) is not the official currency (Denmark, Bulgaria, Croatia Czech Republic, Hungary, Poland, Romania, Sweden, UK).
For the needs of the study, PPP average of EU28 has been set as the base and equal to unit (EU28 = 1) so a comparison between countries with regards to the average of EU28, can be easily presented.
The aim of this study is to identify the trend of every country in EU28, regarding the waste management methods that have been adopted for MSW treatment, taking into account a socioeconomic factor such as PPP, population of each country and finally total waste generation. Thus, the main conclusion derived aims to reveal whether these factors may be linked to the final adopted waste management method in each of the countries in EU28. This study examines a ten year time period from 2008 to 2017.
In this work, the European Union of 28 was studied. The European Union of 28 includes countries with high diversity in terms of population and economy growth, as well as waste generation. The social and economic factors that the present work used for the assessment of waste treatment that each country in EU 28 selected are as follows: setting the average of the EU28 as the base and equal to unit (EU28 = 1) population of each country and MSW generated both total and per capita.
The European Union of 28 is an economic and political group which consists of the following countries: Belgium, Bulgaria, Czech Republic, Denmark, Germany, Estonia, Ireland, Greece, Spain, France, Croatia, Italy, Cyprus, Latvia, Lithuania, Luxembourg, Hungary, Malta, The Netherlands, Austria, Poland, Portugal, Romania, Slovenia, Slovakia, Finland, Sweden, and the United Kingdom. The form of EU28 was shaped in 2013 by the addition of Croatia. According to European Statistics (
EUROSTAT 2019a), in 2017 the population of EU28 was almost 512 million. The GDP at current prices was over 15 trillion € while total and per cap generation of MSW was over 209 million tons and 477 kg respectively.
MSW are solid wastes derived from household and commercial businesses and usually collected by public authorities. Nowadays, produced MSW can be treated by various mature technologies. Out of all of them, the most ecofriendly is recycling, leading to an avoidance of overexploiting resources. Moreover, an alternative form of recycling is composting. Organic wastes by households that otherwise would be disposed of as MSW, through aerobic or anaerobic composting (decomposition of organic matters that produce compost rich in nutrients) can be used mostly in the agricultural sector. Furthermore, treating wastes in Waste-to-Energy plants, energy and material recovery (R1) may be achieved. MWS can also be burned in incineration furnaces without energy and recovery materials (D10). Finally, disposal of MSW in sanitary landfills is the last option for waste treatments. All waste treatment methods described above, their appropriate combination and selection may play significant roles in a successful solid waste management system (
Themelis et al. 2013).
3. Results
The European Union of 28 countries is among the three largest economies worldwide, coming in second after China and larger than the United States of America (
OECD 2019). For the time period under research, Purchase Power, in the majorities of countries in EU28 has increased almost by 4%. Twenty countries out of 28 have positive growth regarding their PPP. On the other hand, production of MSW has decreased almost by 24%. However, what should be highlighted is that less than half of the countries in EU28 have decreased their production, more precisely, just 10 out of 28. Population has increased for the majorities of the countries resulting in an average increase of almost 3%. It is worth noting that any increase in the population is relatively lower than the reduction in MSW.
Furthermore, what should be also emphasized is the high rates of waste treatment compared to waste generation. According to the available data, over 97% of the waste generated in the last ten years have been treated through the available techniques, decreasing the amount disposed of in dumpsites.
Since there are several available techniques for waste treatment, at the start of the time period under investigation, landfilling was mostly selected. Thus, in 2008, 40.21% of the MSW generated was treated by disposing of it in landfills. In 2017, this share decreased by almost half (−42%). The contribution of recycling and composting in waste treatment was about 24% and 14% while the increase of these methods at the end of 2017 was 25% and 21% respectively. Incineration with energy recovery (R1) is the method that saw the highest increase the last ten years (
Psomopoulos et al. 2017). However, any future constraint that may appear in place of that technology has to consider its role in circular economy (
European Commission 2017). Thus, according to the European Commission, any new plant has to meet and satisfy specific criteria. Furthermore, several factors should always be taken into consideration so that its role in circular economy may be enhanced (
Kyriakis et al. 2018;
Kalogirou 2017). The percentage of MSW that was treated in Waste-to-Energy facilities in 2008 was almost 16%, whereas at the end of 2017 it was more than double its share (see
Table 2). Specifically, the use of incineration (R1) increased over 72%. Finally, incineration without energy recovery (D10) does not constitute an option for waste treatment anymore, decreasing the amount of MSW treated via this technique to 1.32%.
• Belgium
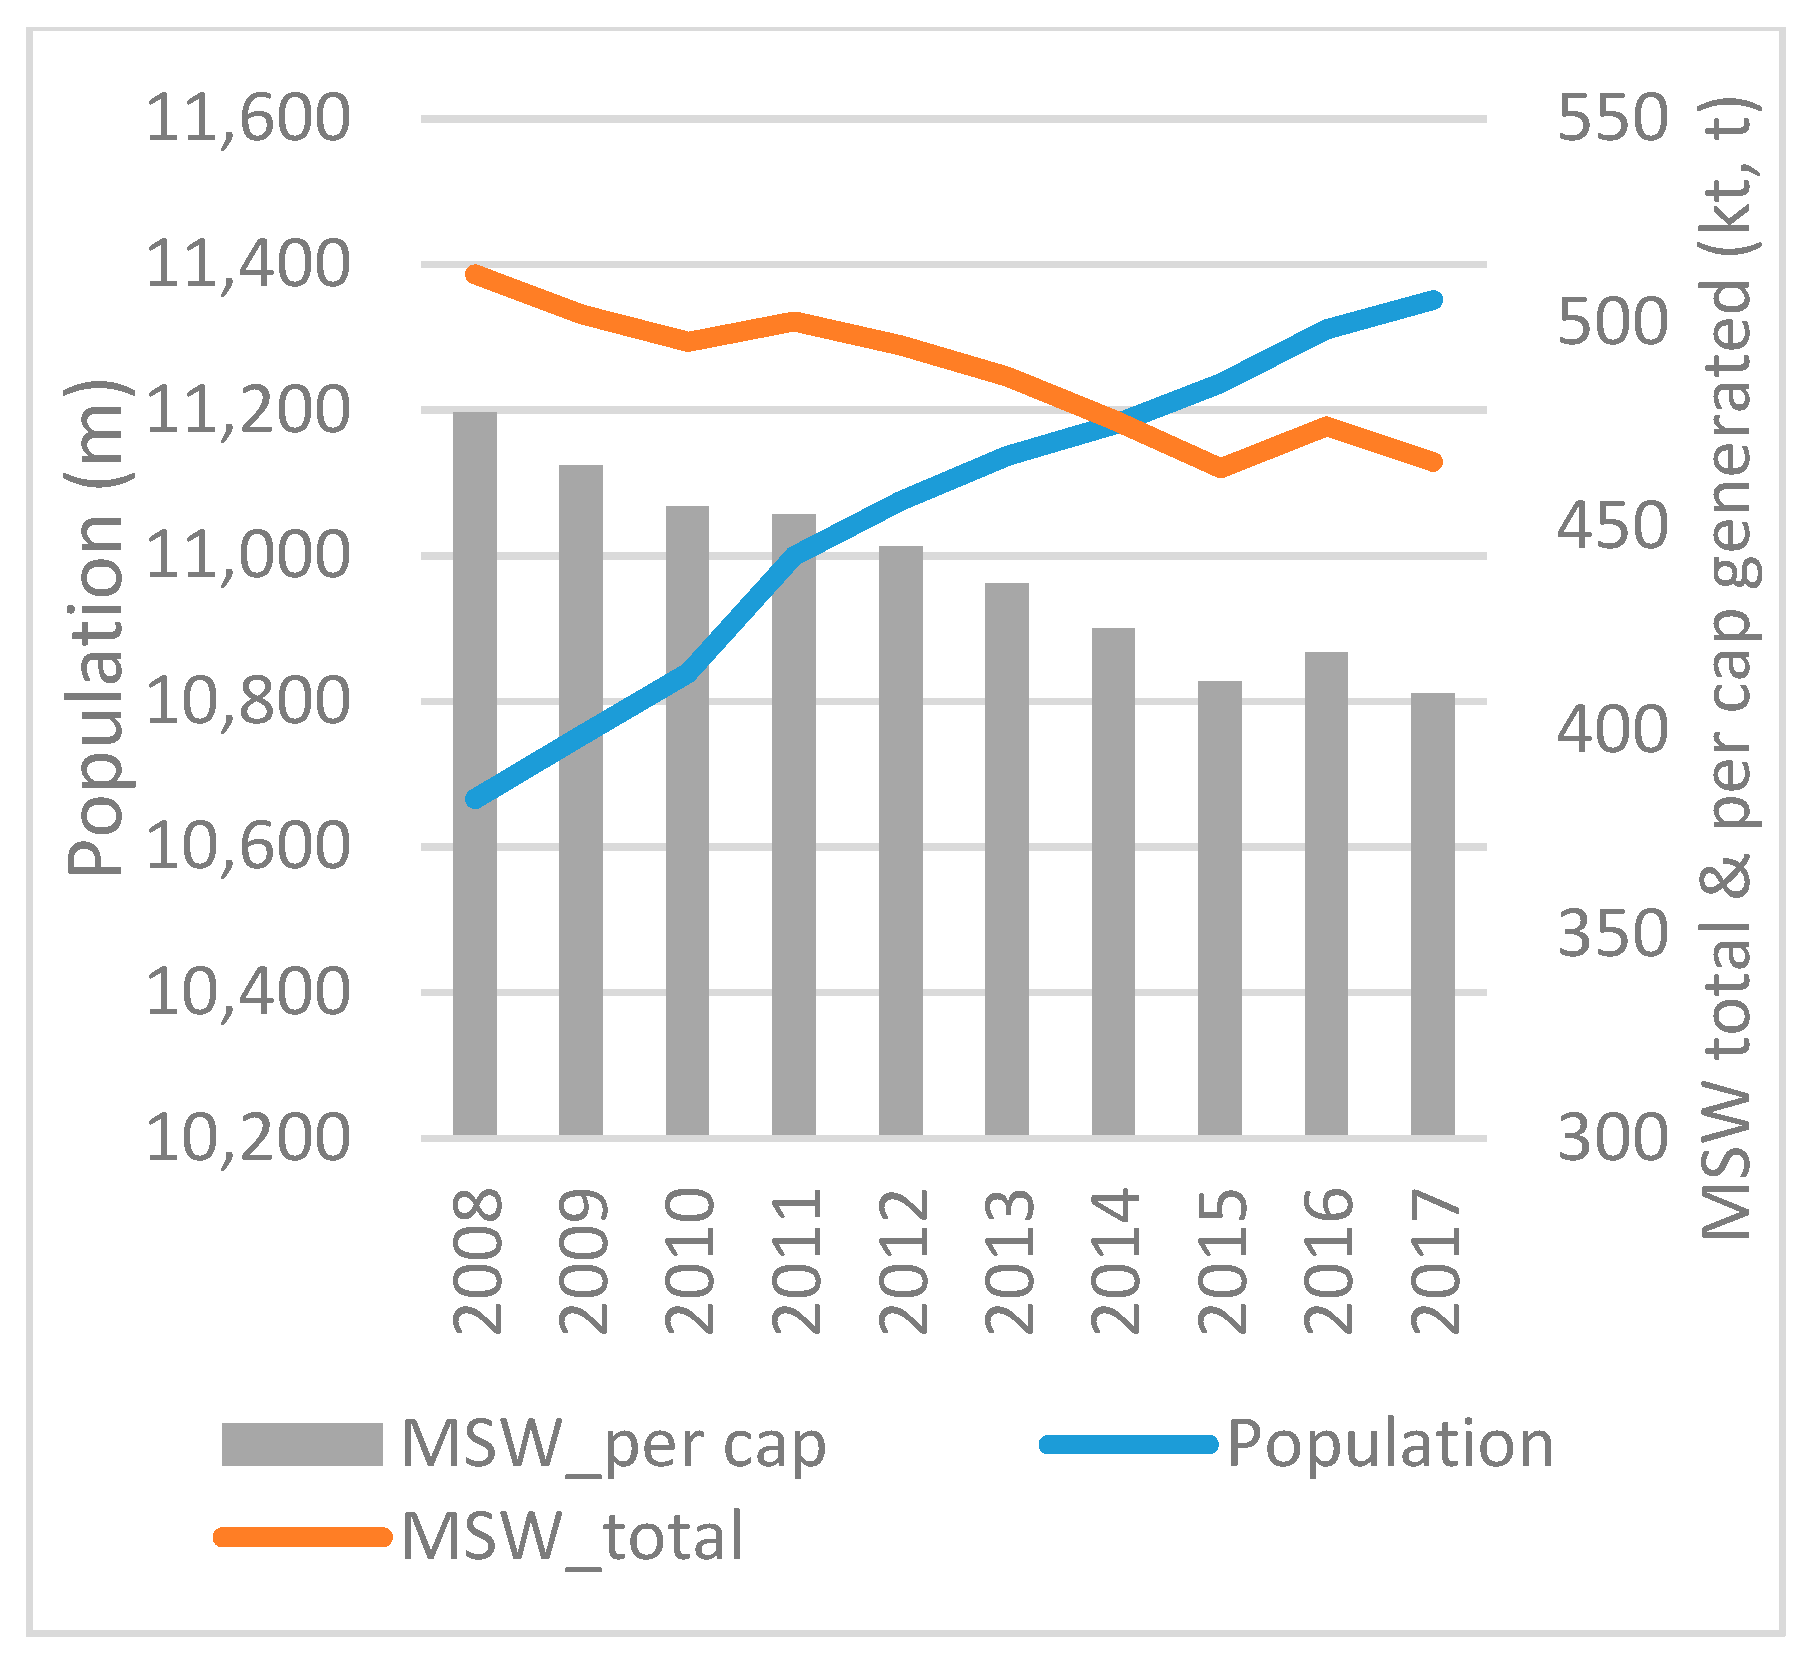
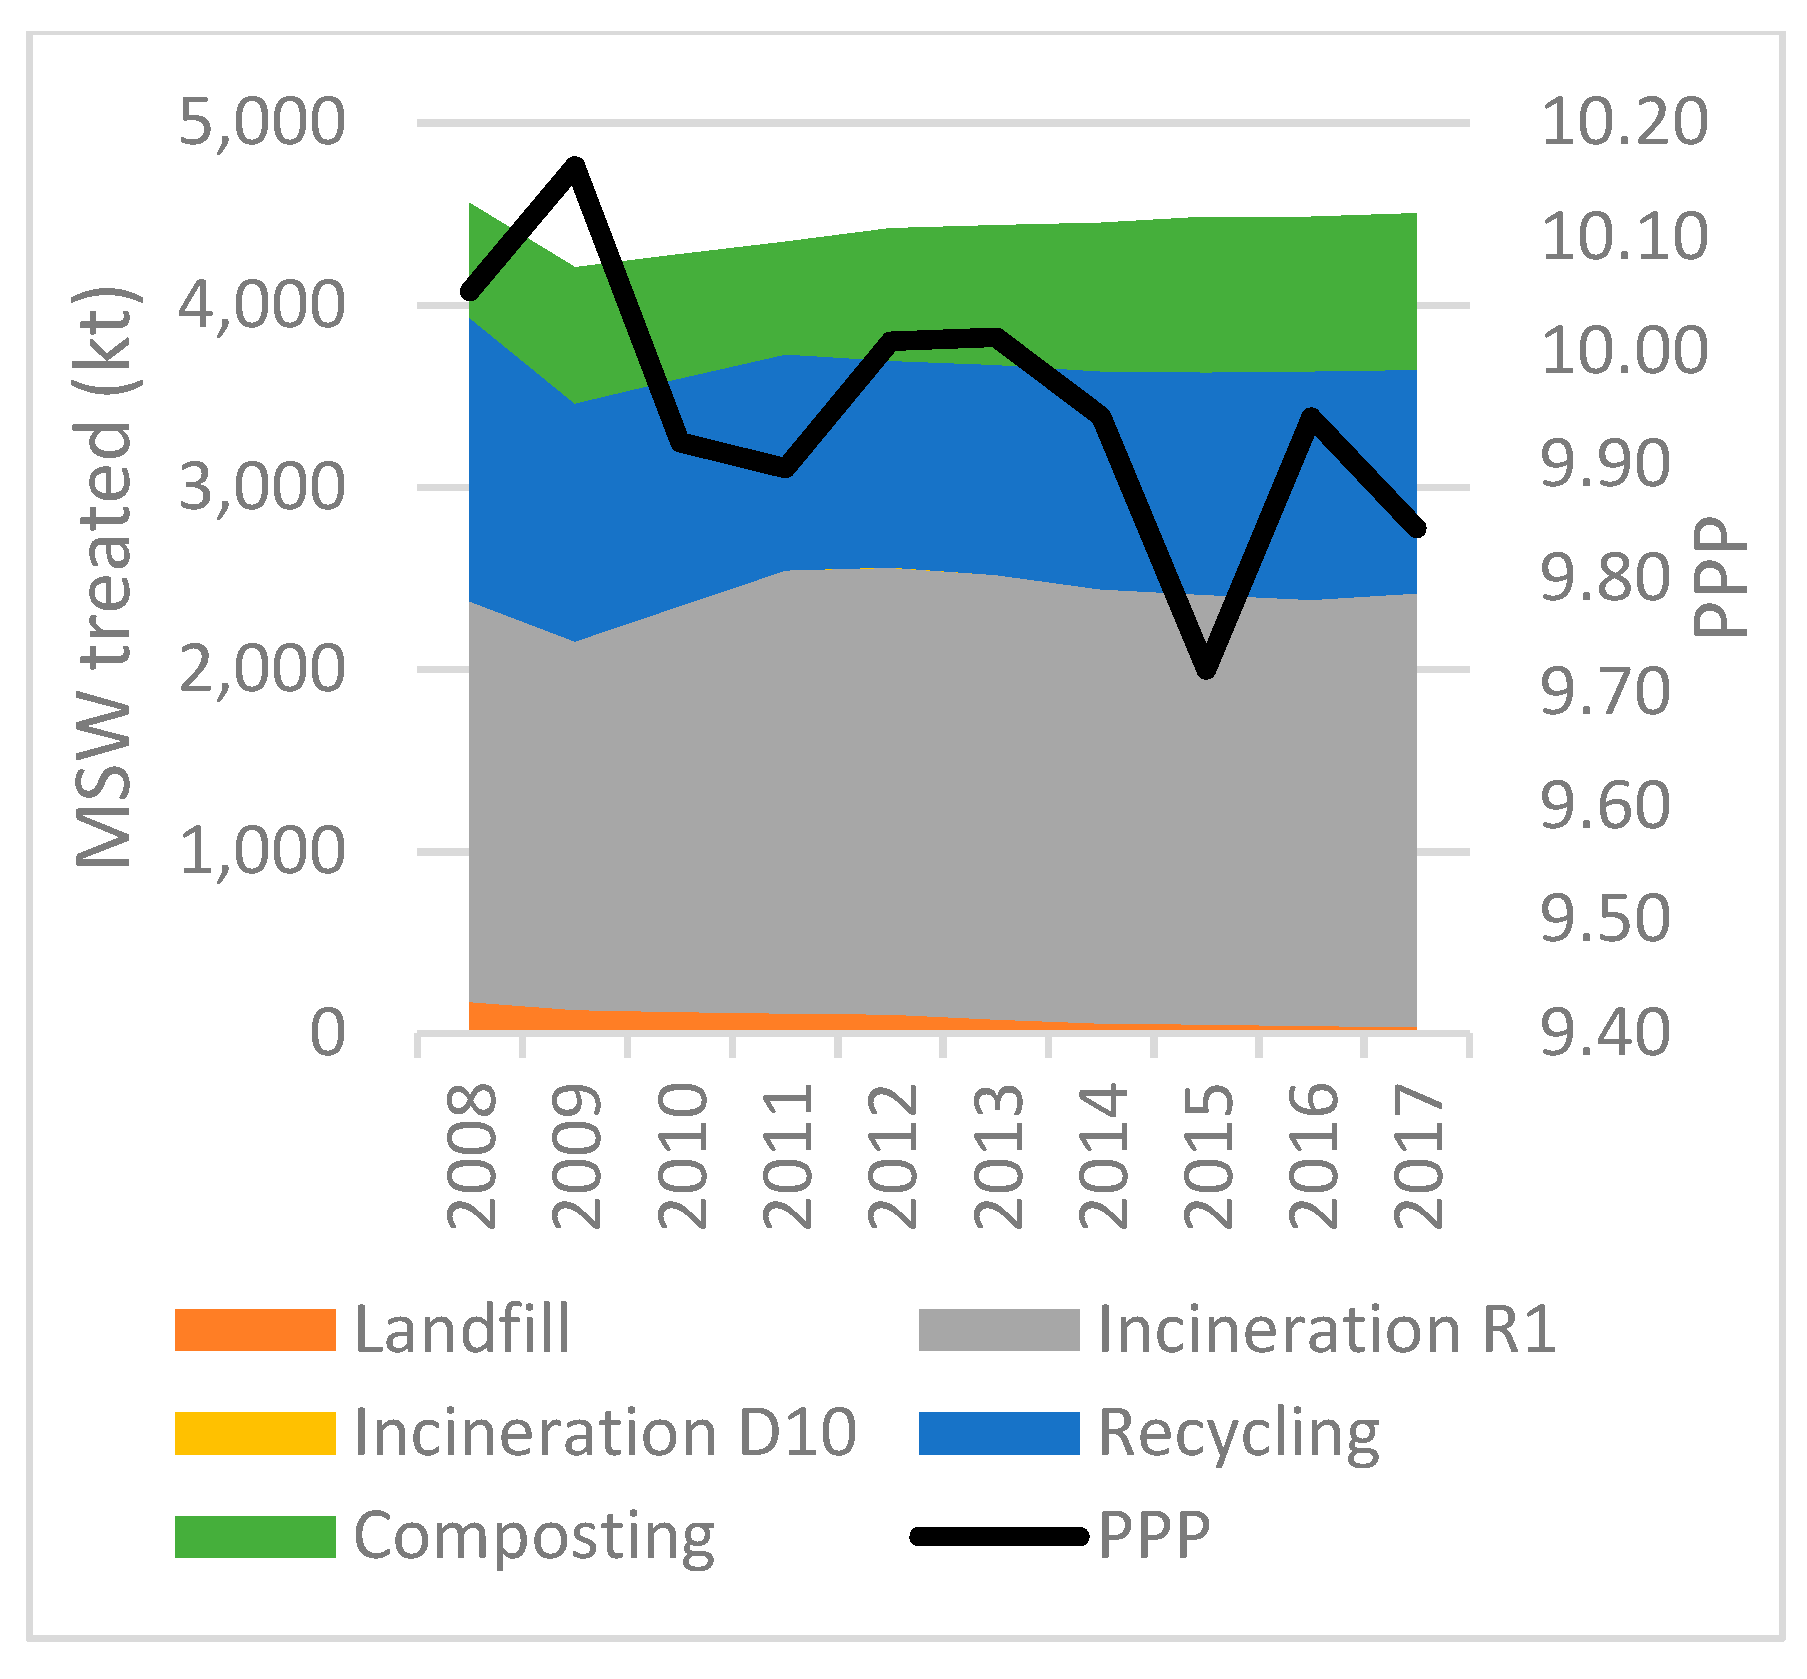
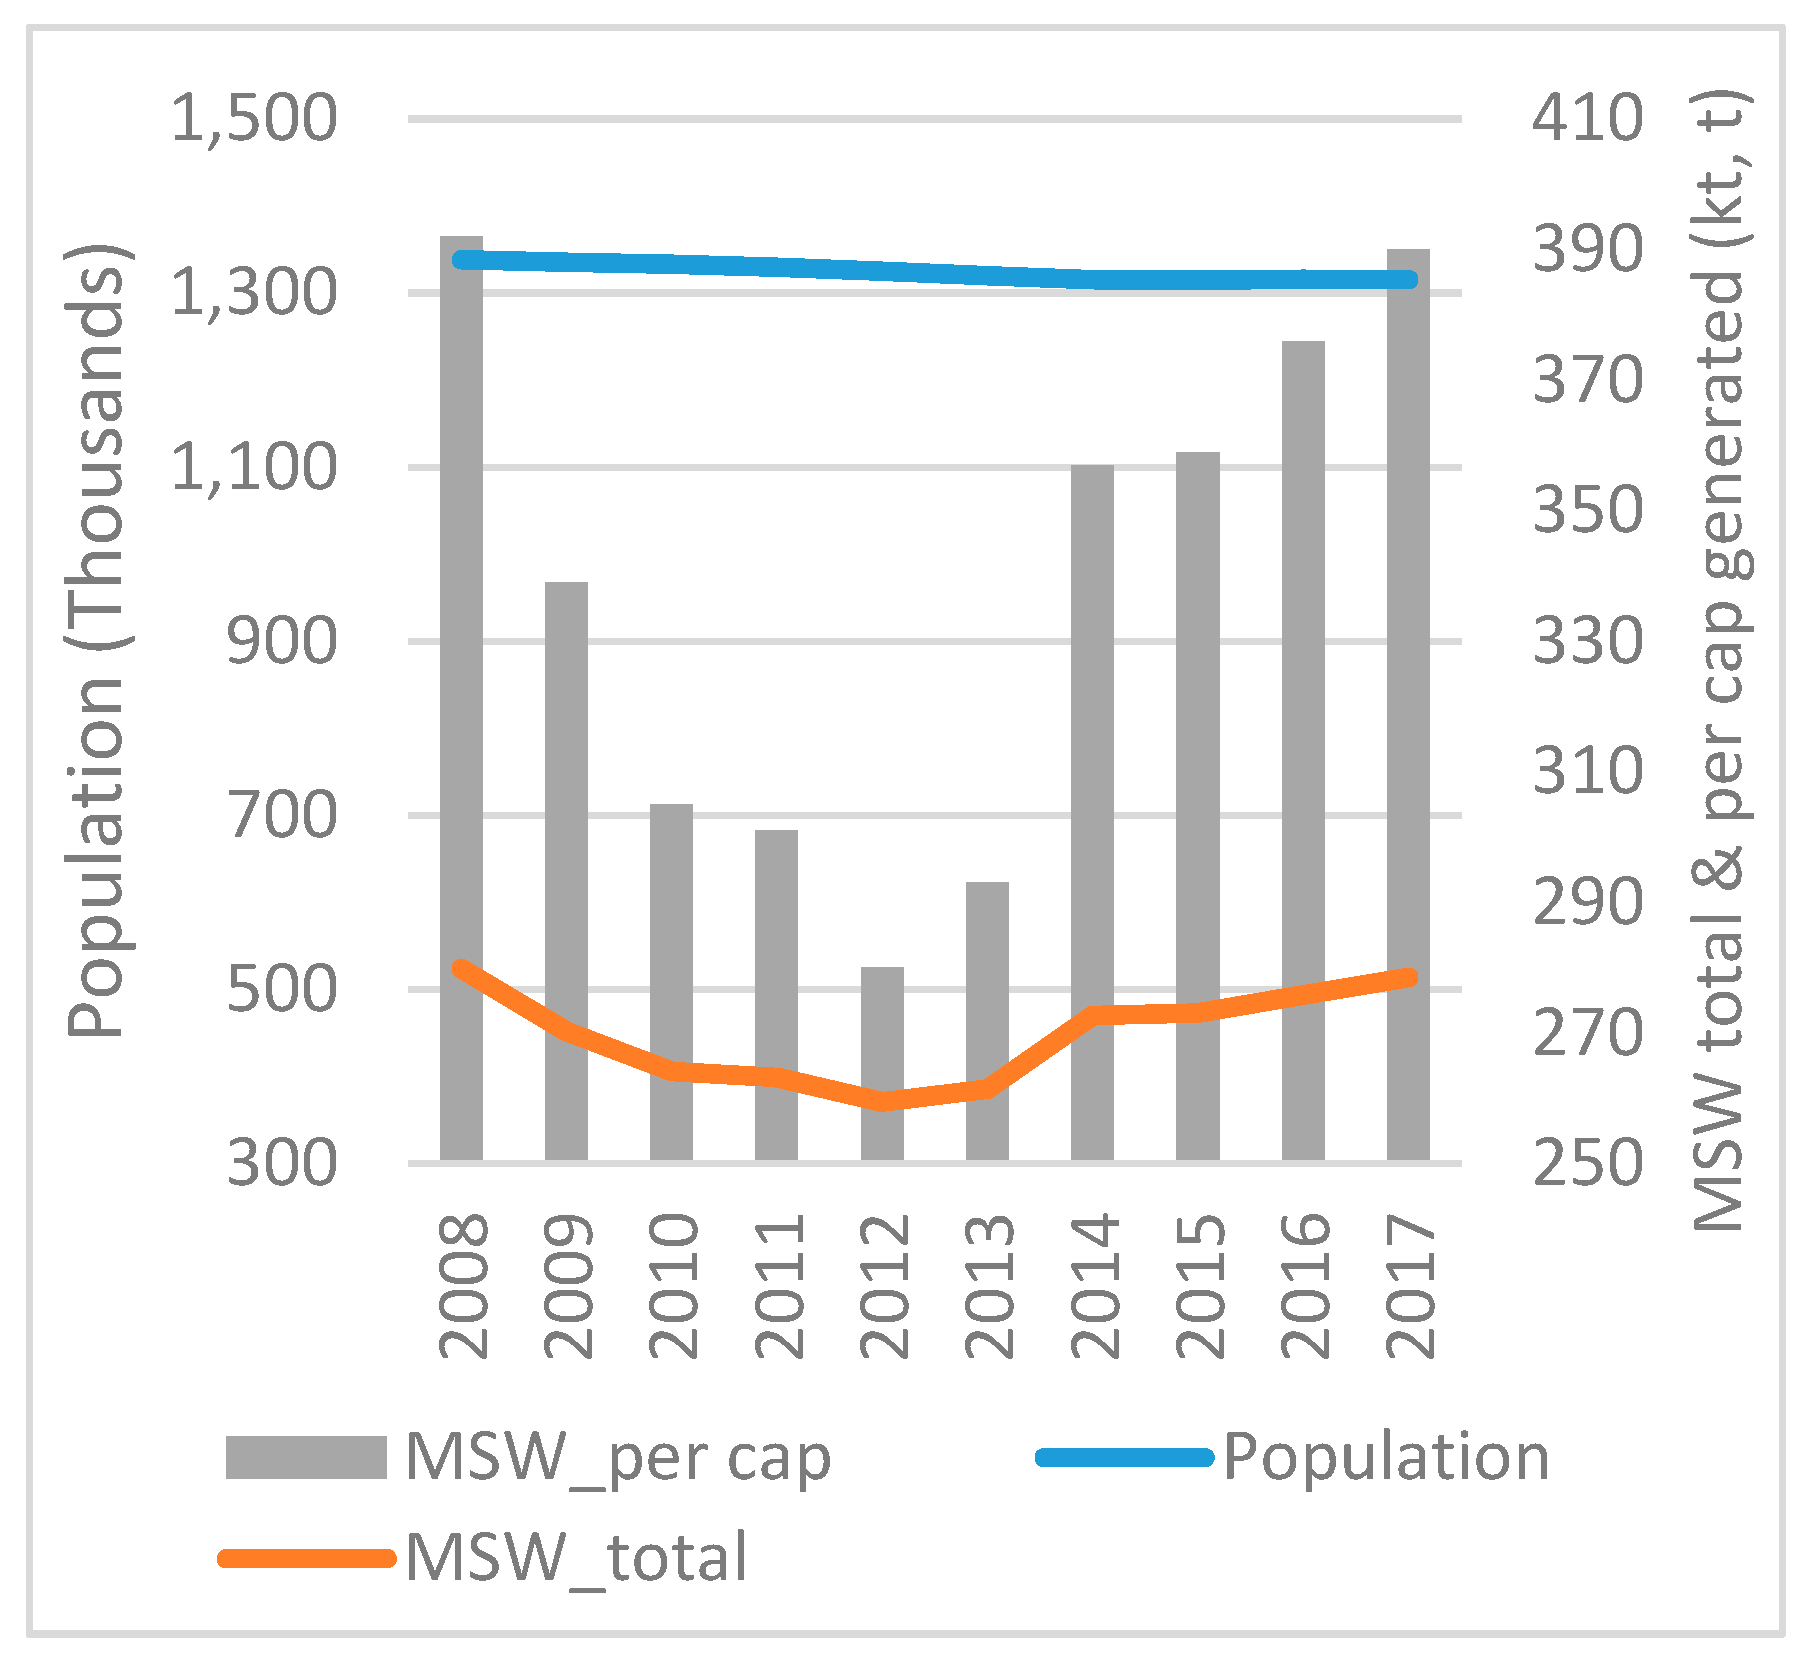
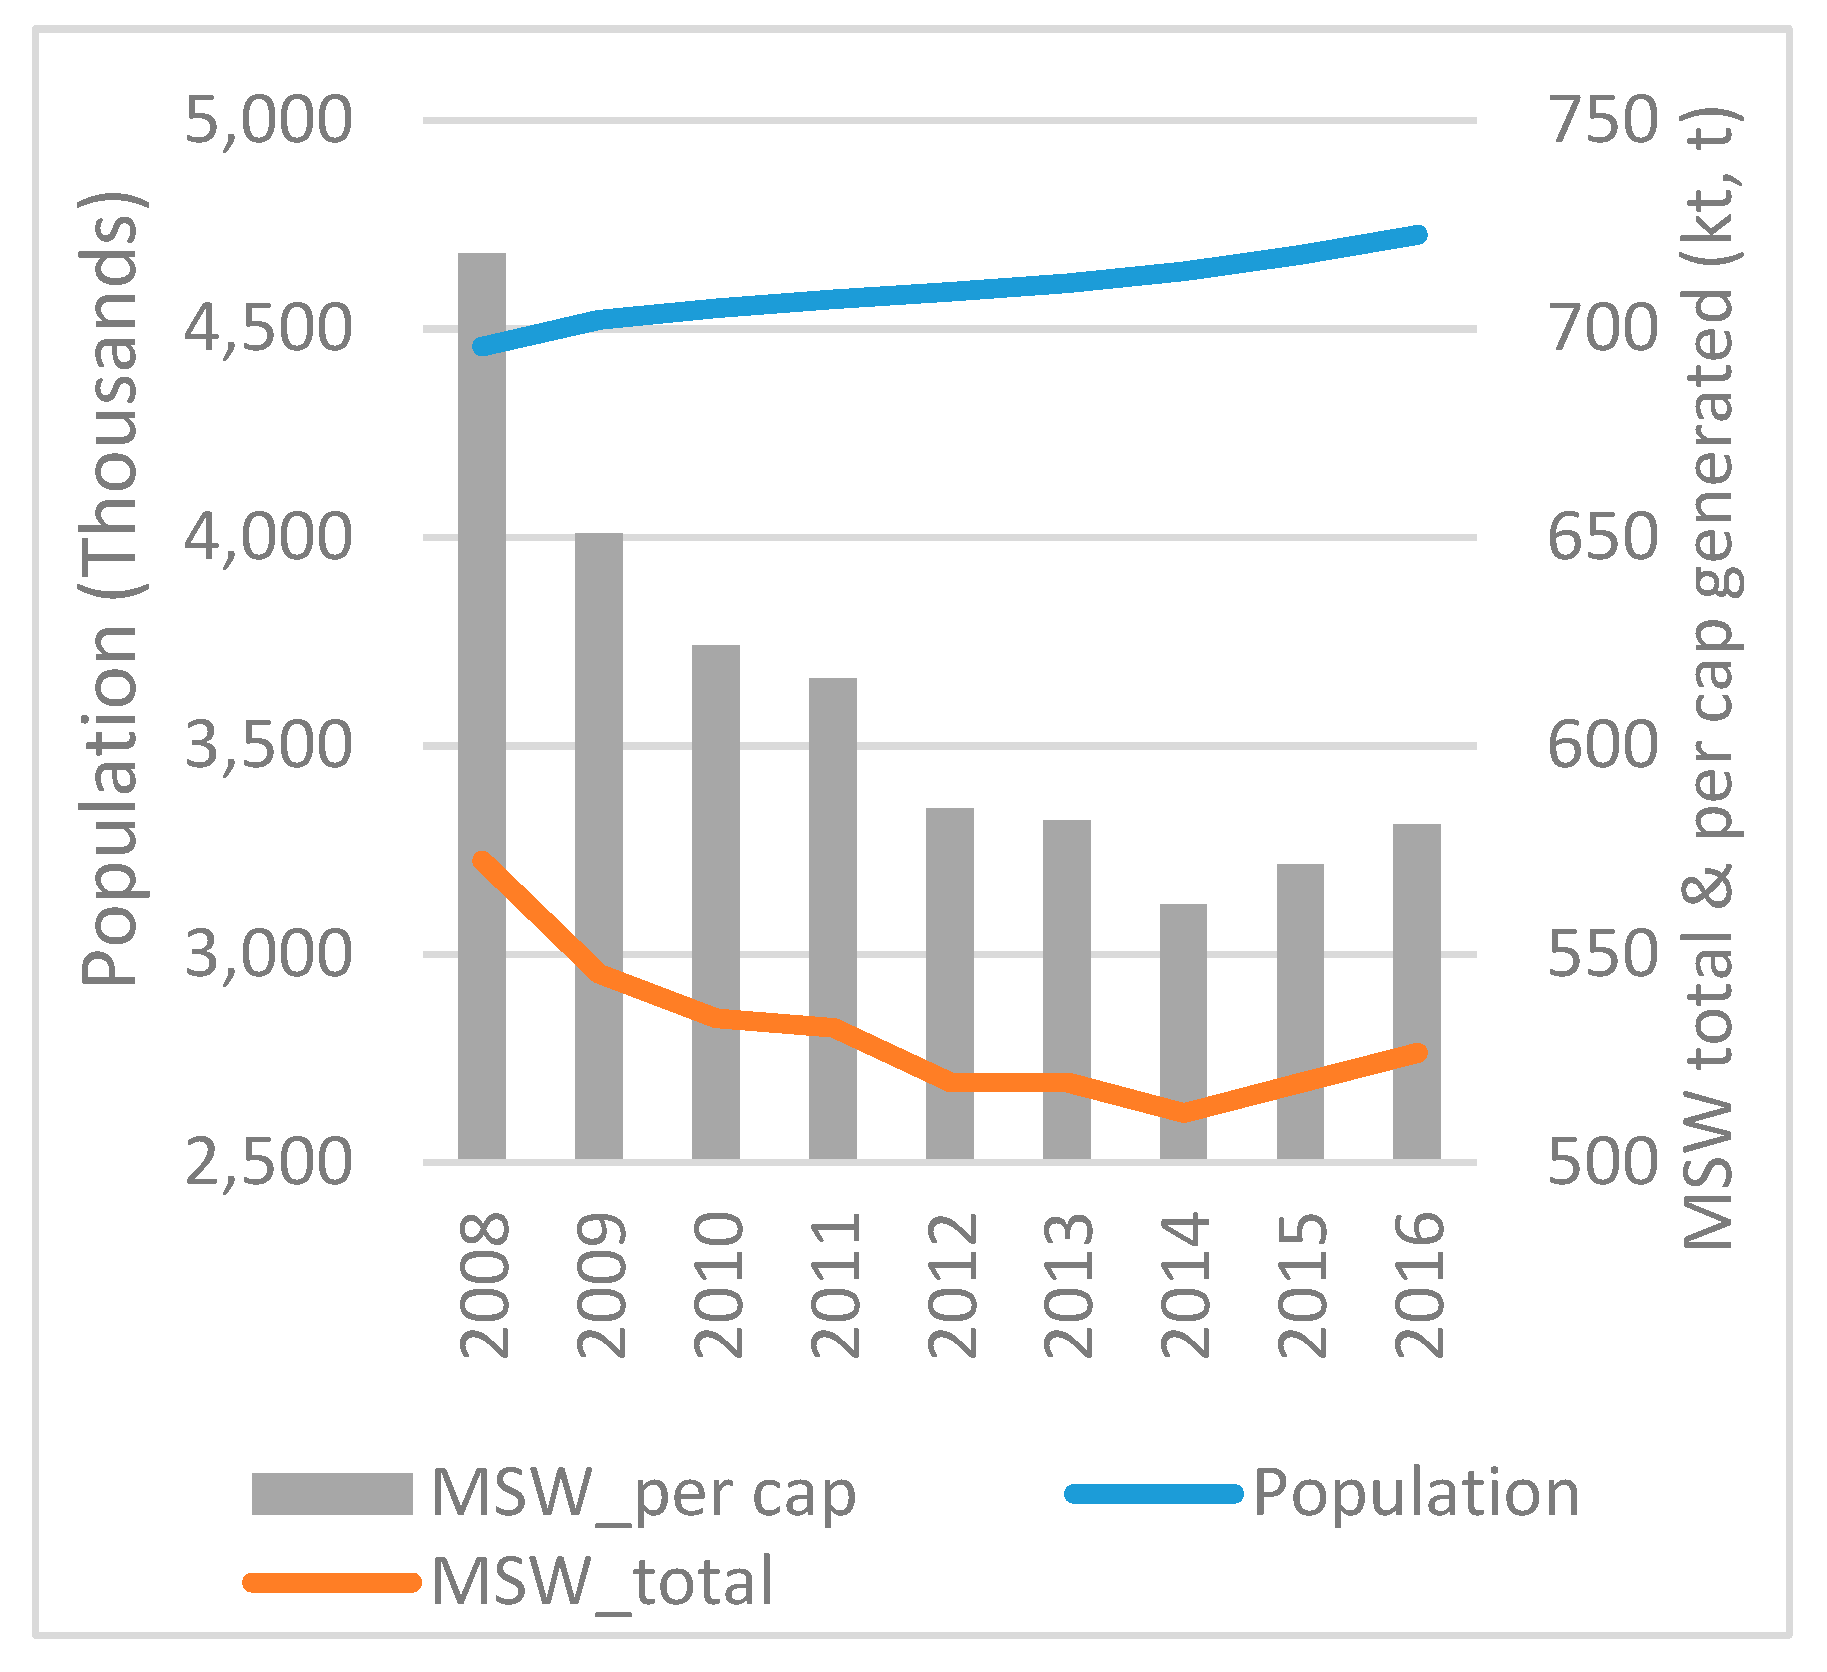
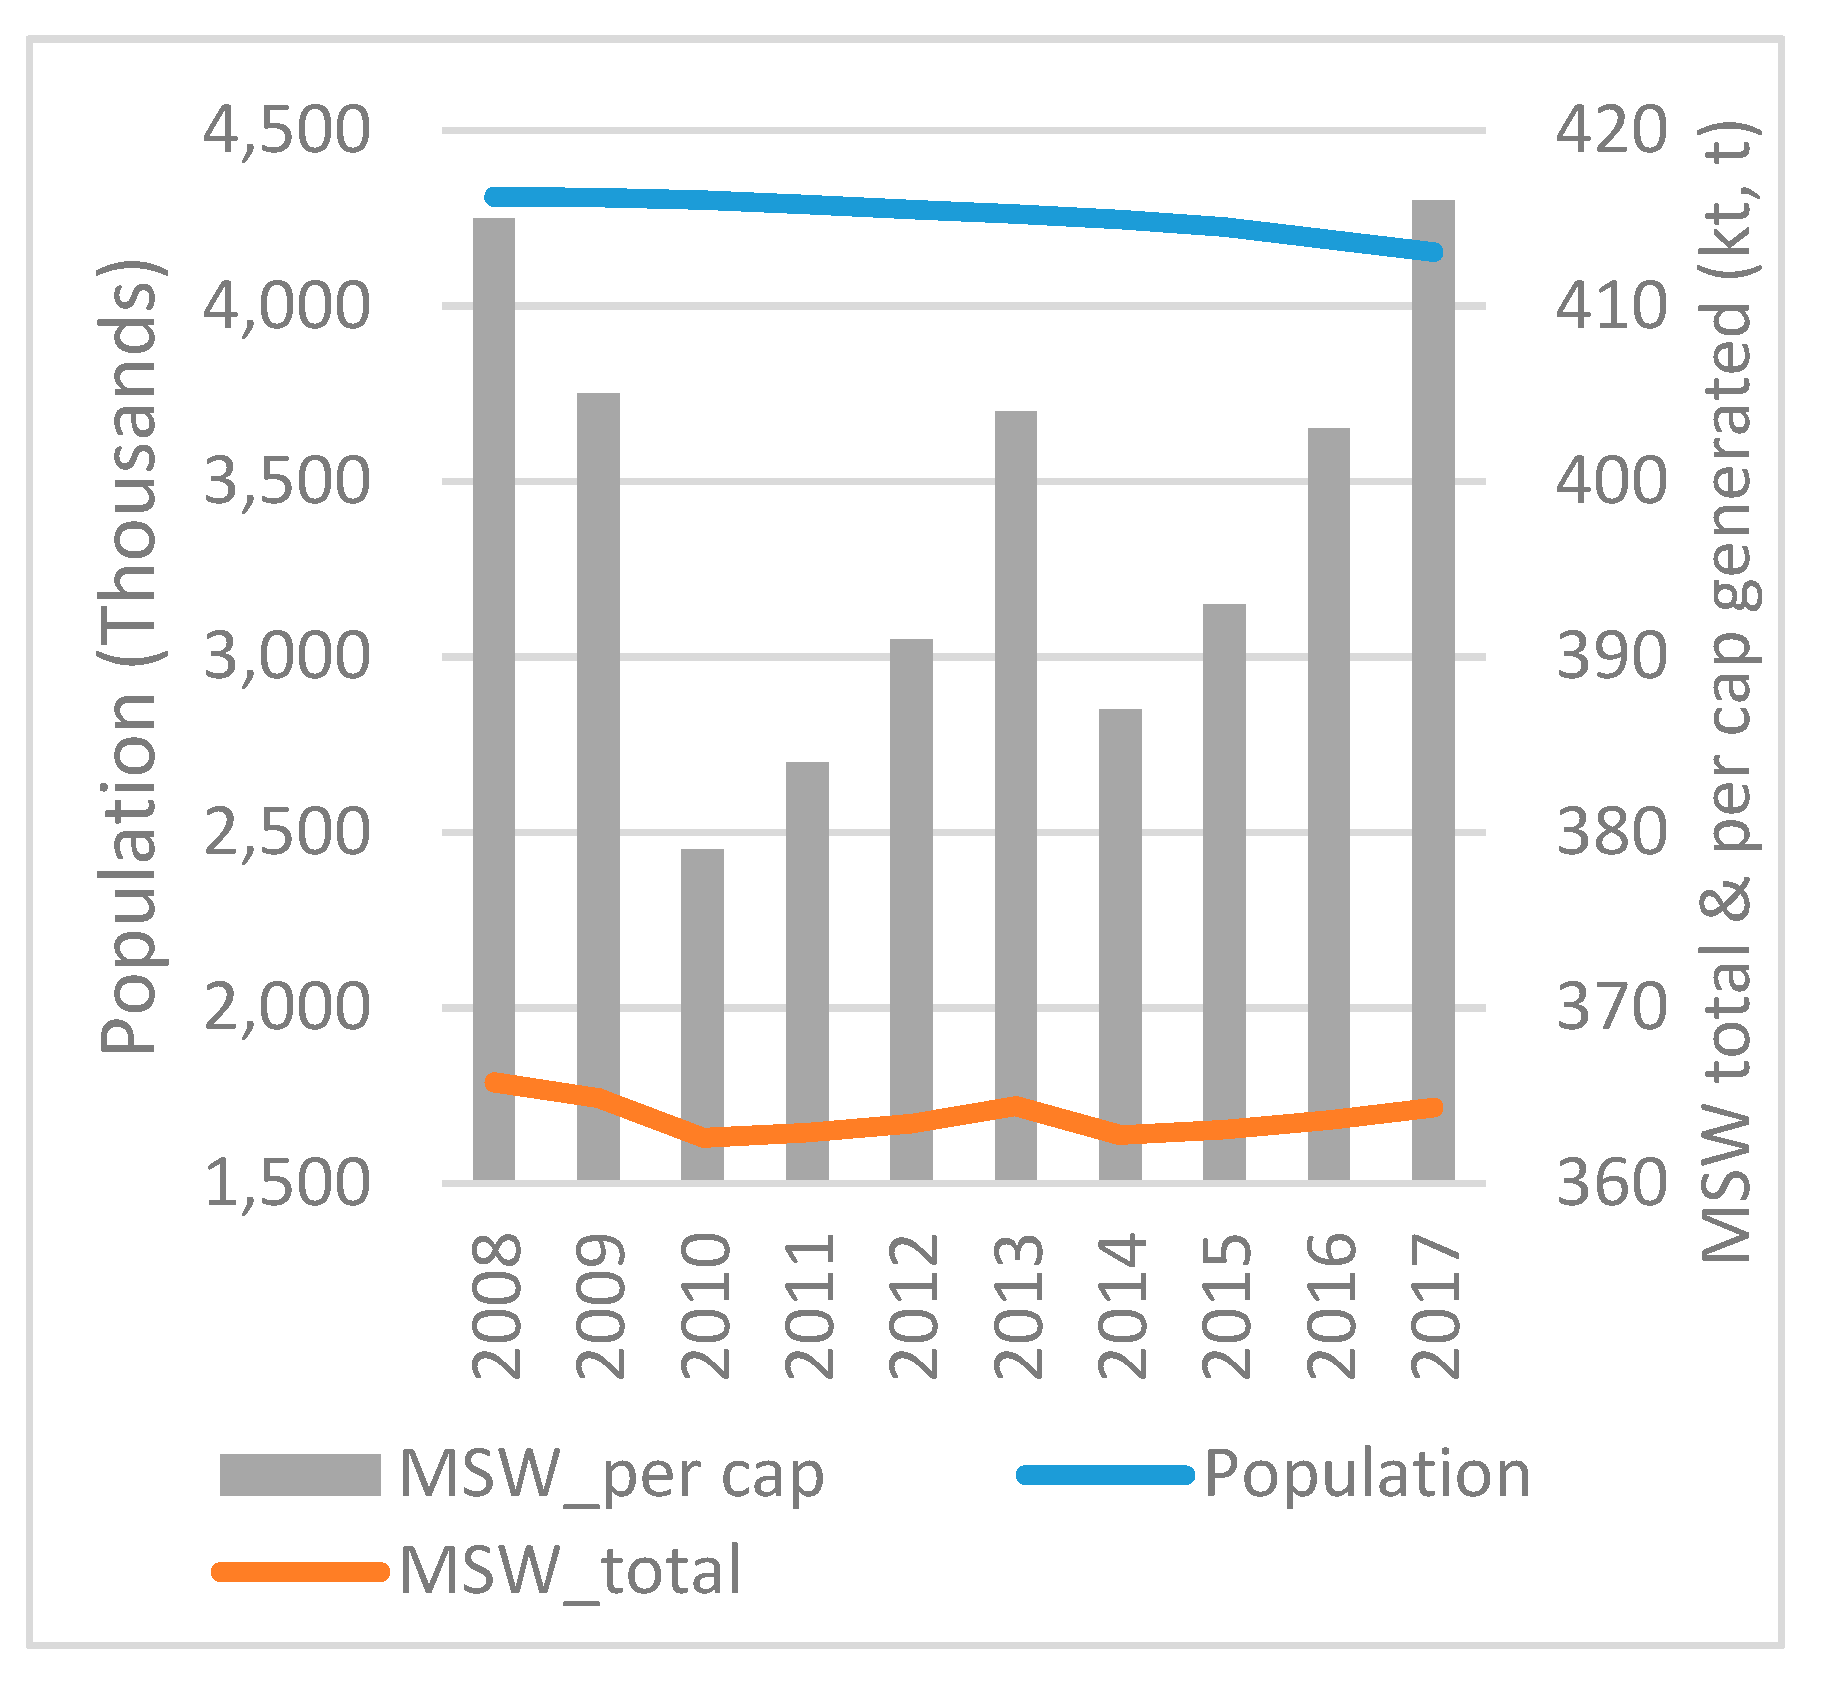
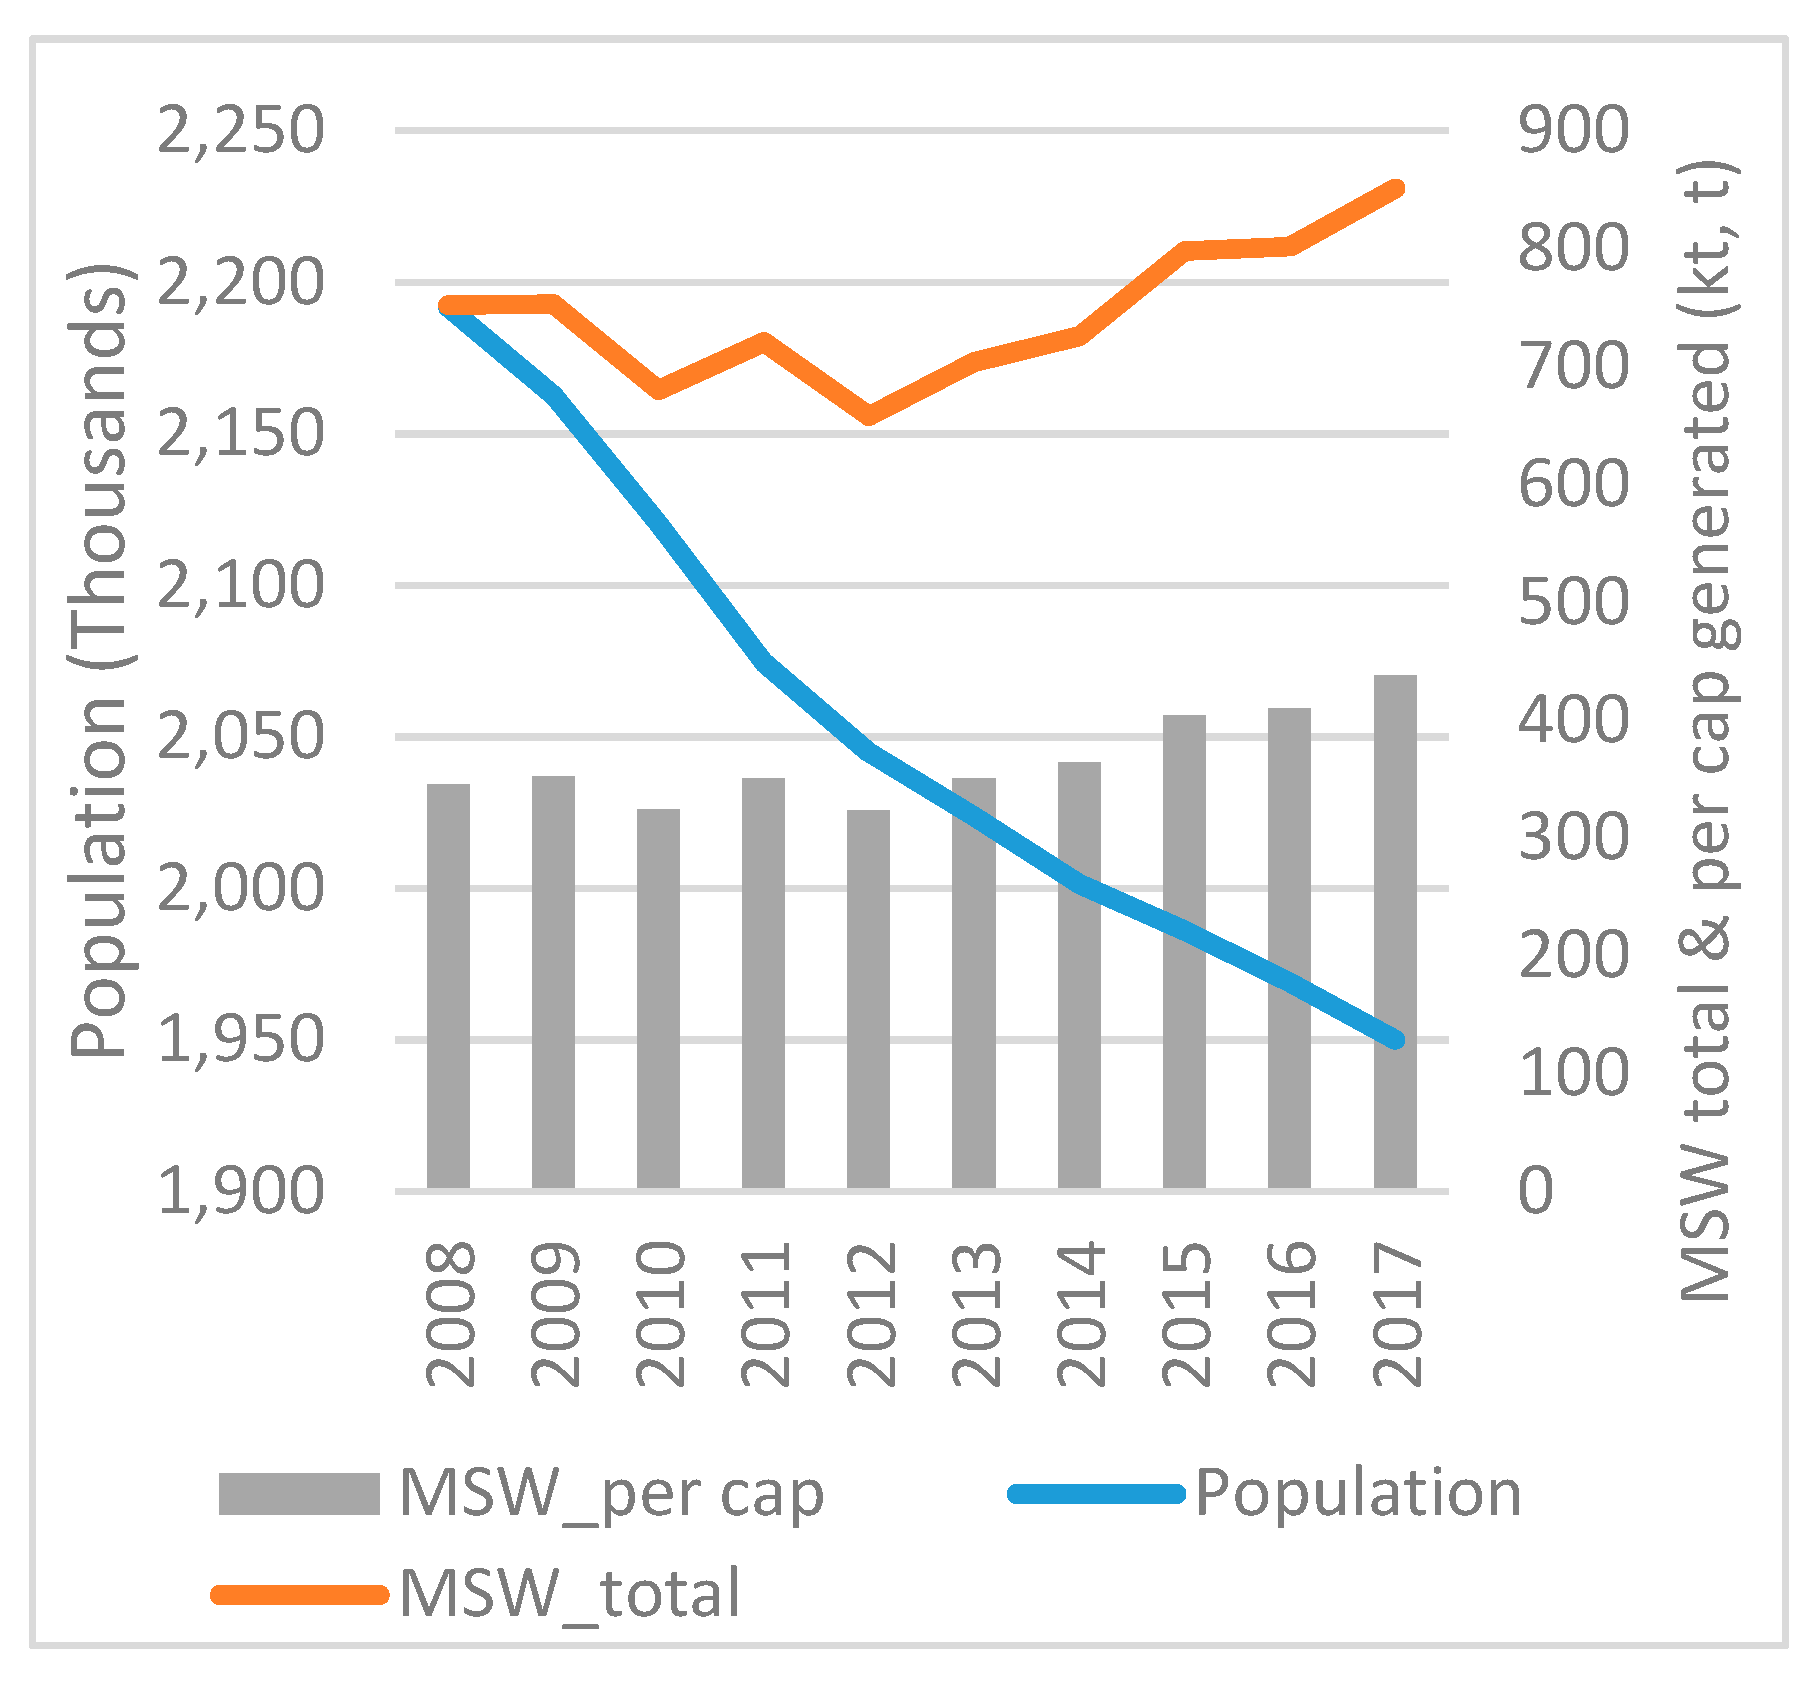
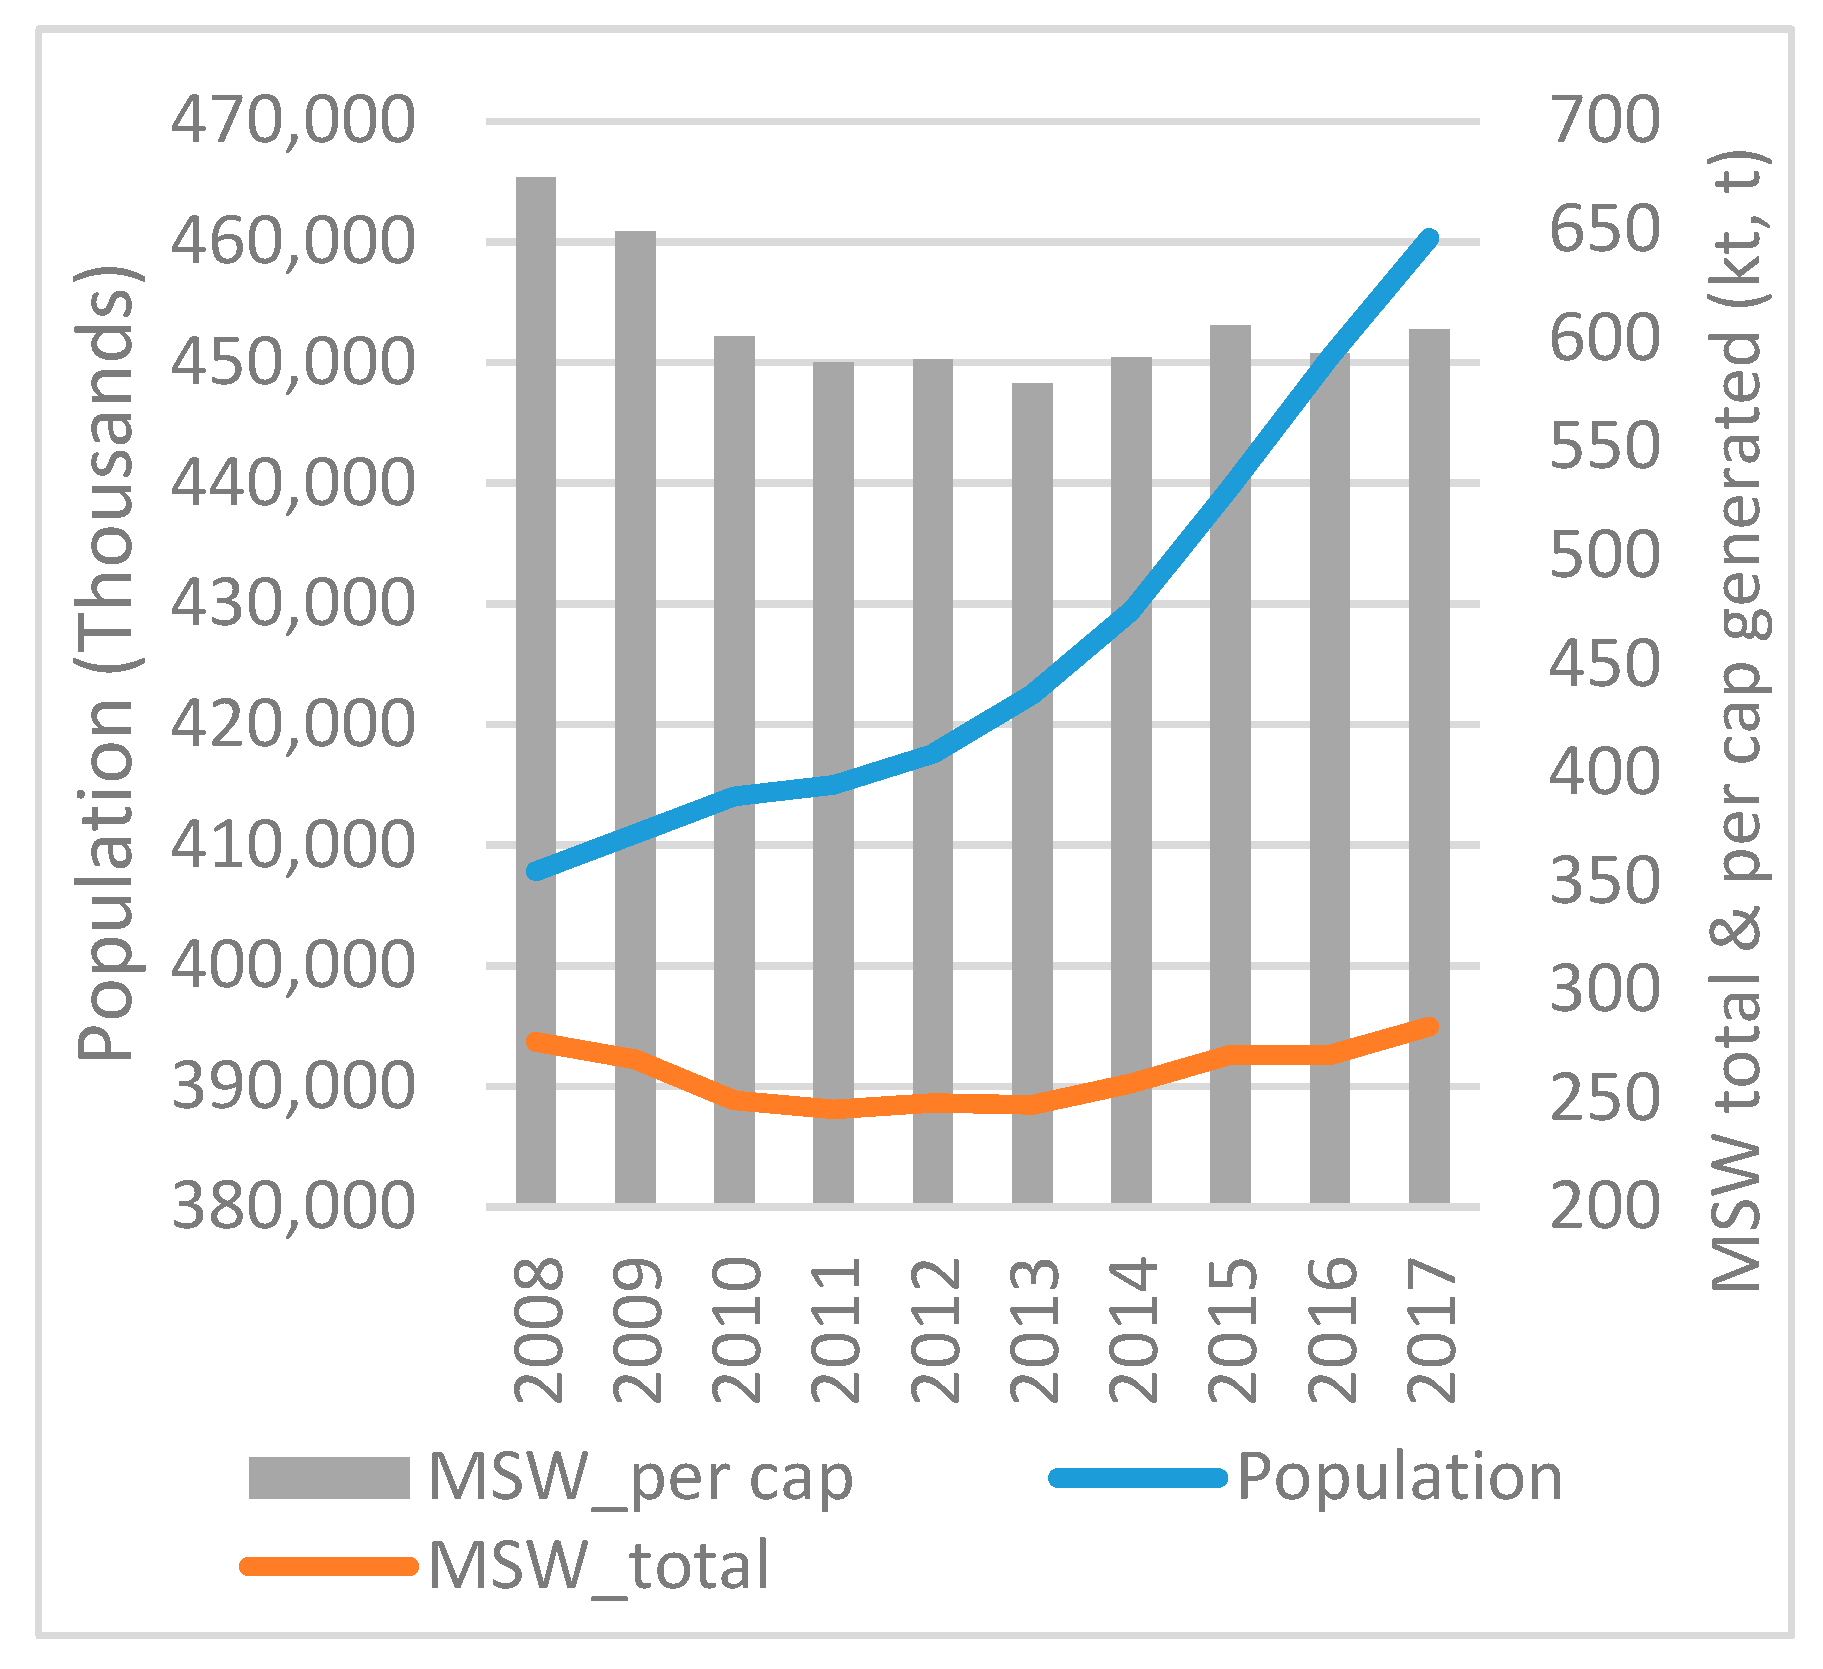
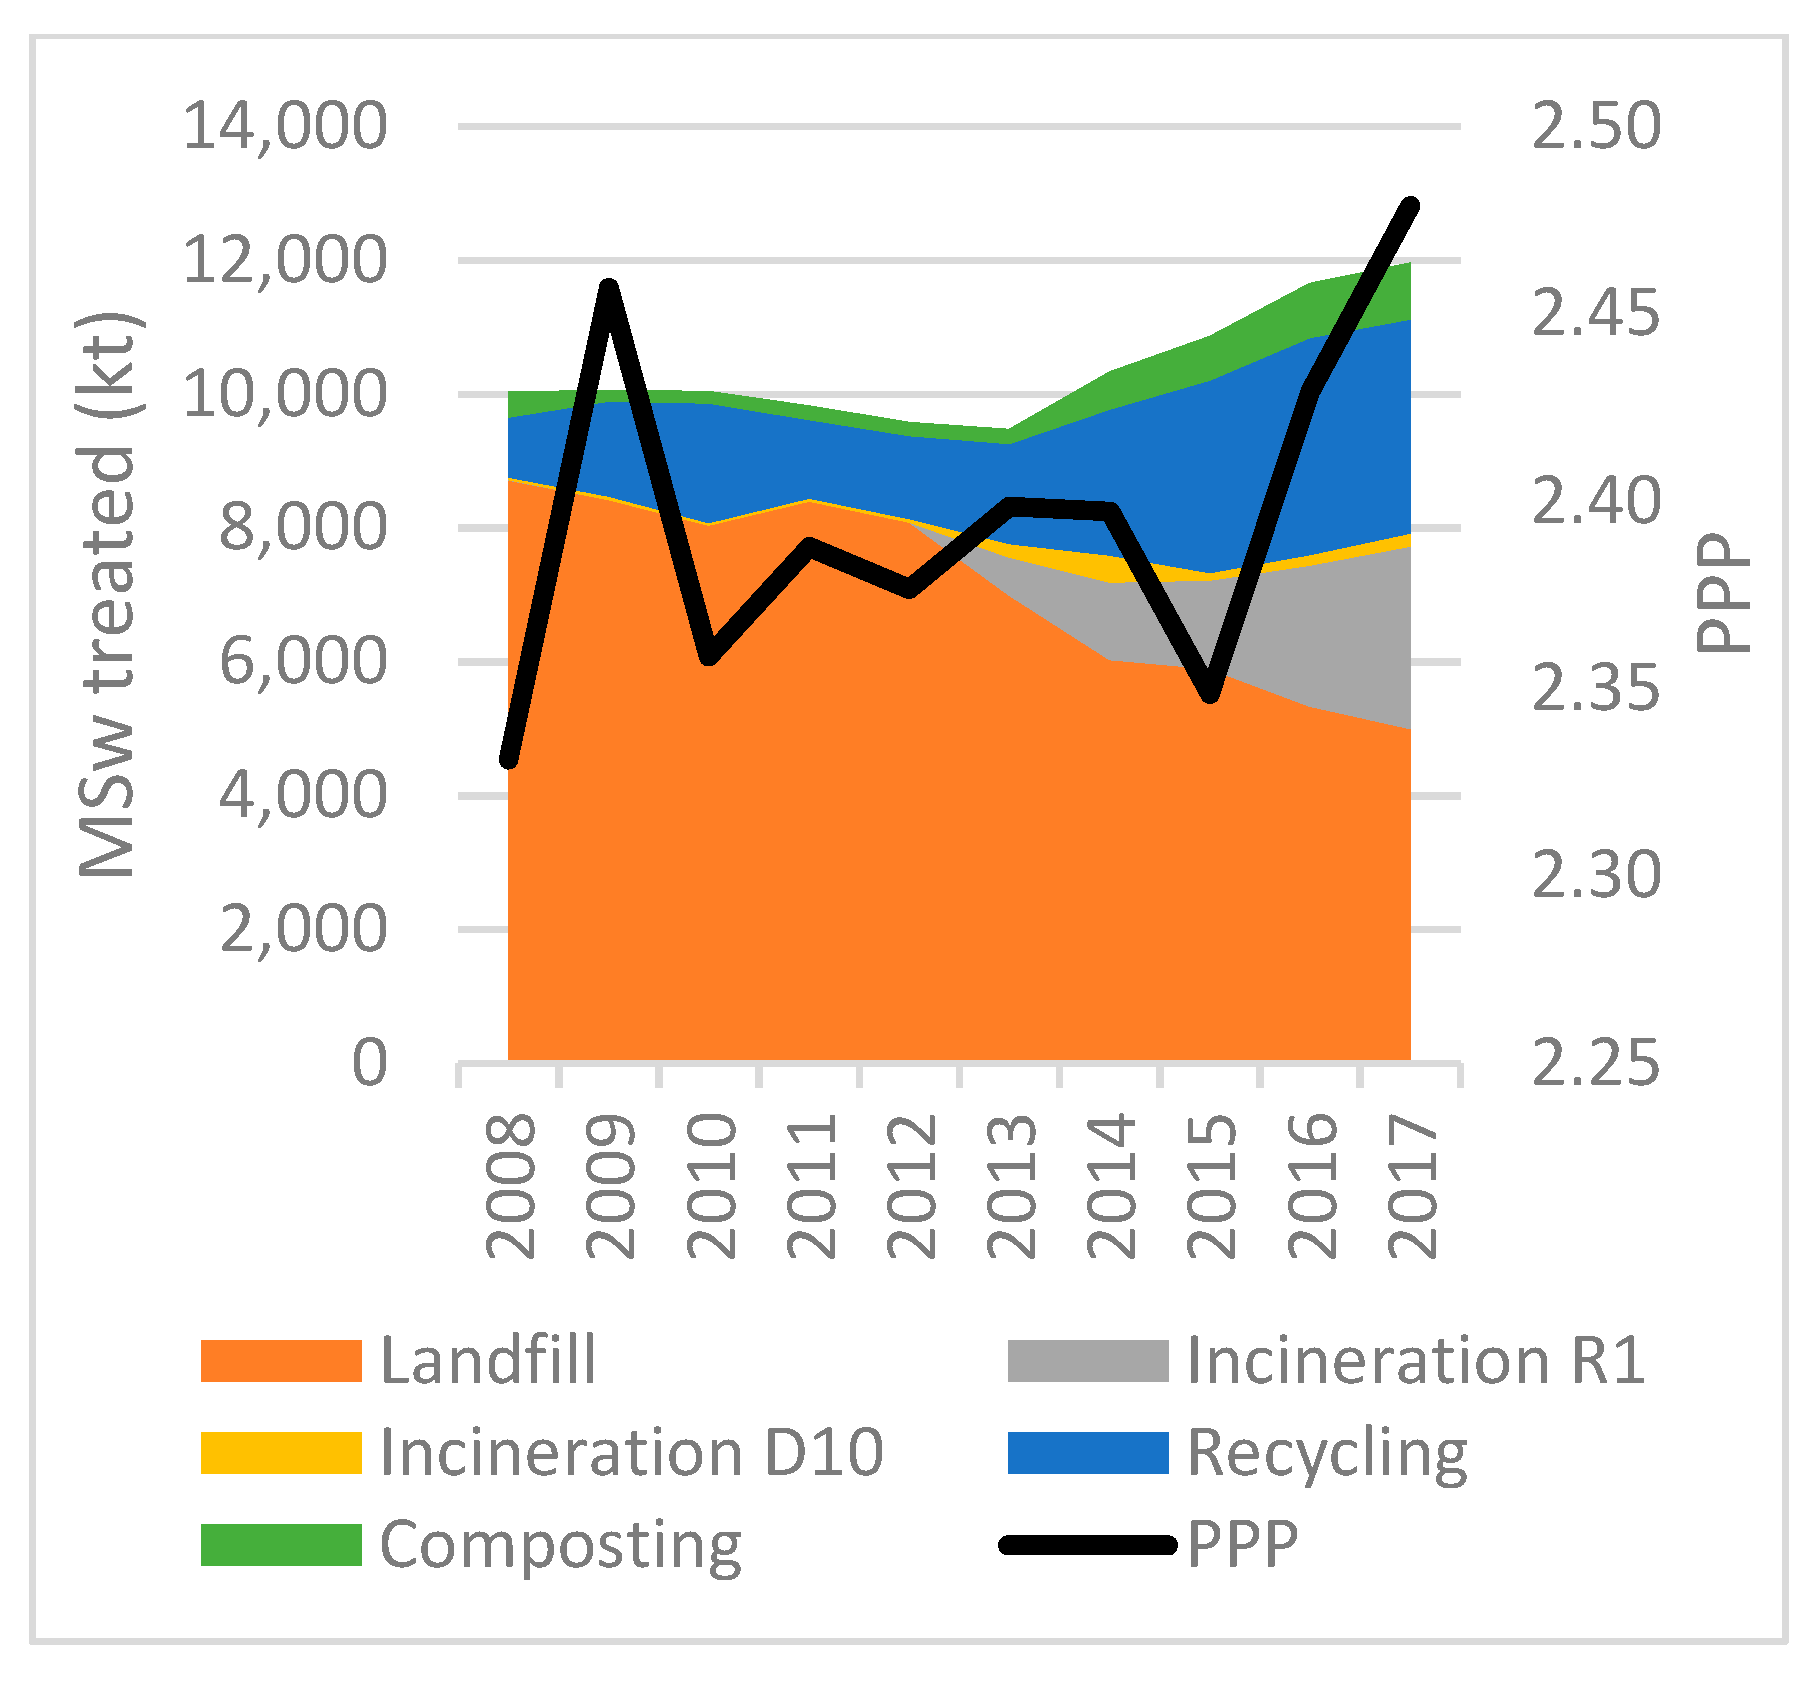
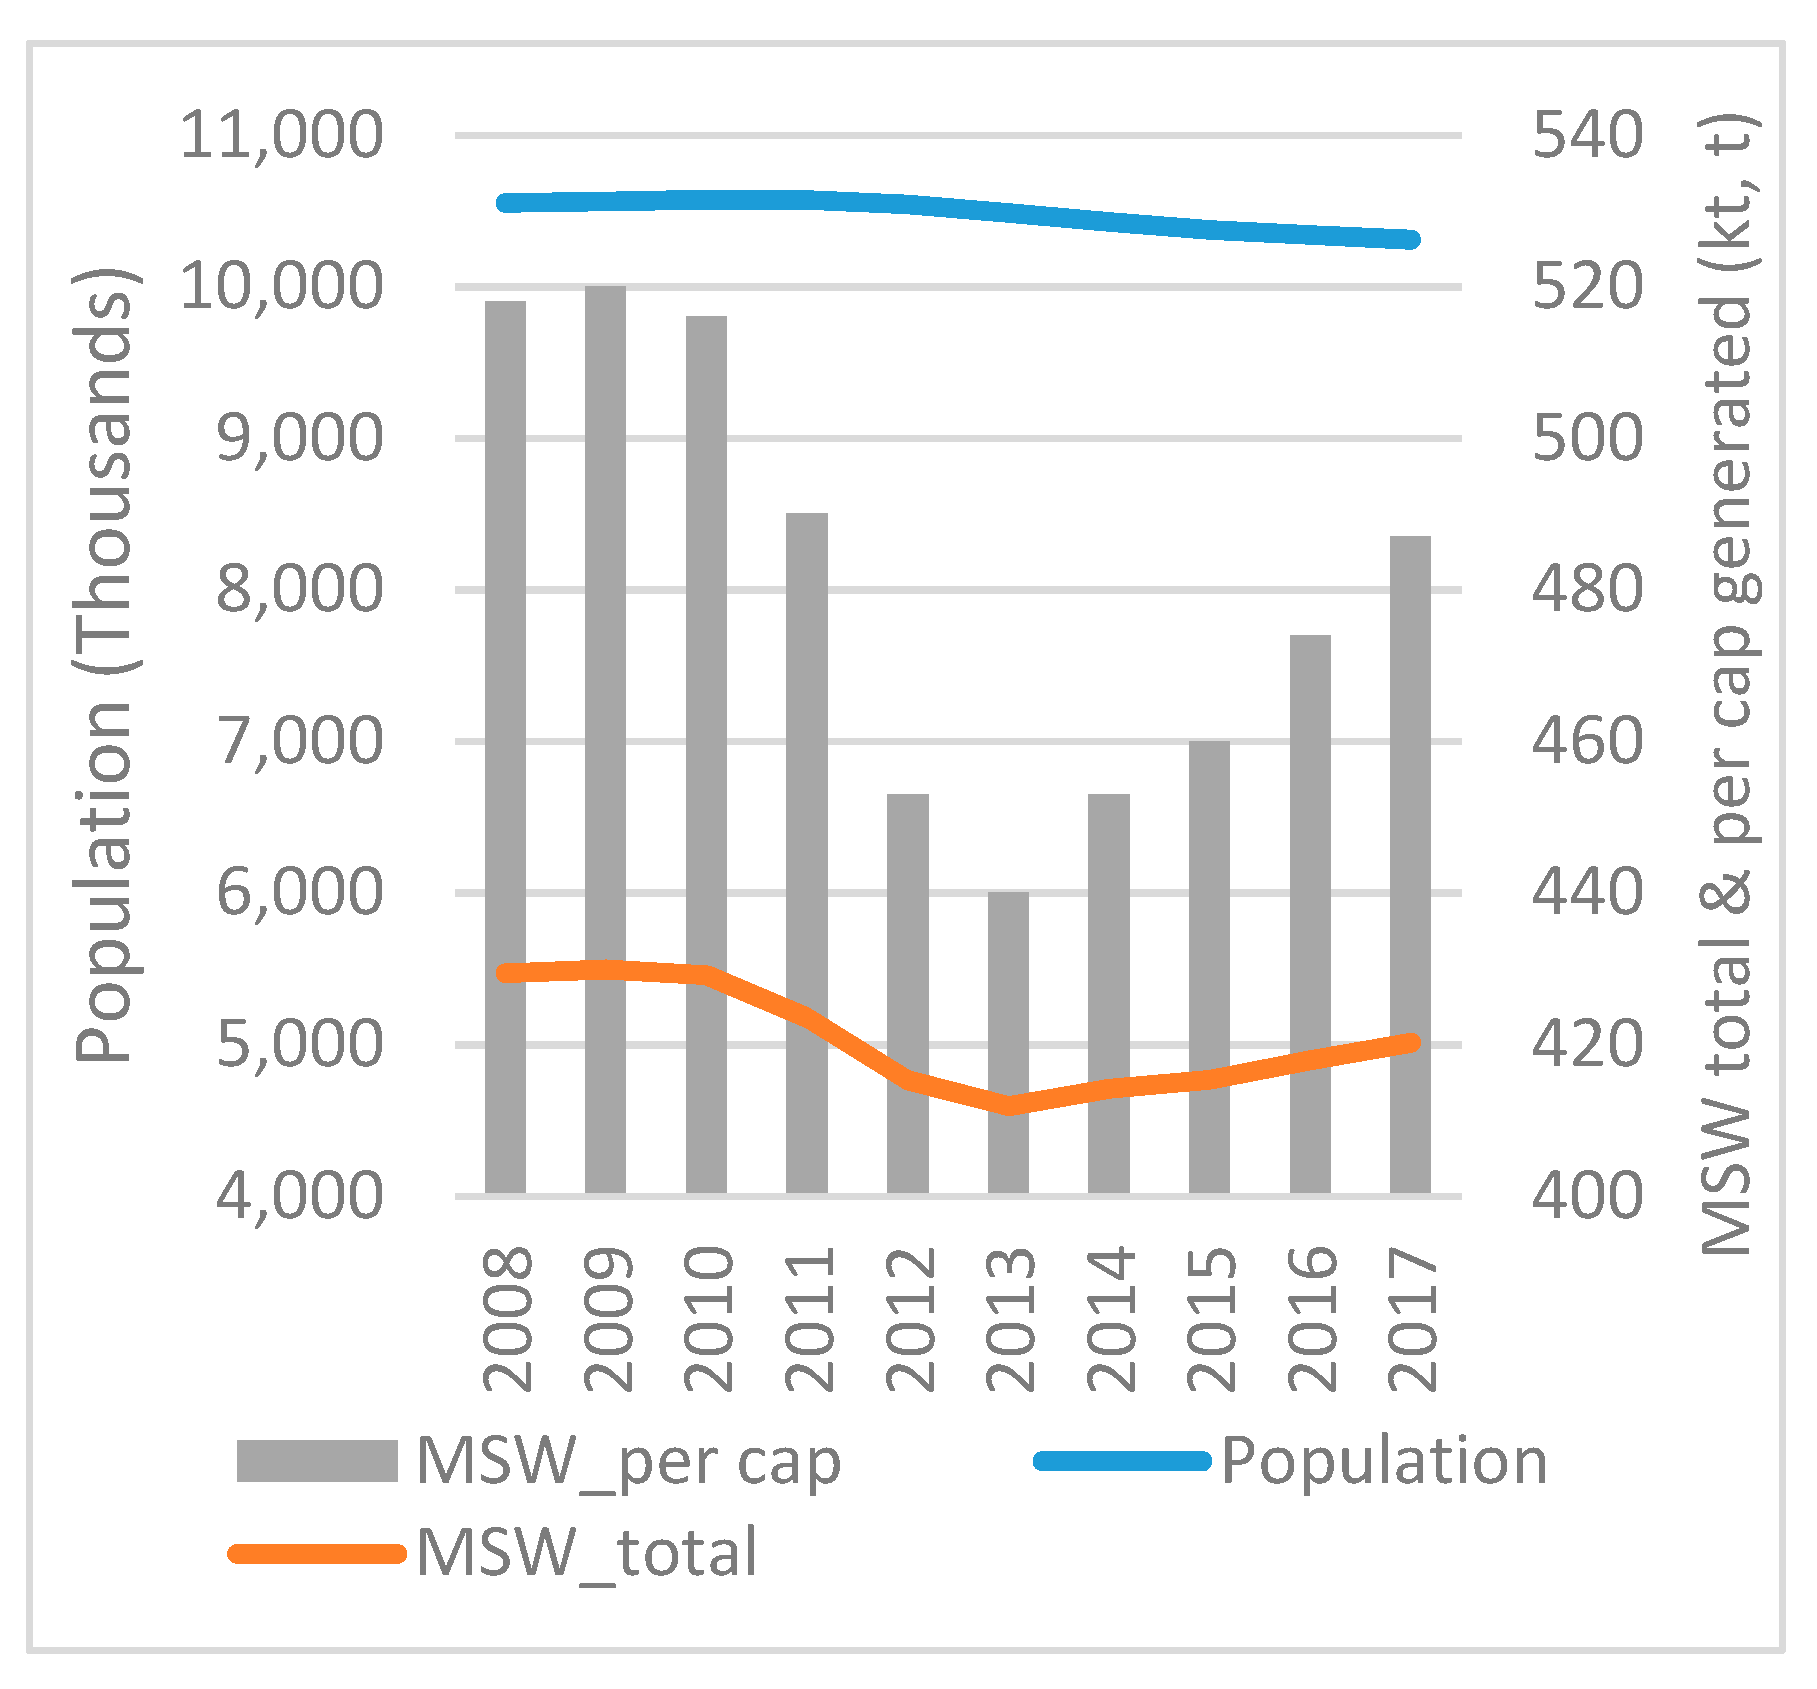
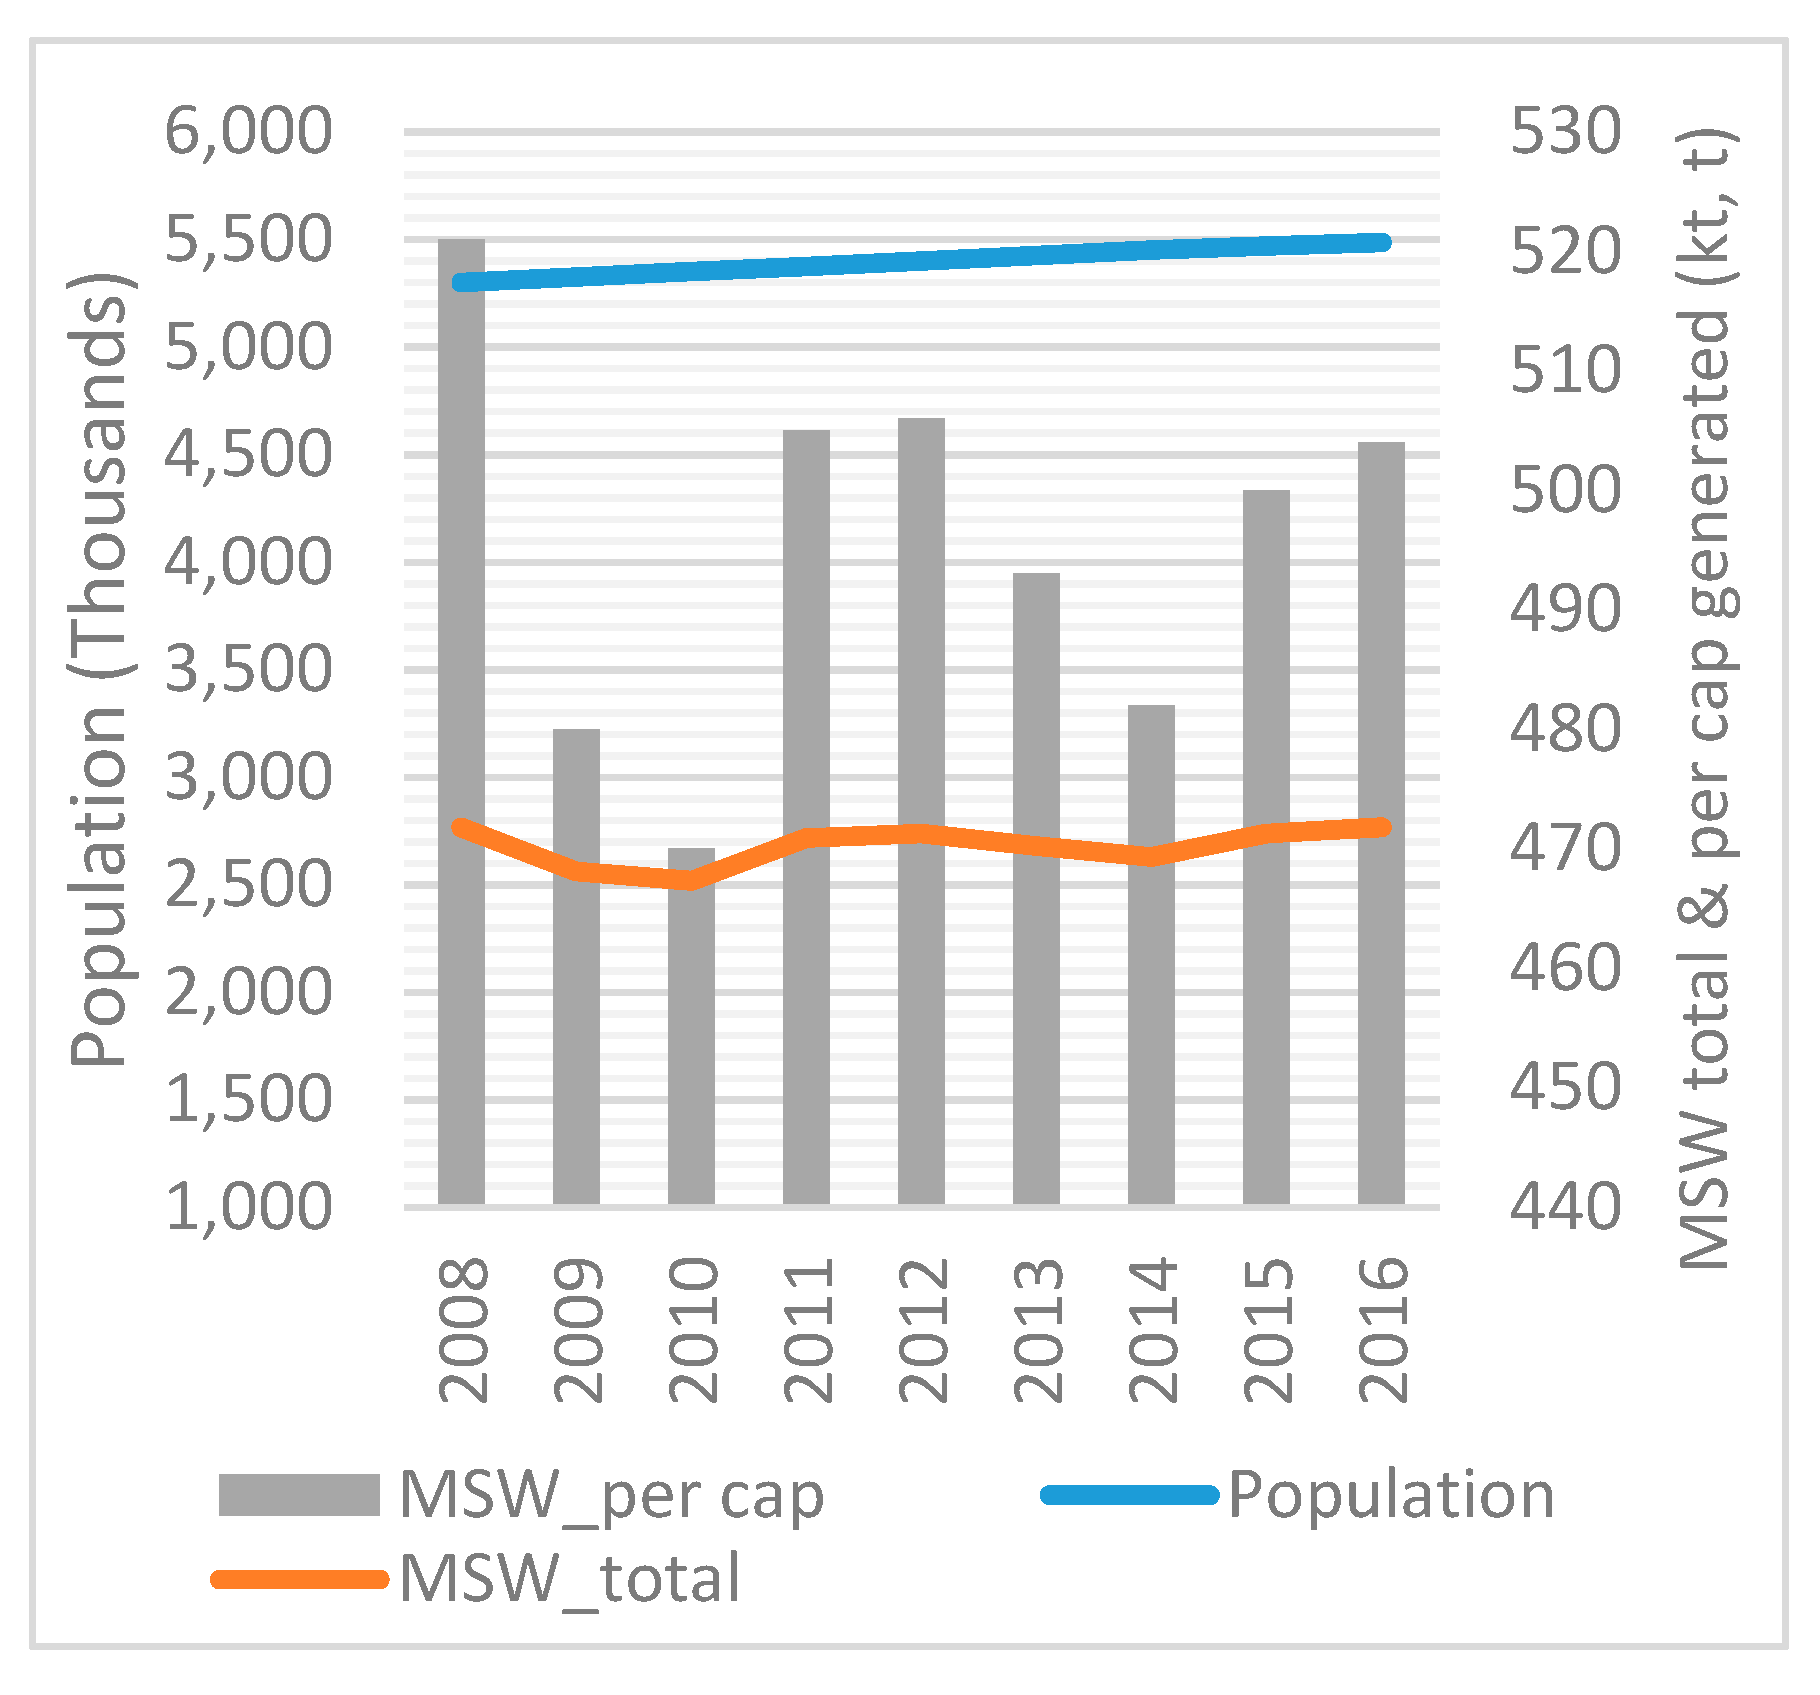
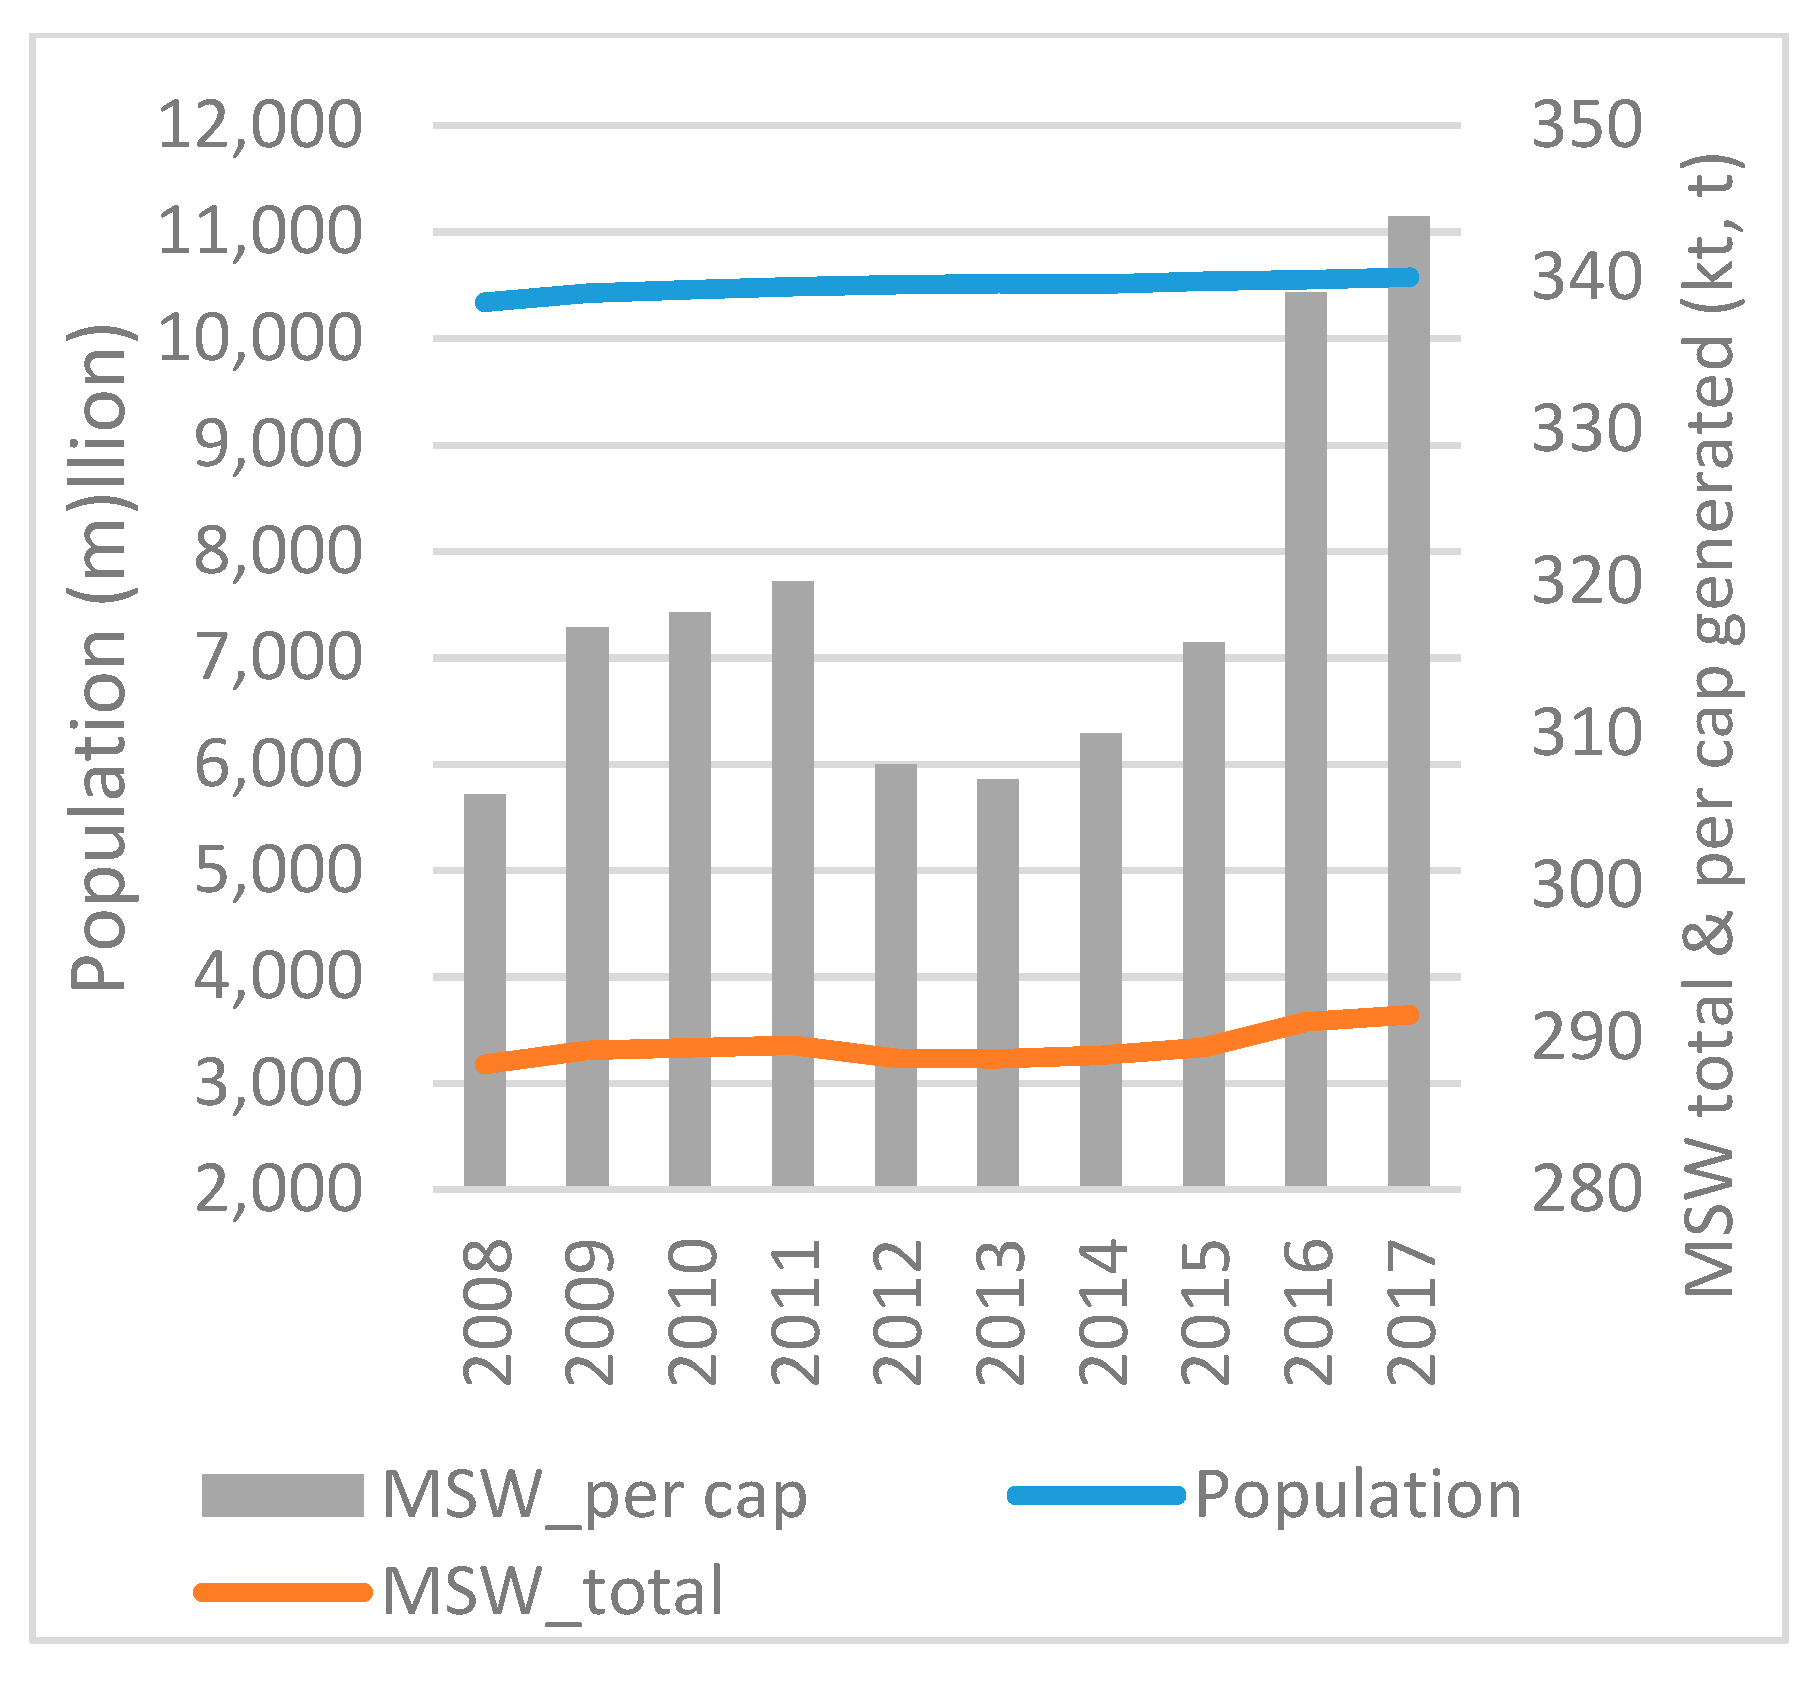
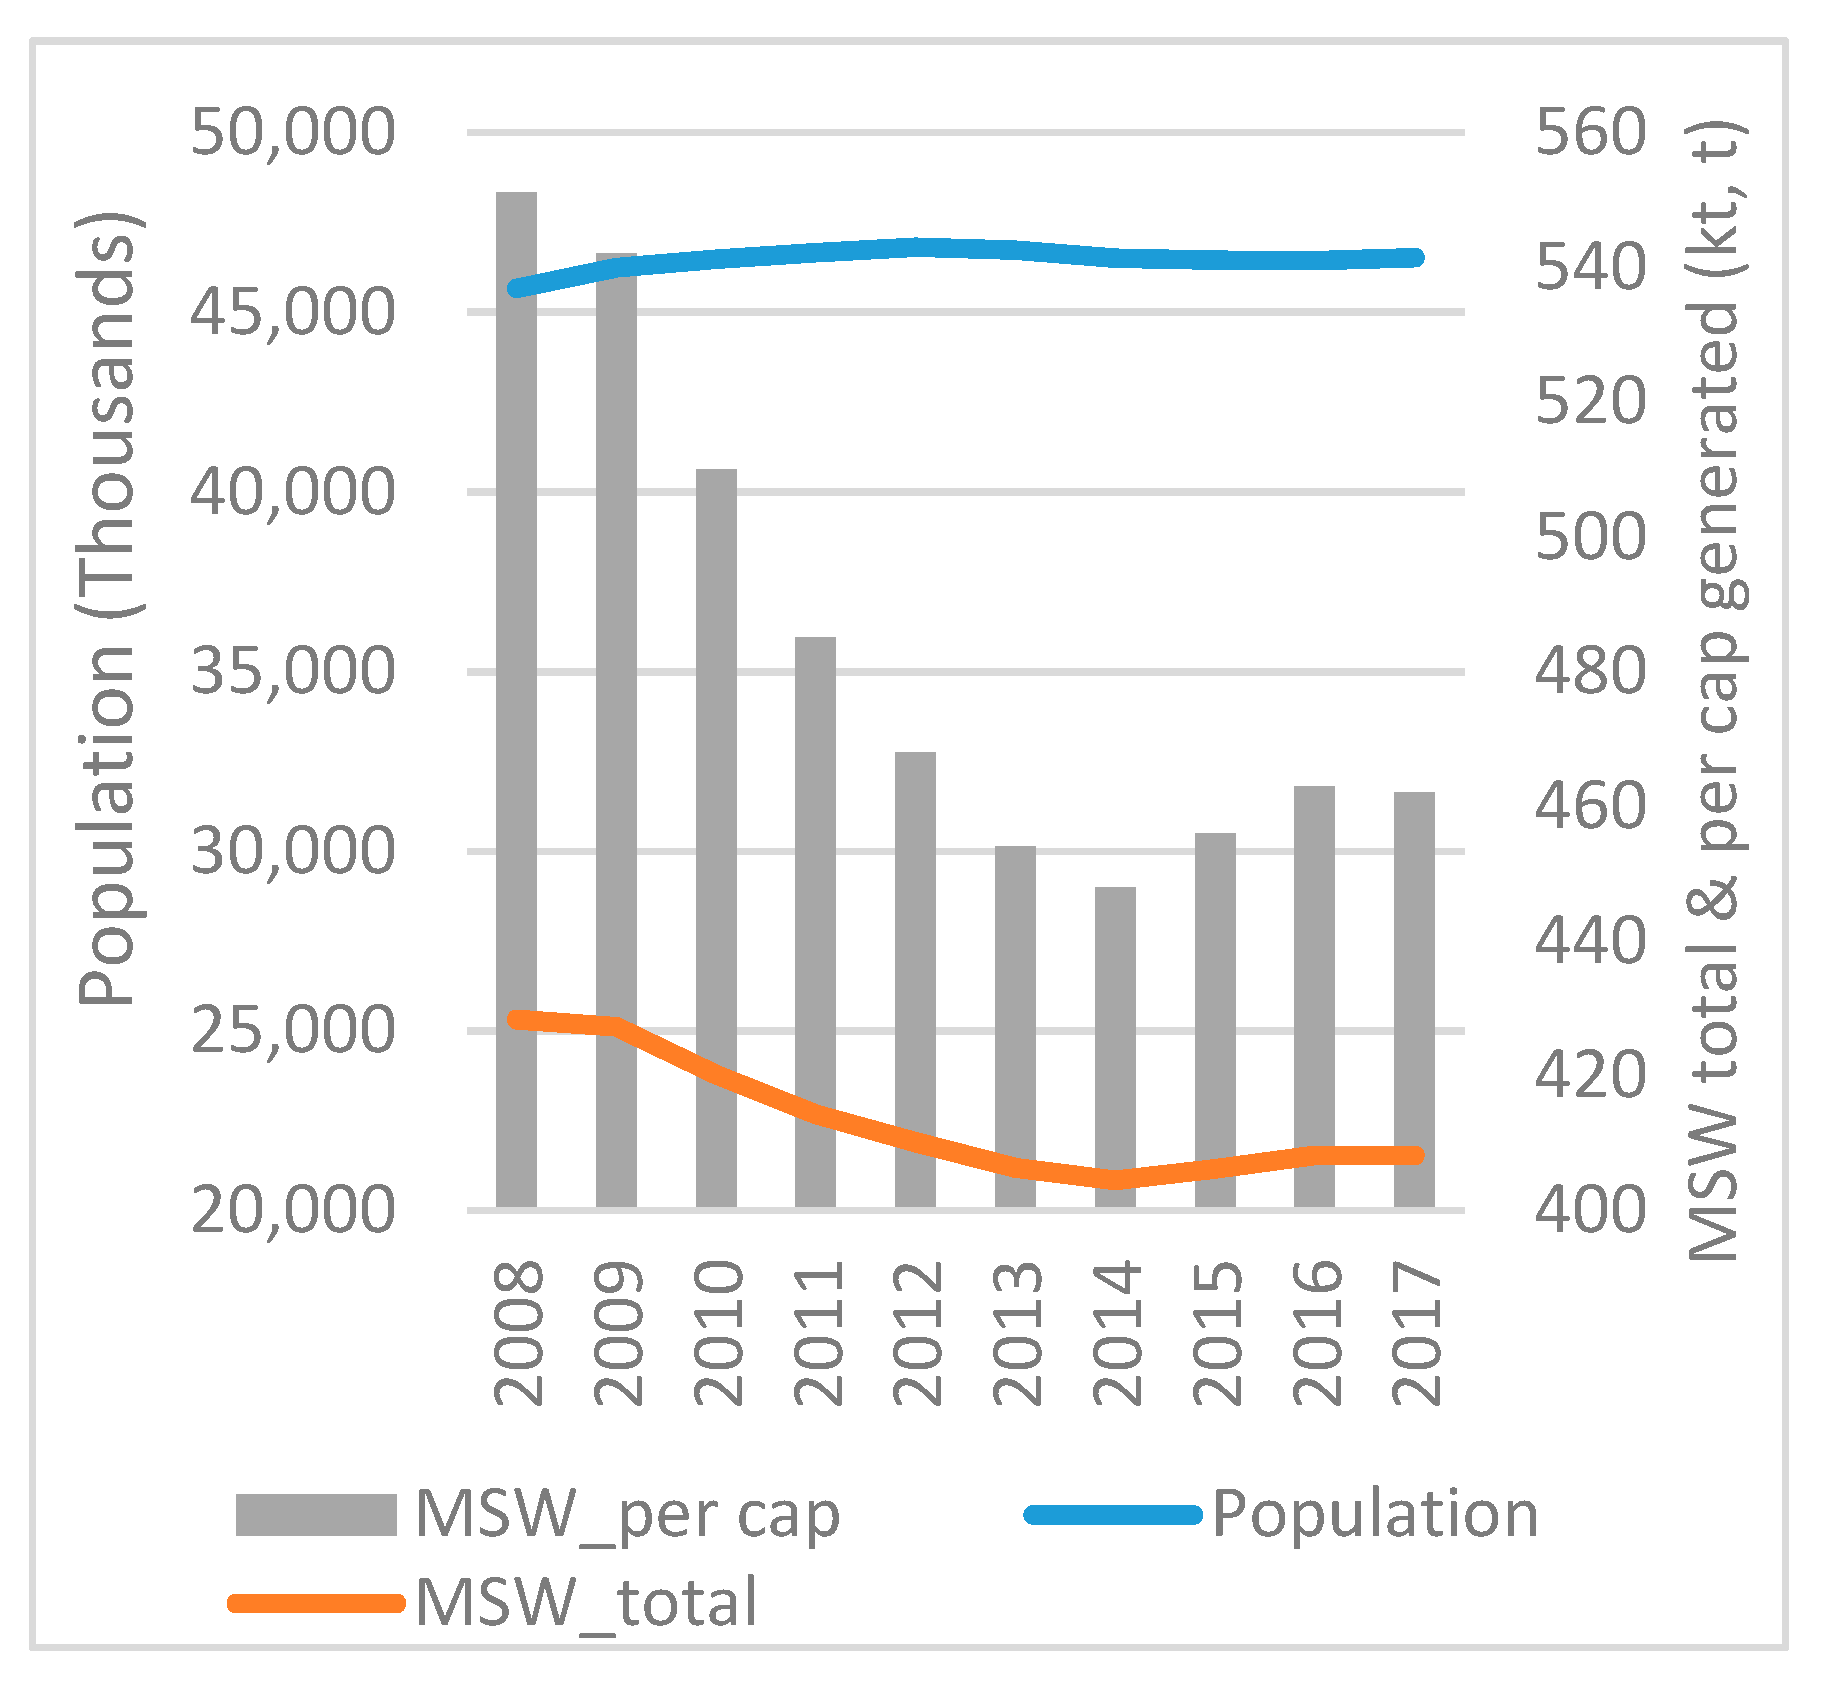
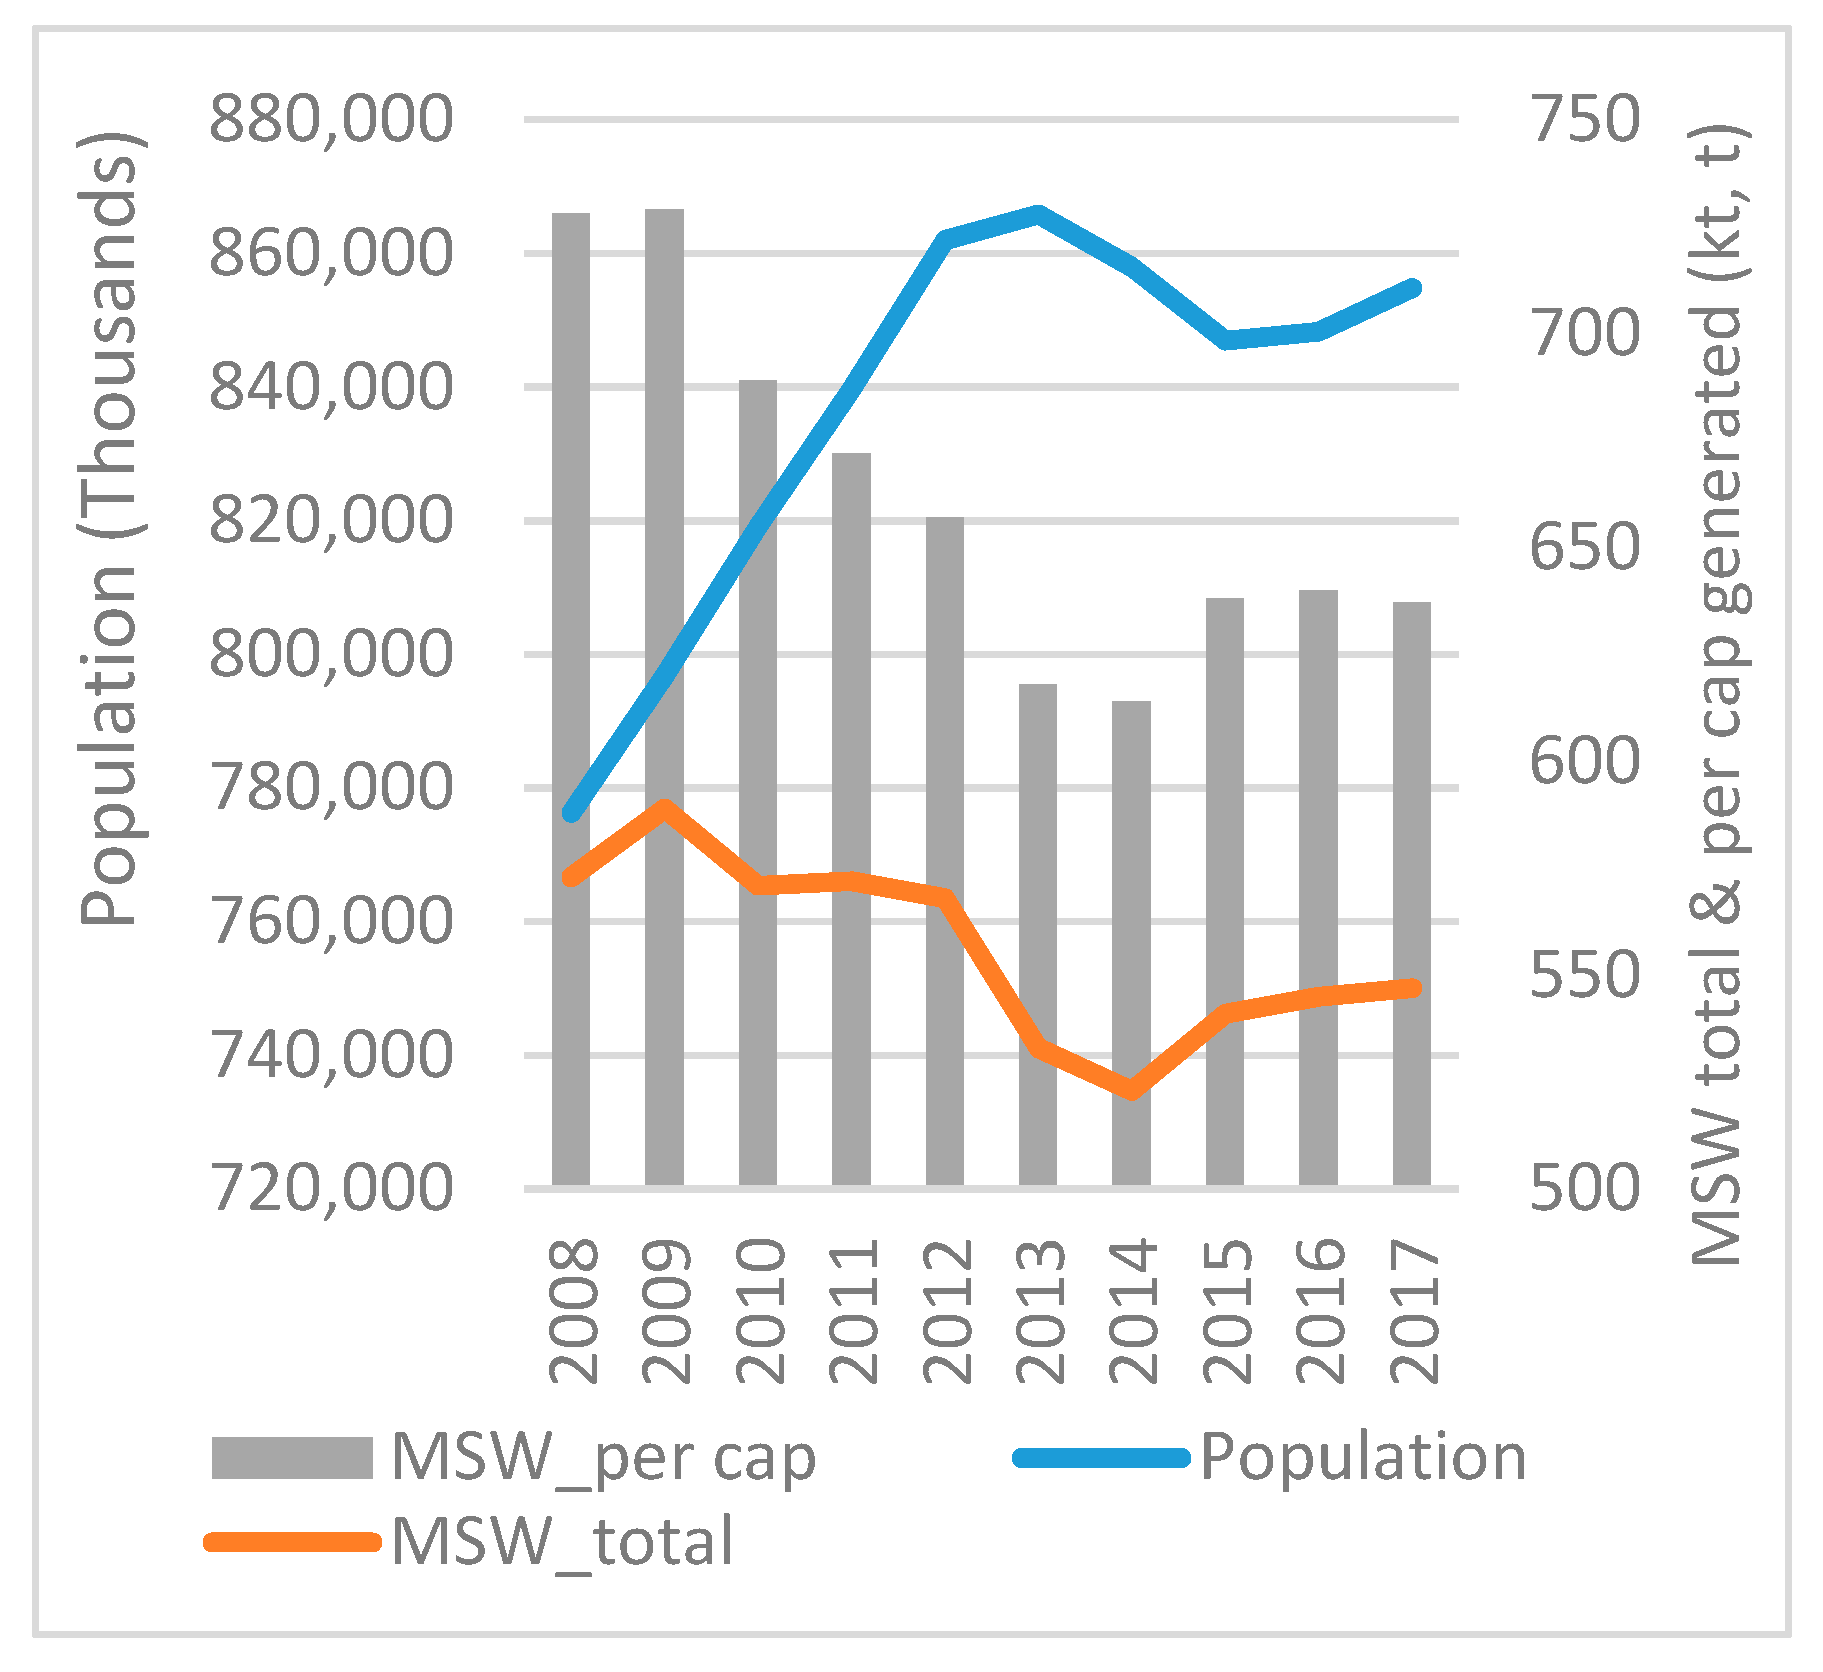
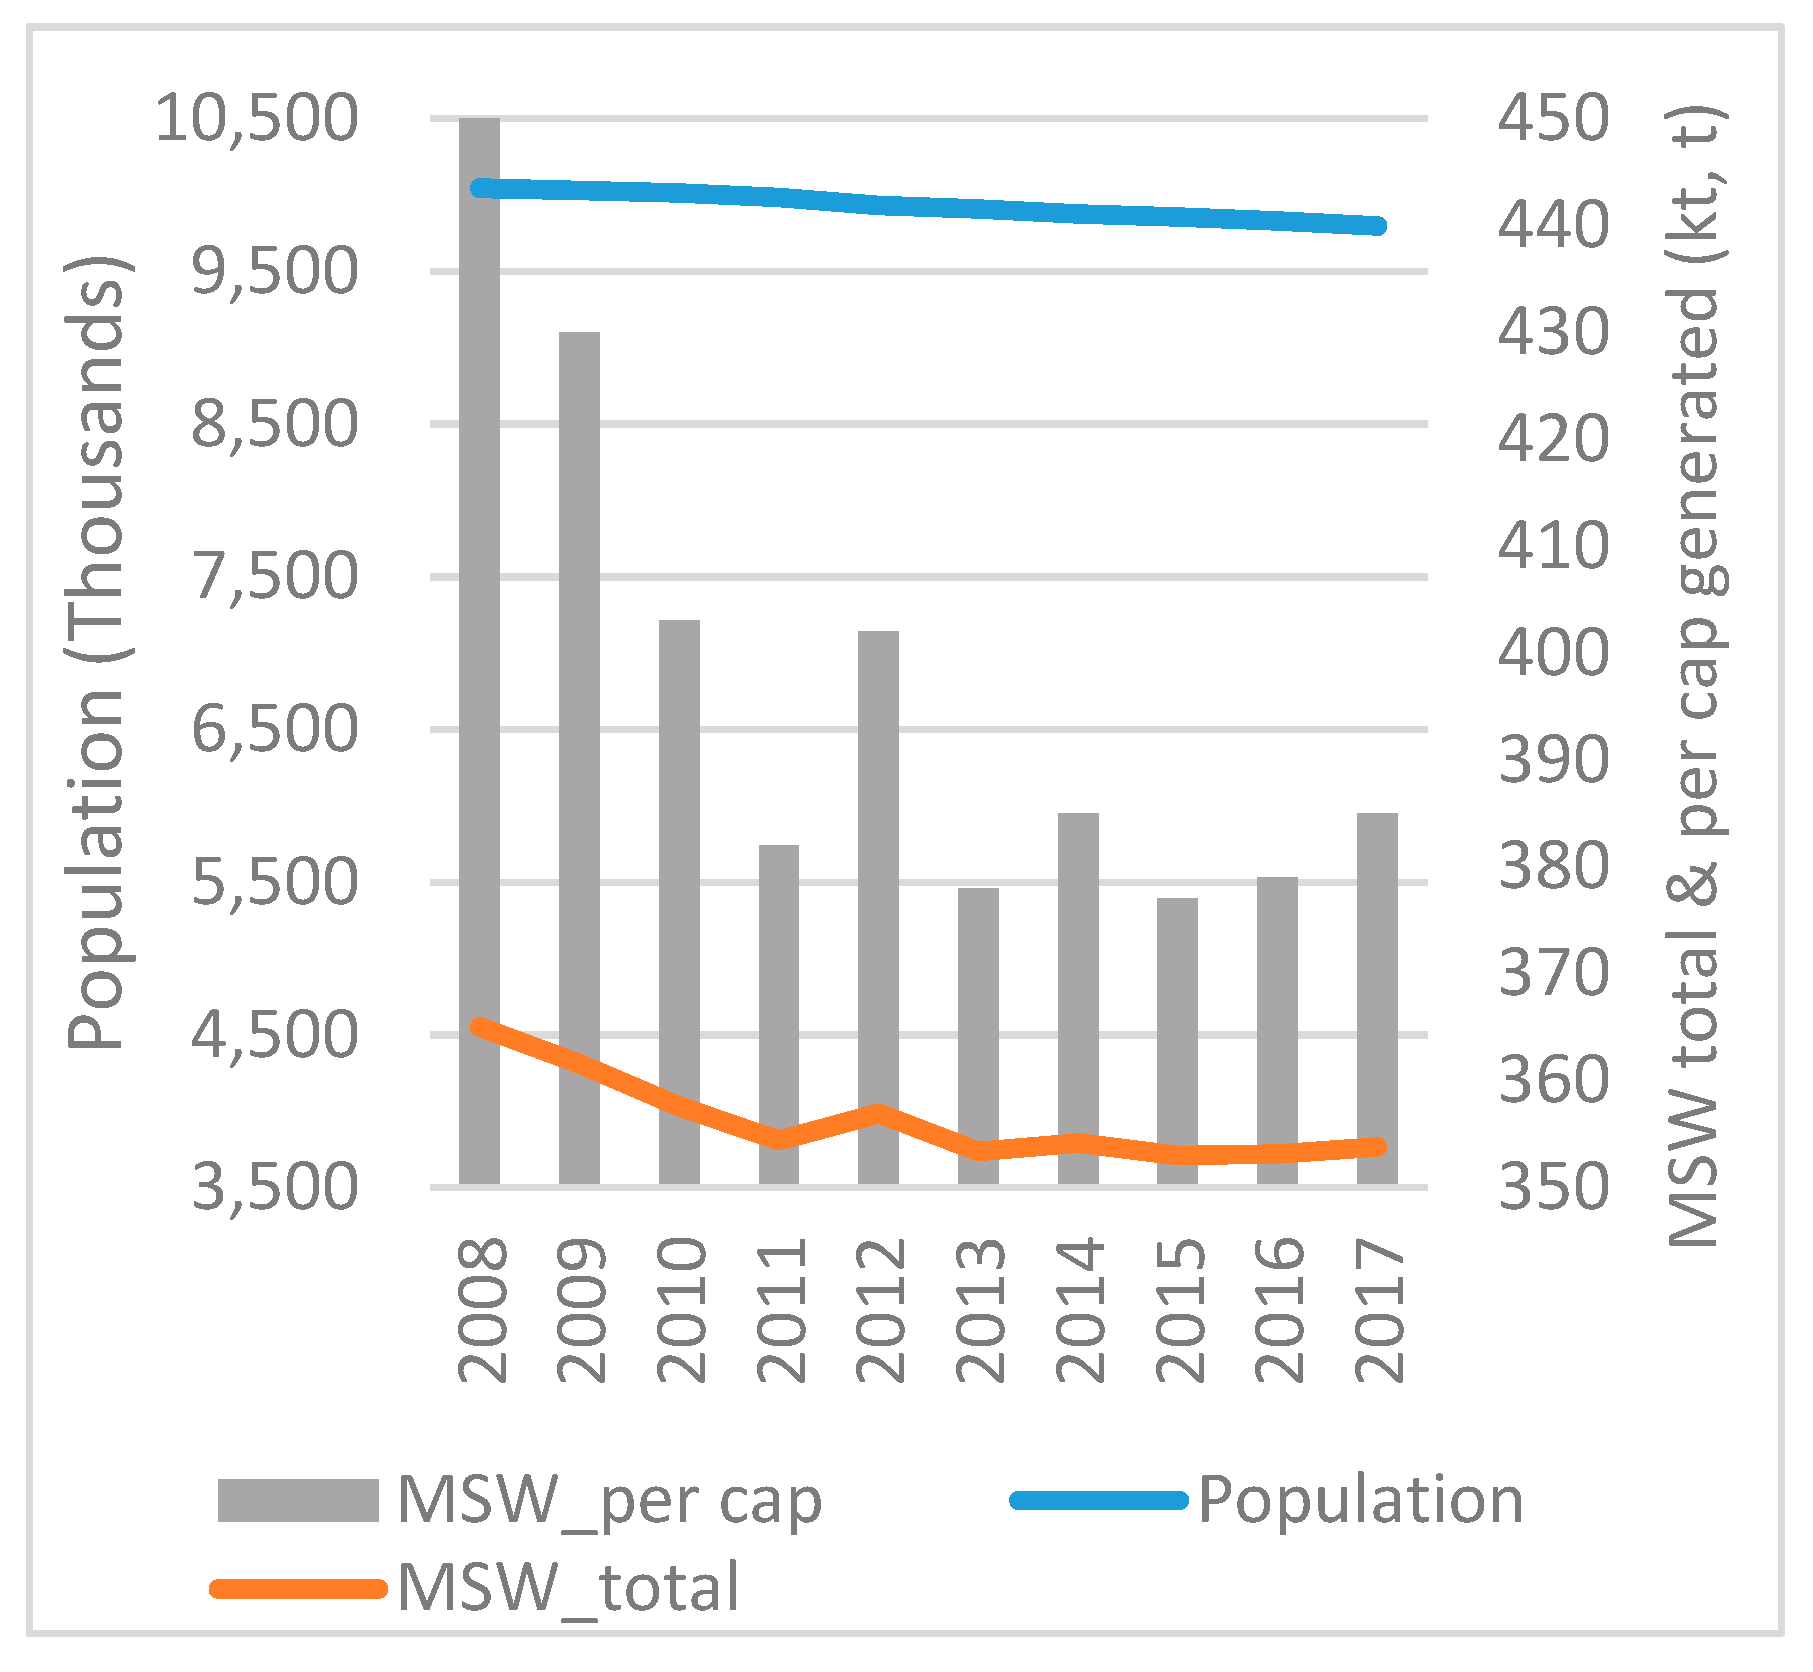
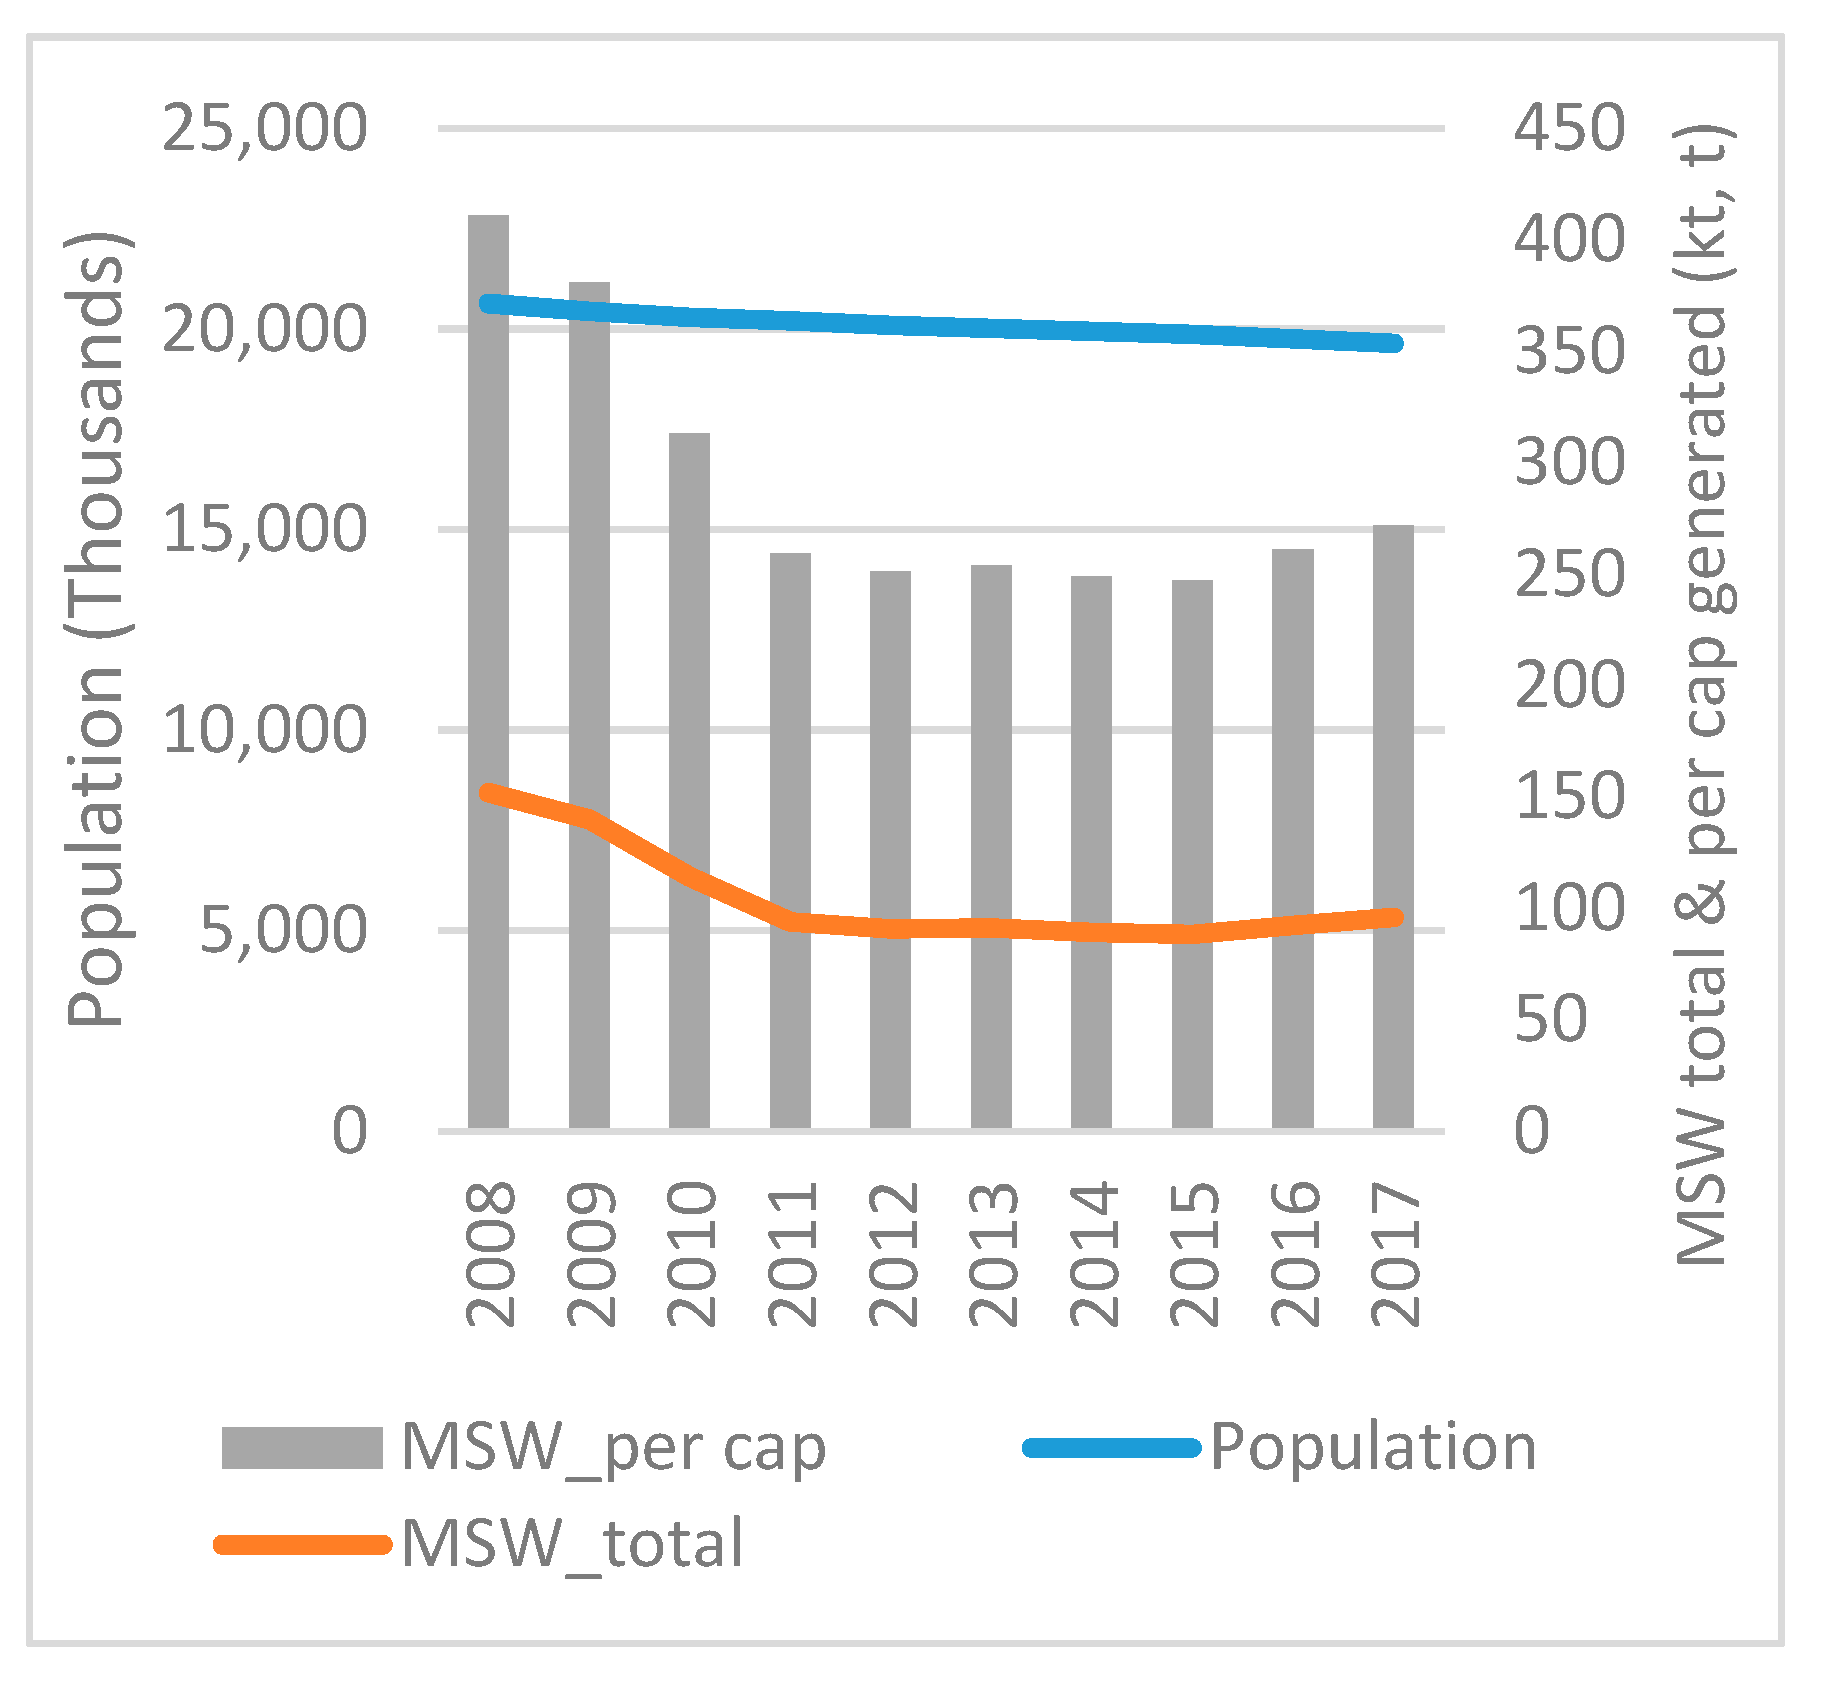
Belgium is one of the founding members of EU28. The amount of MSW in the country, for the given time period, has decreased by over 11%, while population has increased by over 7%. The amount of MSW per capita has decreased by over 14% (
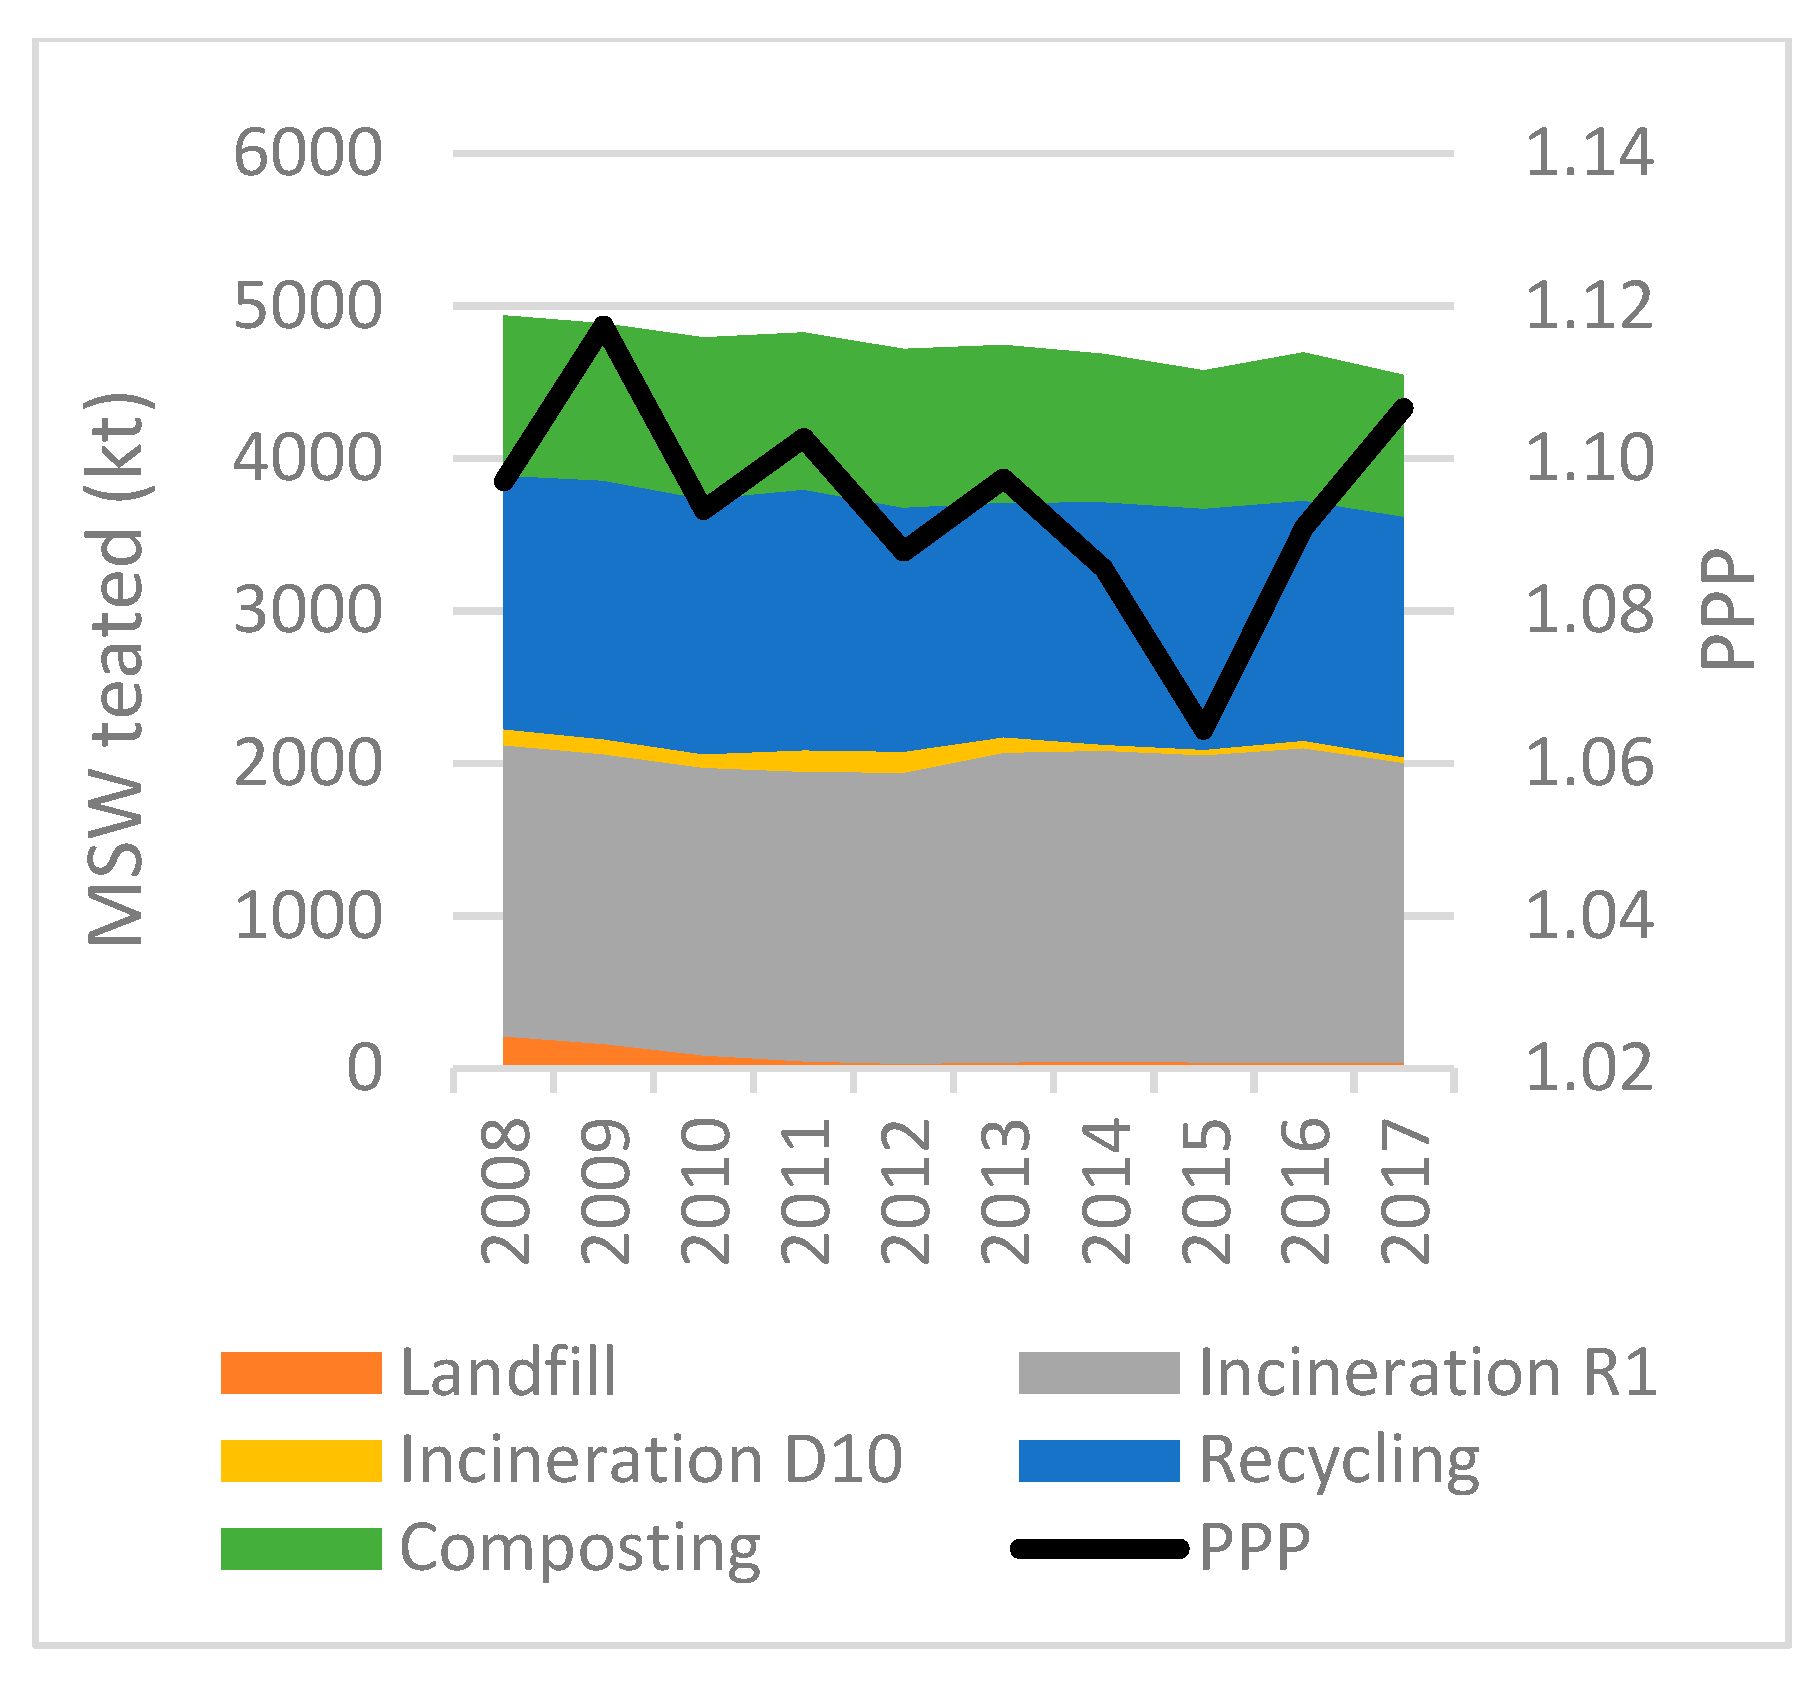
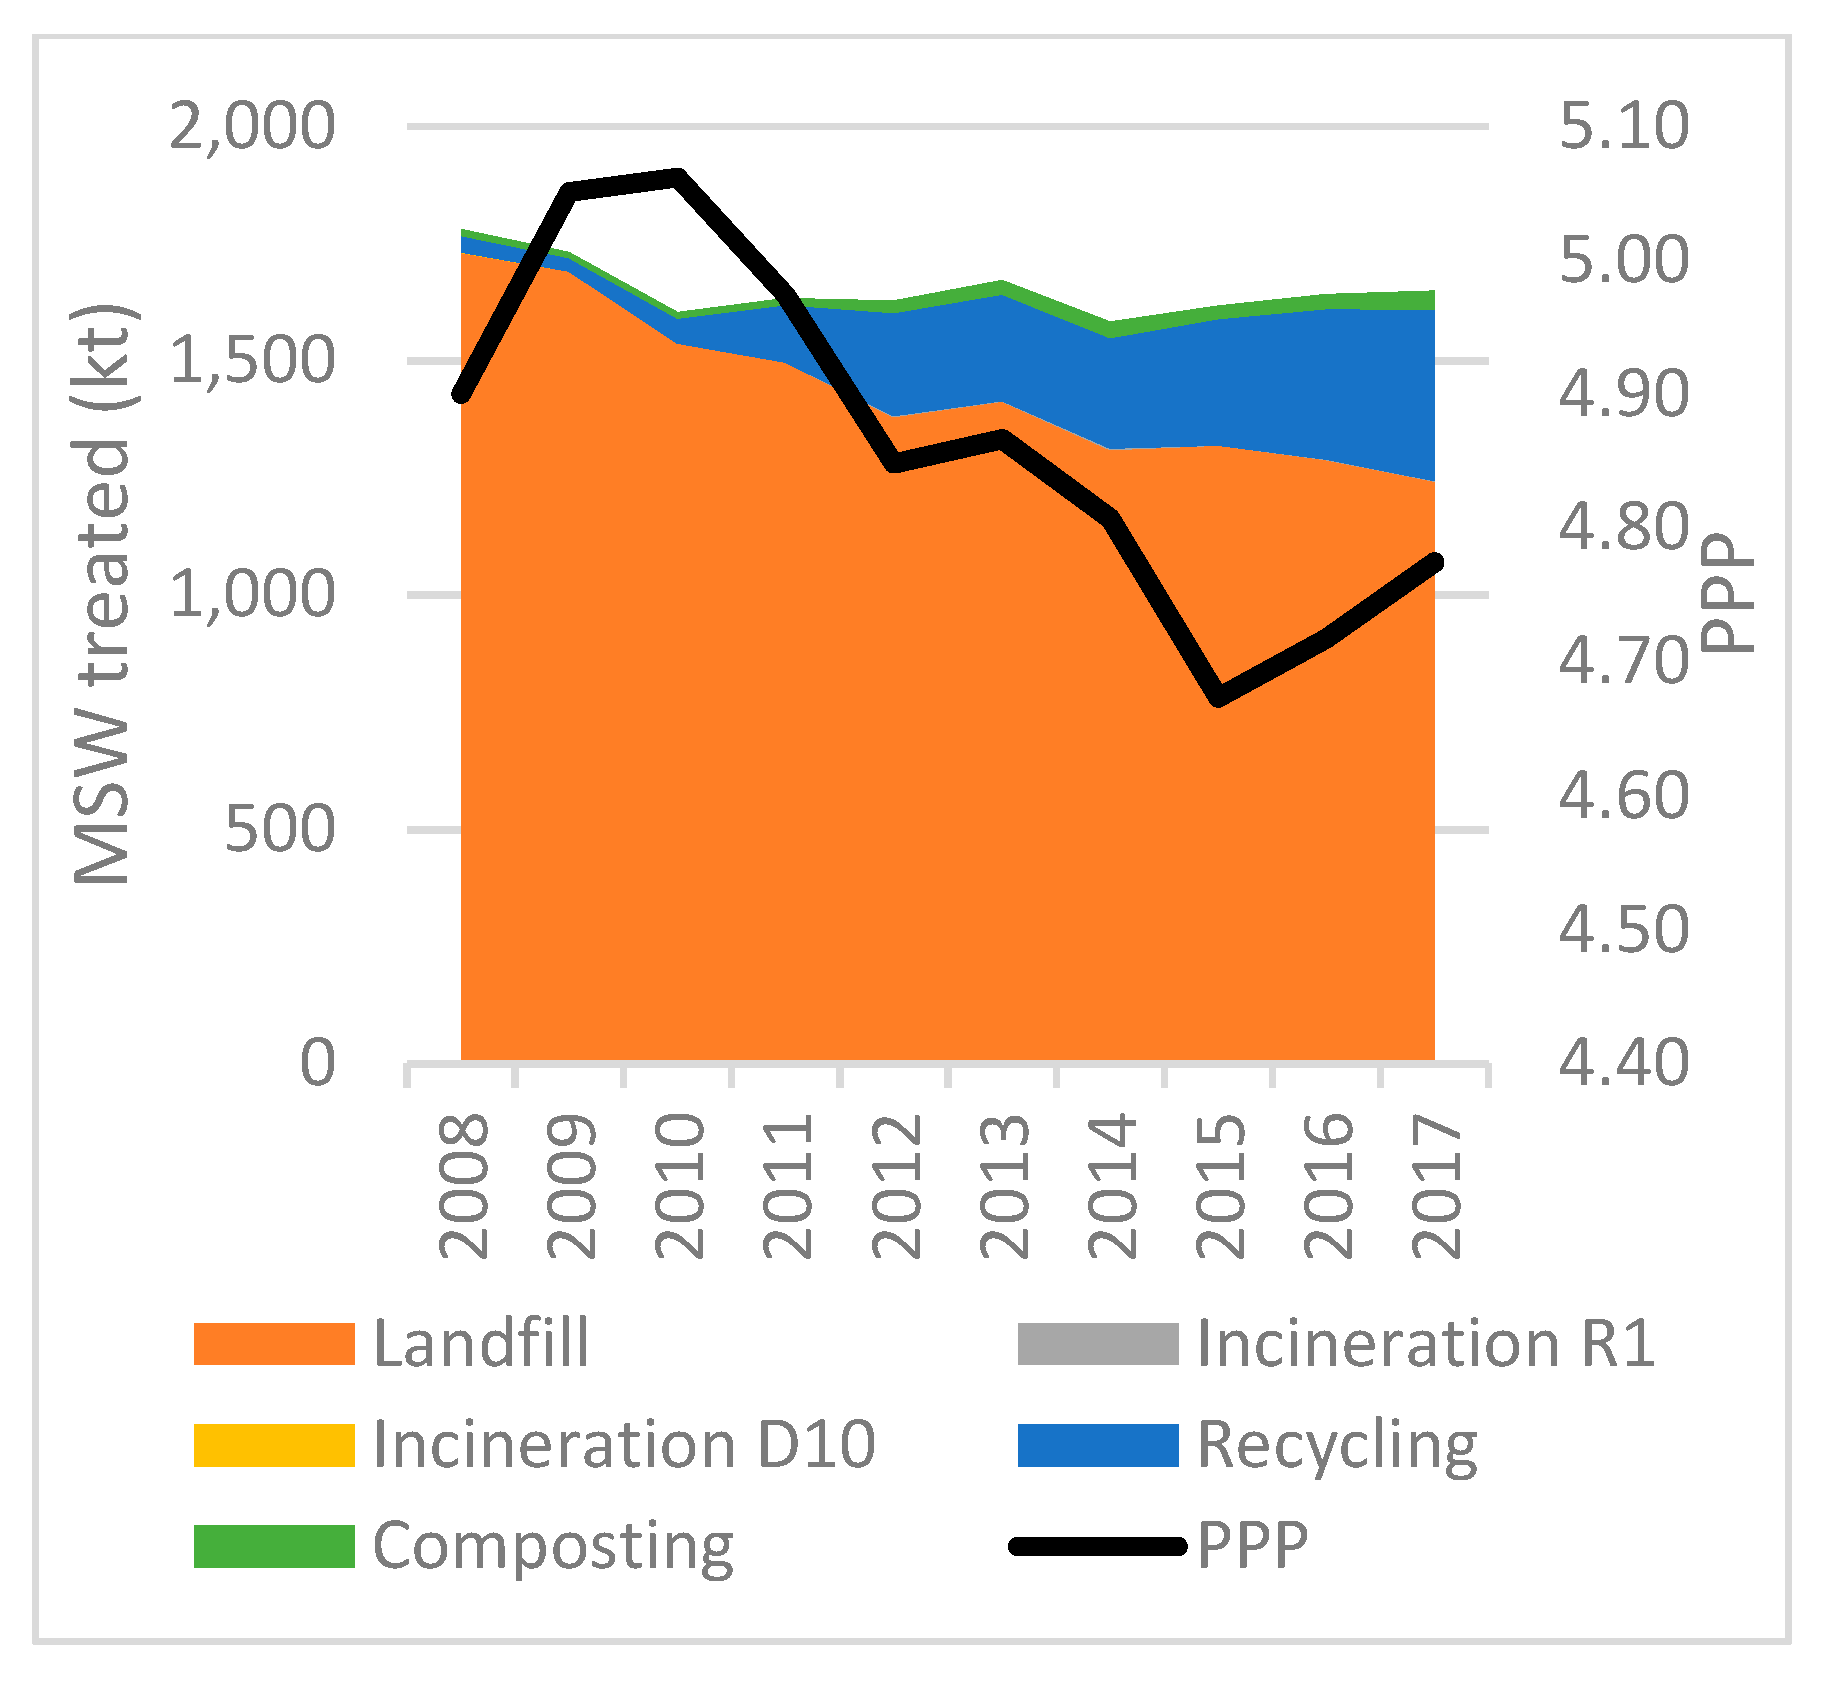
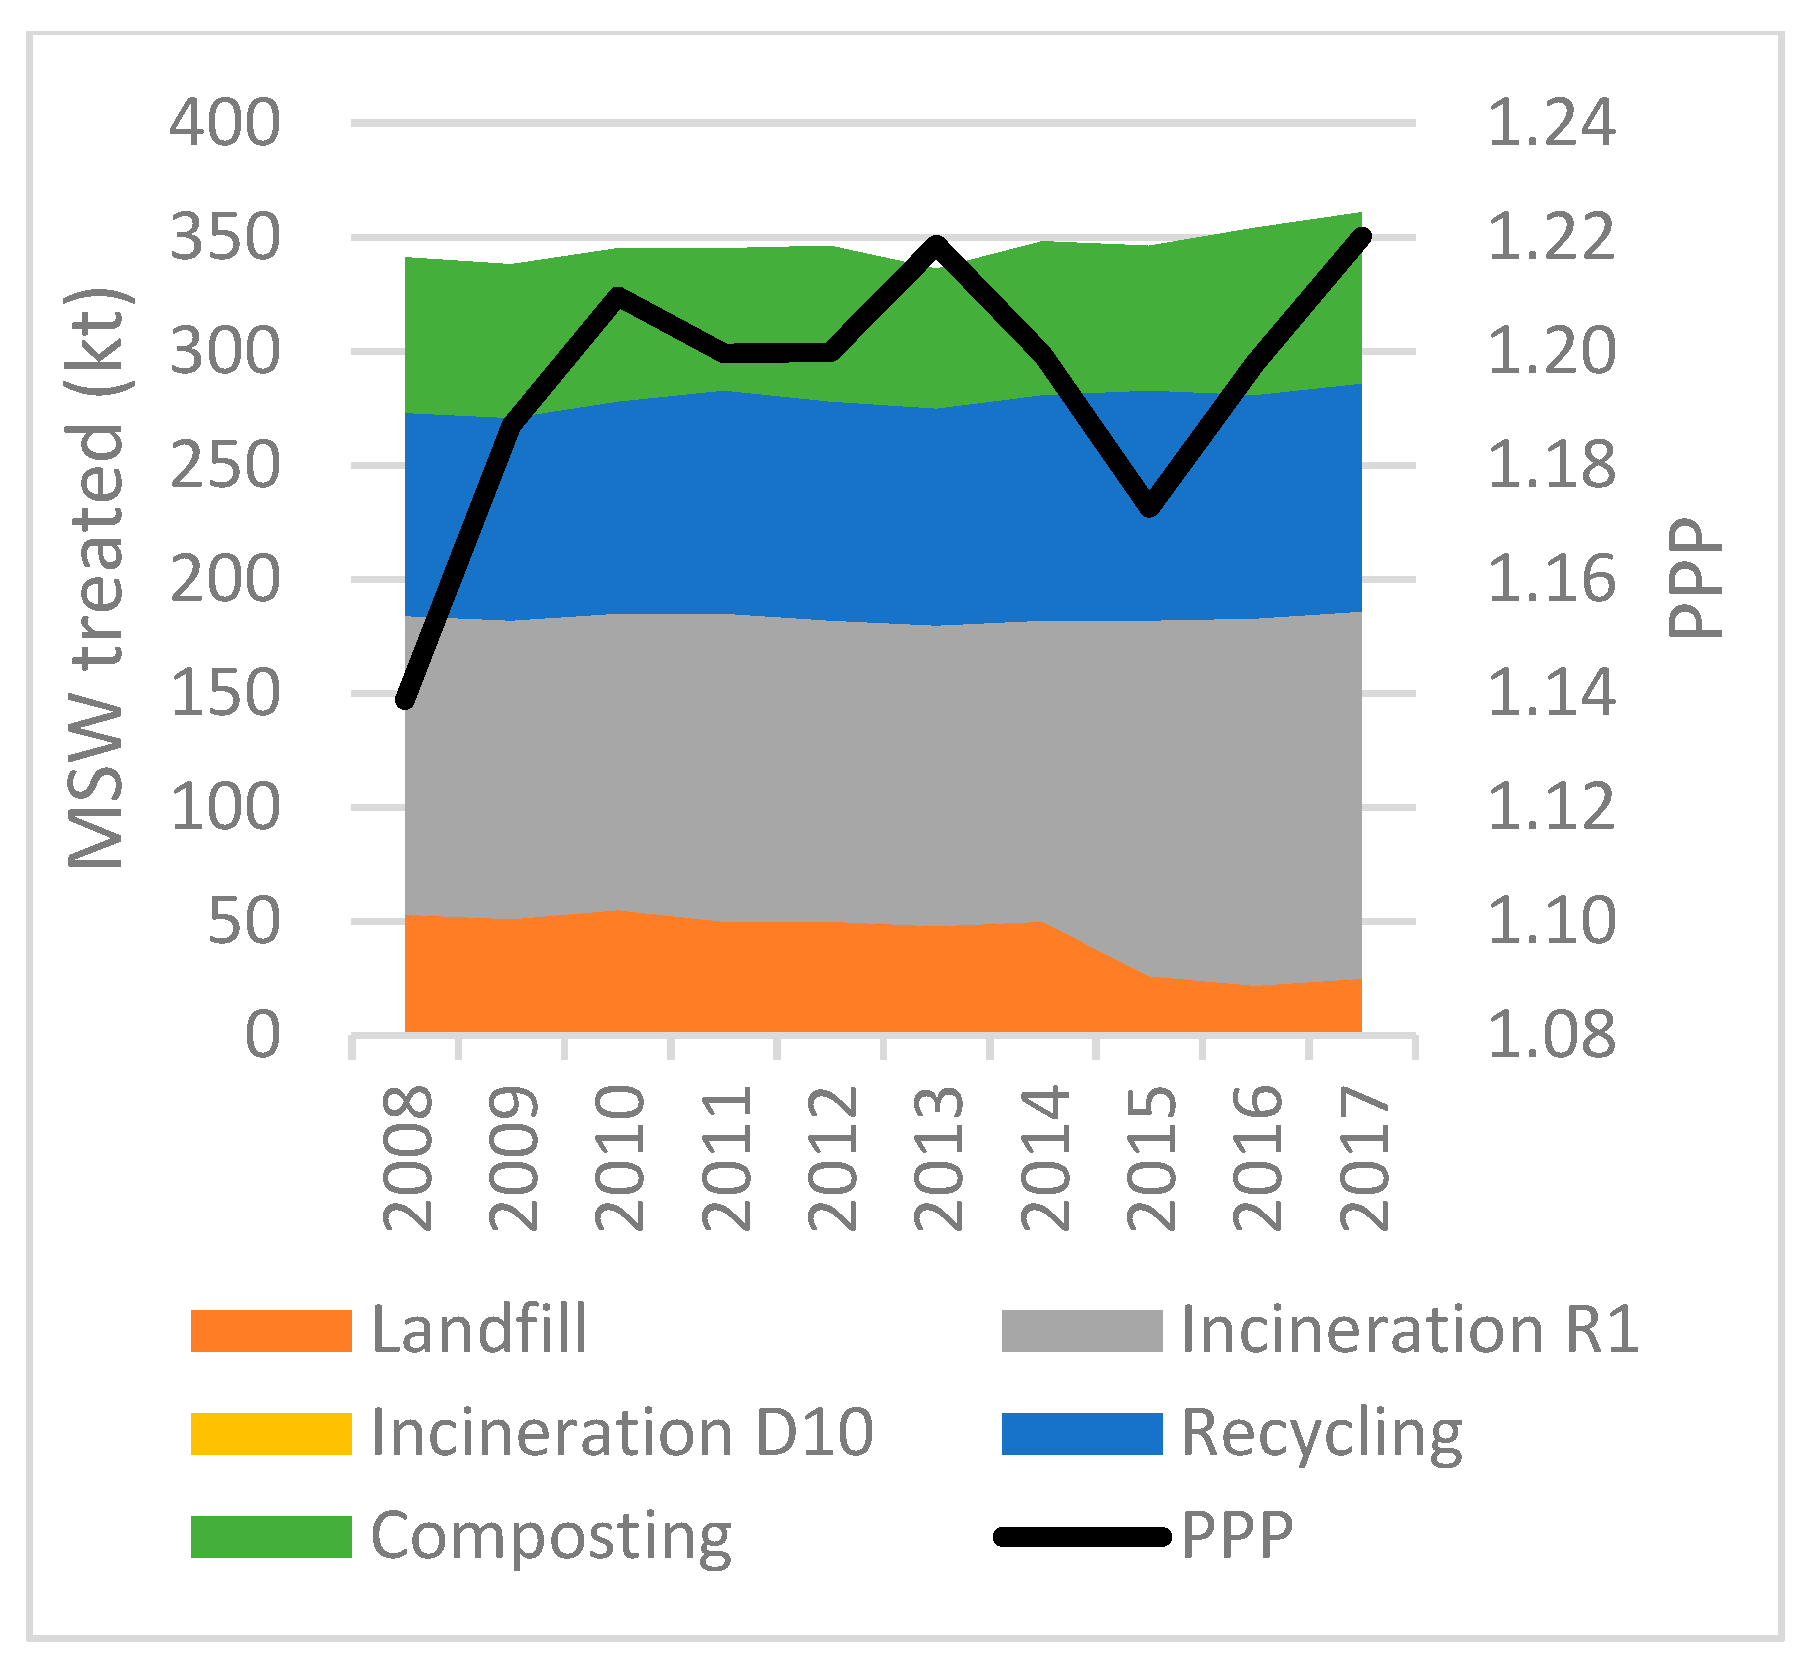
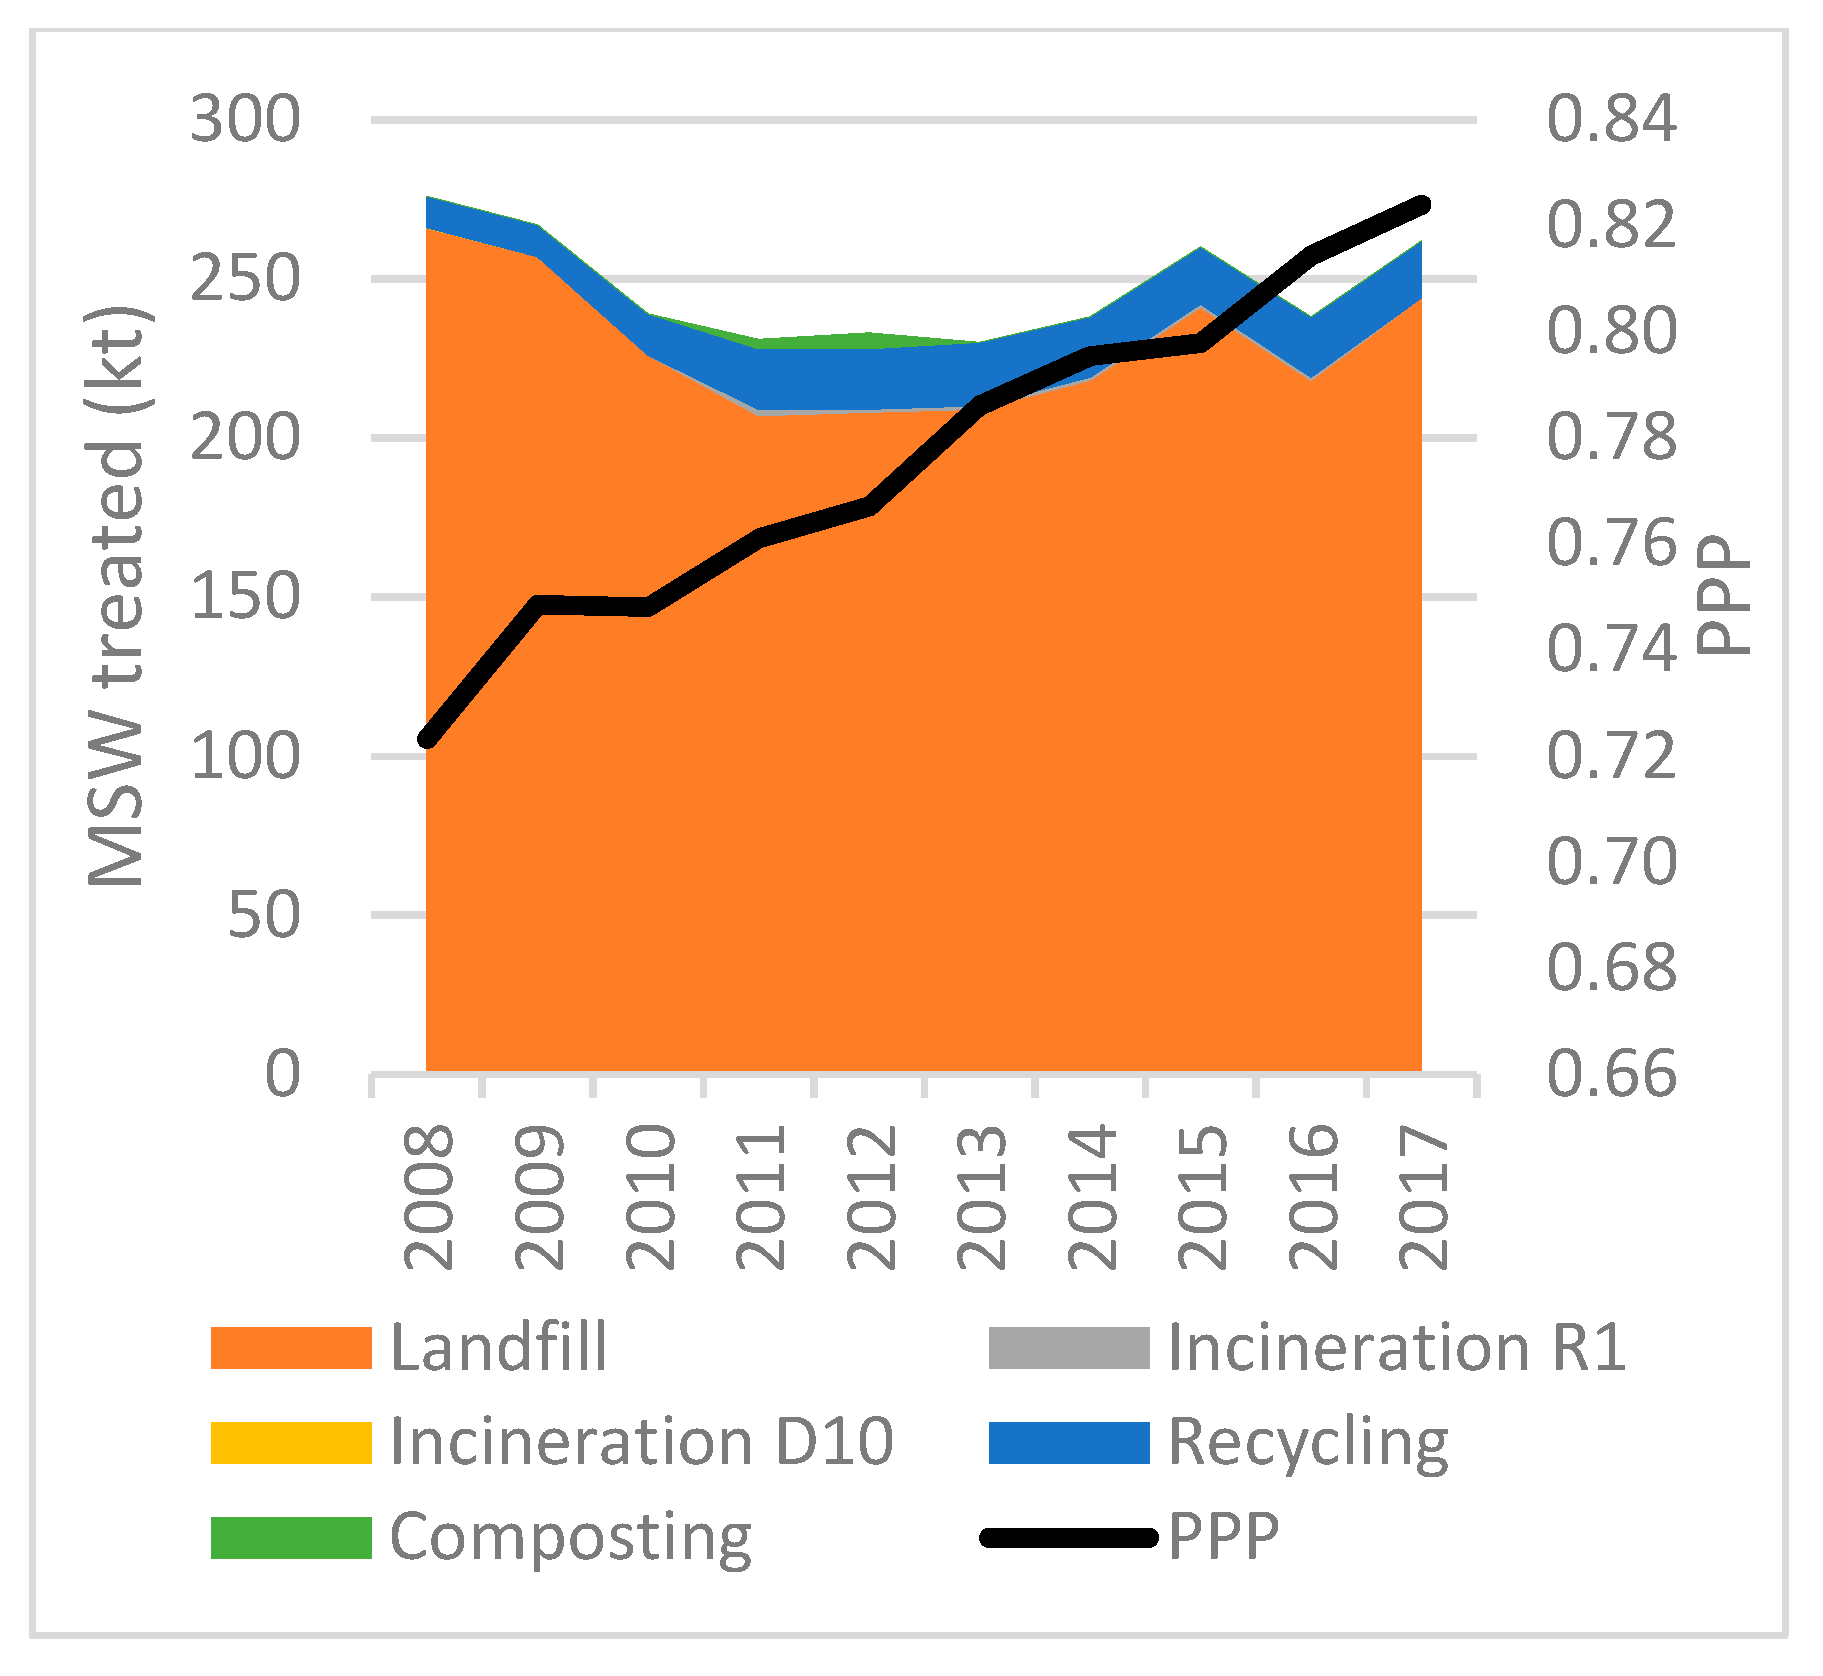
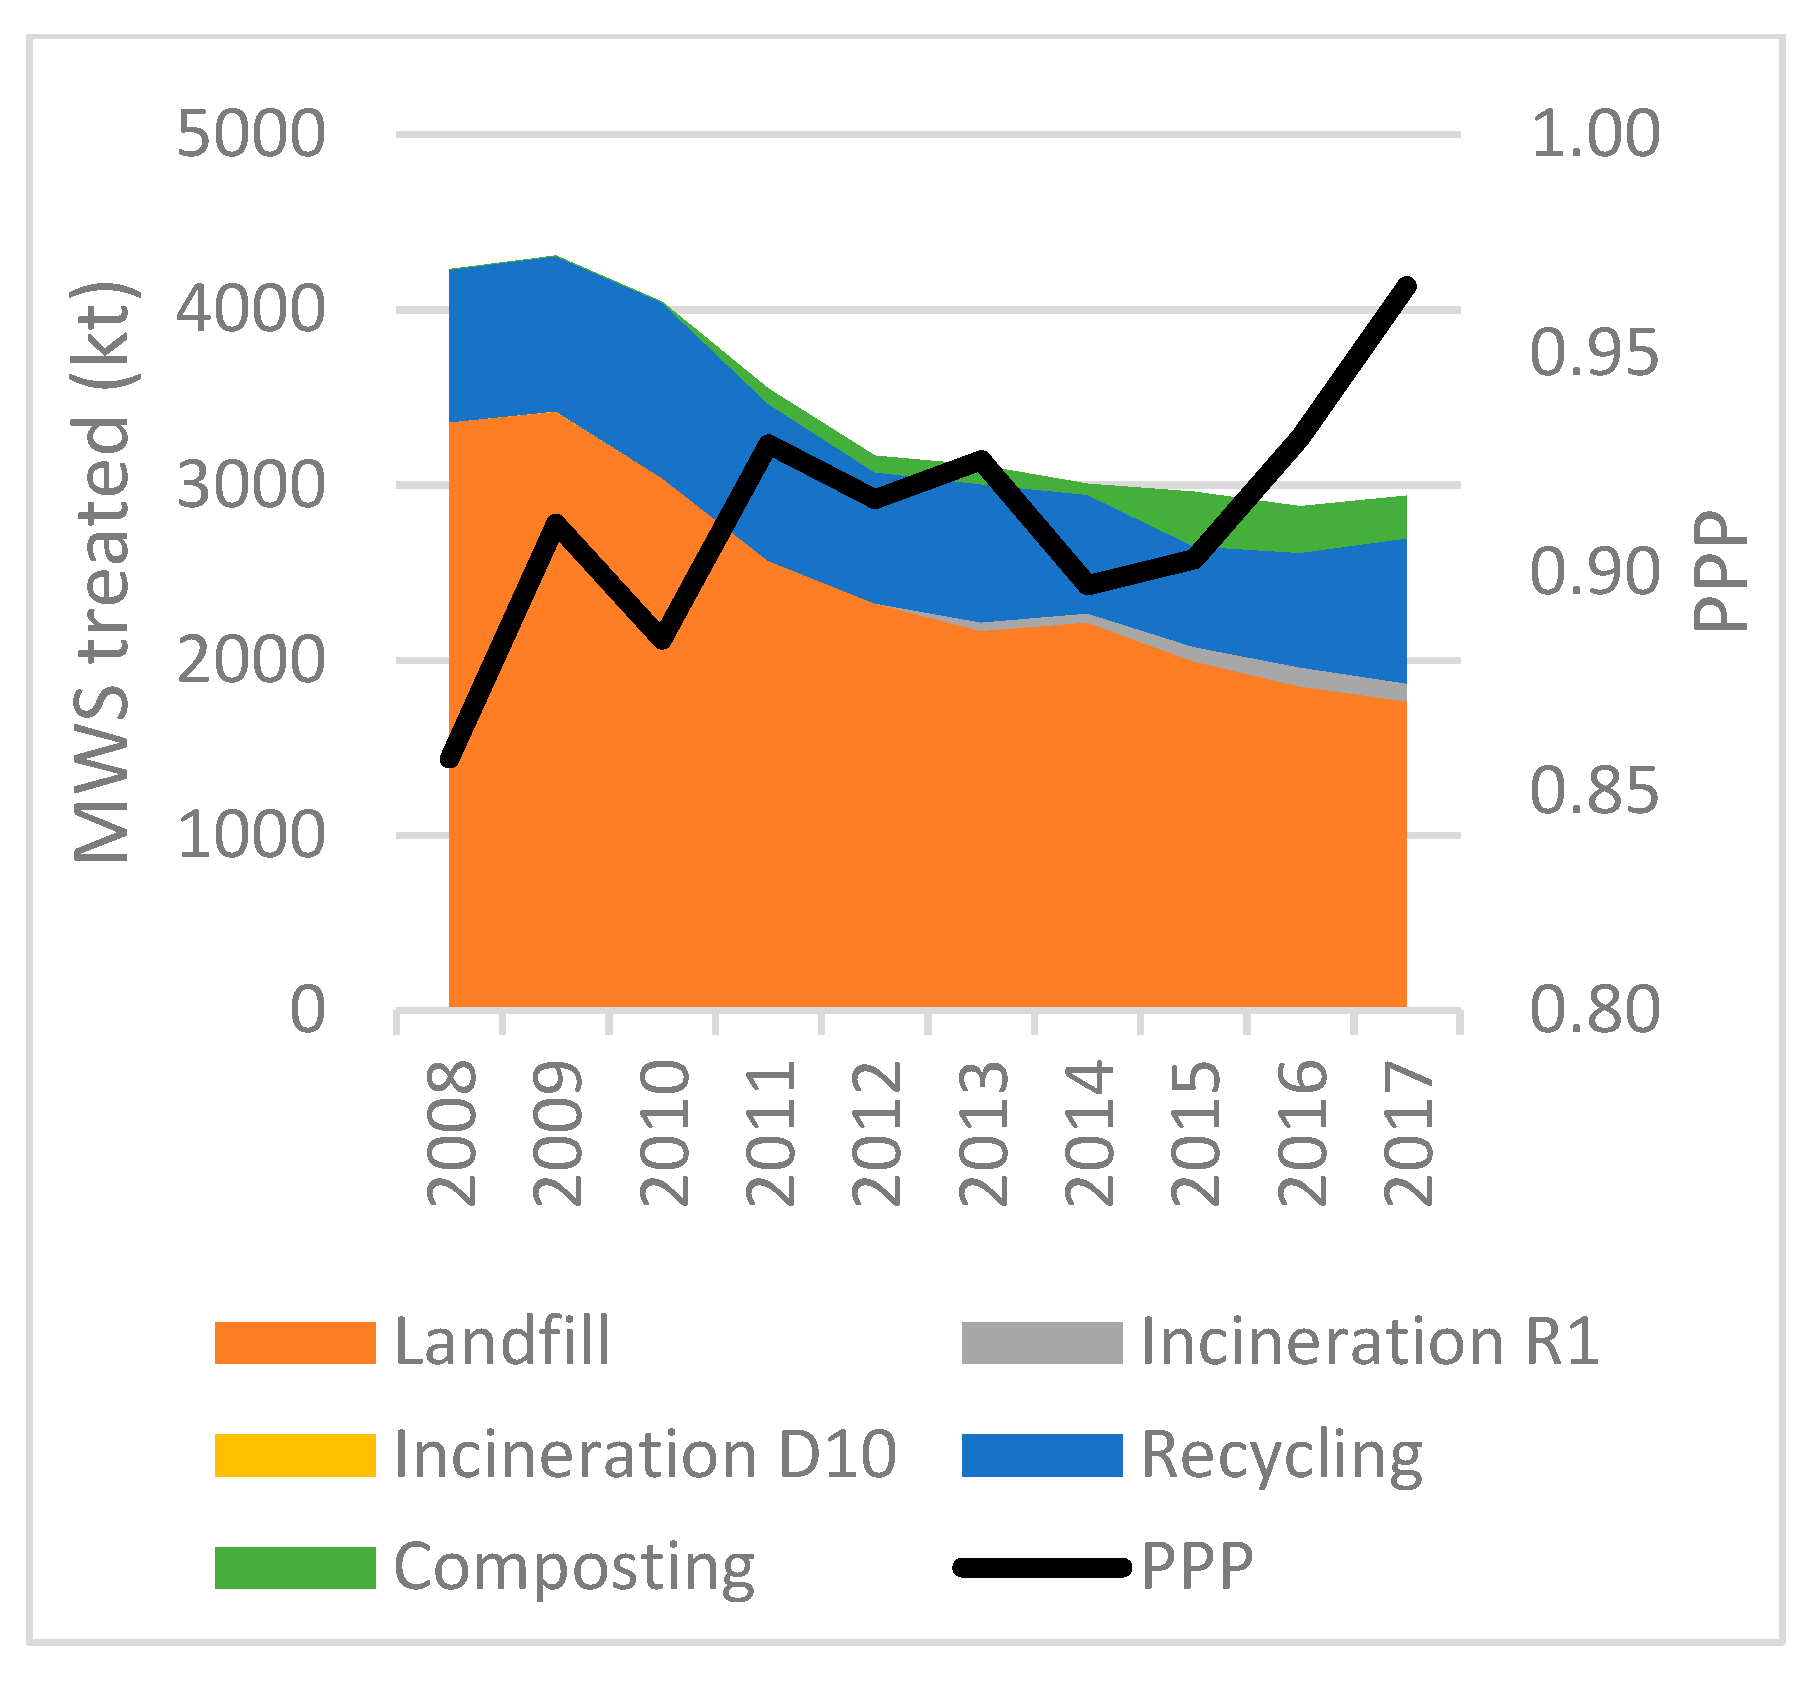
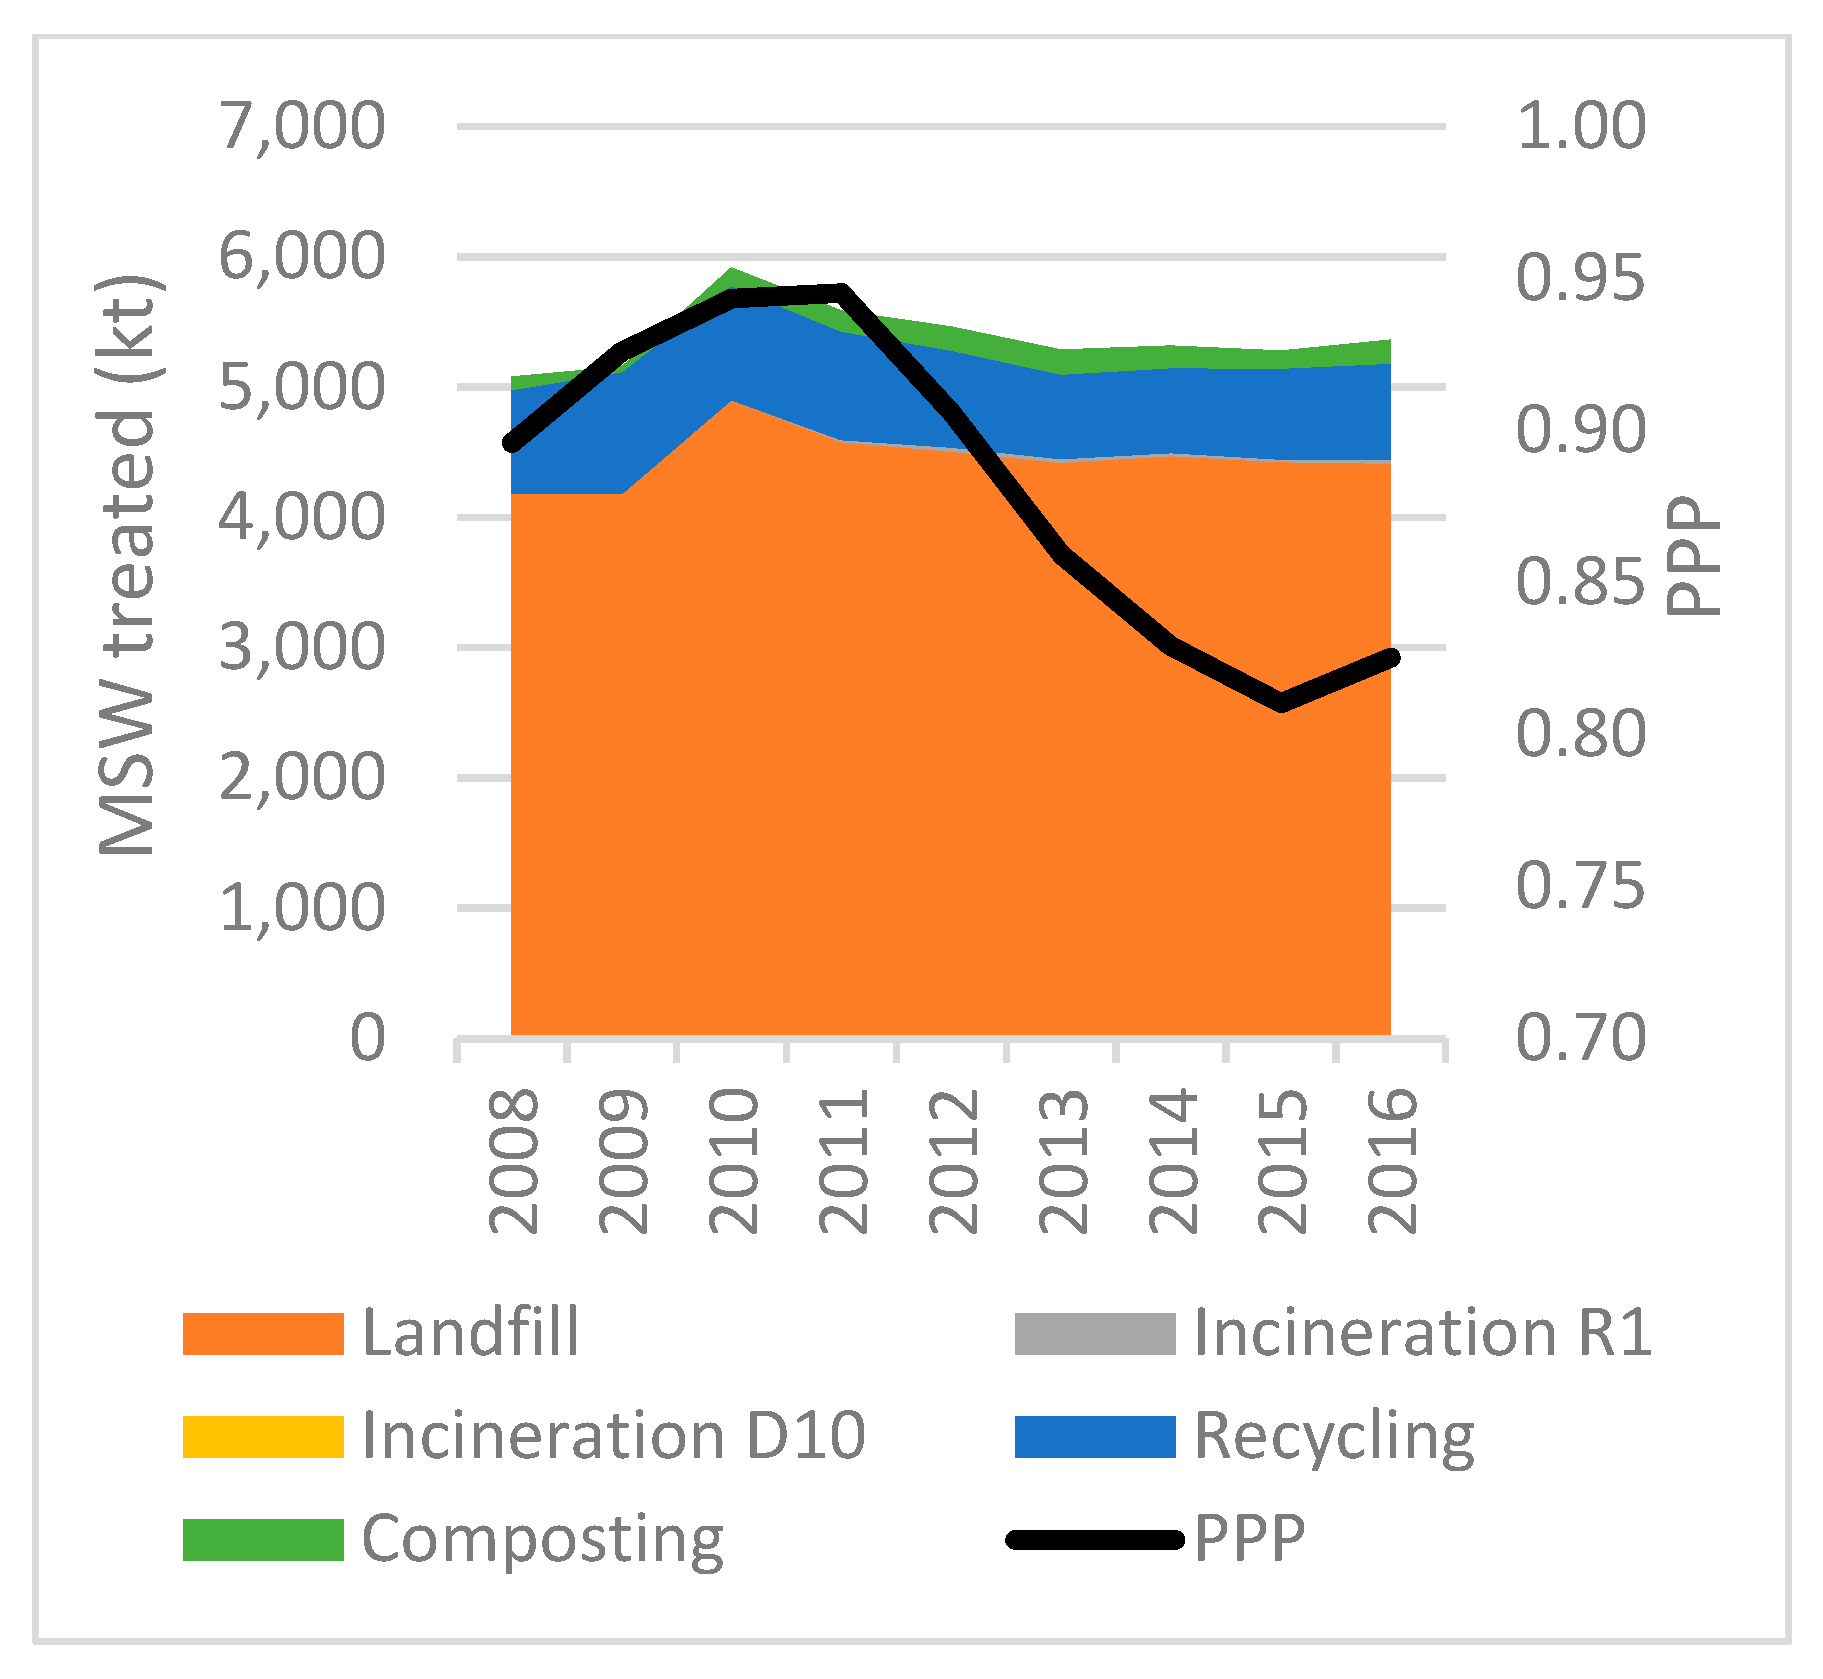
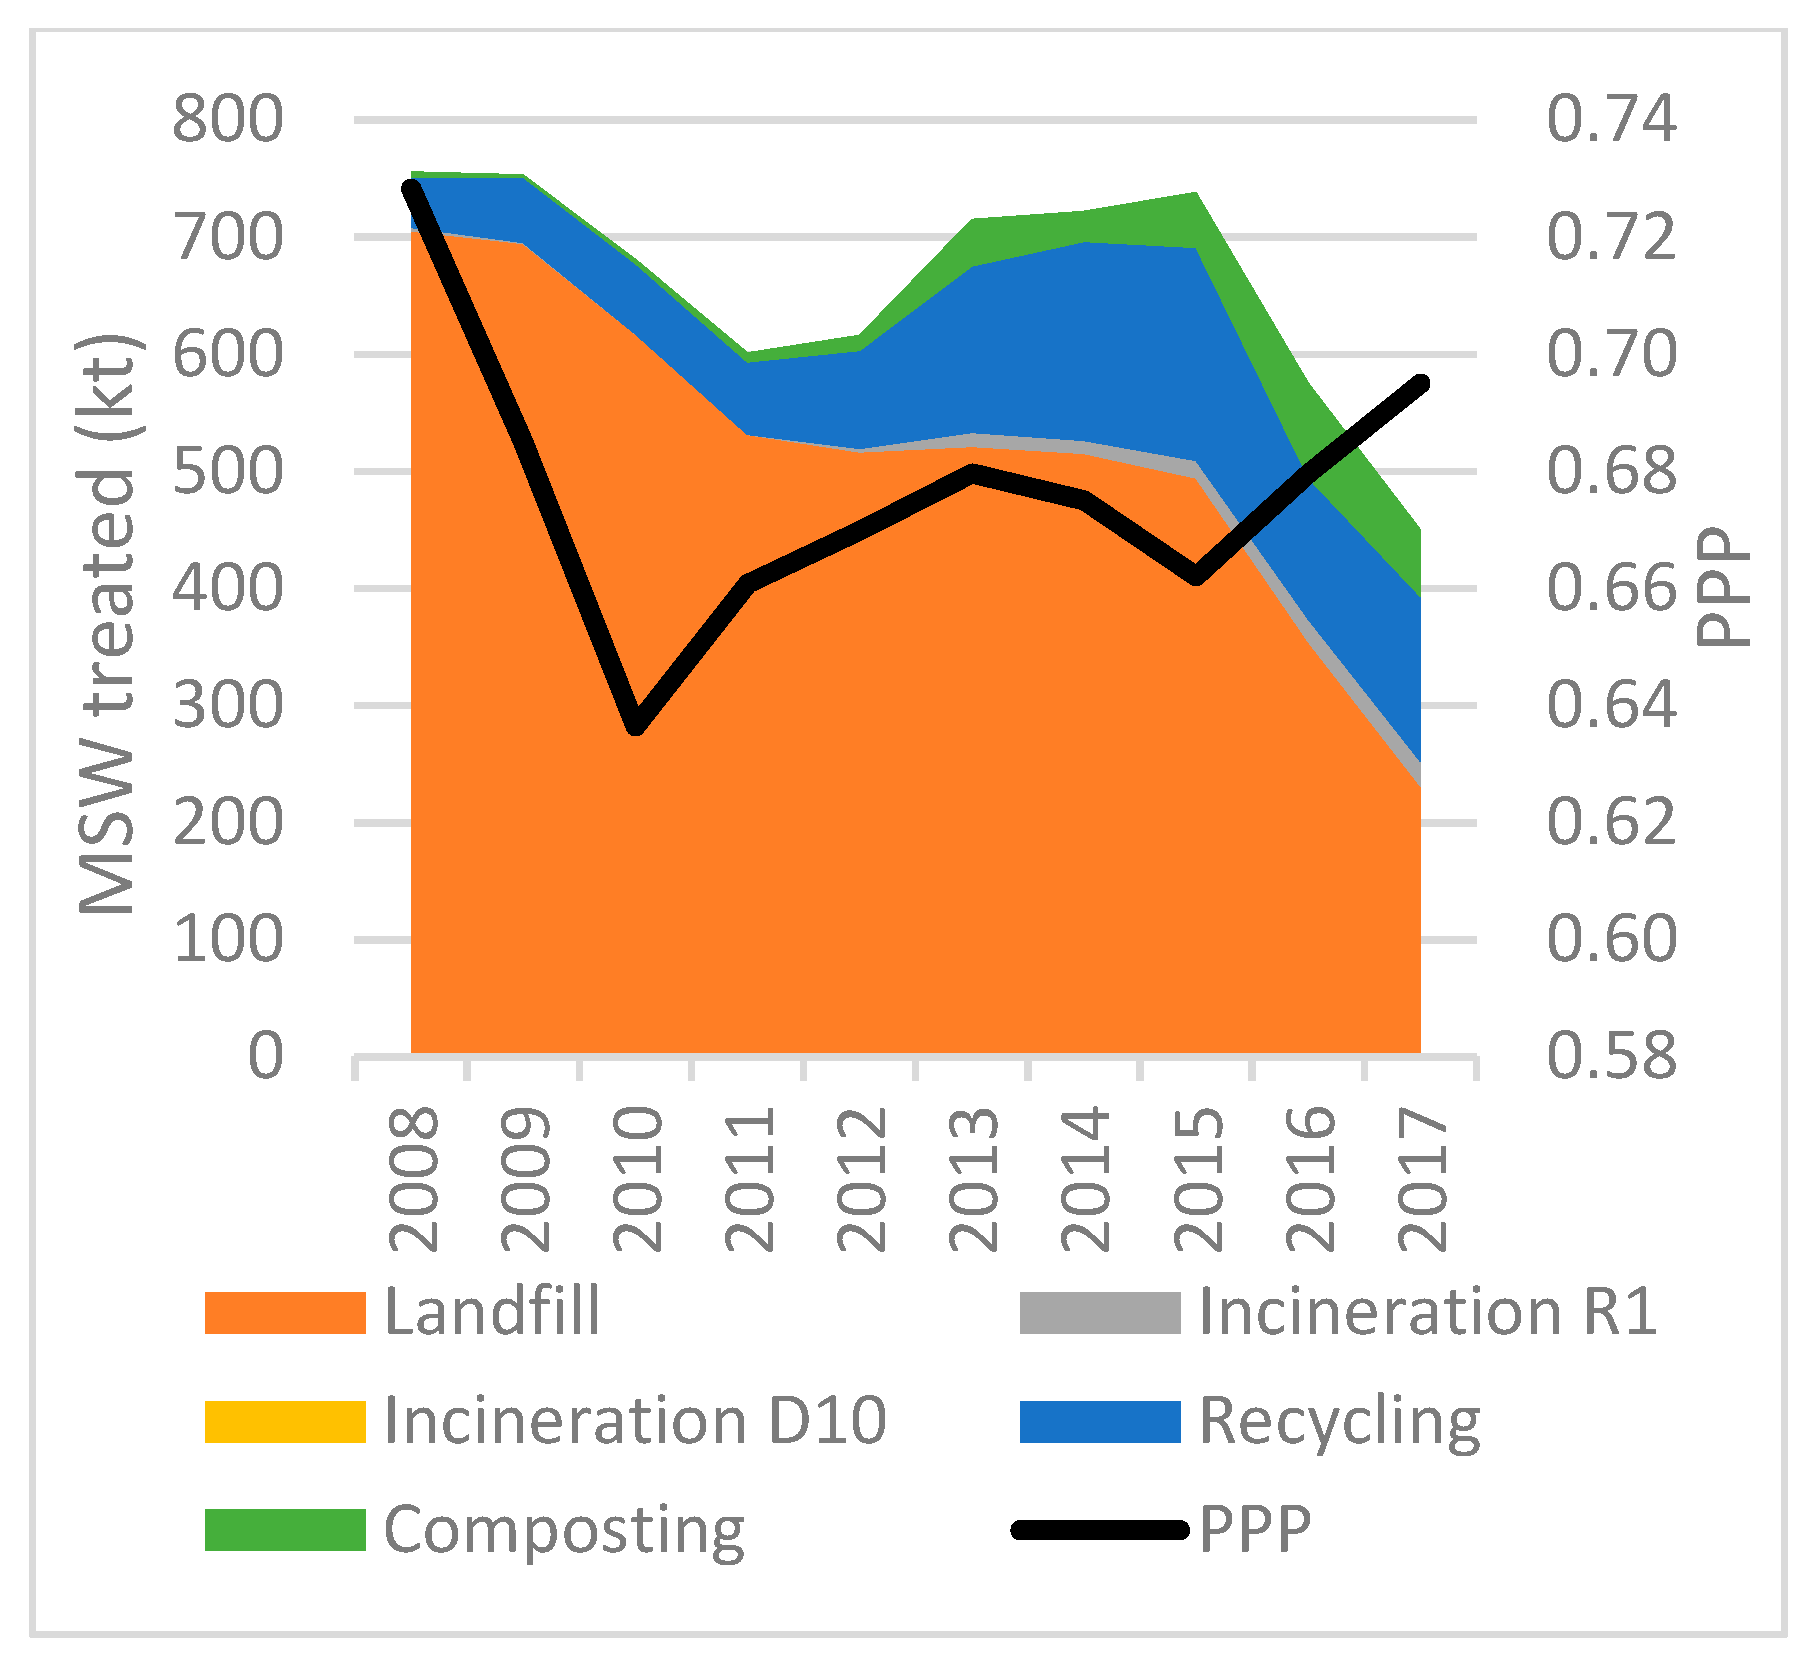
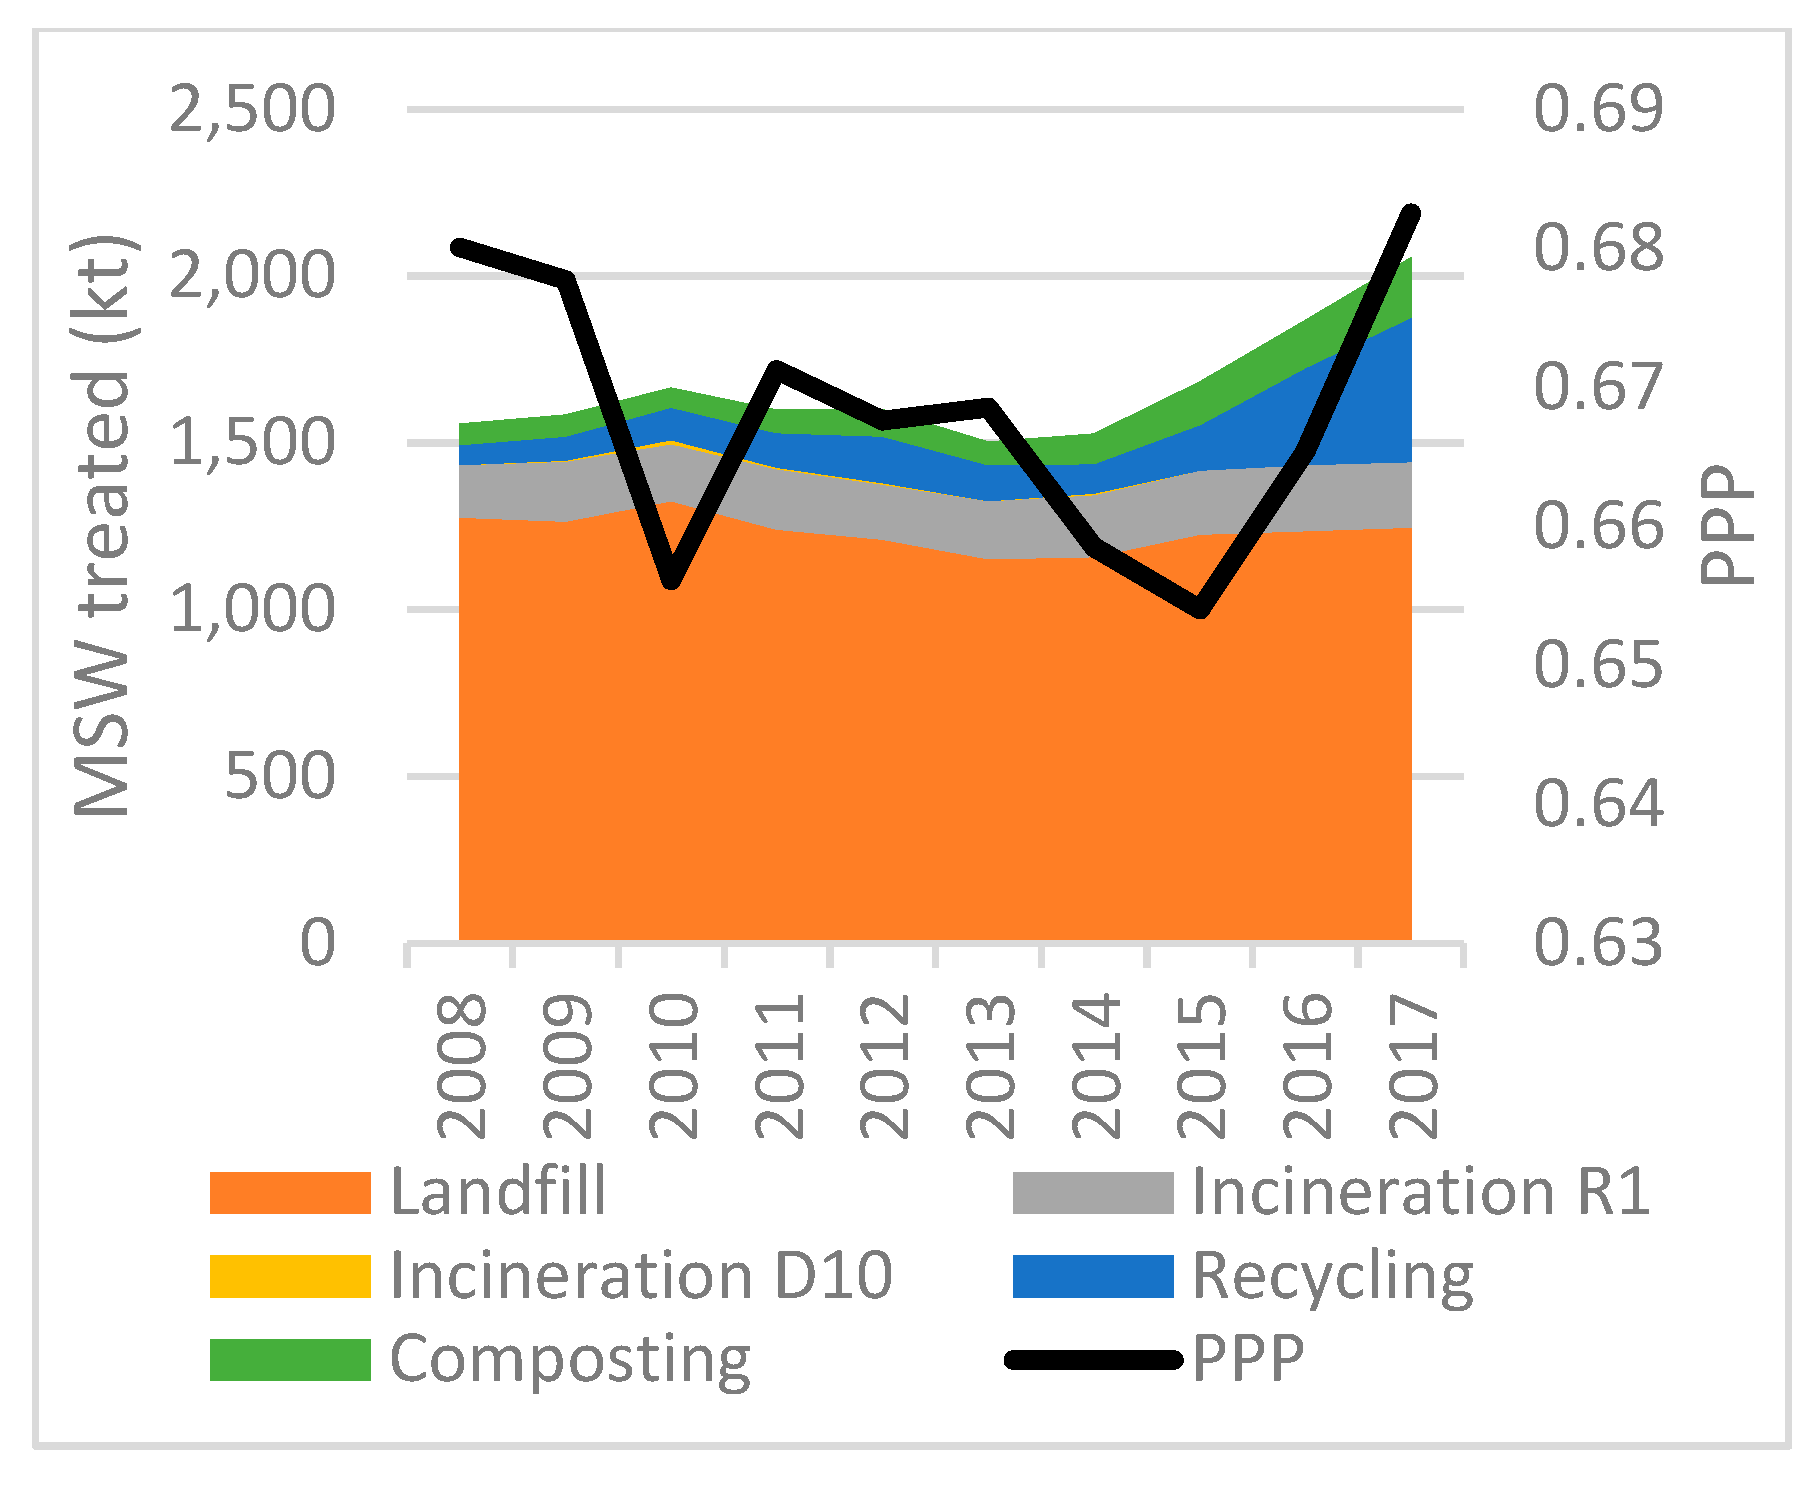
Figure 1). Citizens’ PPP experienced several fluctuations, both positive and negative. Many factors may affect these short changes in PPP in the specific time period, such as political, financial or other social factors. However, this factor is not in the scope of this study. At the end of 2016, an increase of about 4% occurred. All the available technologies for waste treatment took place in Belgium. The amount of 449 kt disposed in landfills in 2008, representing about 10% of the total treated MSW, decreased to 41 kt in 2017. Thus, a reduction of over 90% of landfilling was reached. Recycling and composting have been used as a treatment method for large amounts of waste. However, small fluctuations are also observed.
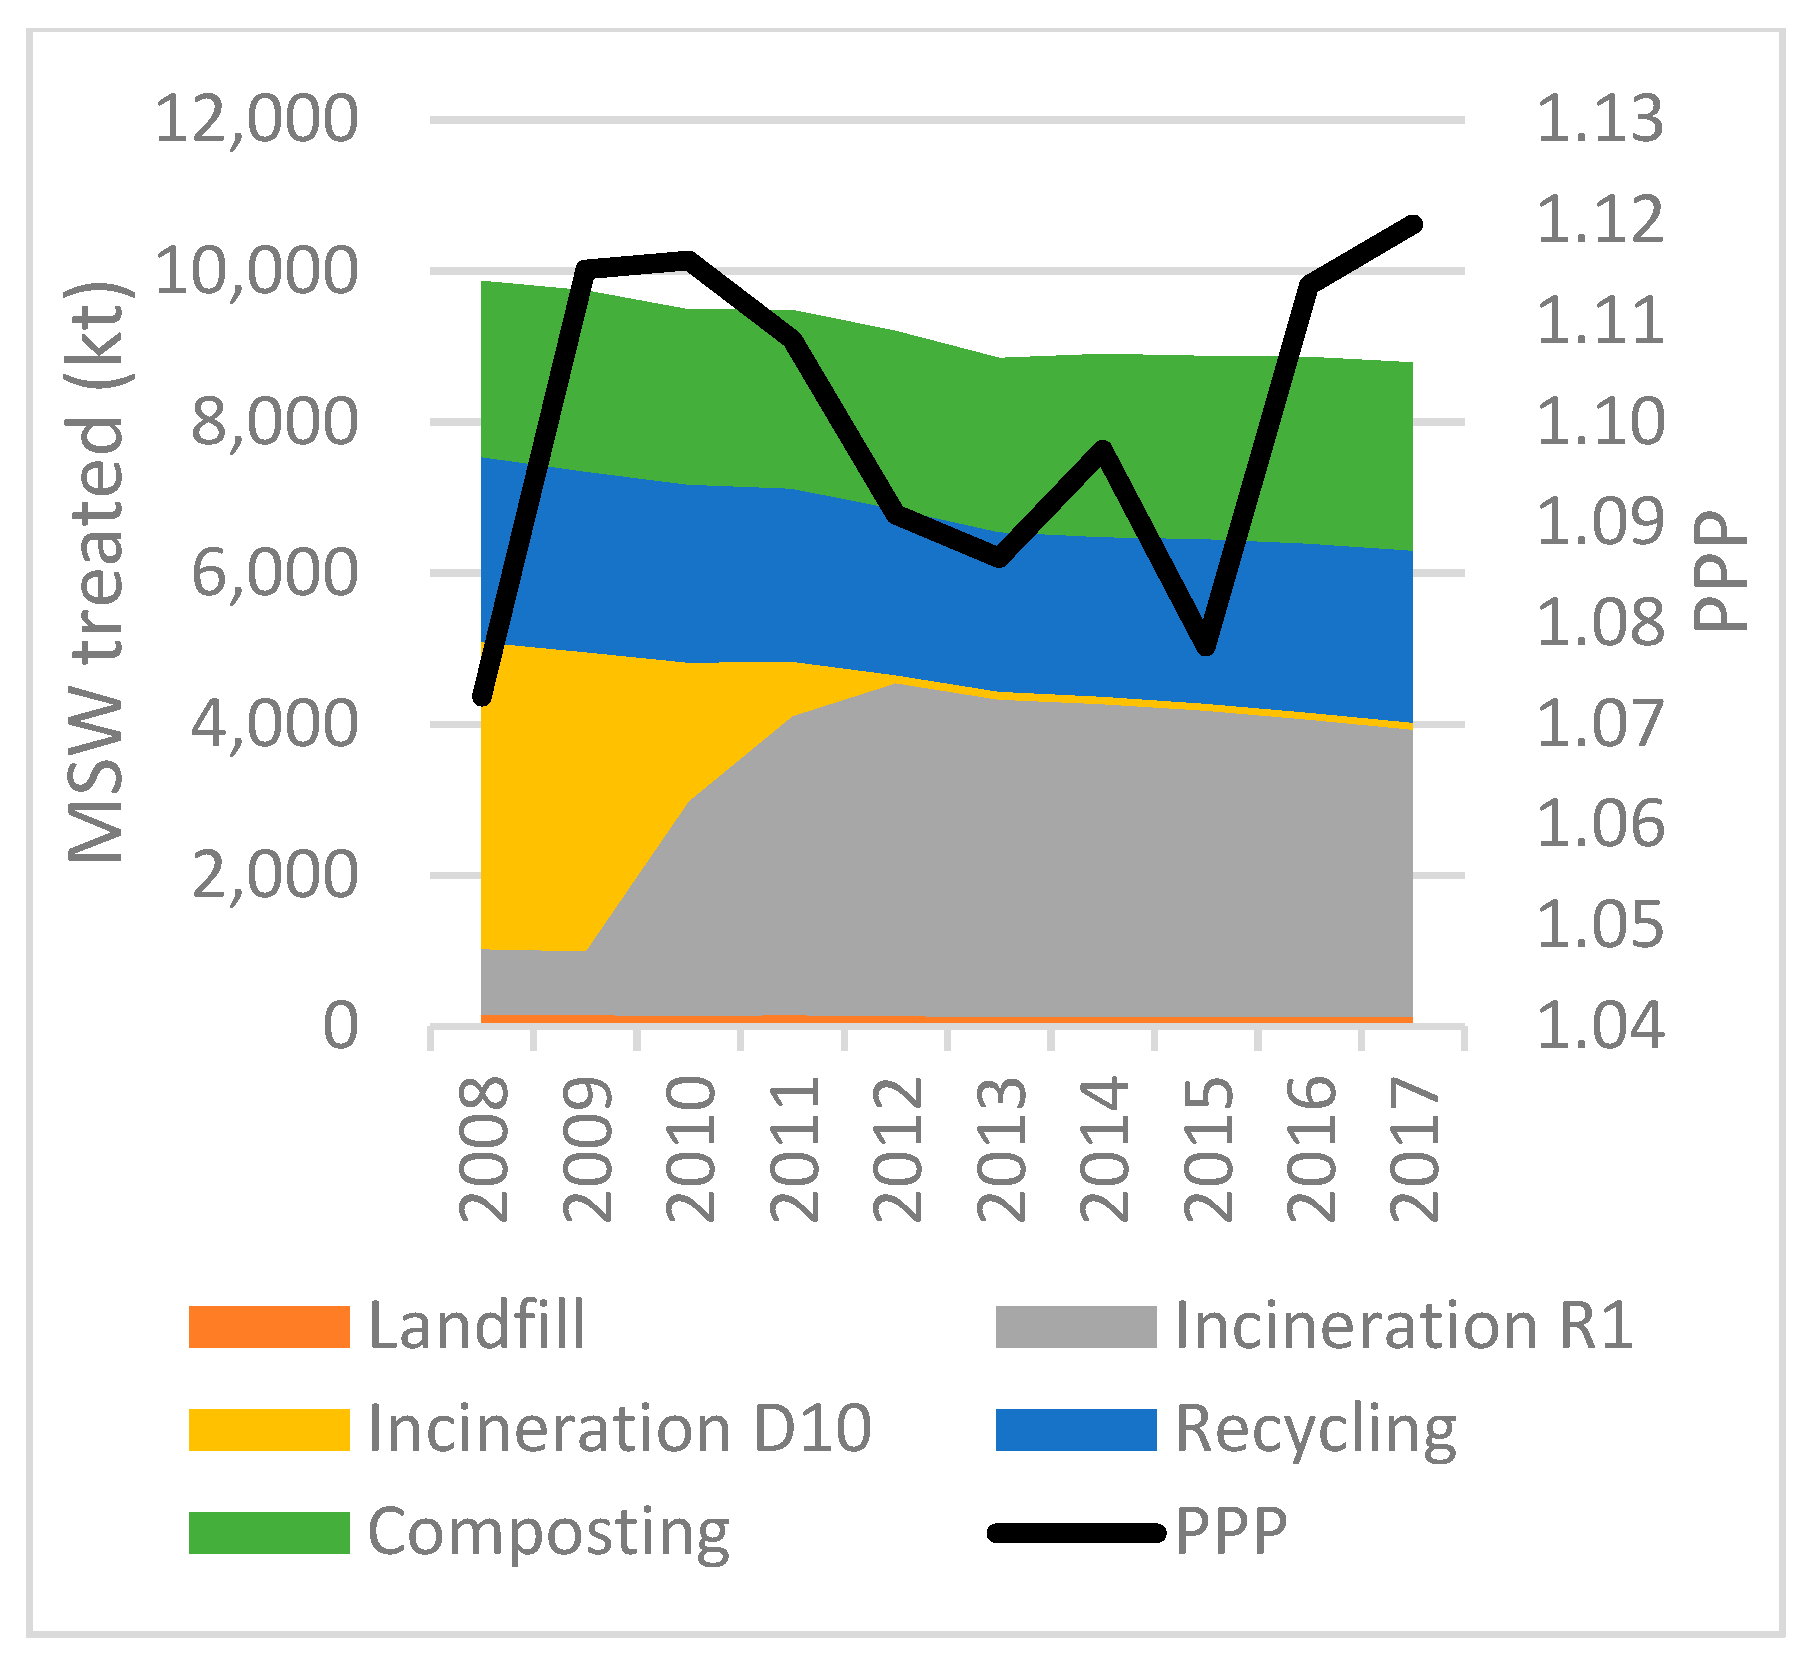
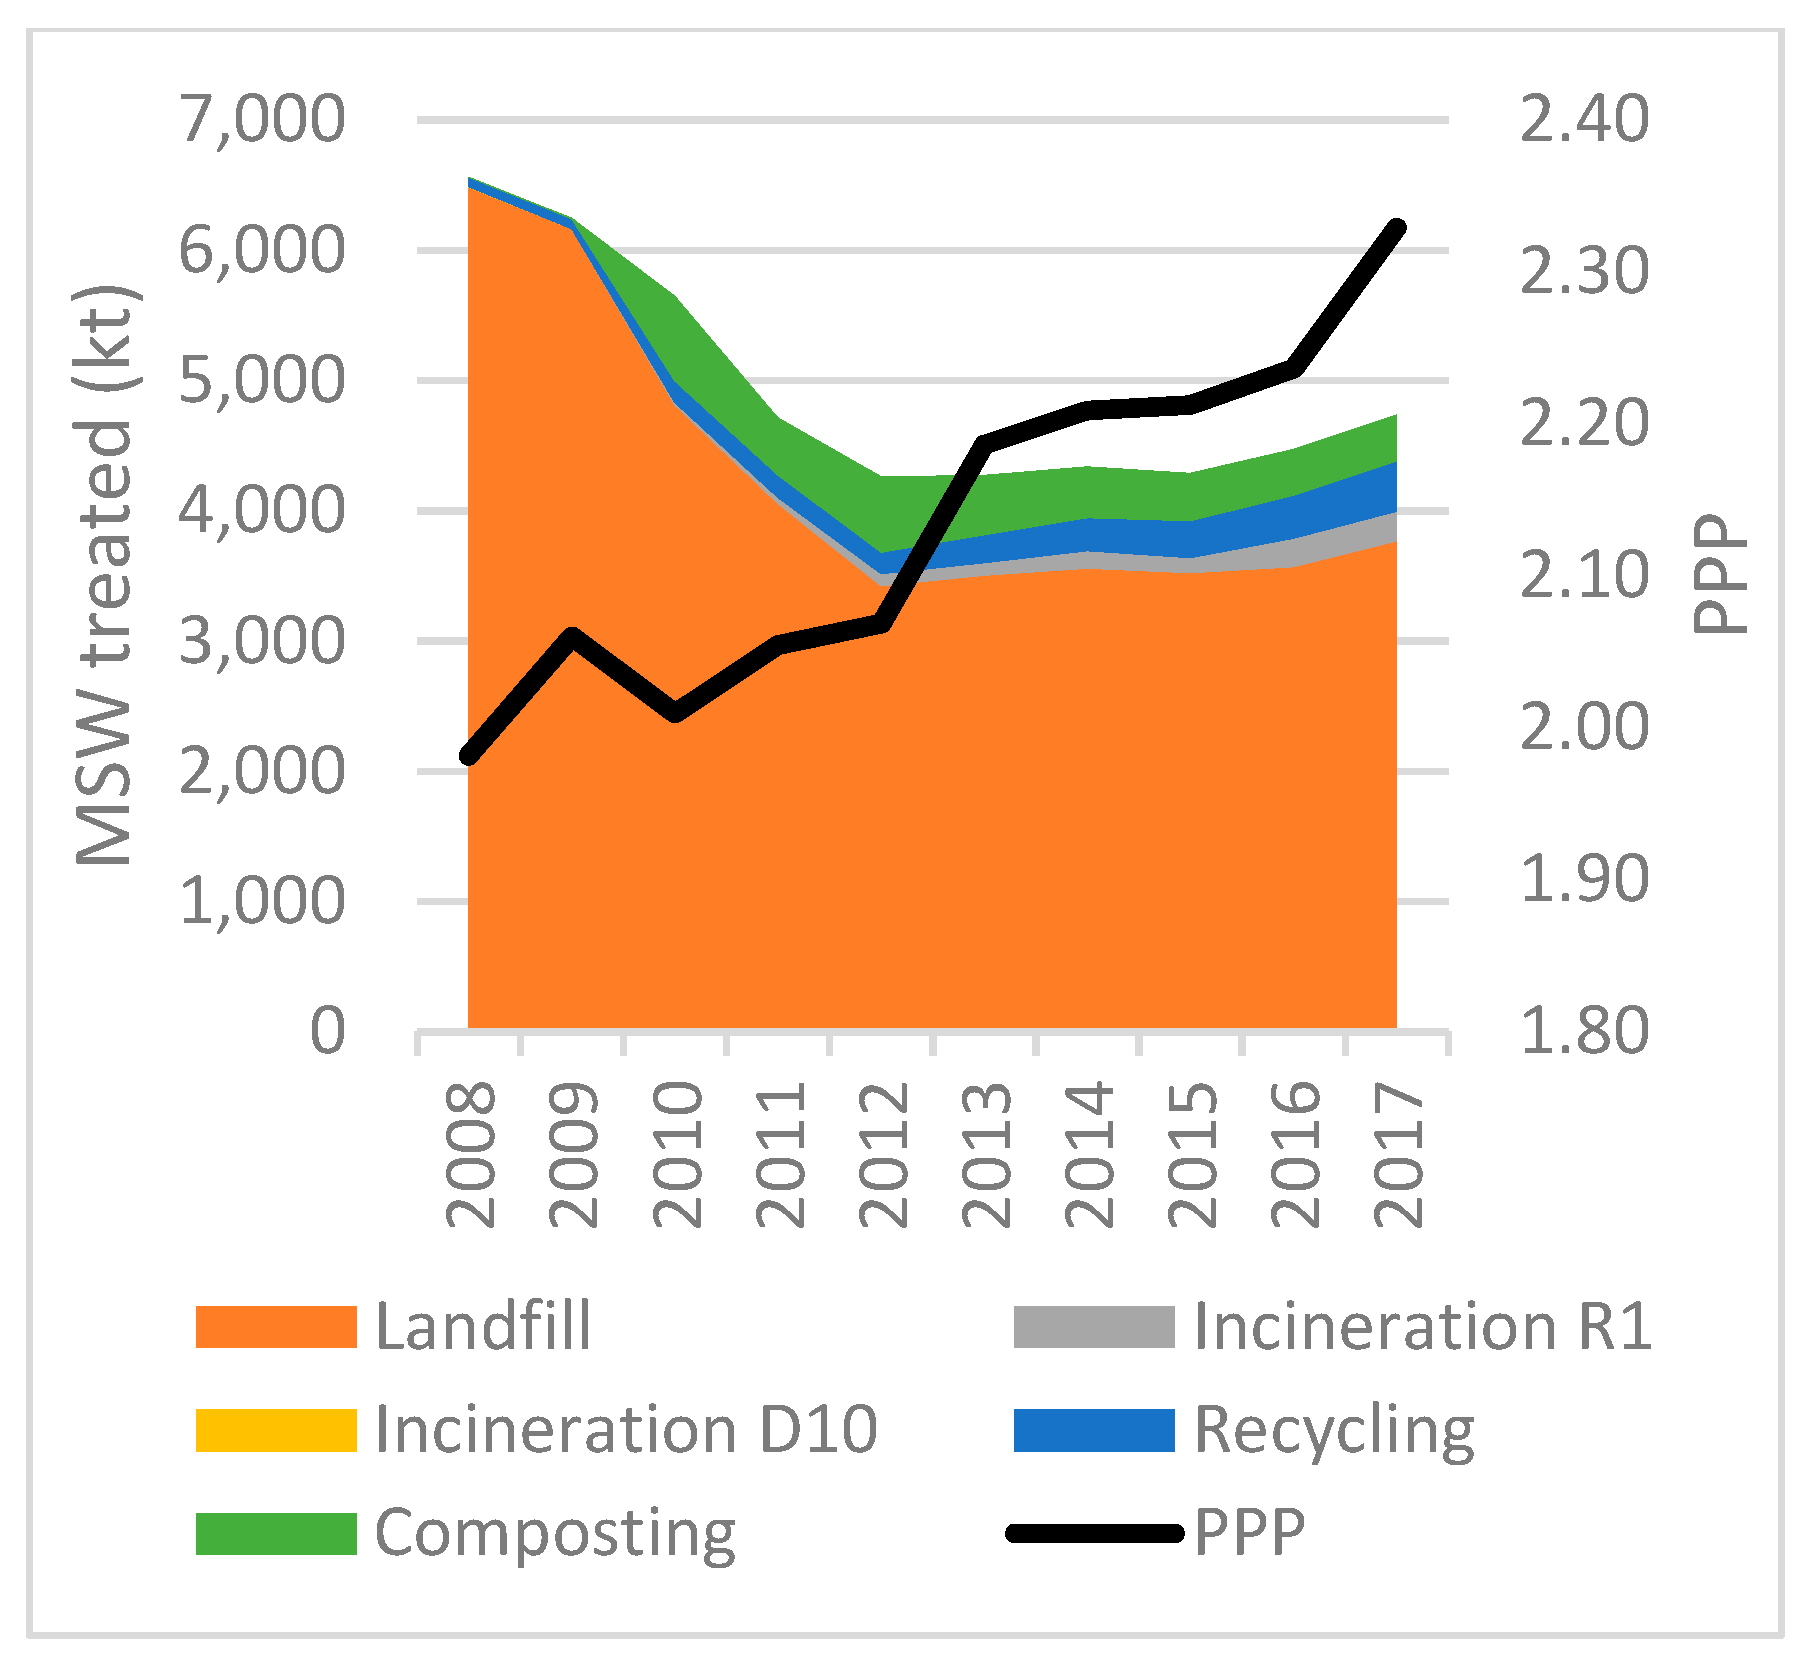
Incineration without energy recovery (D10) has been used for treating small amounts of MSW, representing an average of 1.70%. Alternatively, incineration with energy recovery (R1) is the method that is widely used for waste treatment in Belgium, representing over 40% of the total waste generated (
Figure 2).
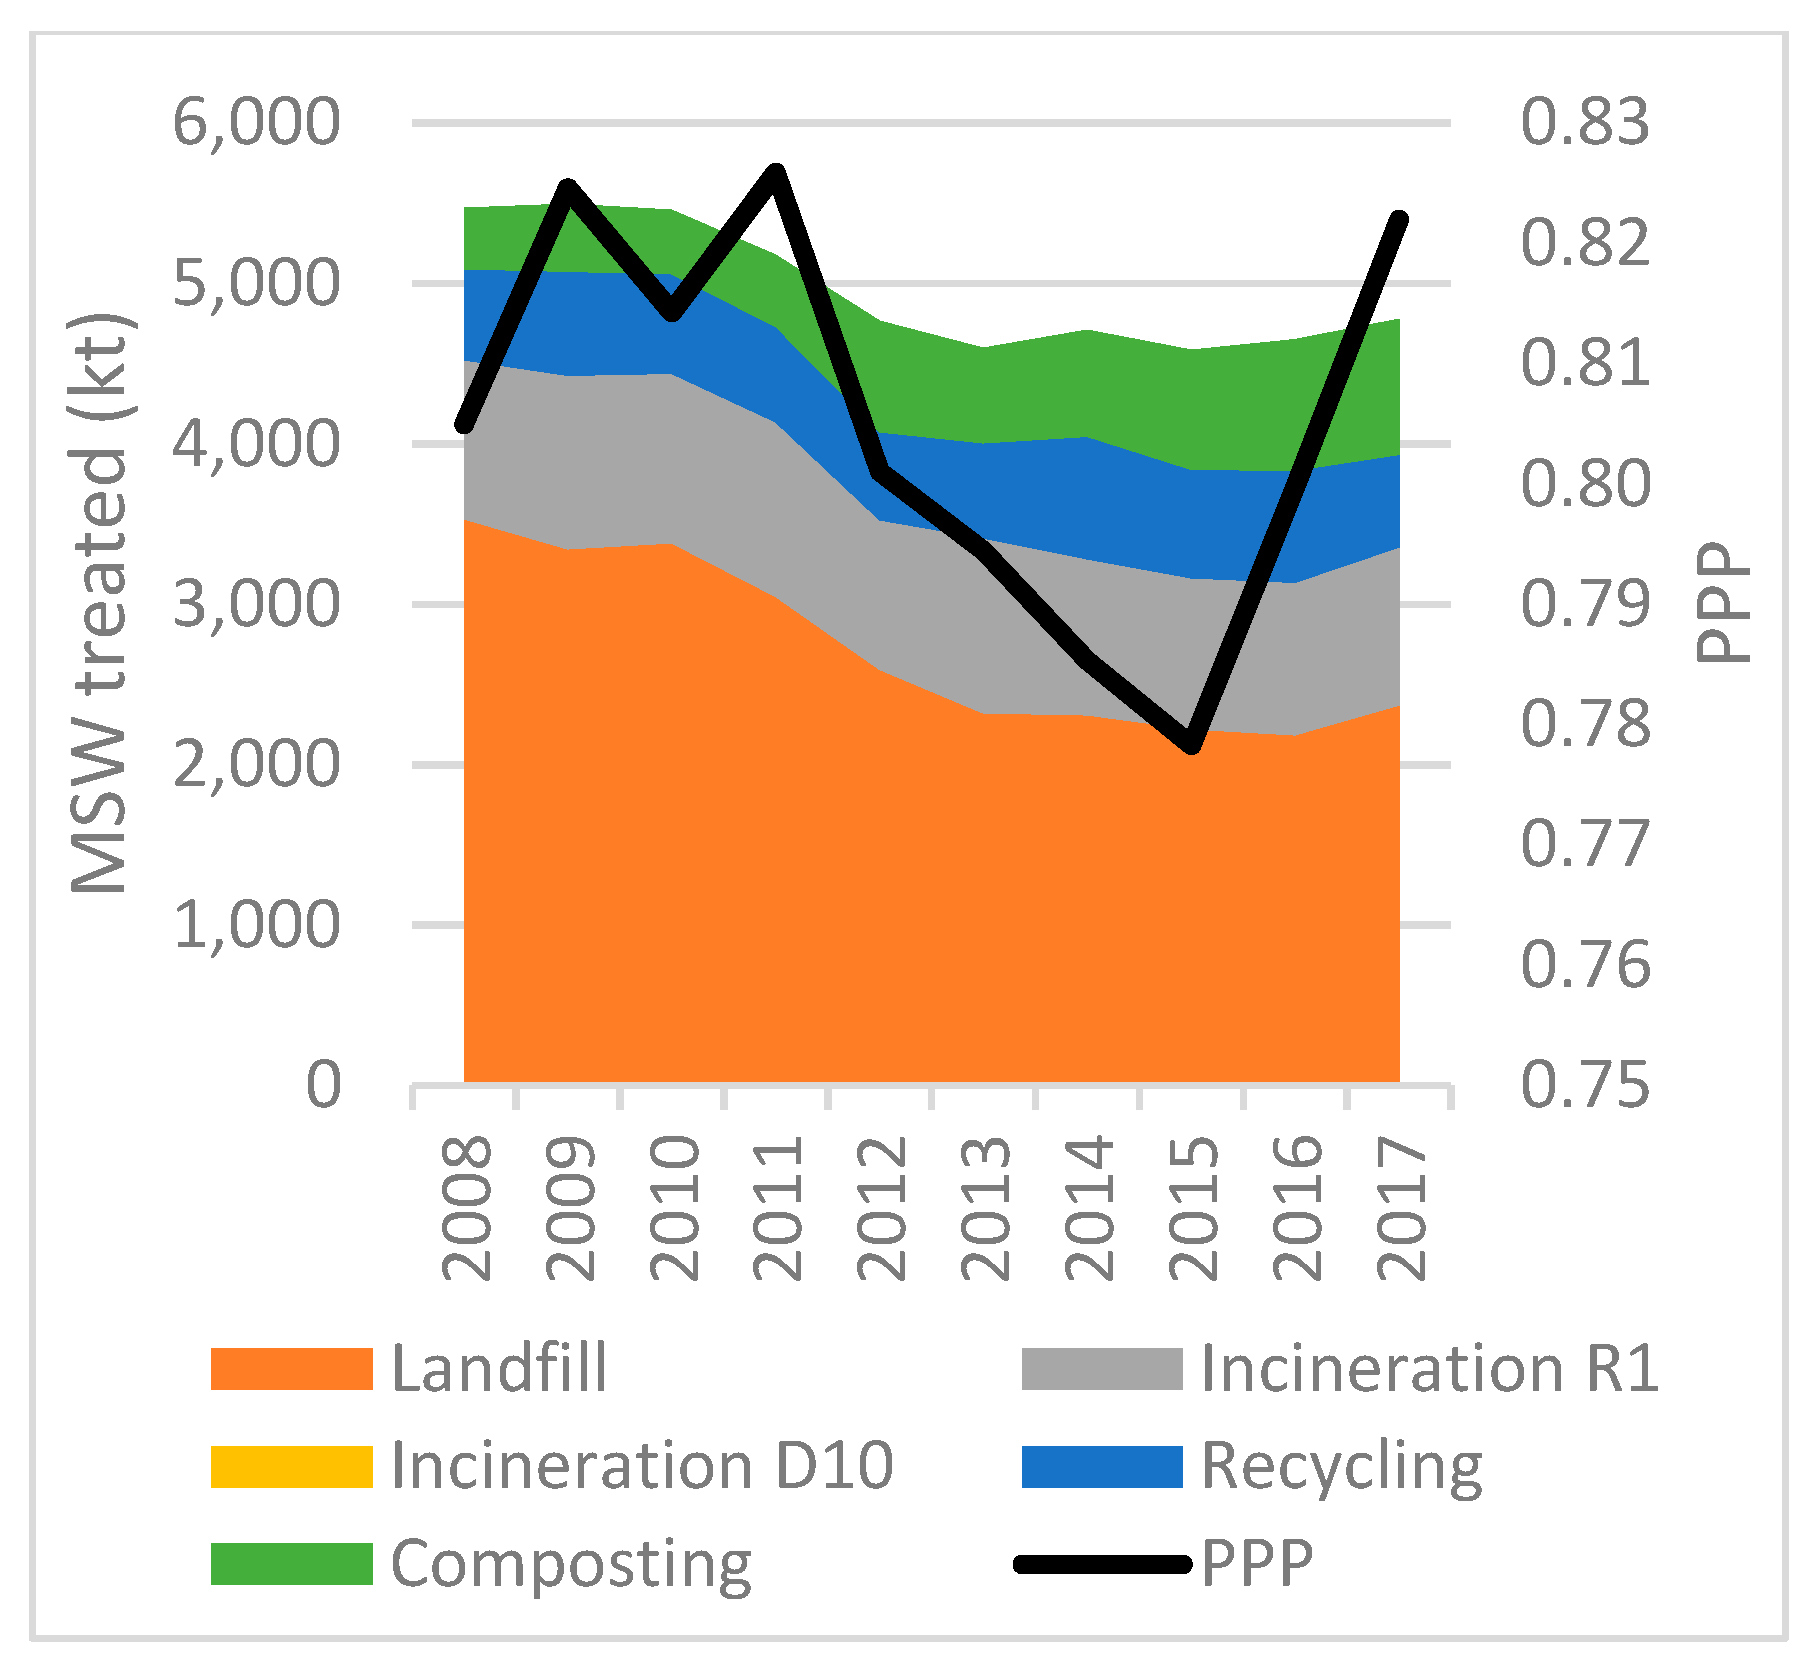
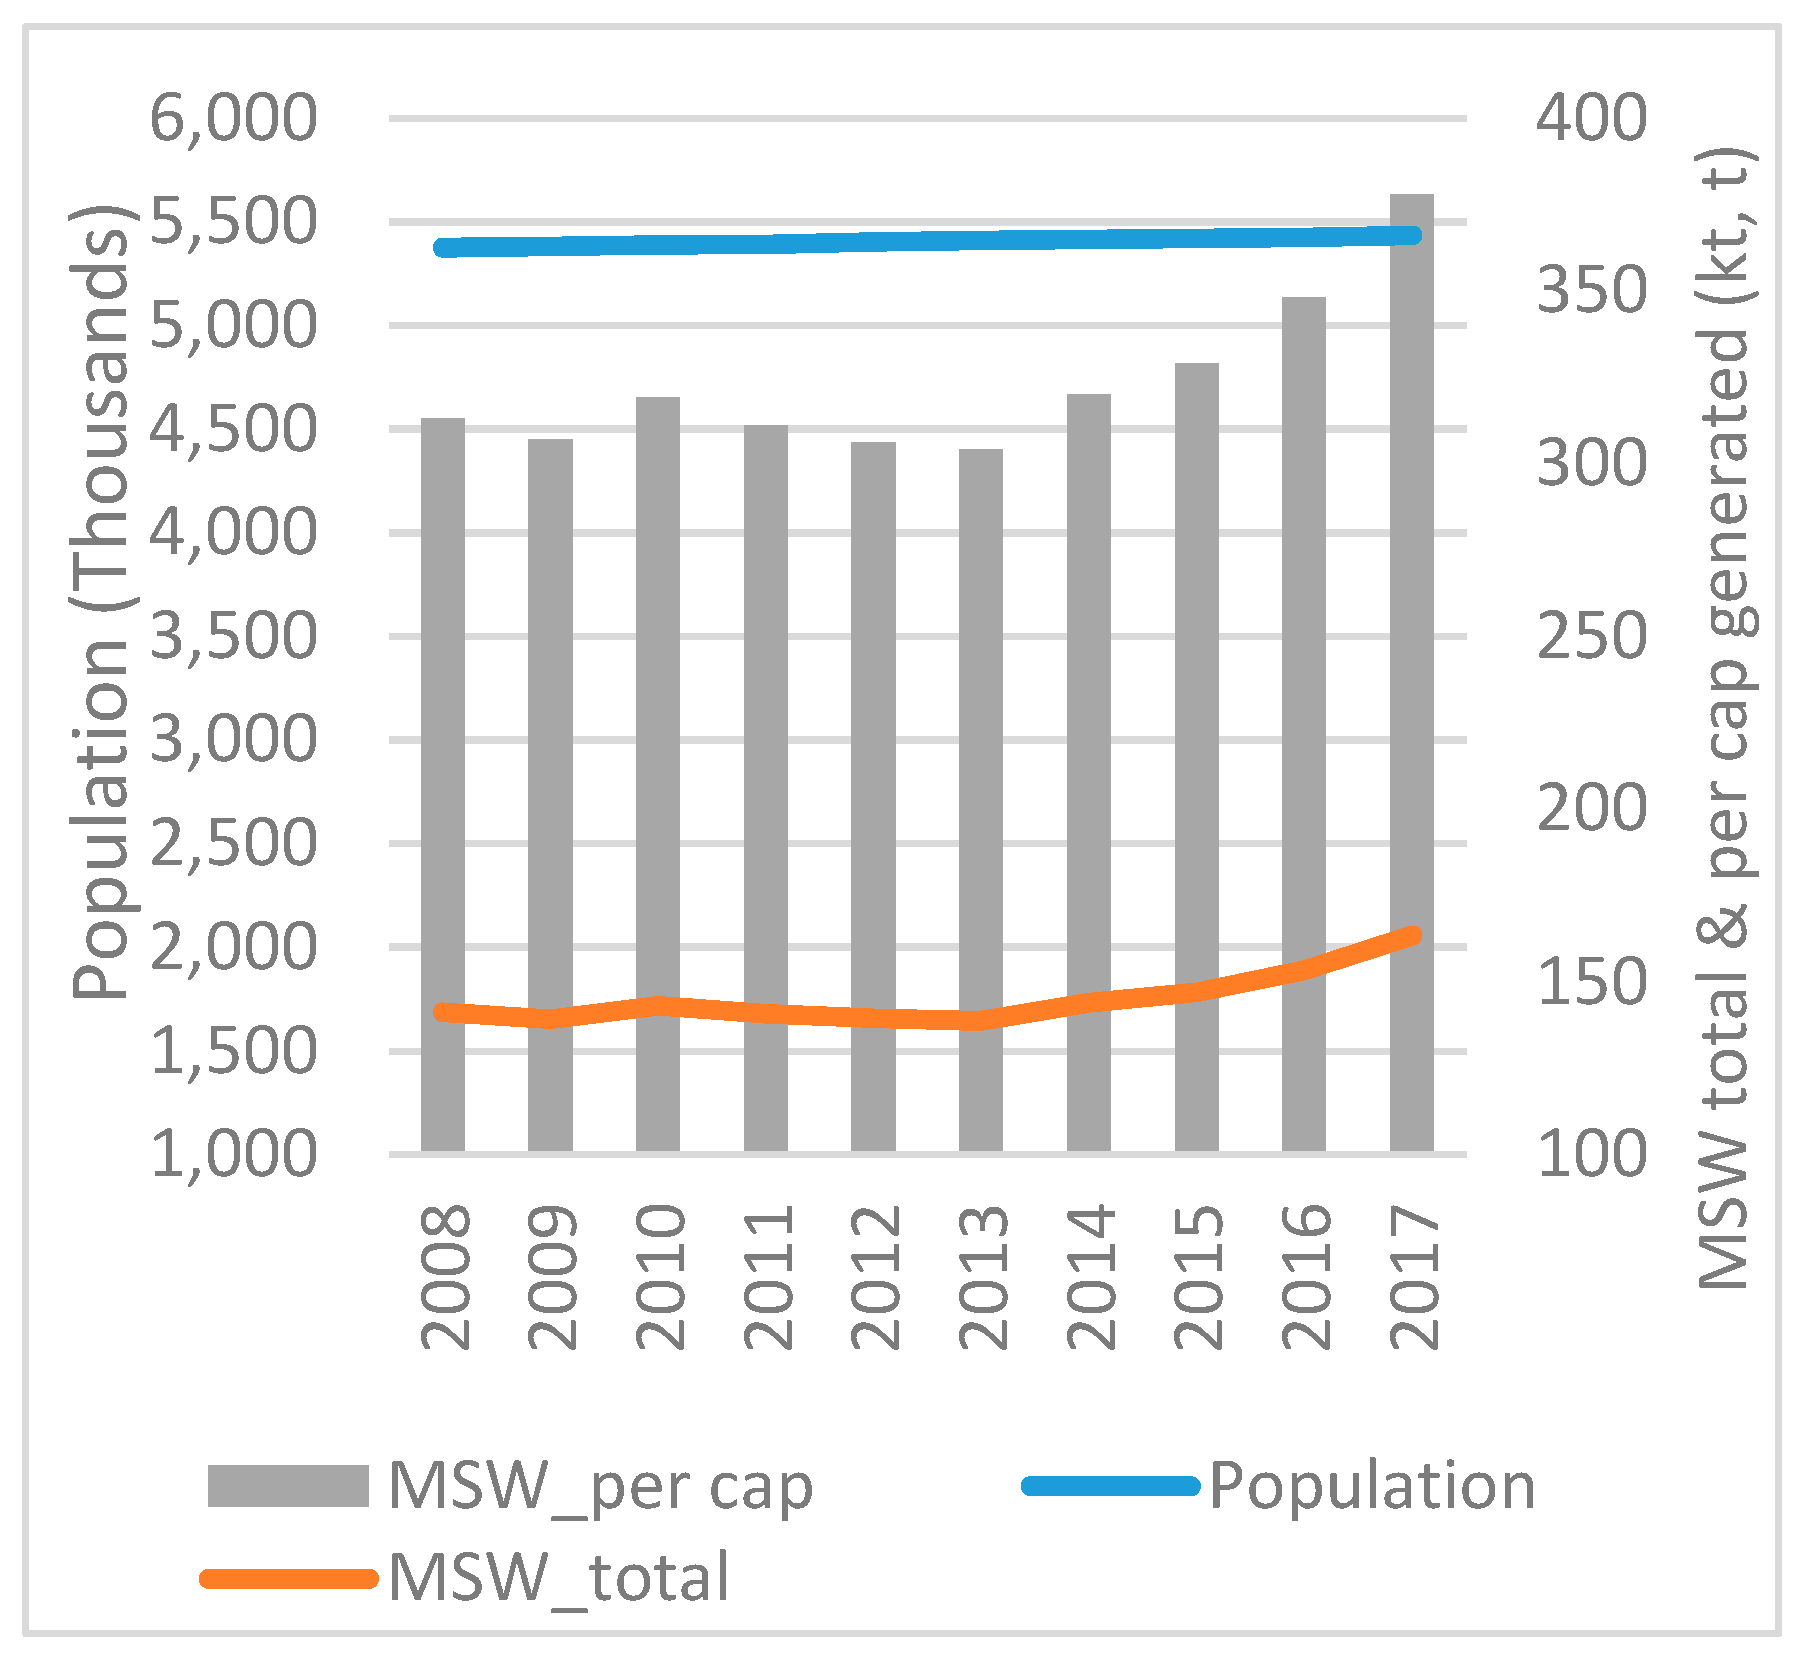
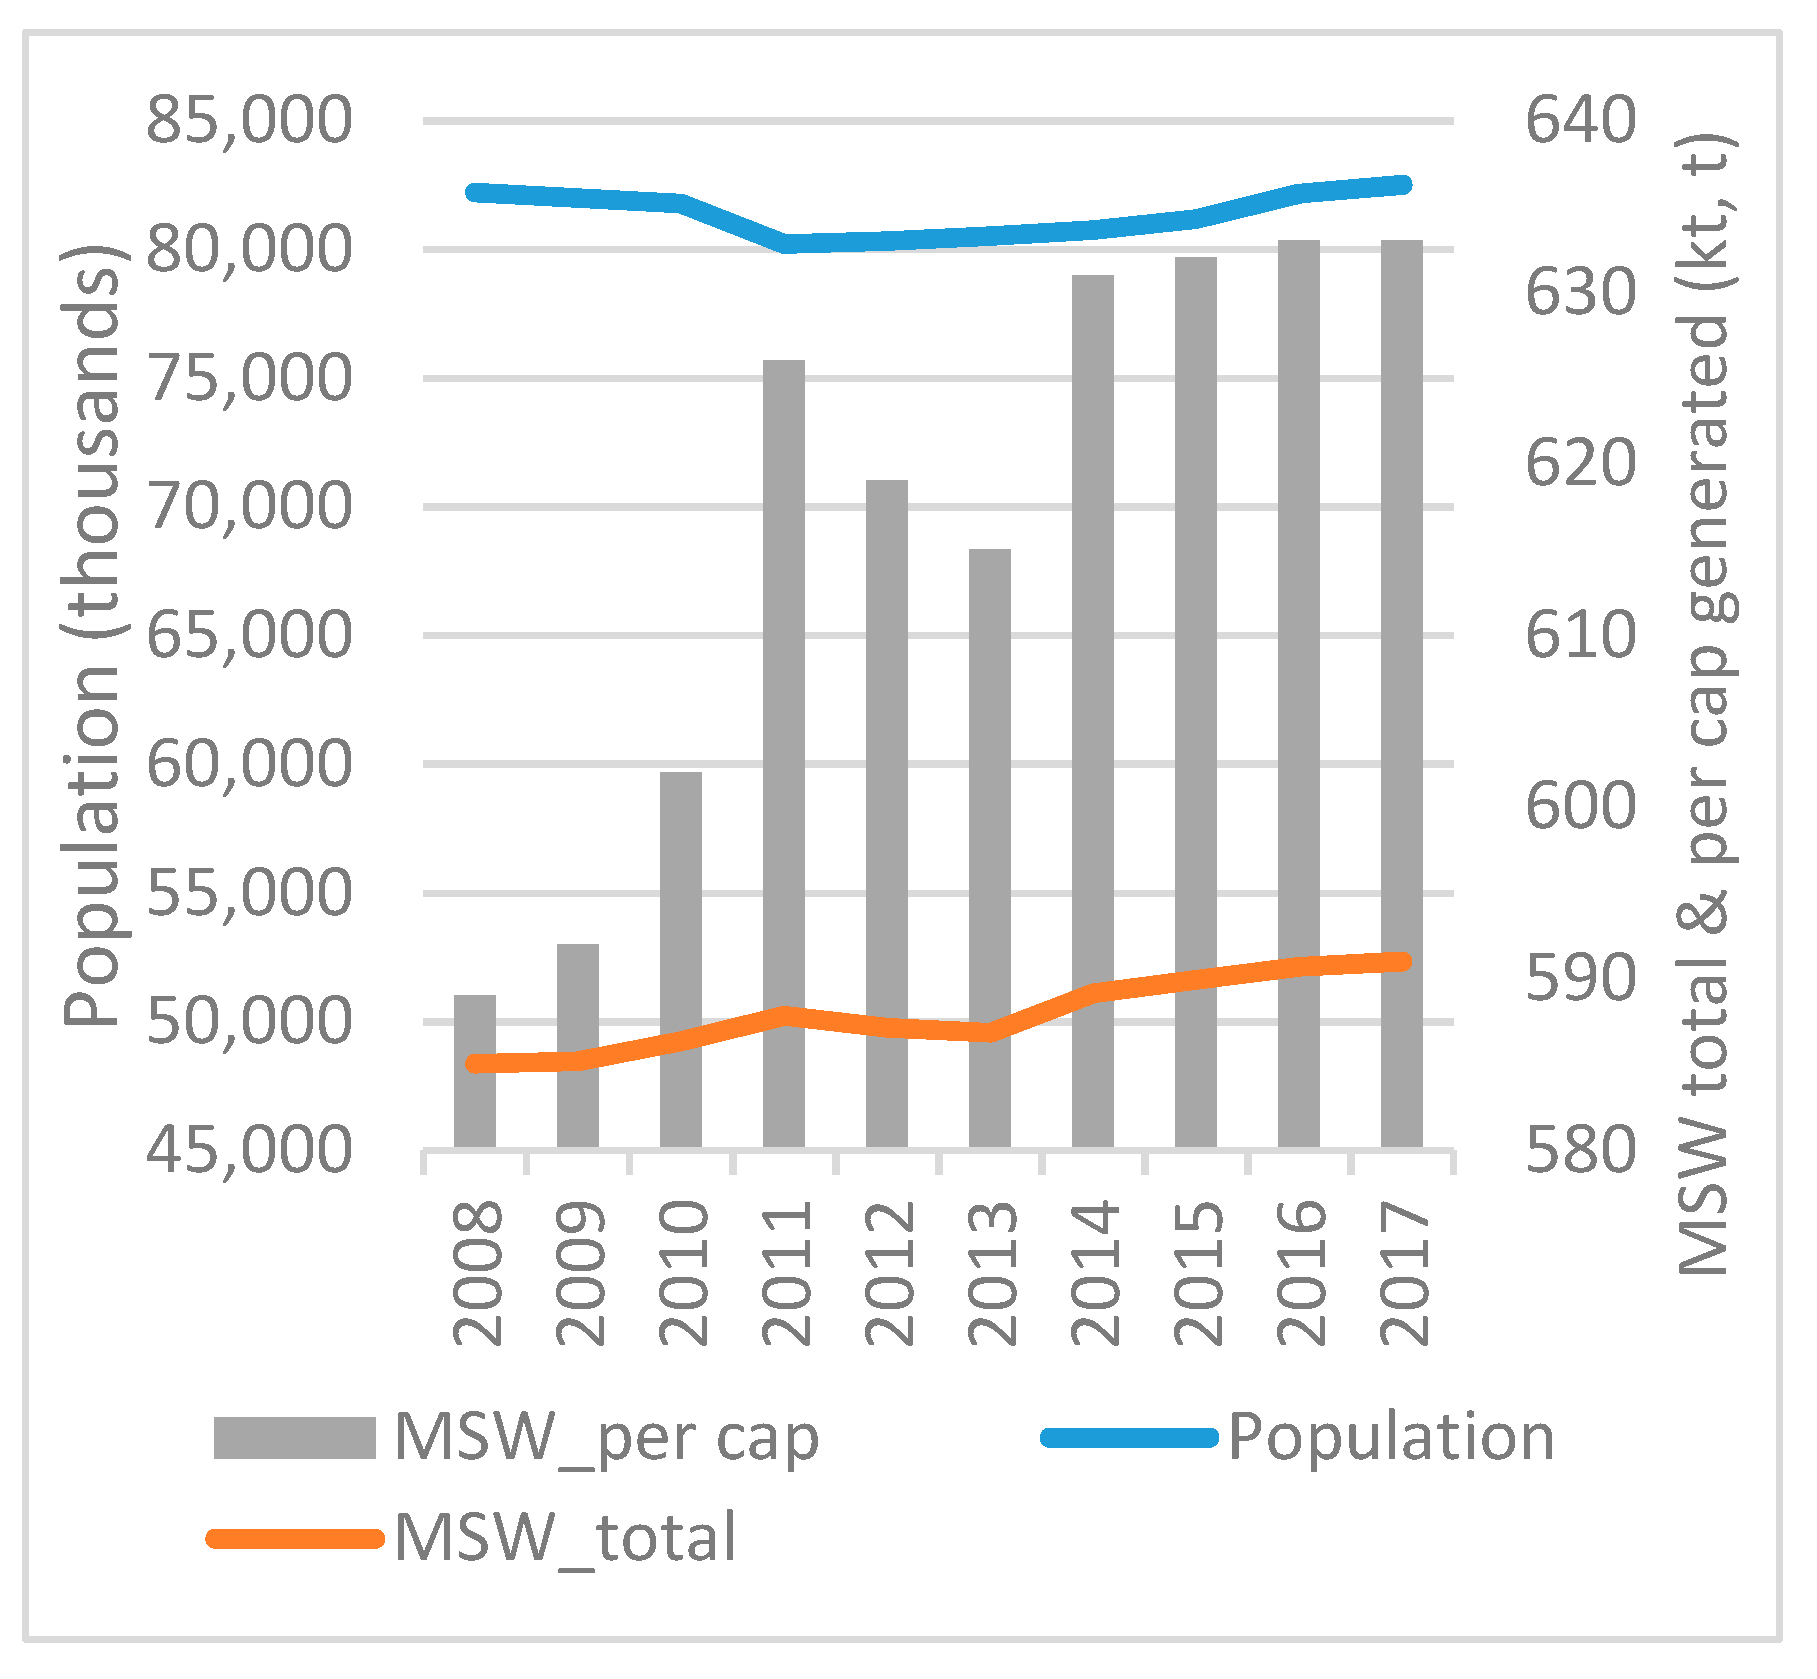
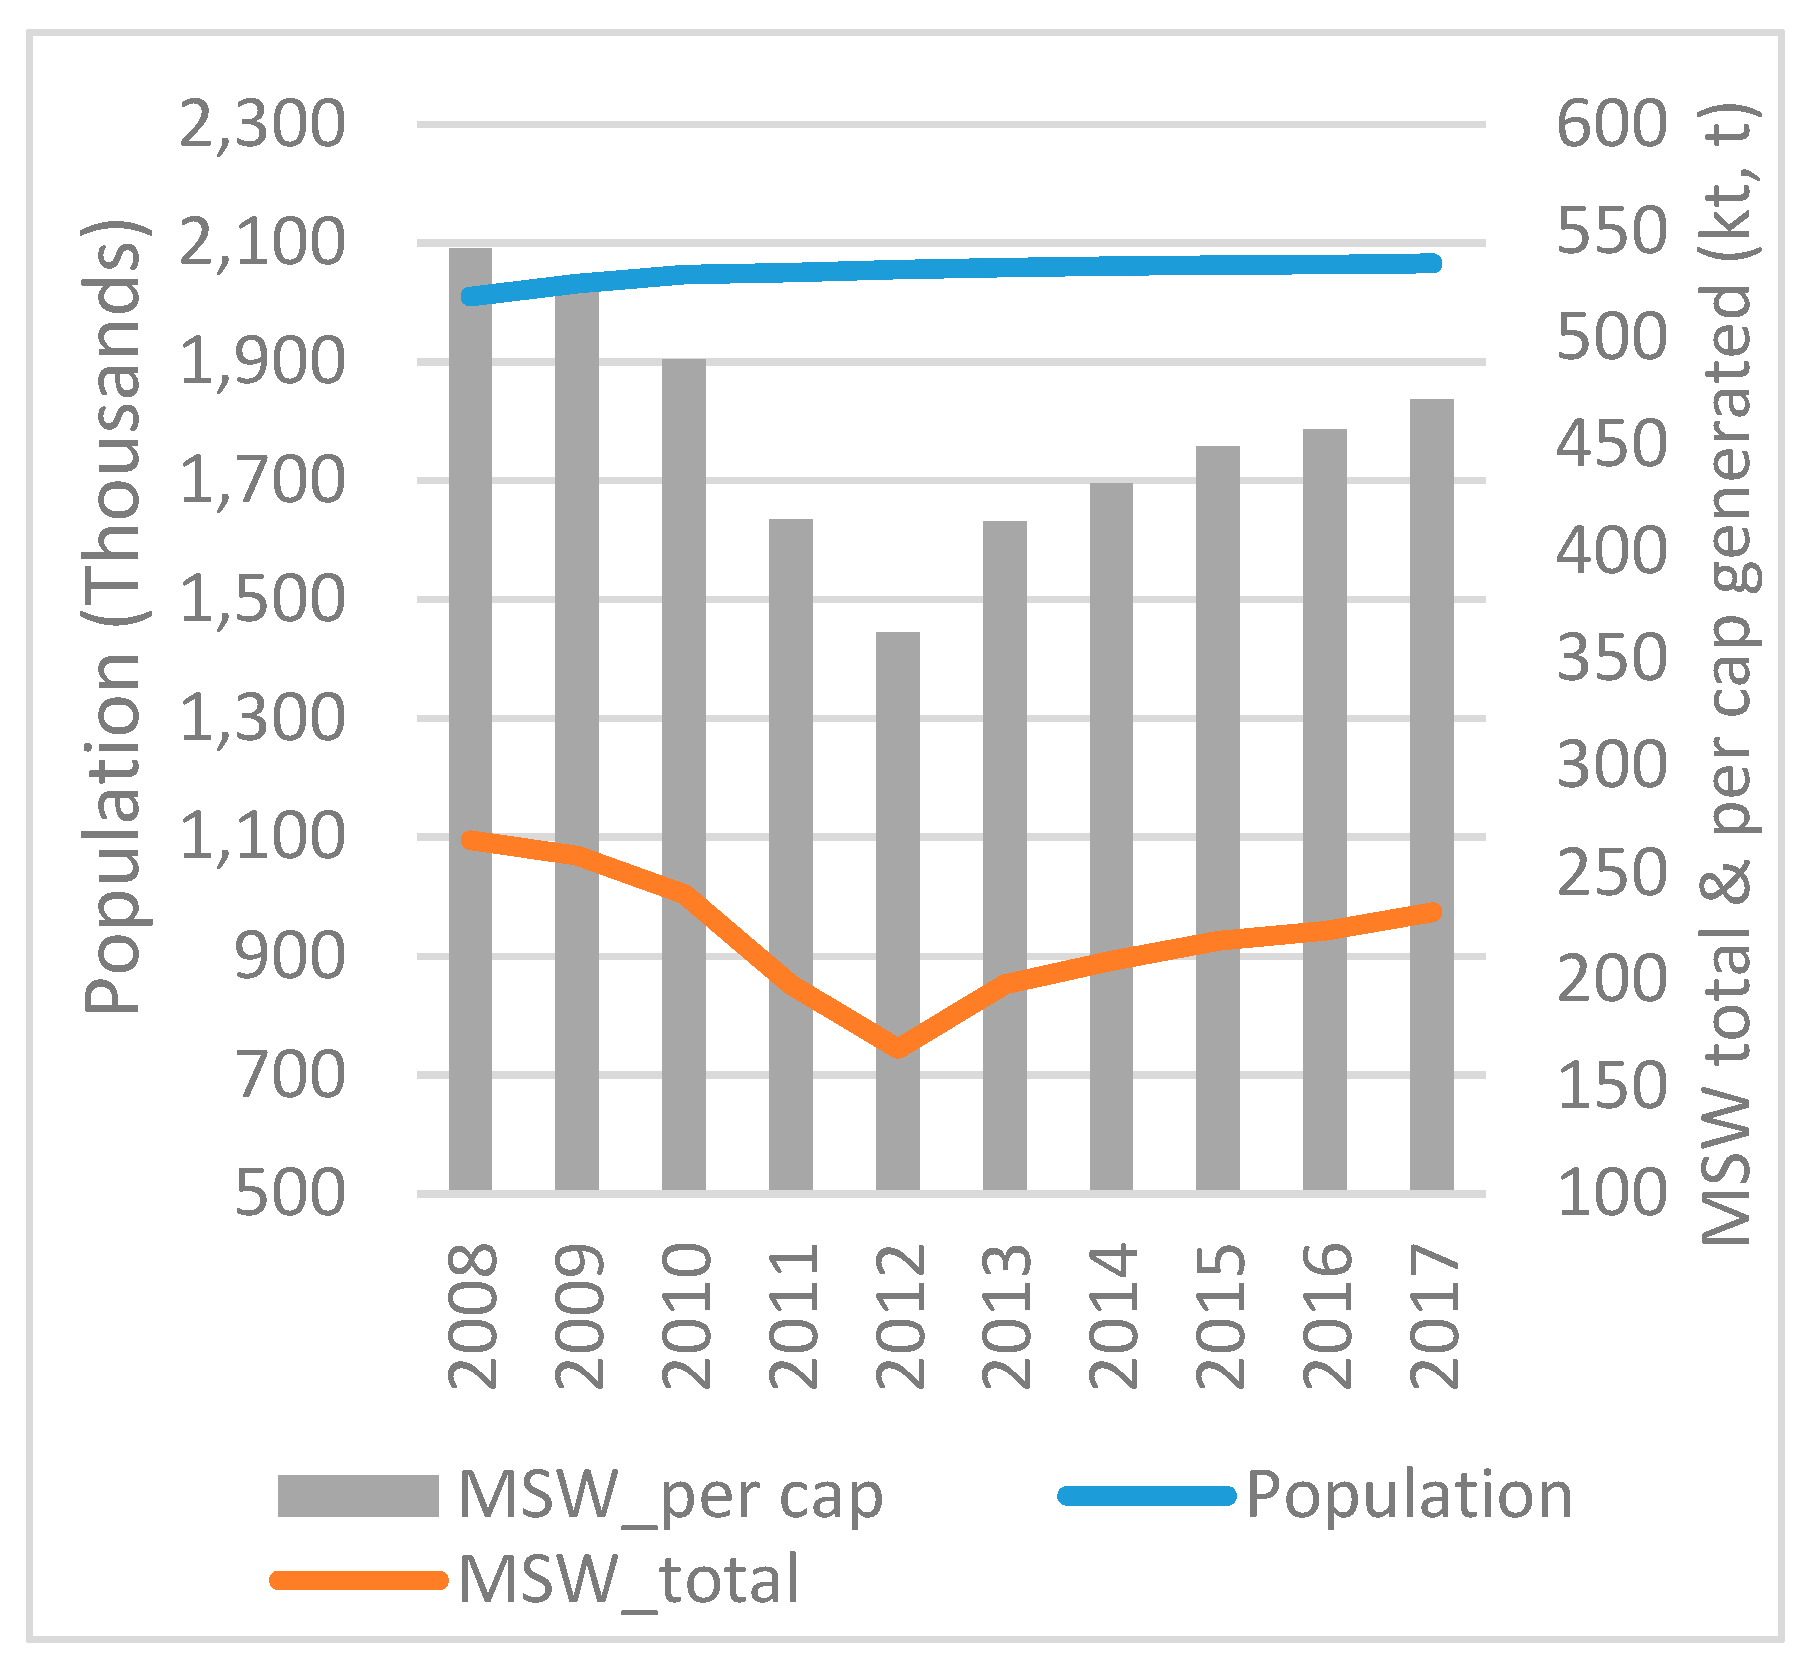
• Bulgaria
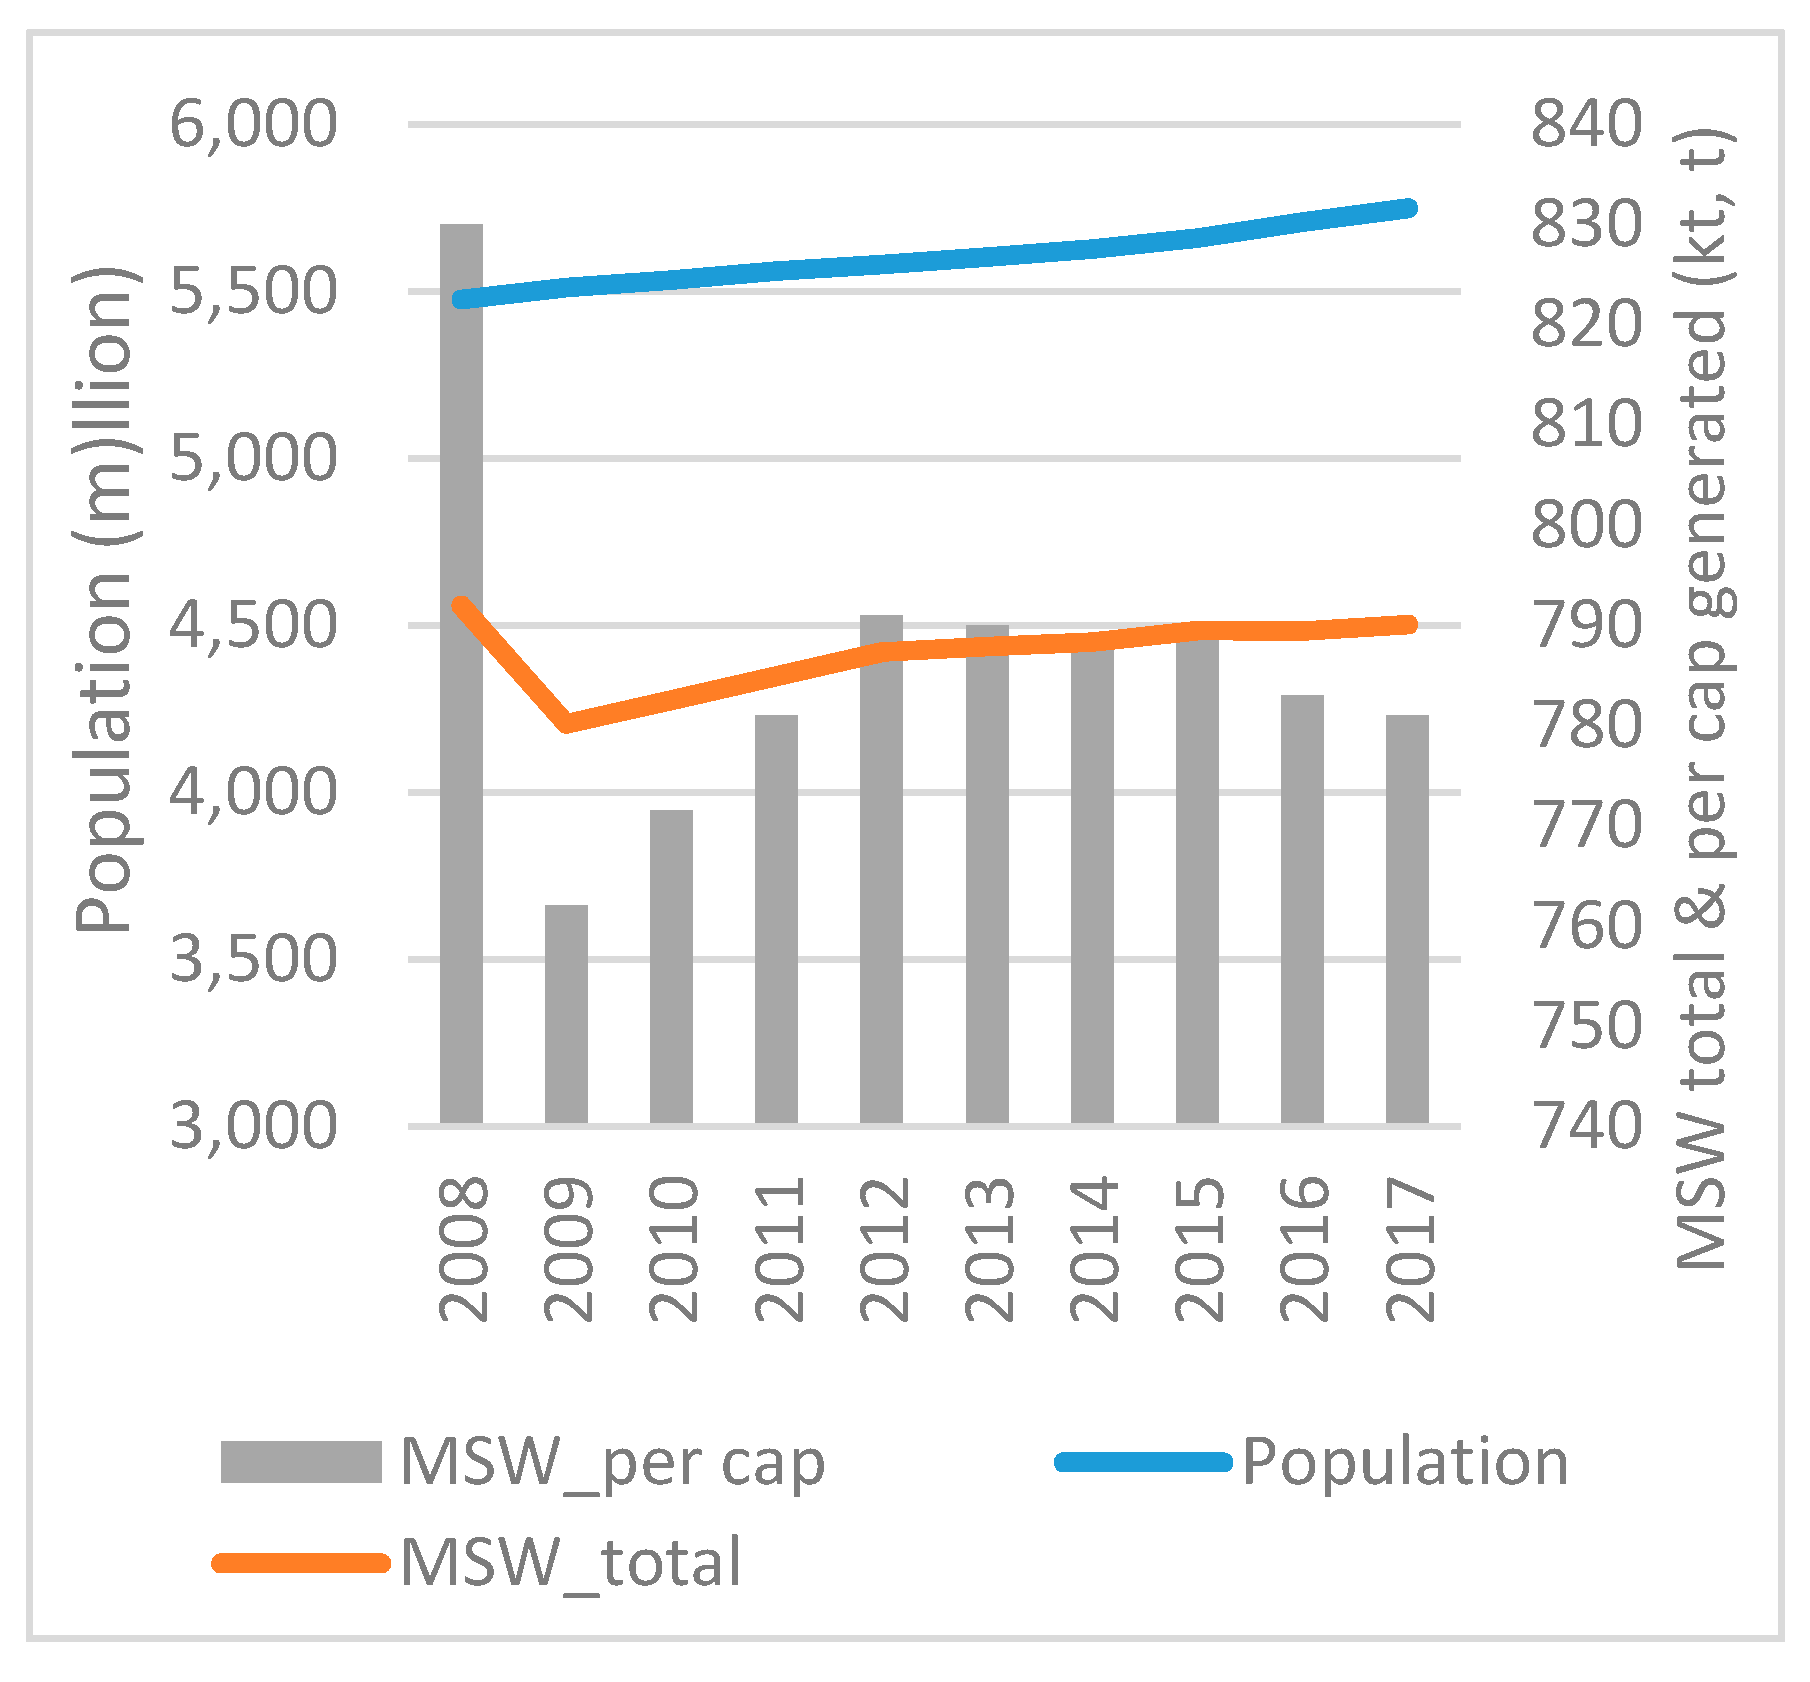
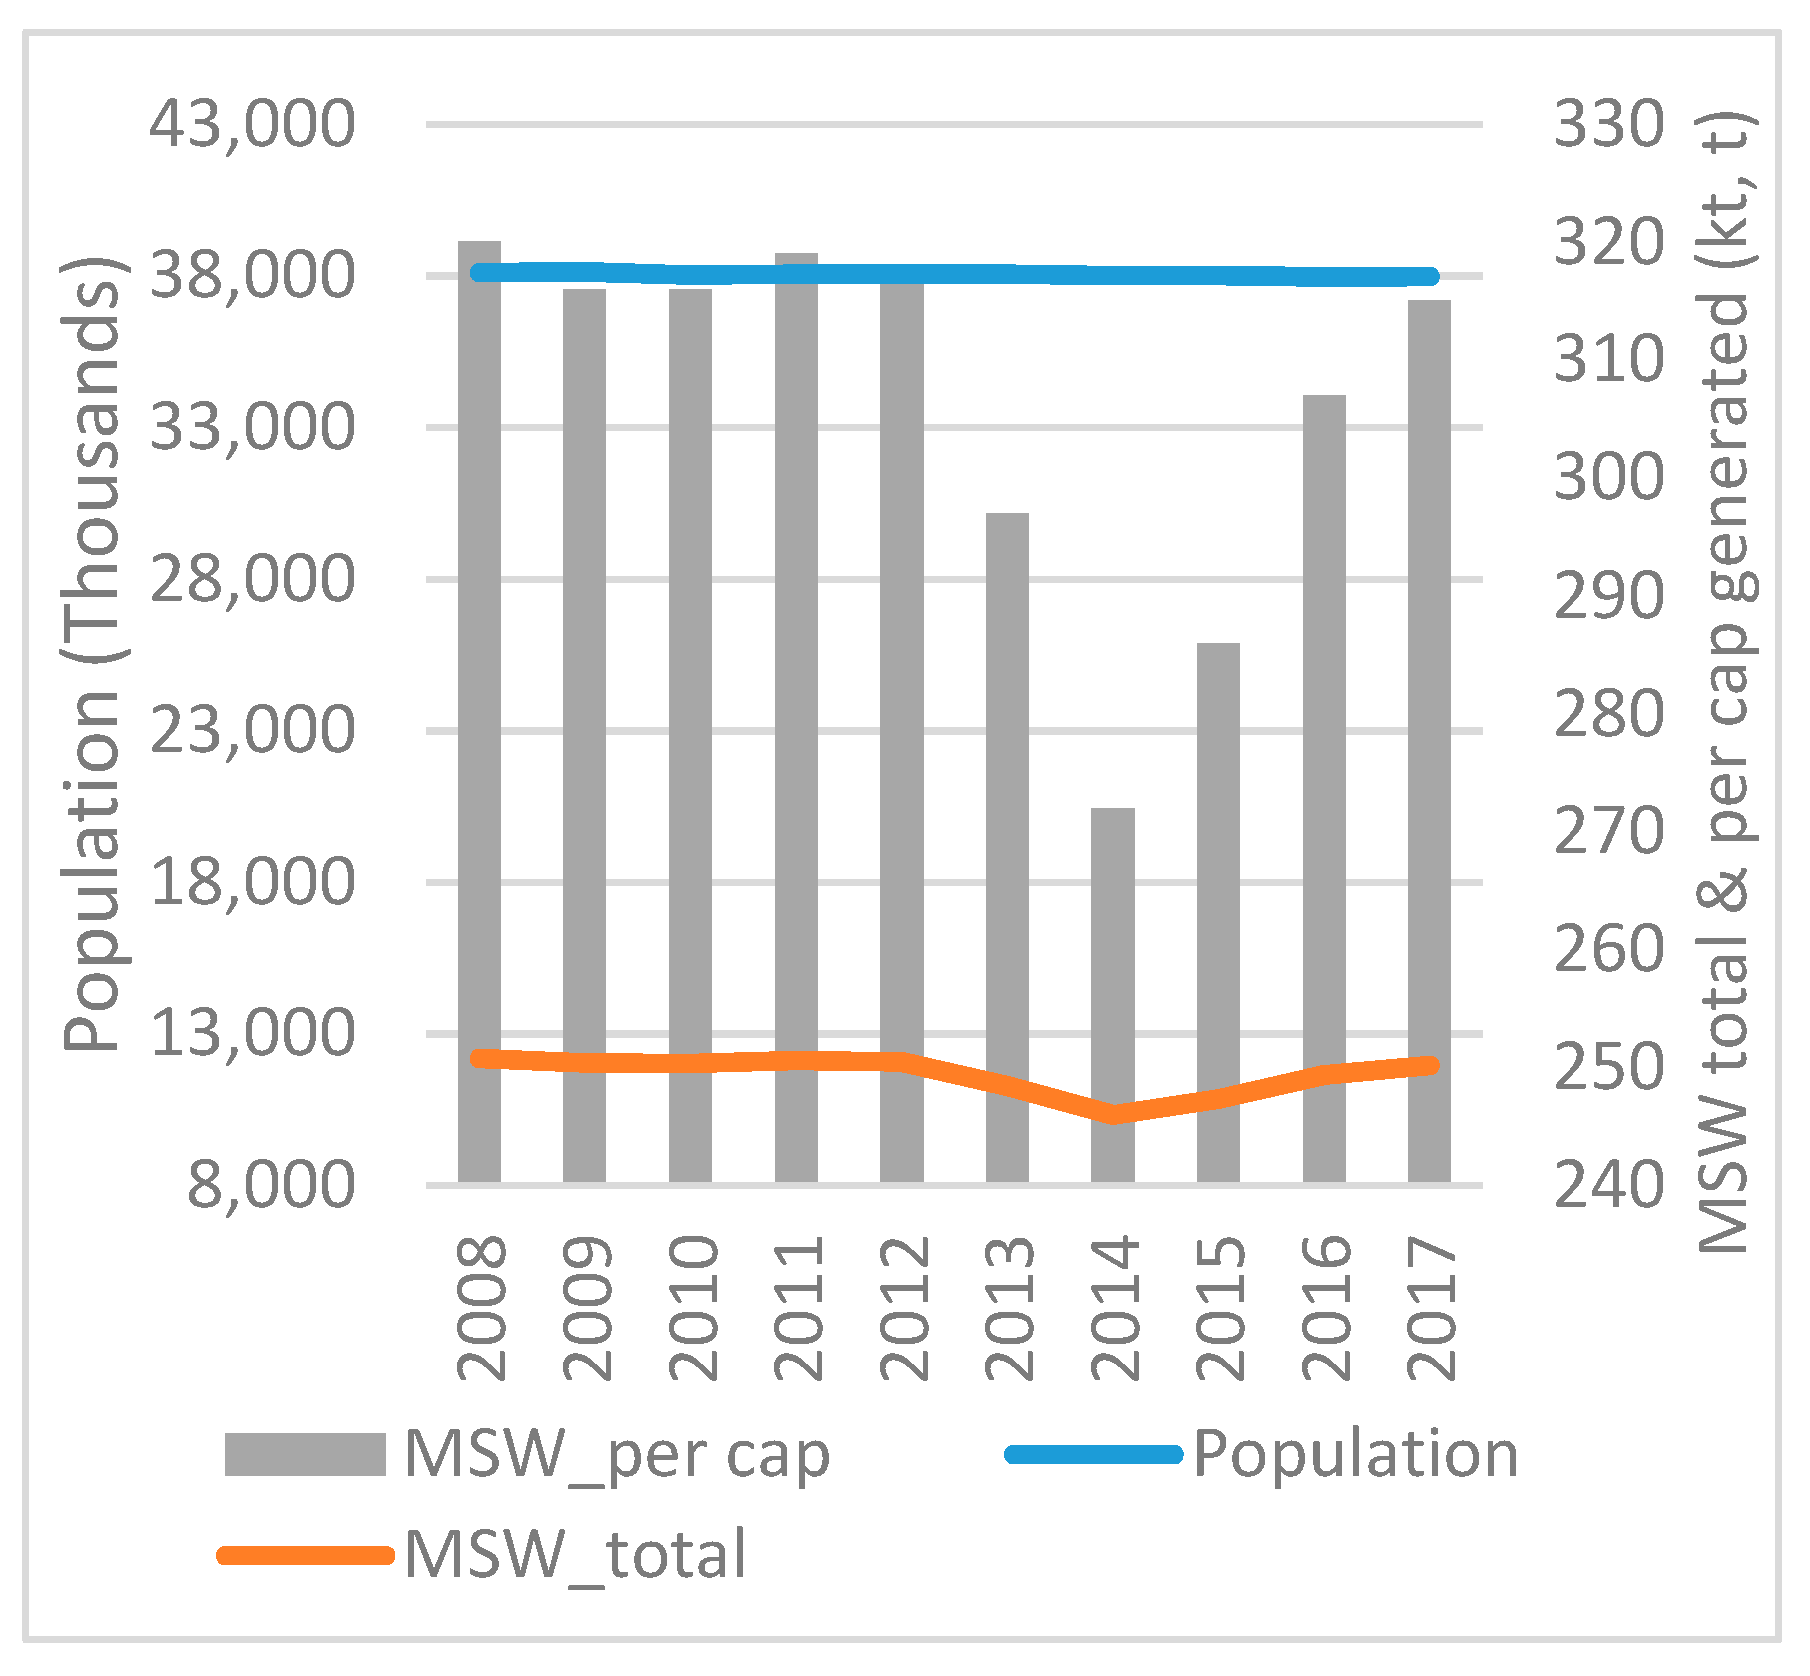
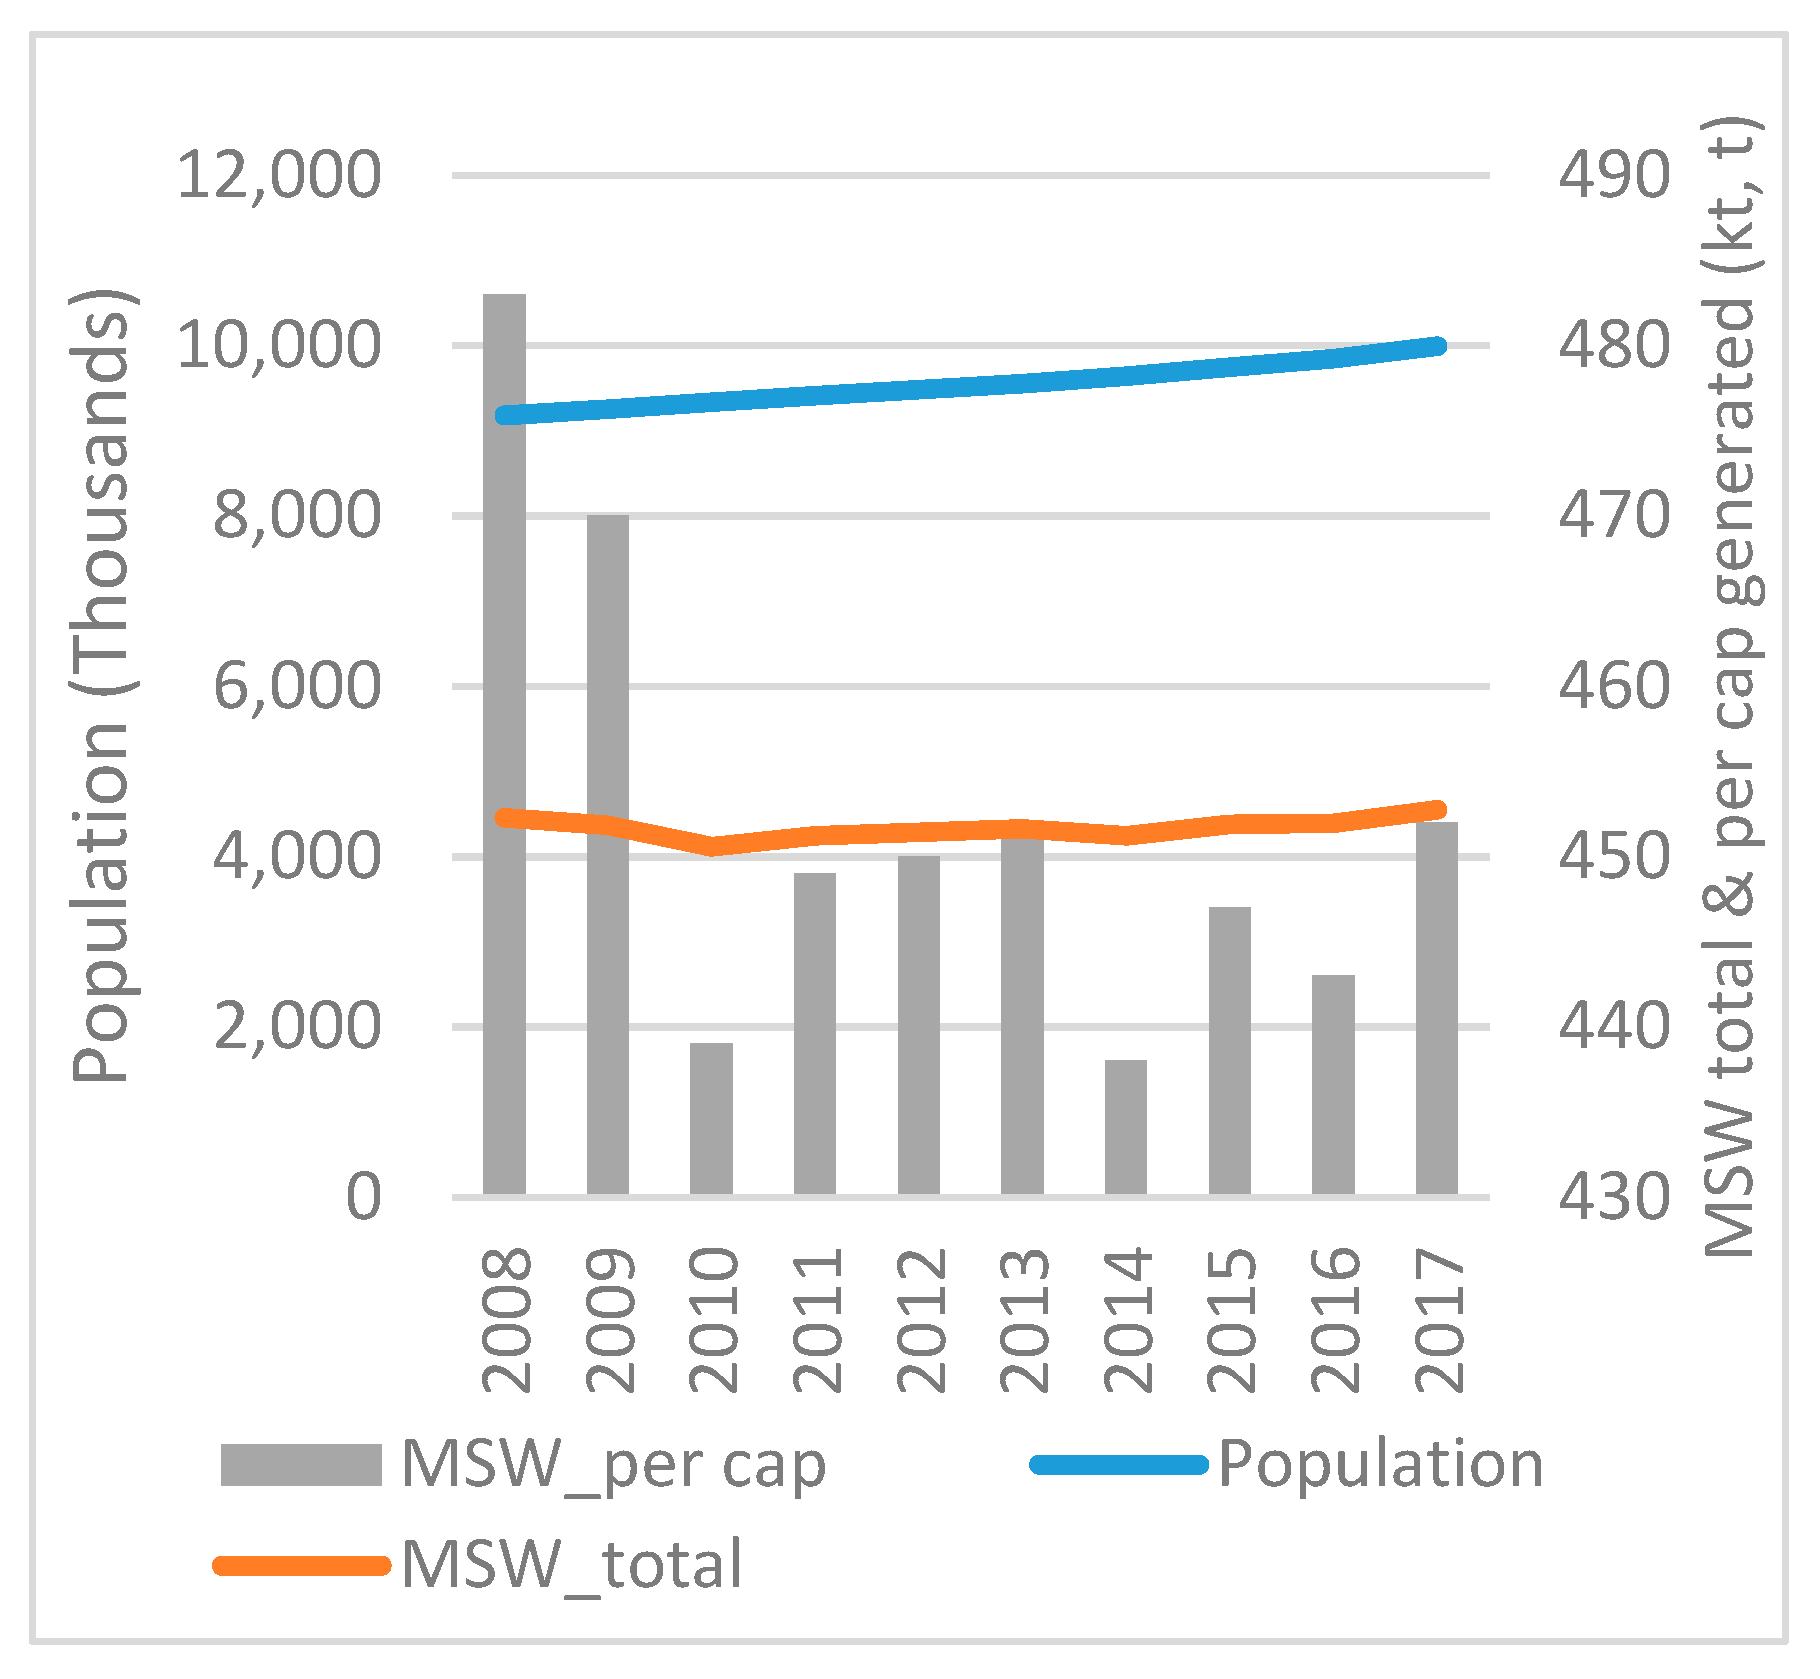
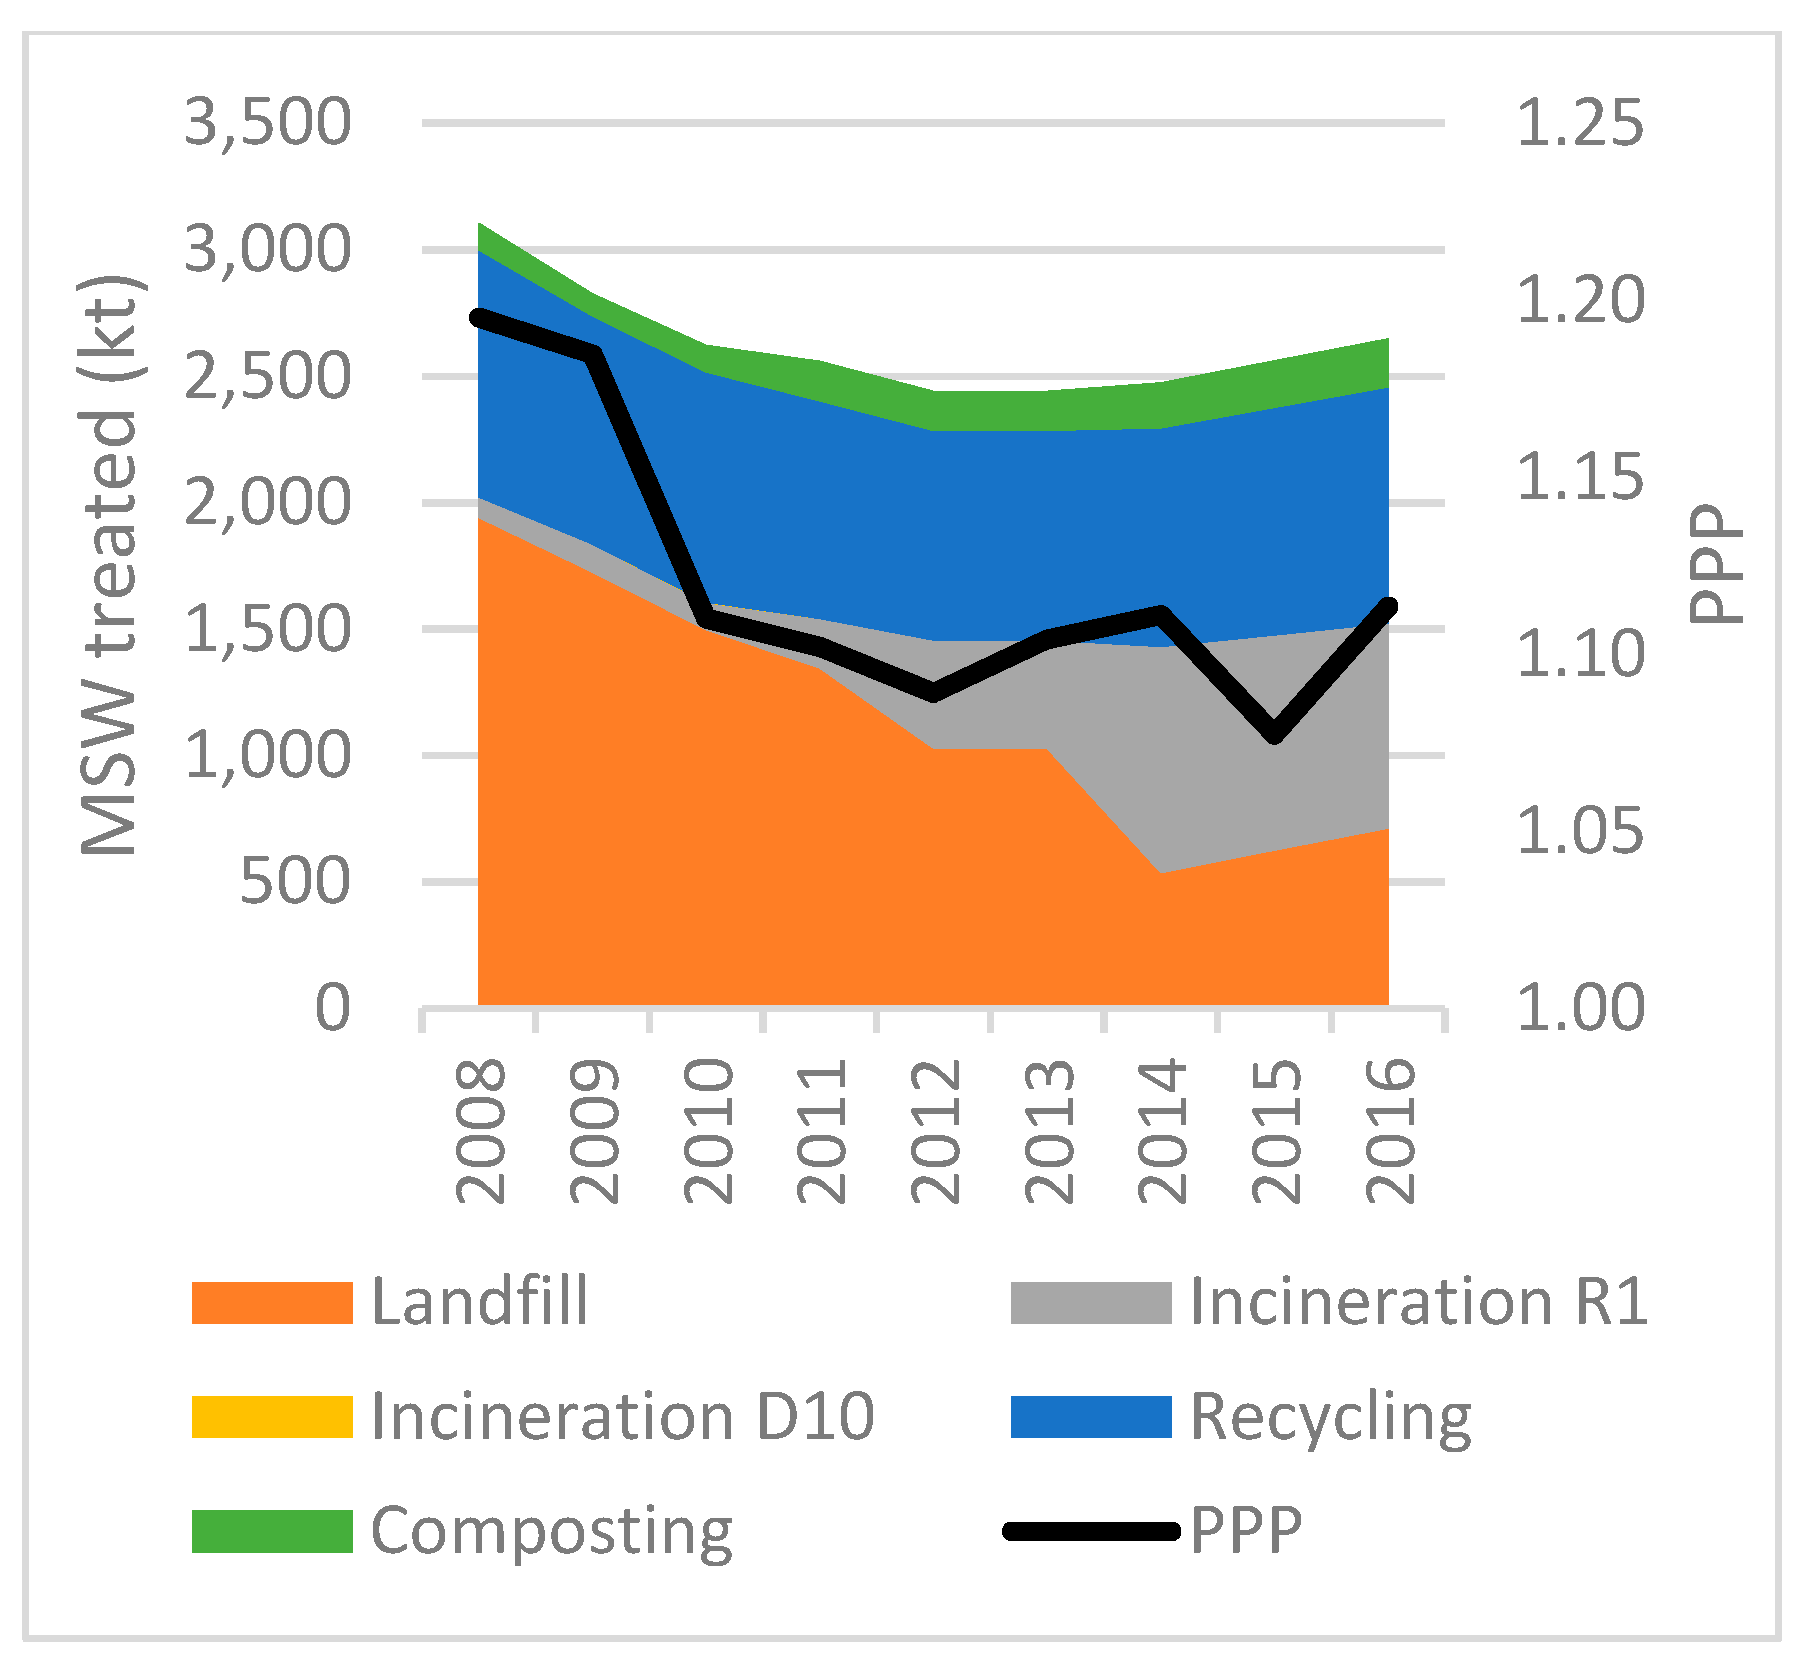
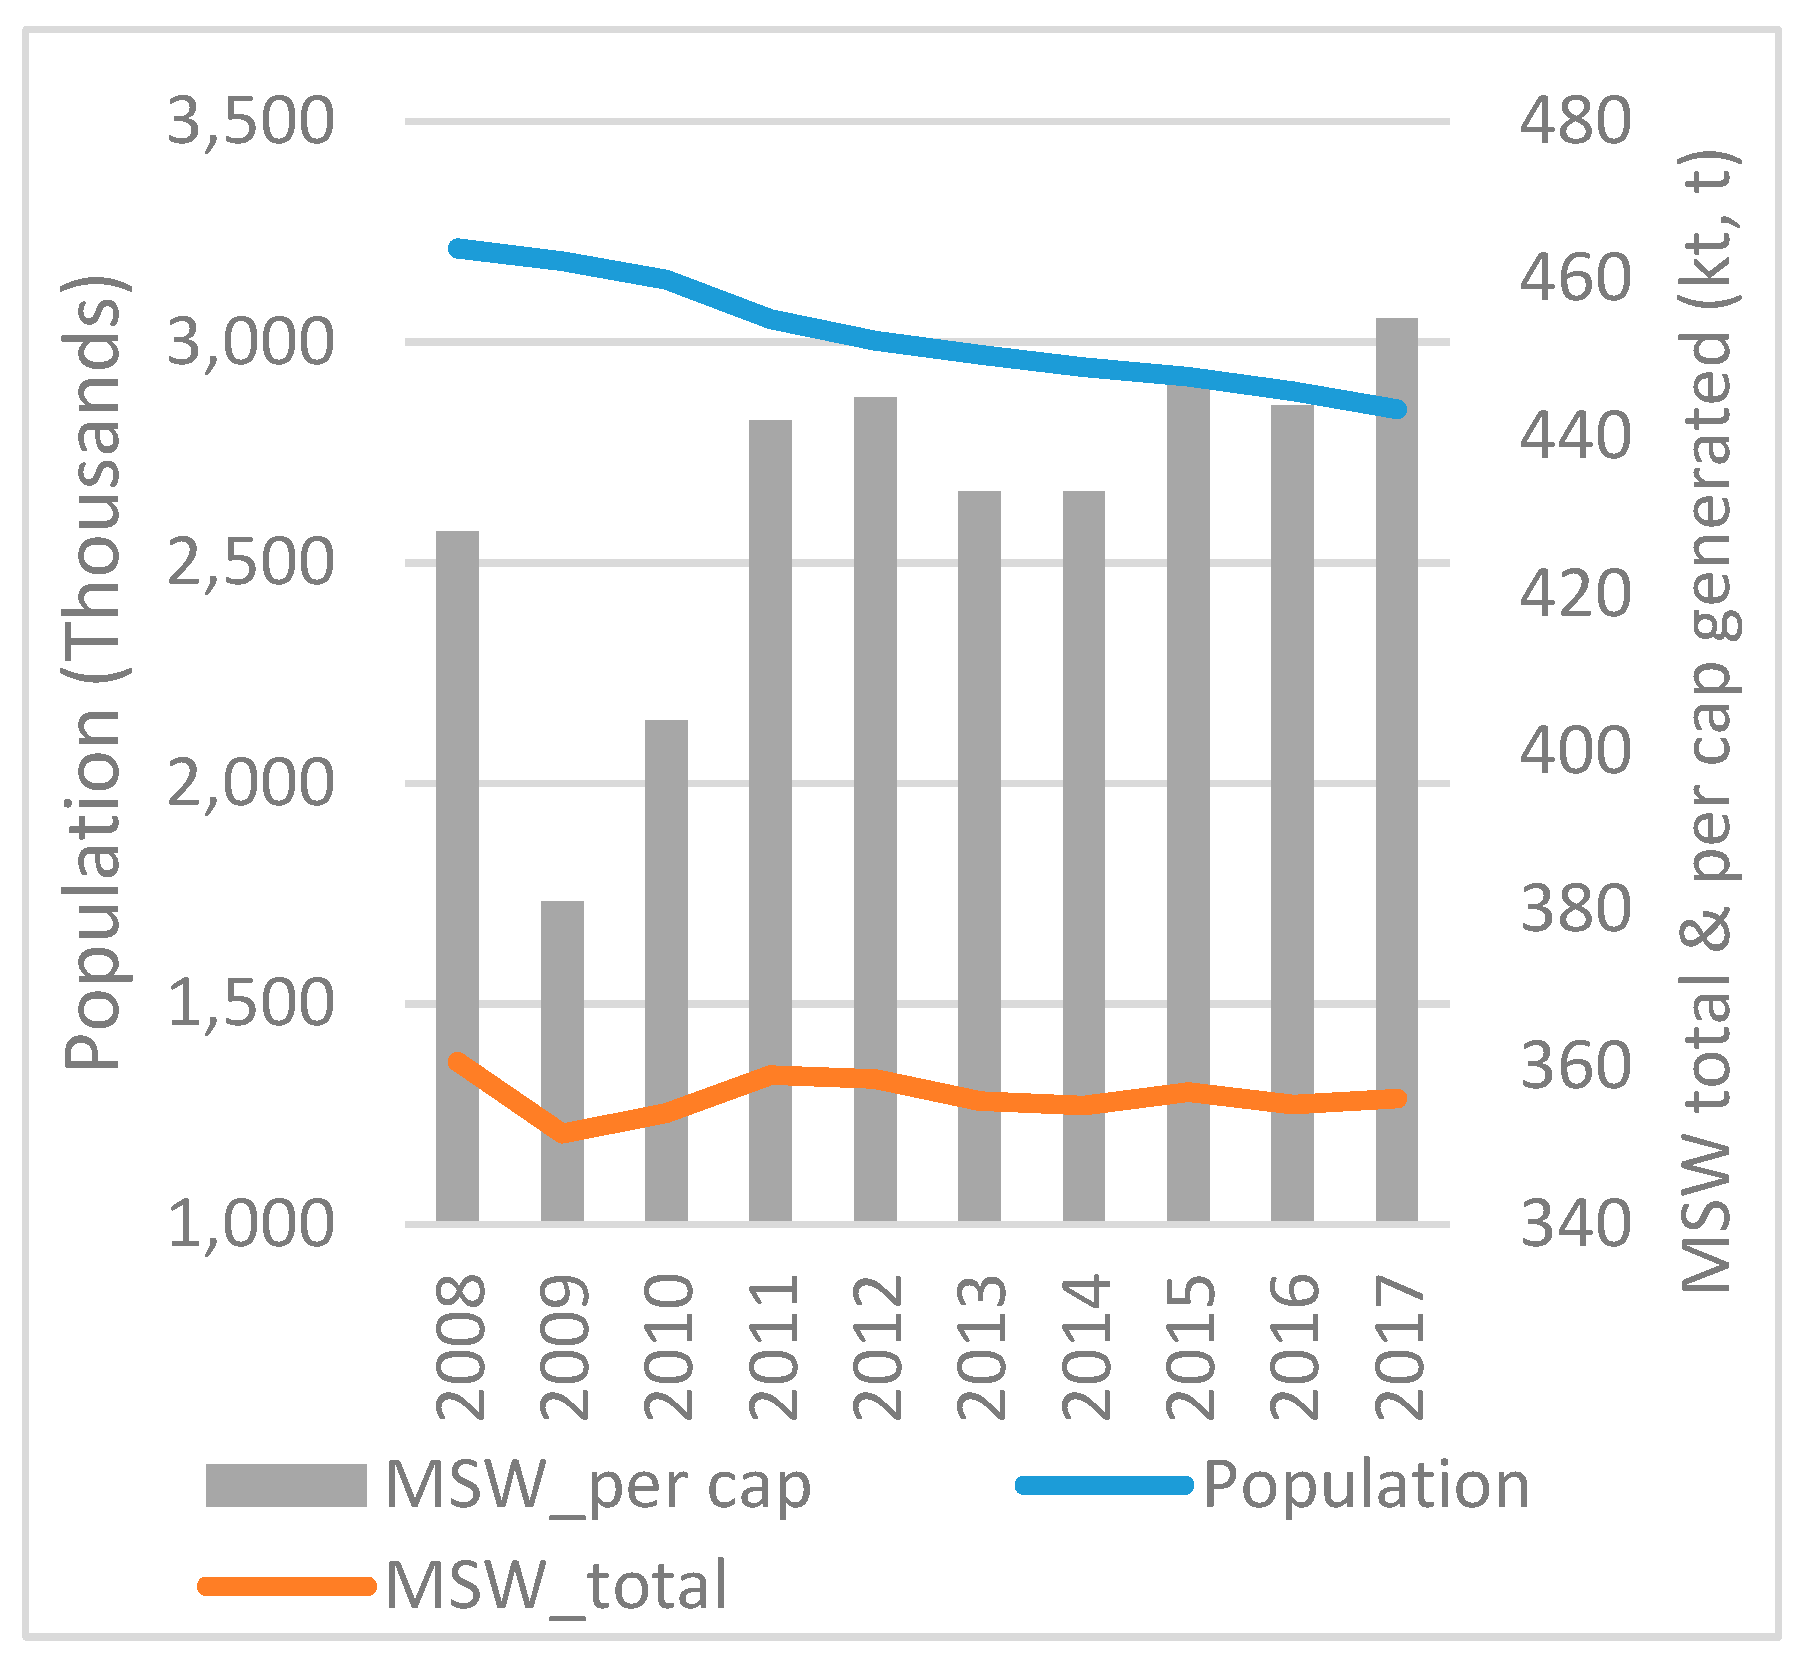
The population in Bulgaria has decreased by over 6% in the period under investigation. The amount of MSW generated has also decreased by over 30%, while per capita amount of MSW decreased by over 34% (
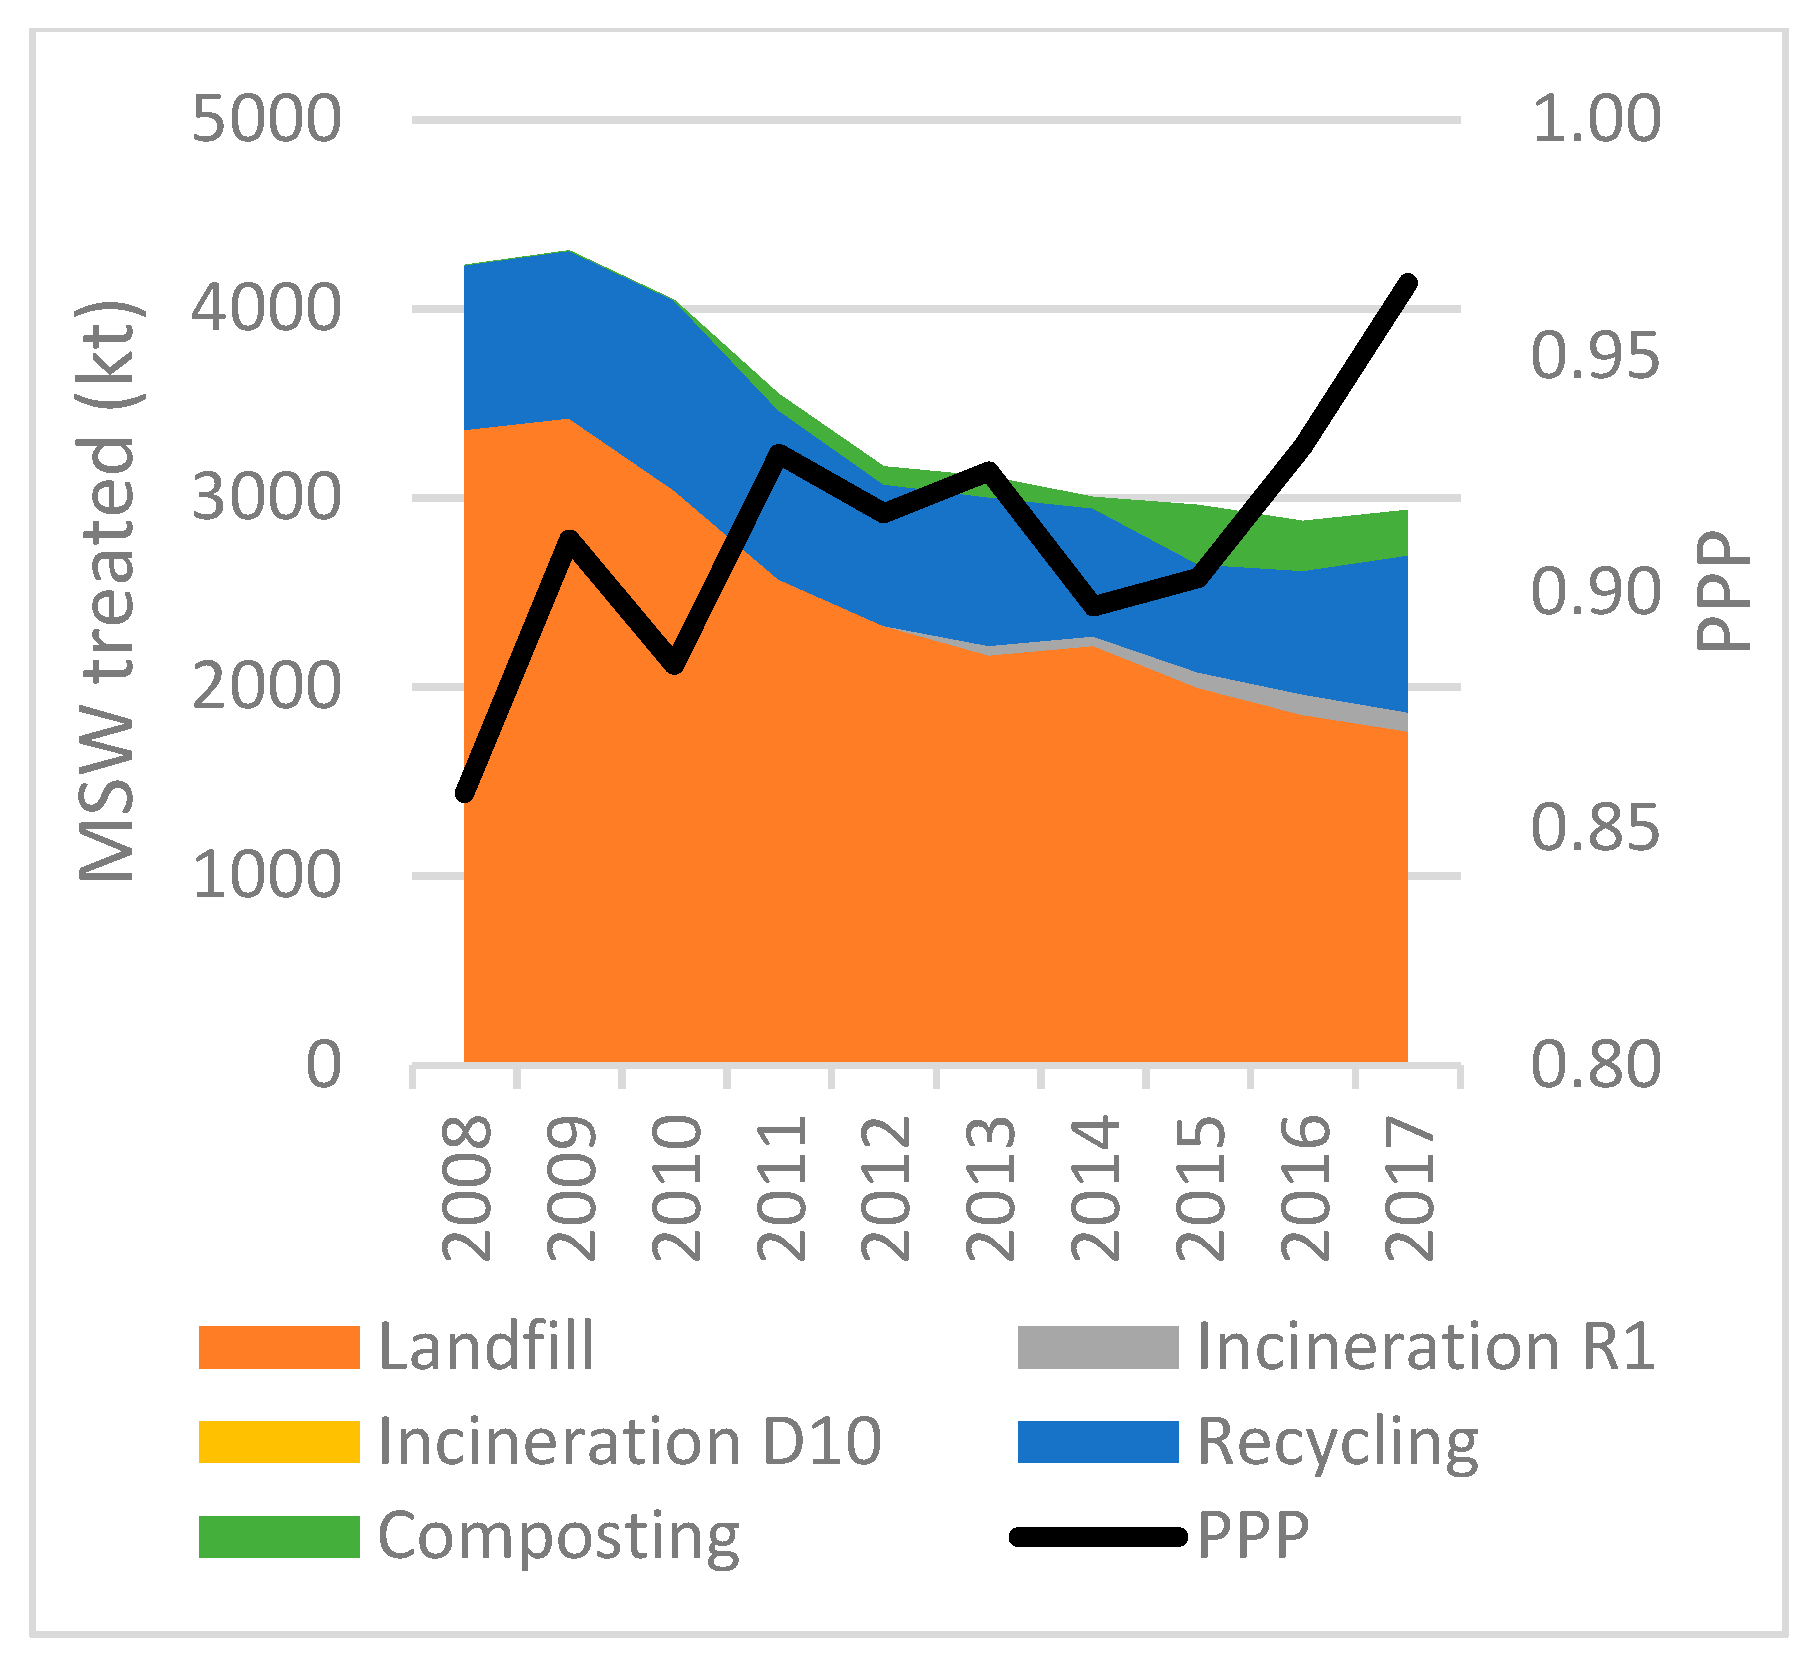
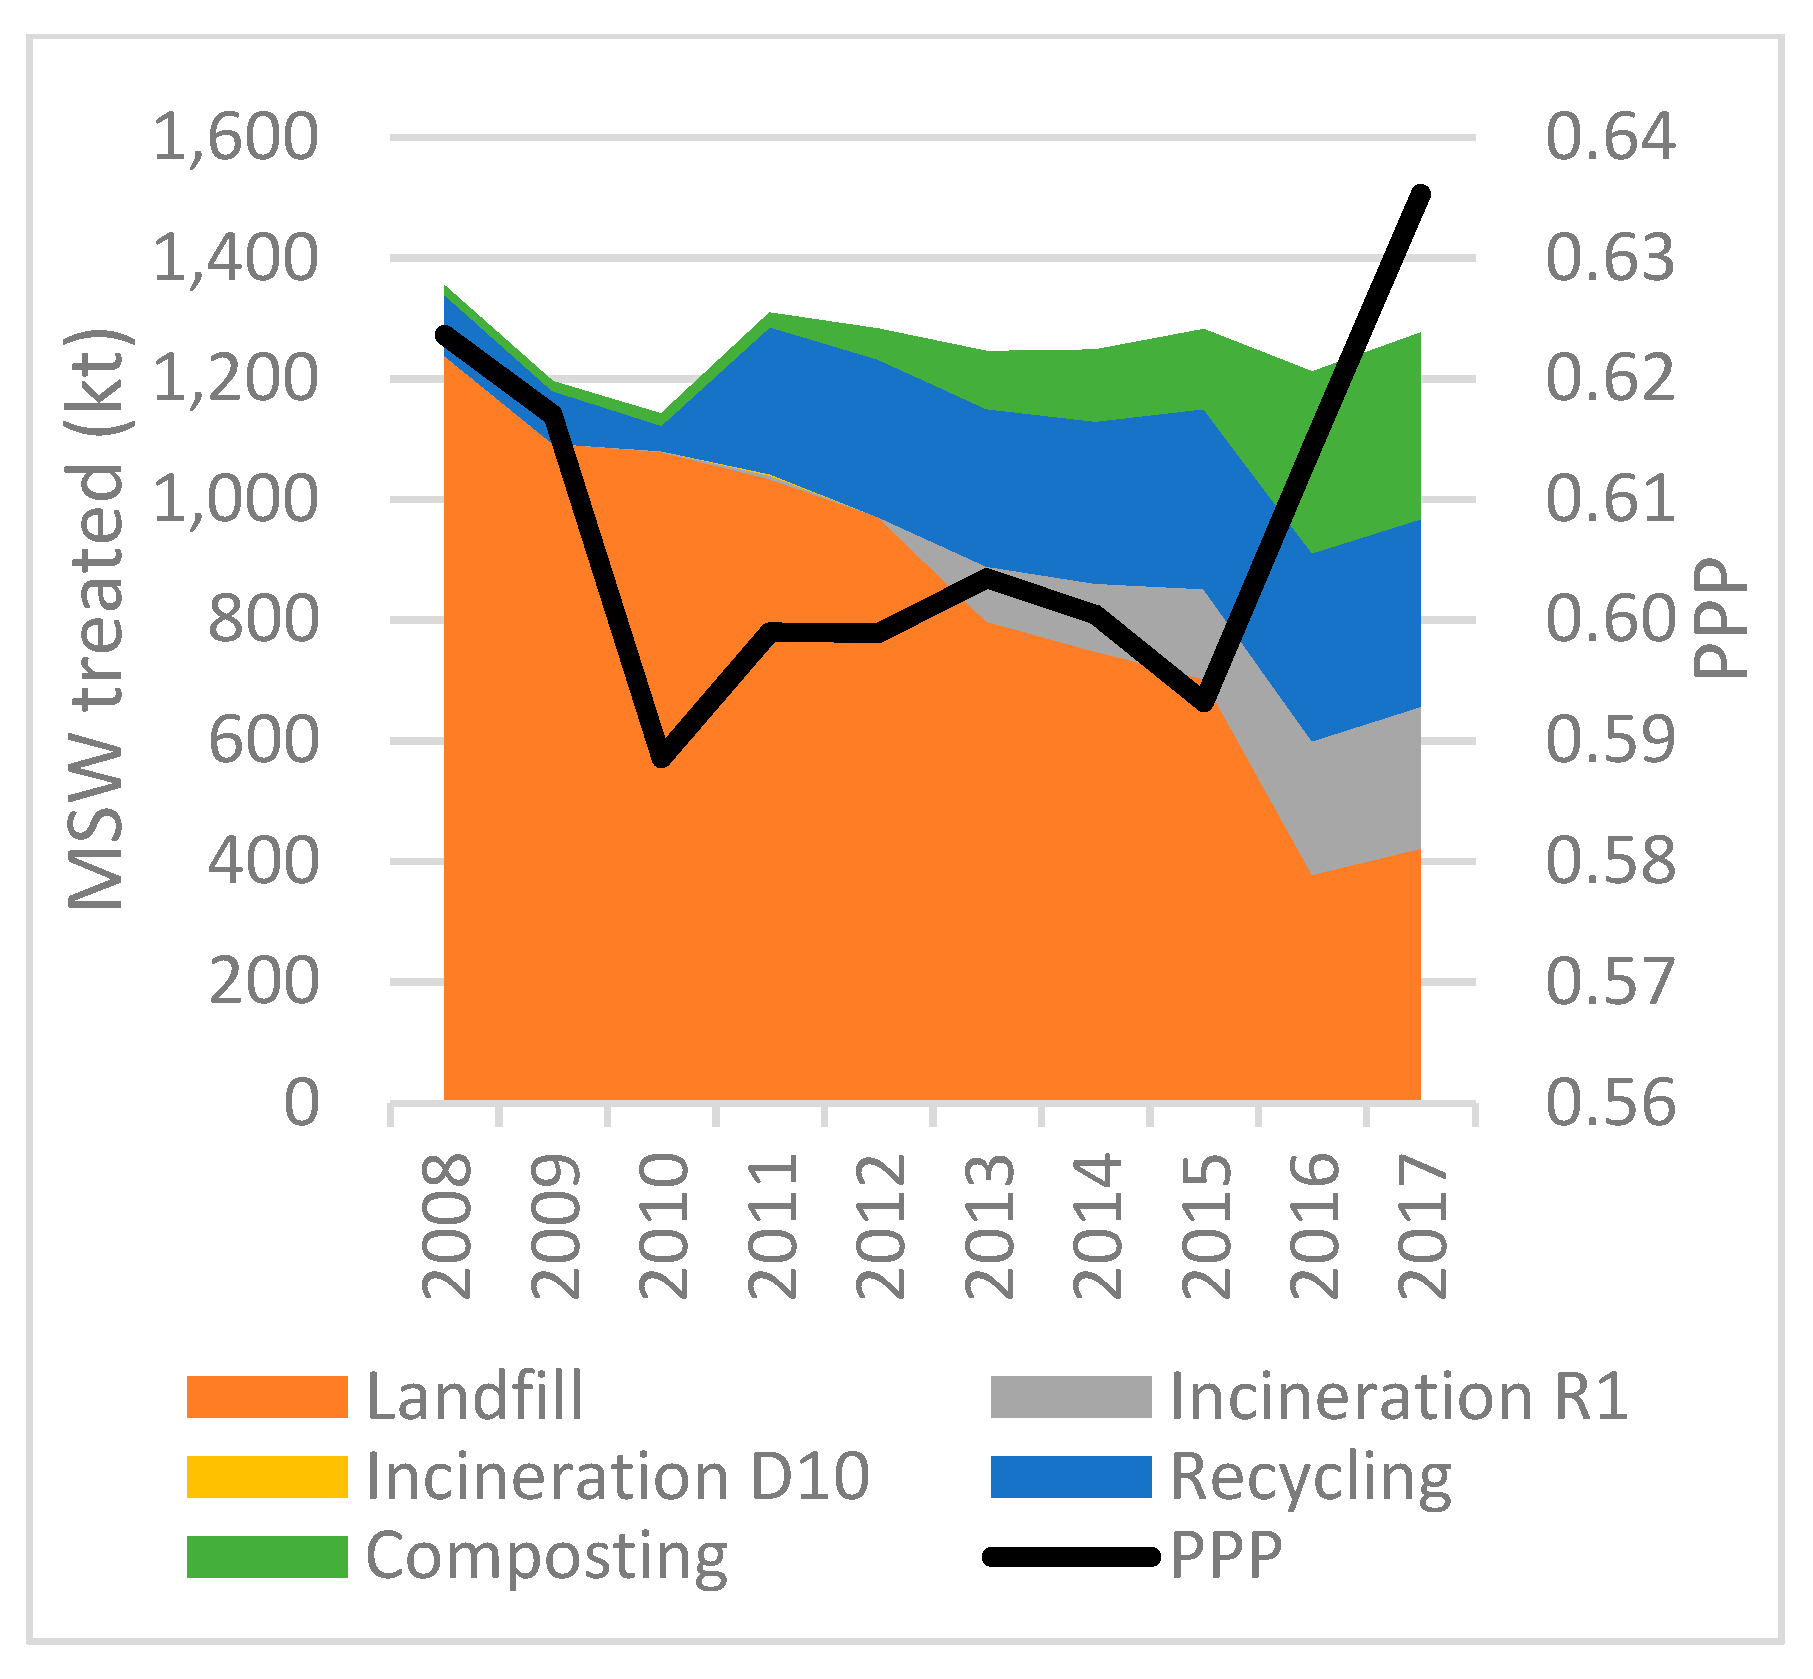
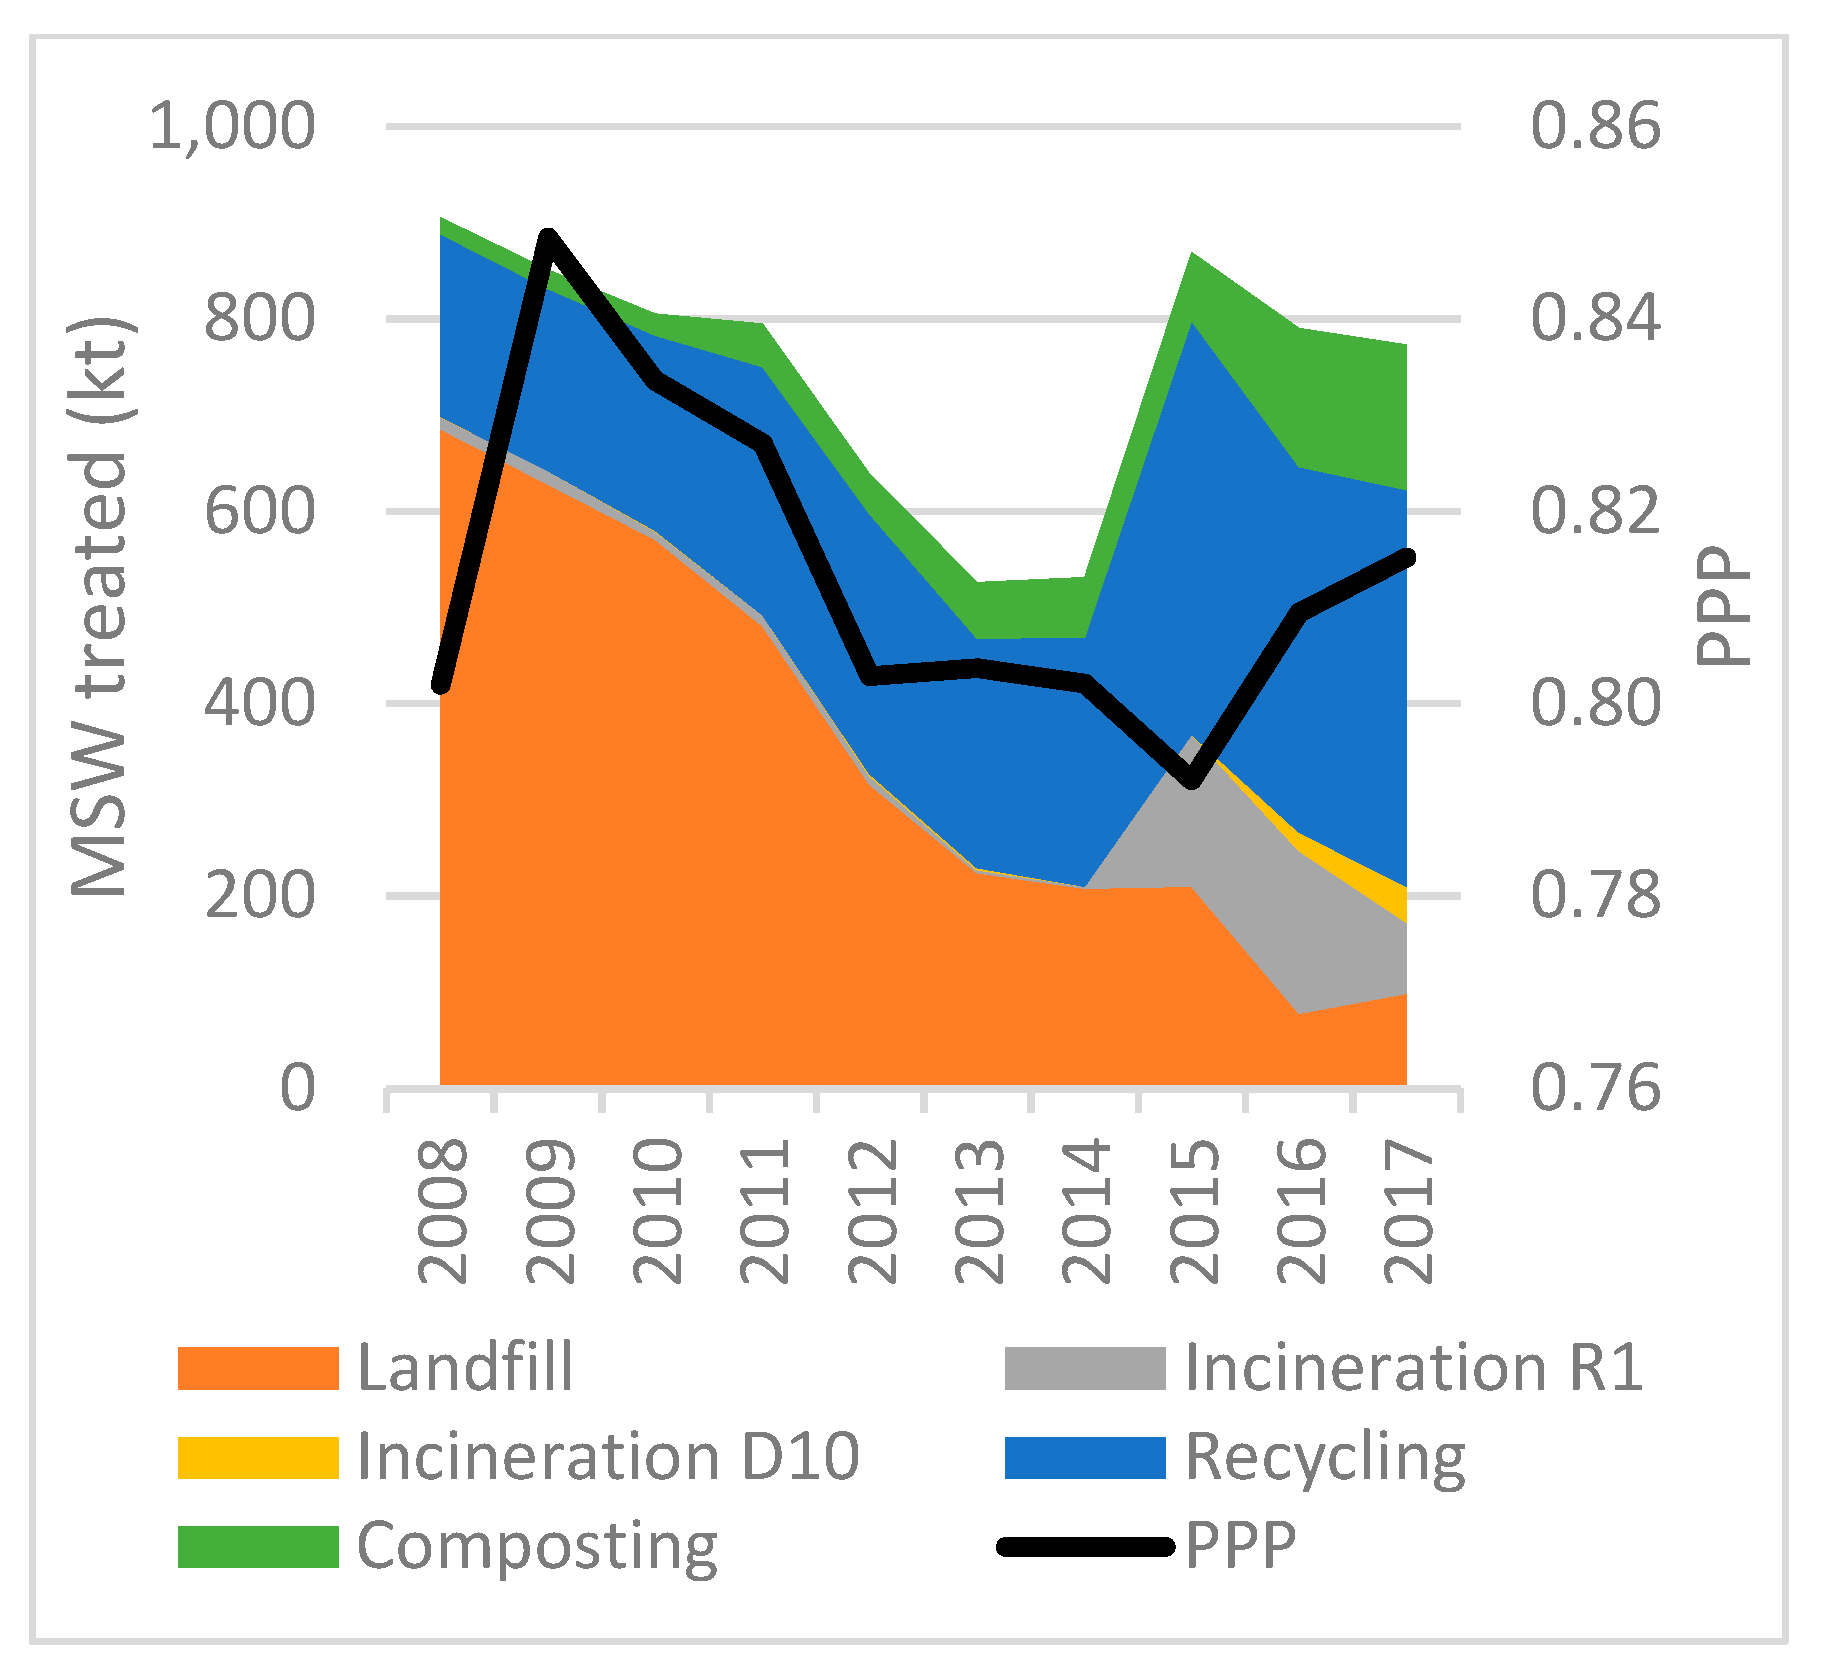
Figure 3). On the other hand, citizens’ PPP over the examined period, has increased by over 20%. Concerning the waste treatment methods in Bulgaria, landfilling is the most common method for waste treatment. In 2008, 78% of the MSW generated was disposed of in landfills. By the end of 2017, the disposed amount decreased by almost 40%. Recycling is the second most used method for waste treatment, accounting for 23% (average), while composting has been used since 2011. In 2013, incineration with energy recovery (R1) was adopted as a waste treatment method, treating over 100 kt in 2017. Subsequently, incineration without energy recovery (D10) has not been used (
Figure 4).
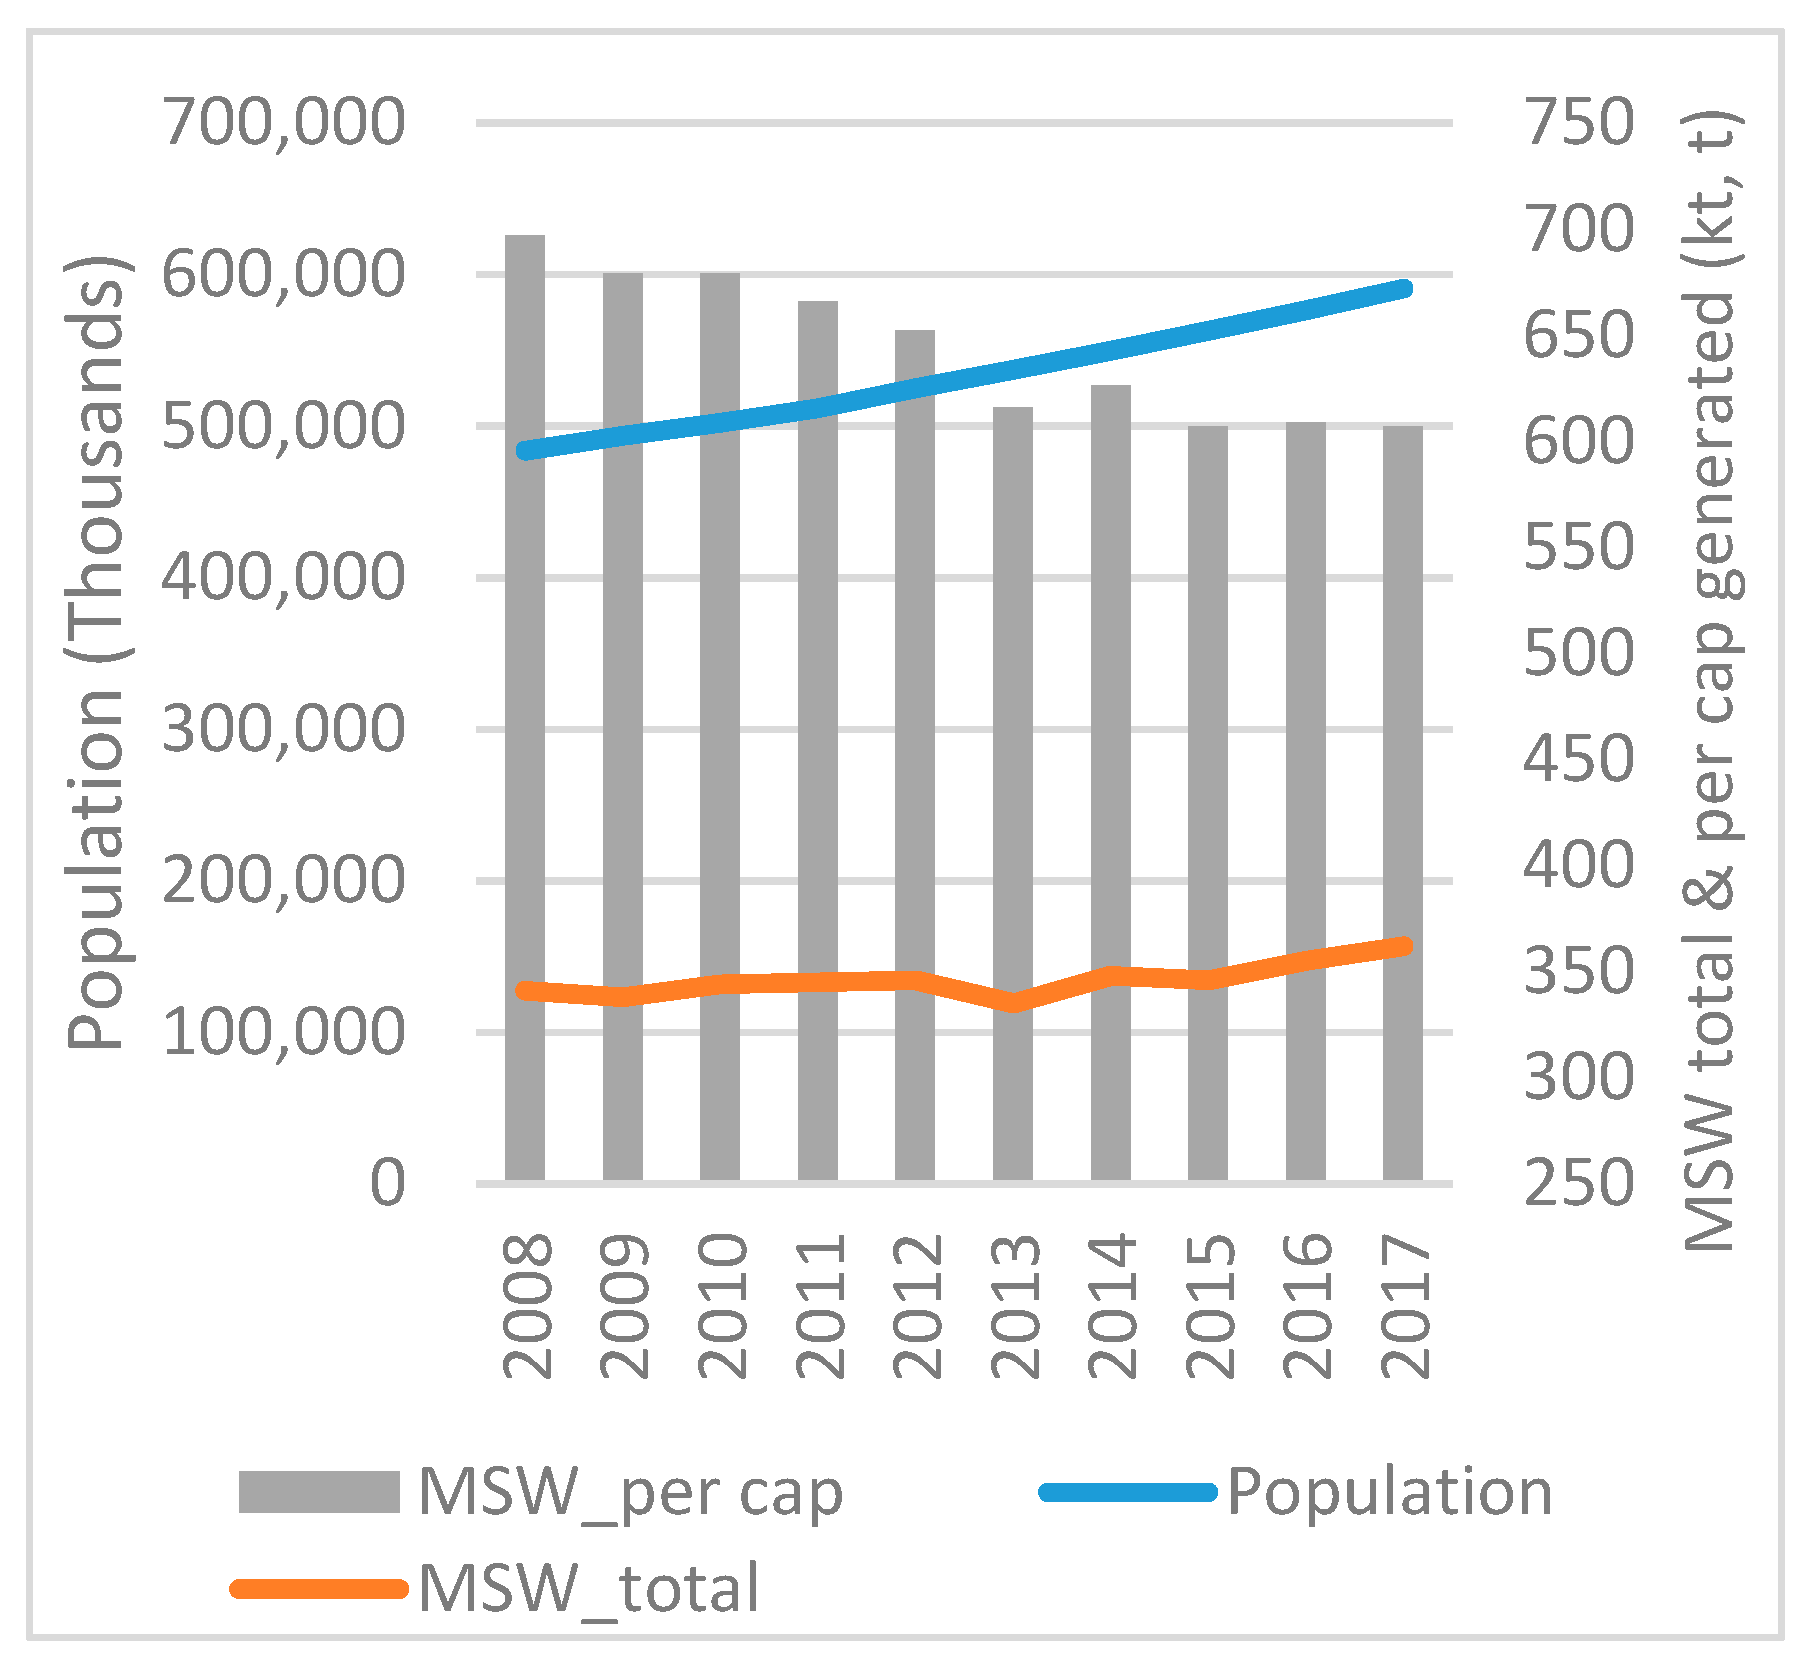
• Czech Republic
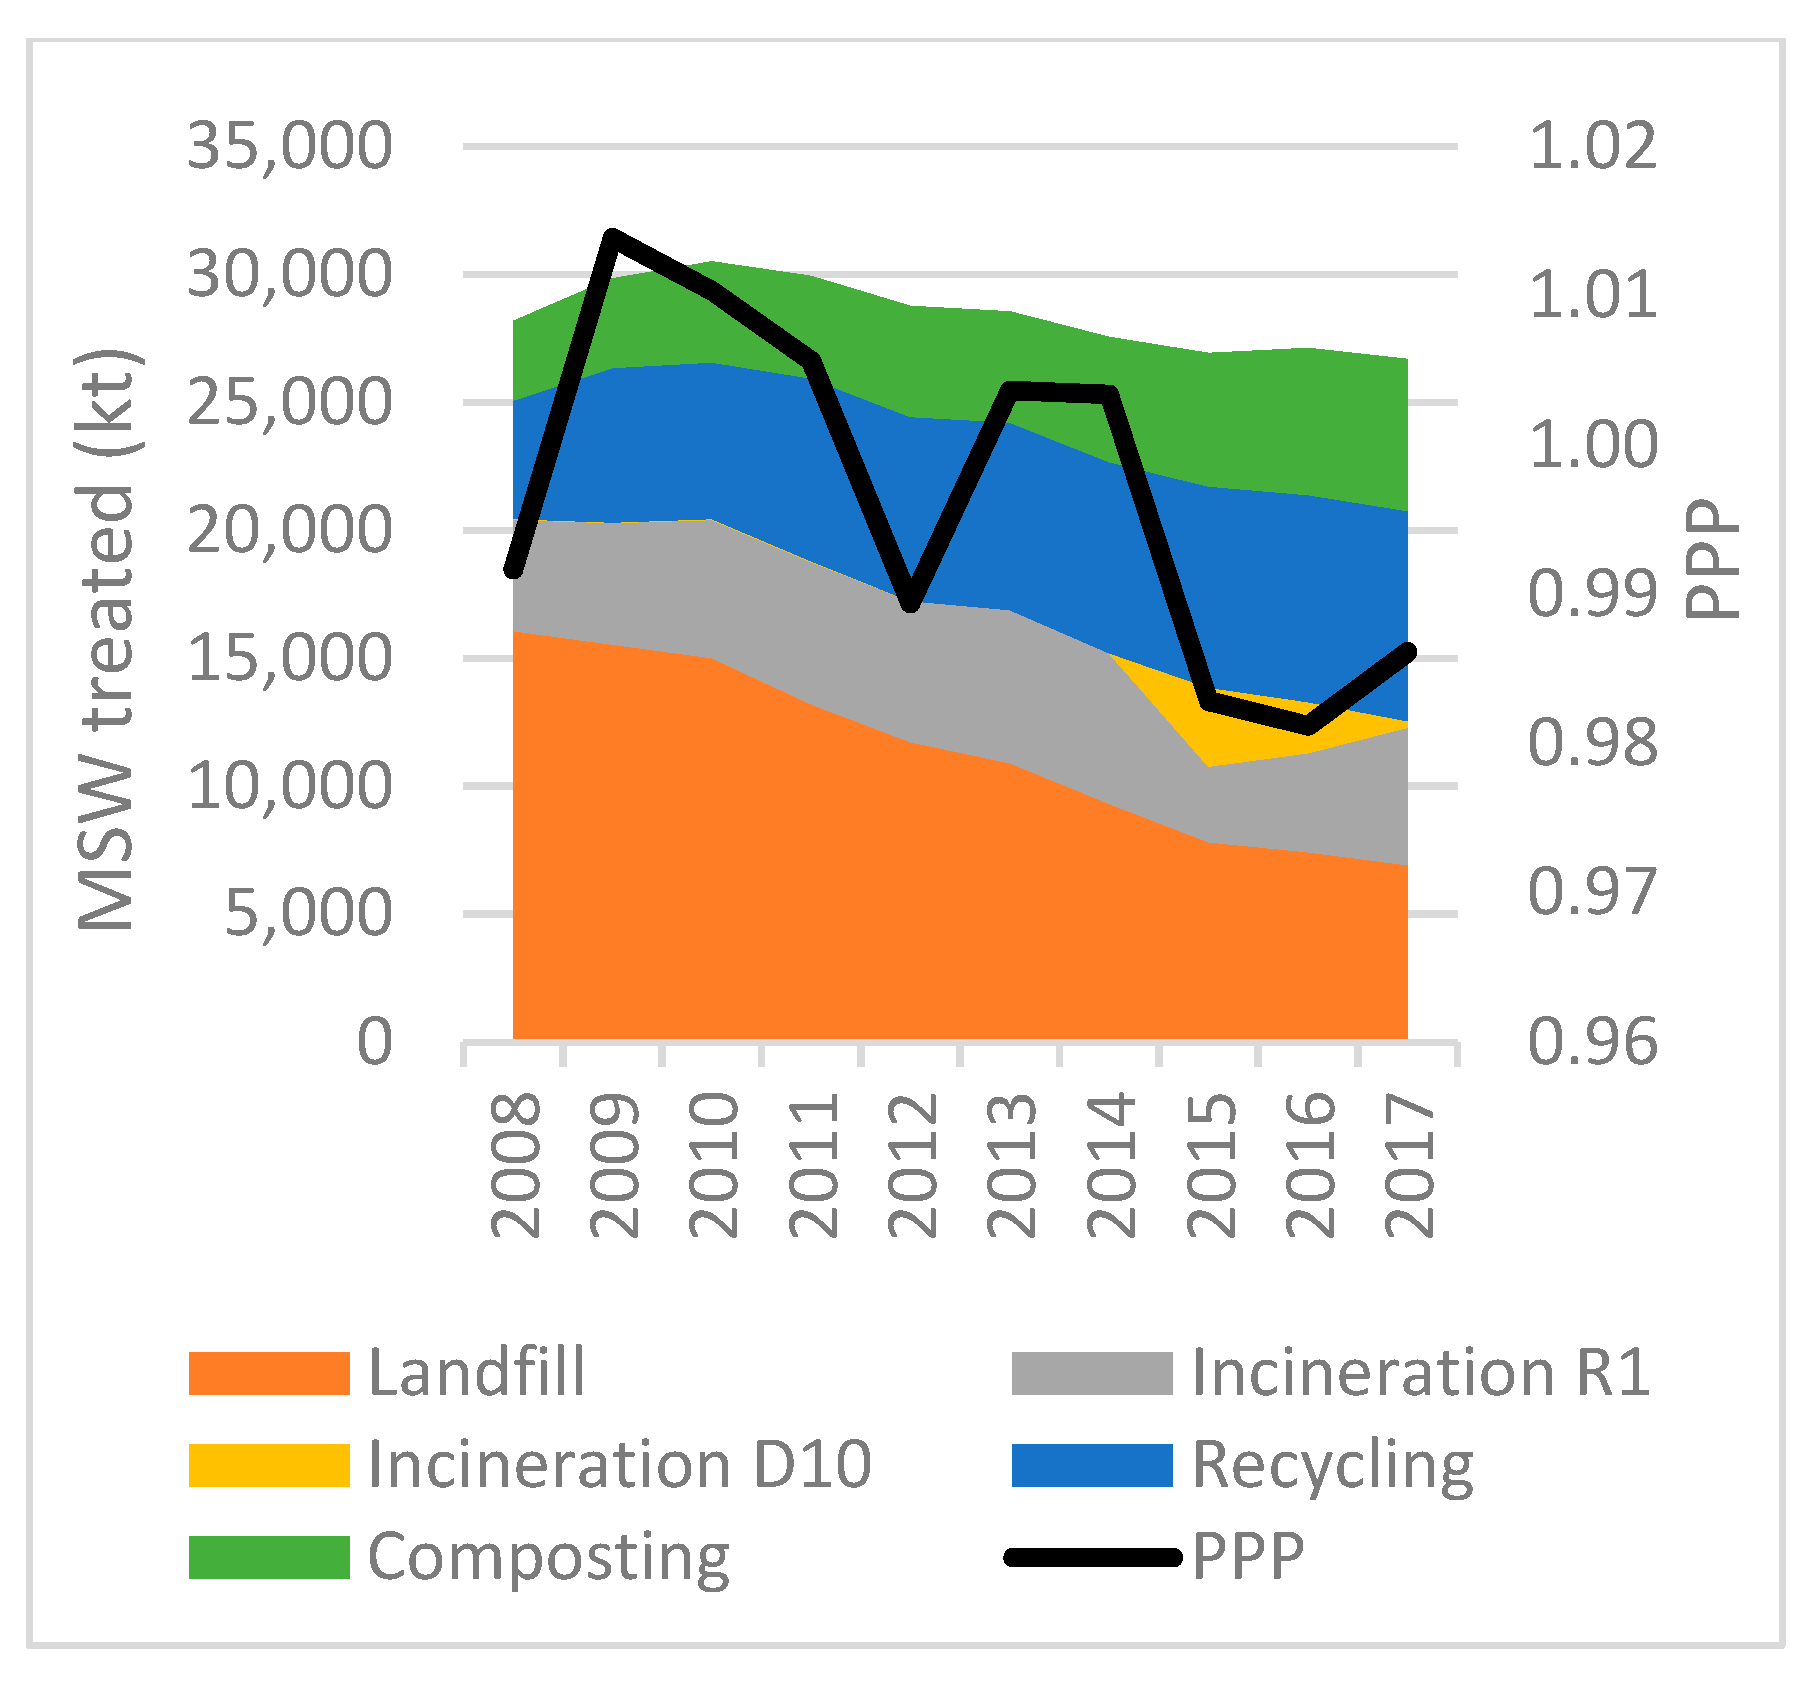
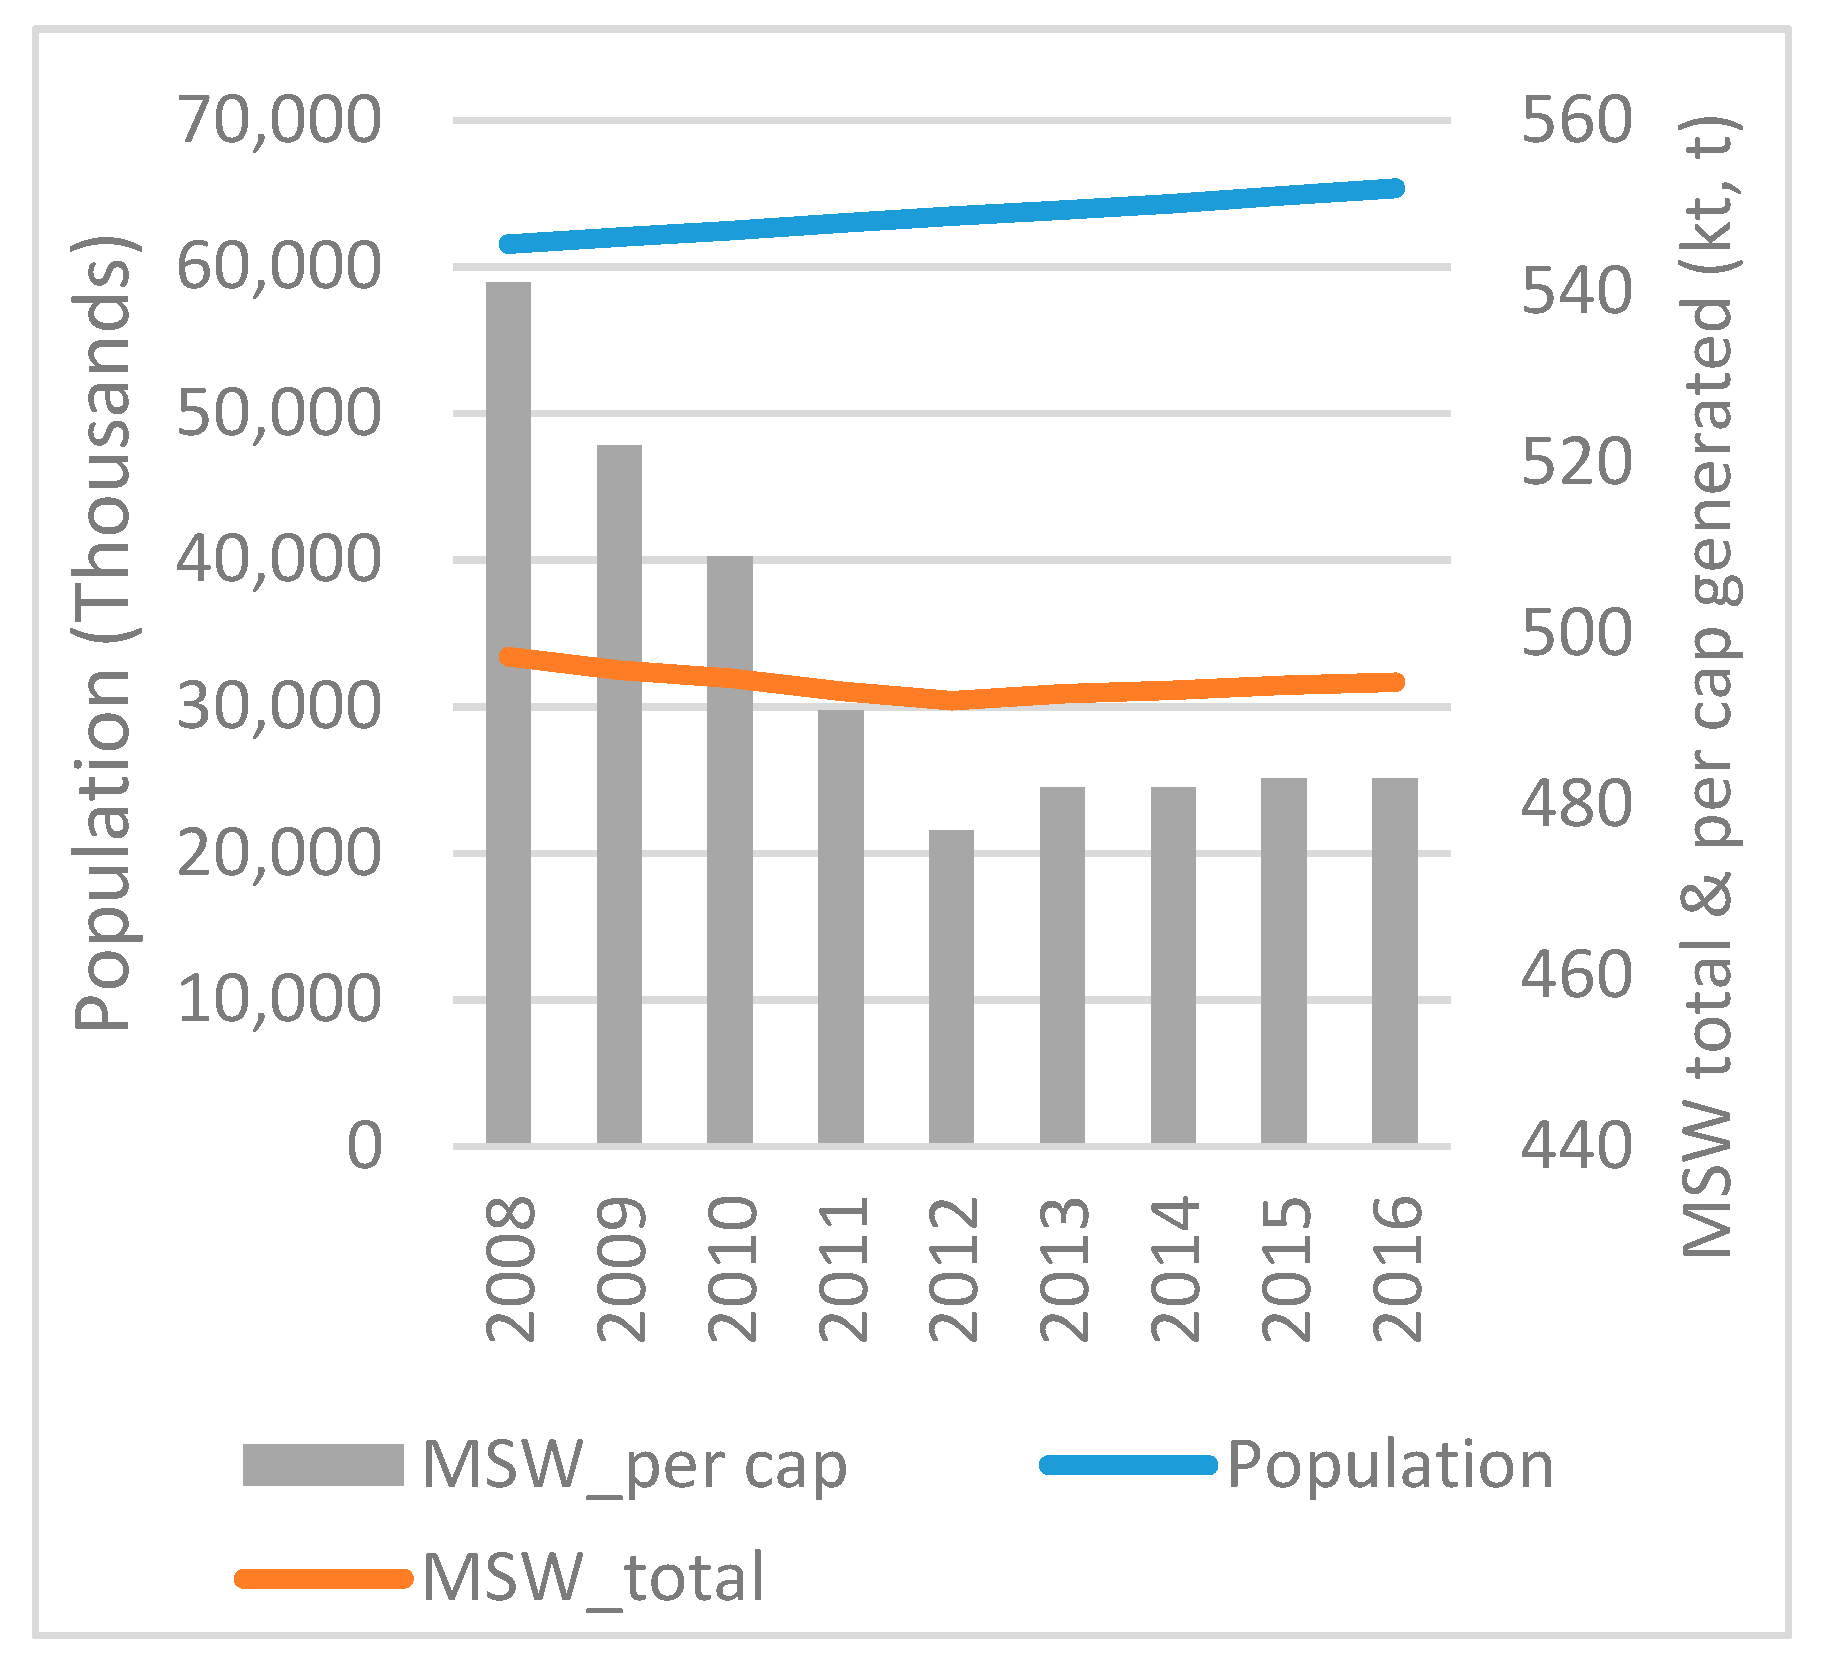
The amount of MSW generated has increased over the years, as has the population. Both factors have seen an increase of 20% and 3% respectively, while per MSW production has also increased and is equal to 12.50% (
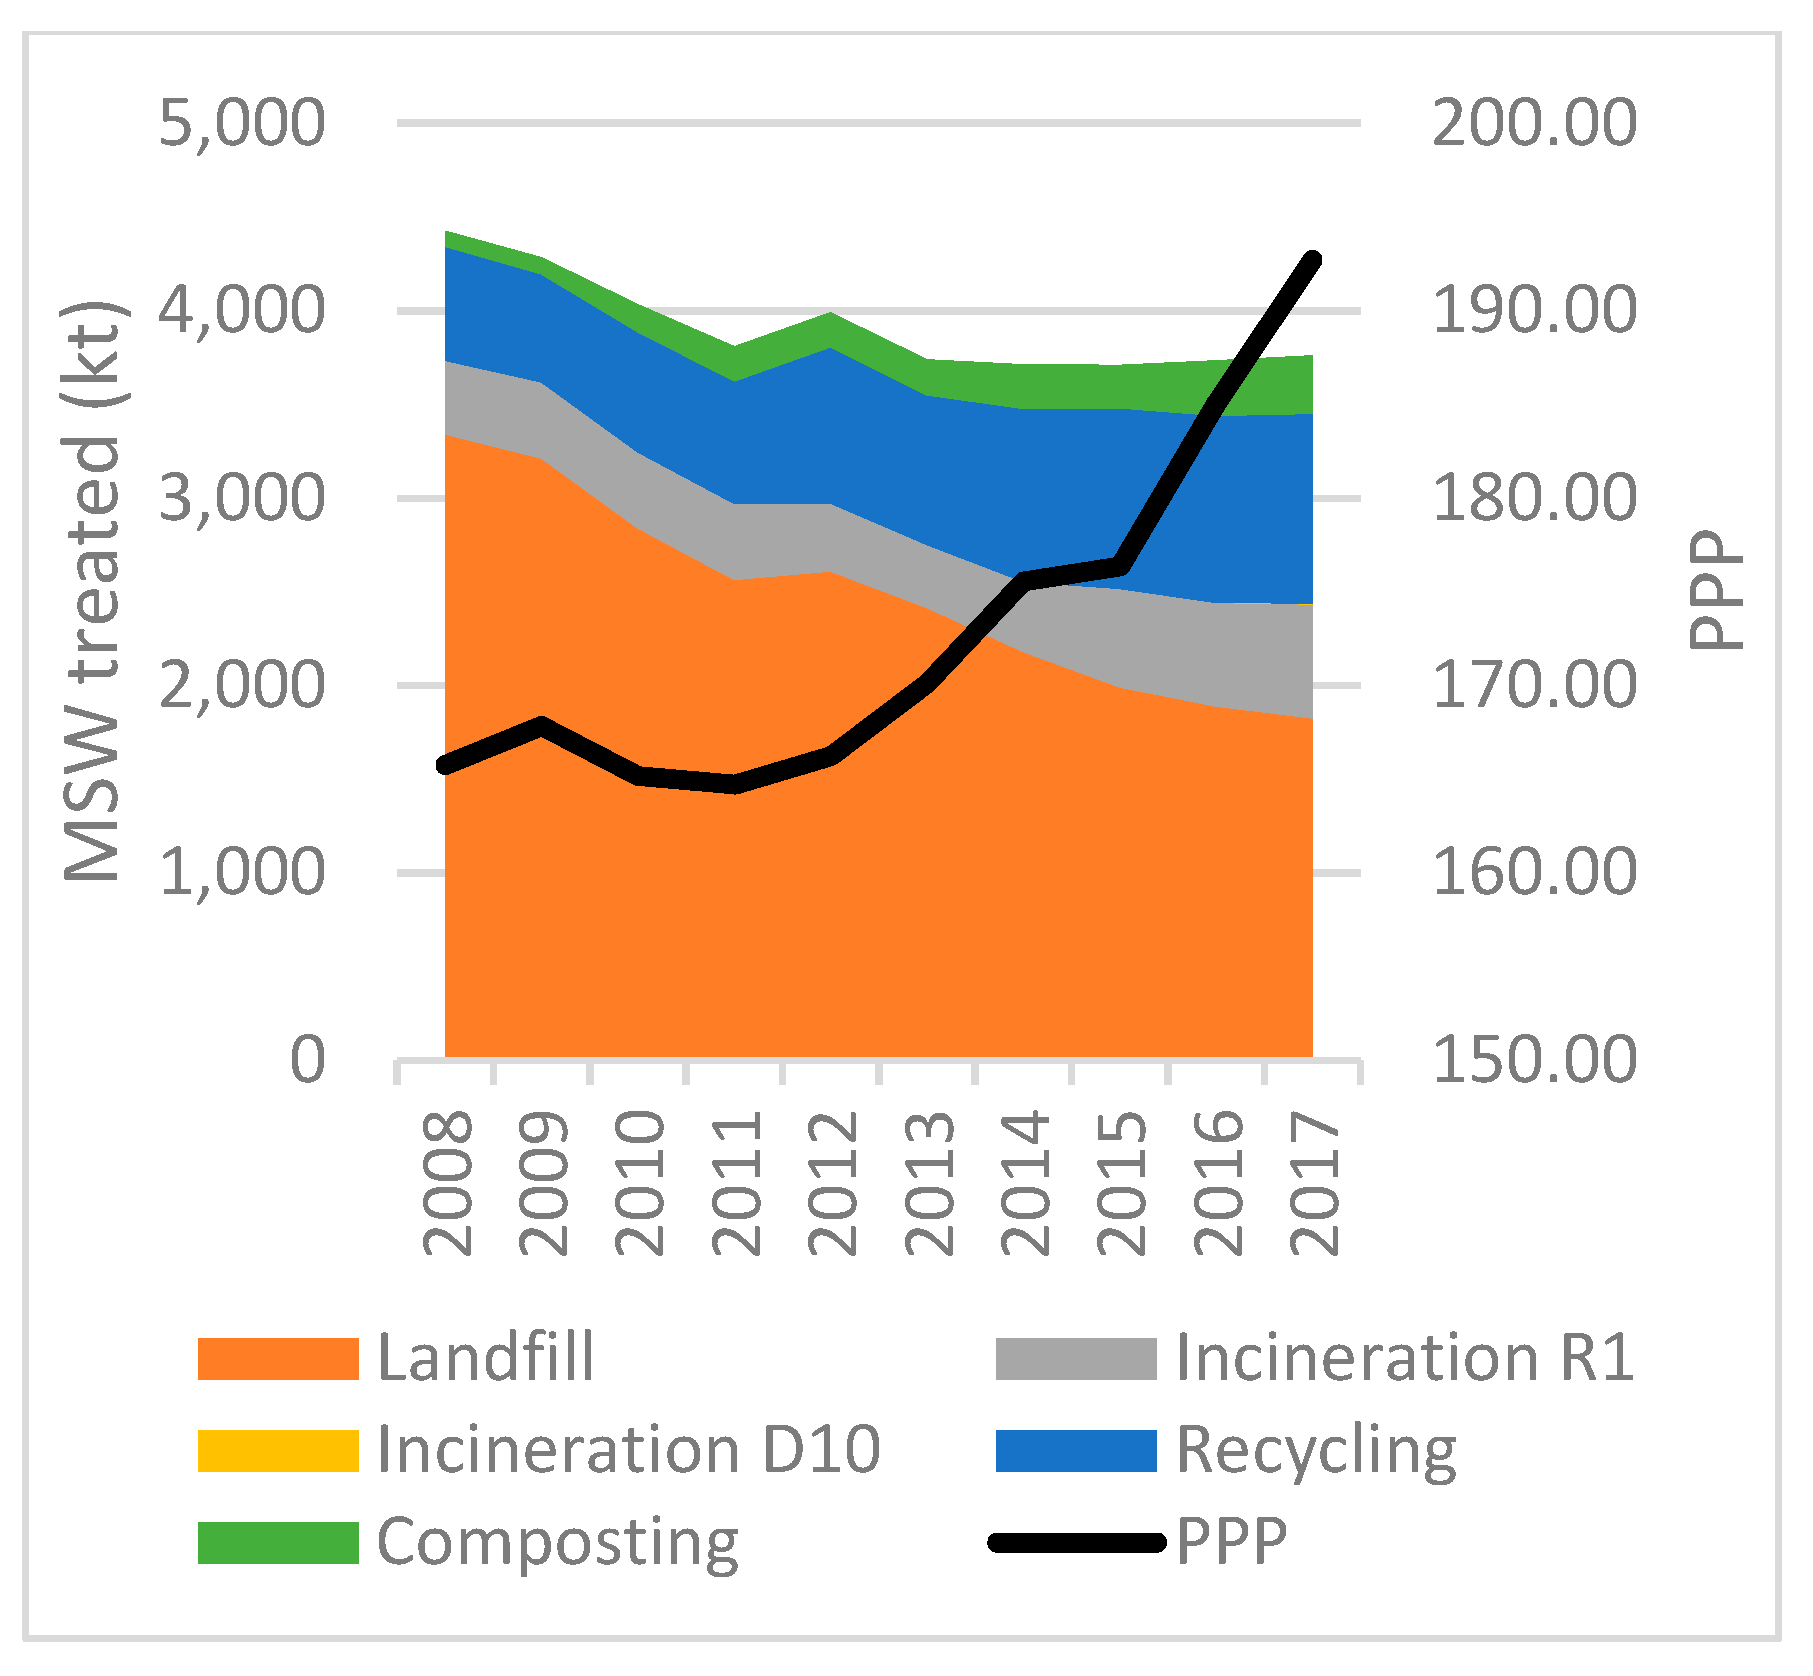
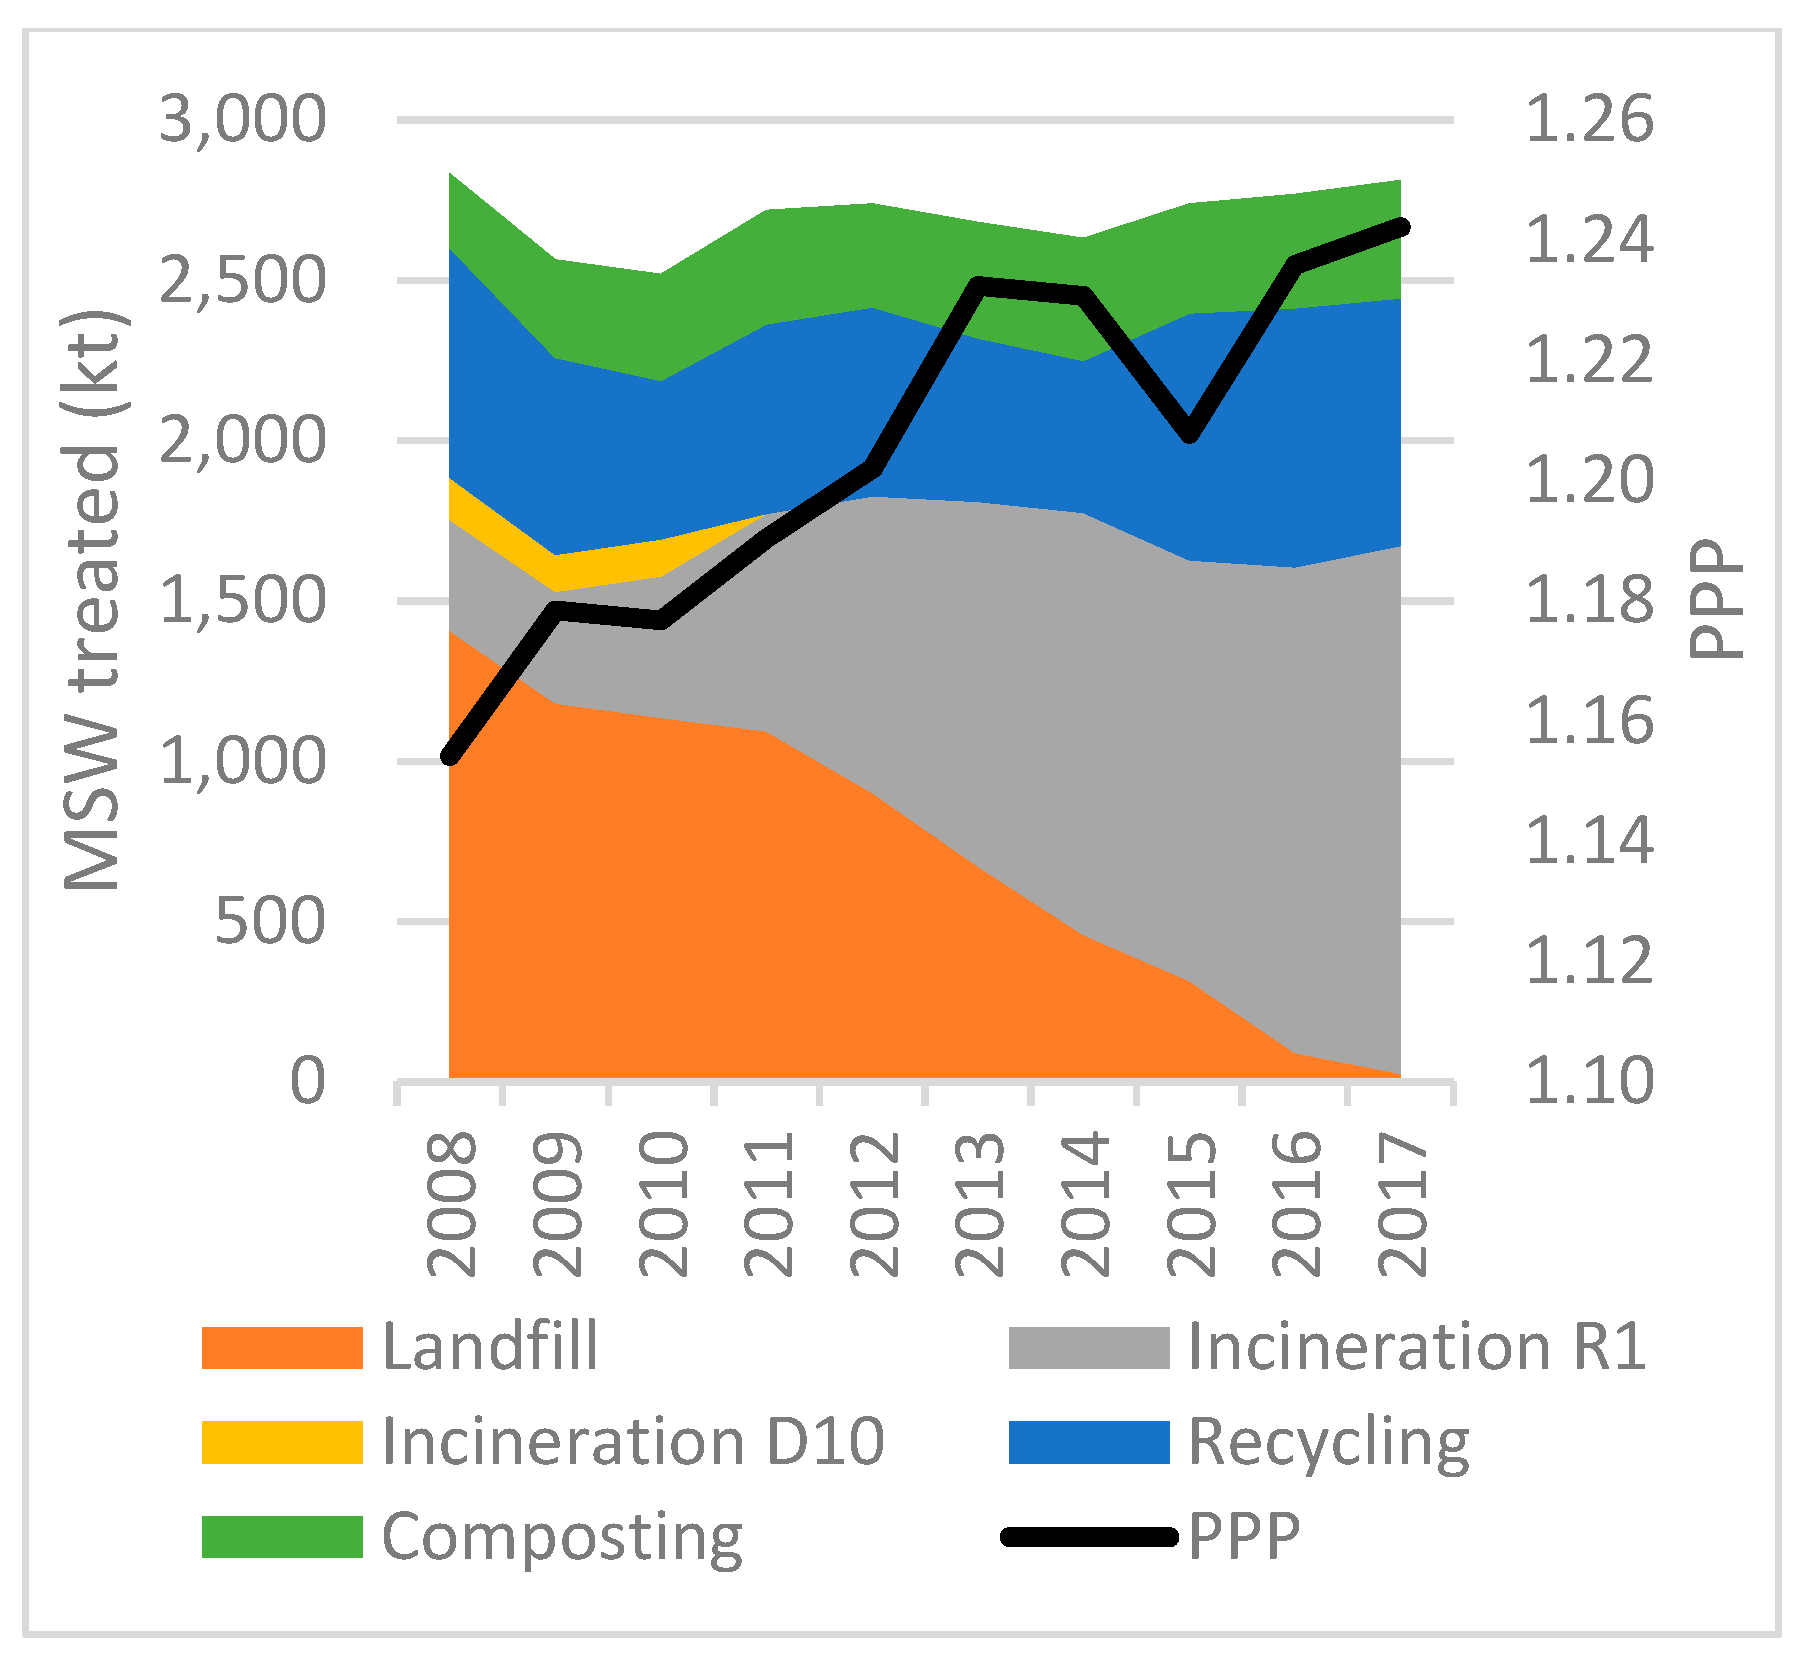
Figure 5). From 2009 to 2015 the PPP decreased. In this specific time period, MSW generation increased slightly. However, after 2015, both PPP and MSW have increased simultaneously. Thus, the rise of the PPP has resulted in larger amounts of MSW. The decrease of the PPP does not affect the country, as it has turned to more environmentally friendly waste treatment methods. The main waste treatment method is landfilling. In 2008, 2.121 kt was disposed of in landfills, while in 2017 MSW amount decreased to 1.765 kt, a reduction of about 17%. On the other hand, recycling rates have increased appreciably, accounting for over 25% of the amount produced. Composting has also increased as a waste treatment method, while incineration with energy recovery (R1) is used for treating wastes of over 17% of the available amount. Incineration (D10) is used for treating a small amount of waste equal to 3% (average) (
Figure 6).
• Denmark
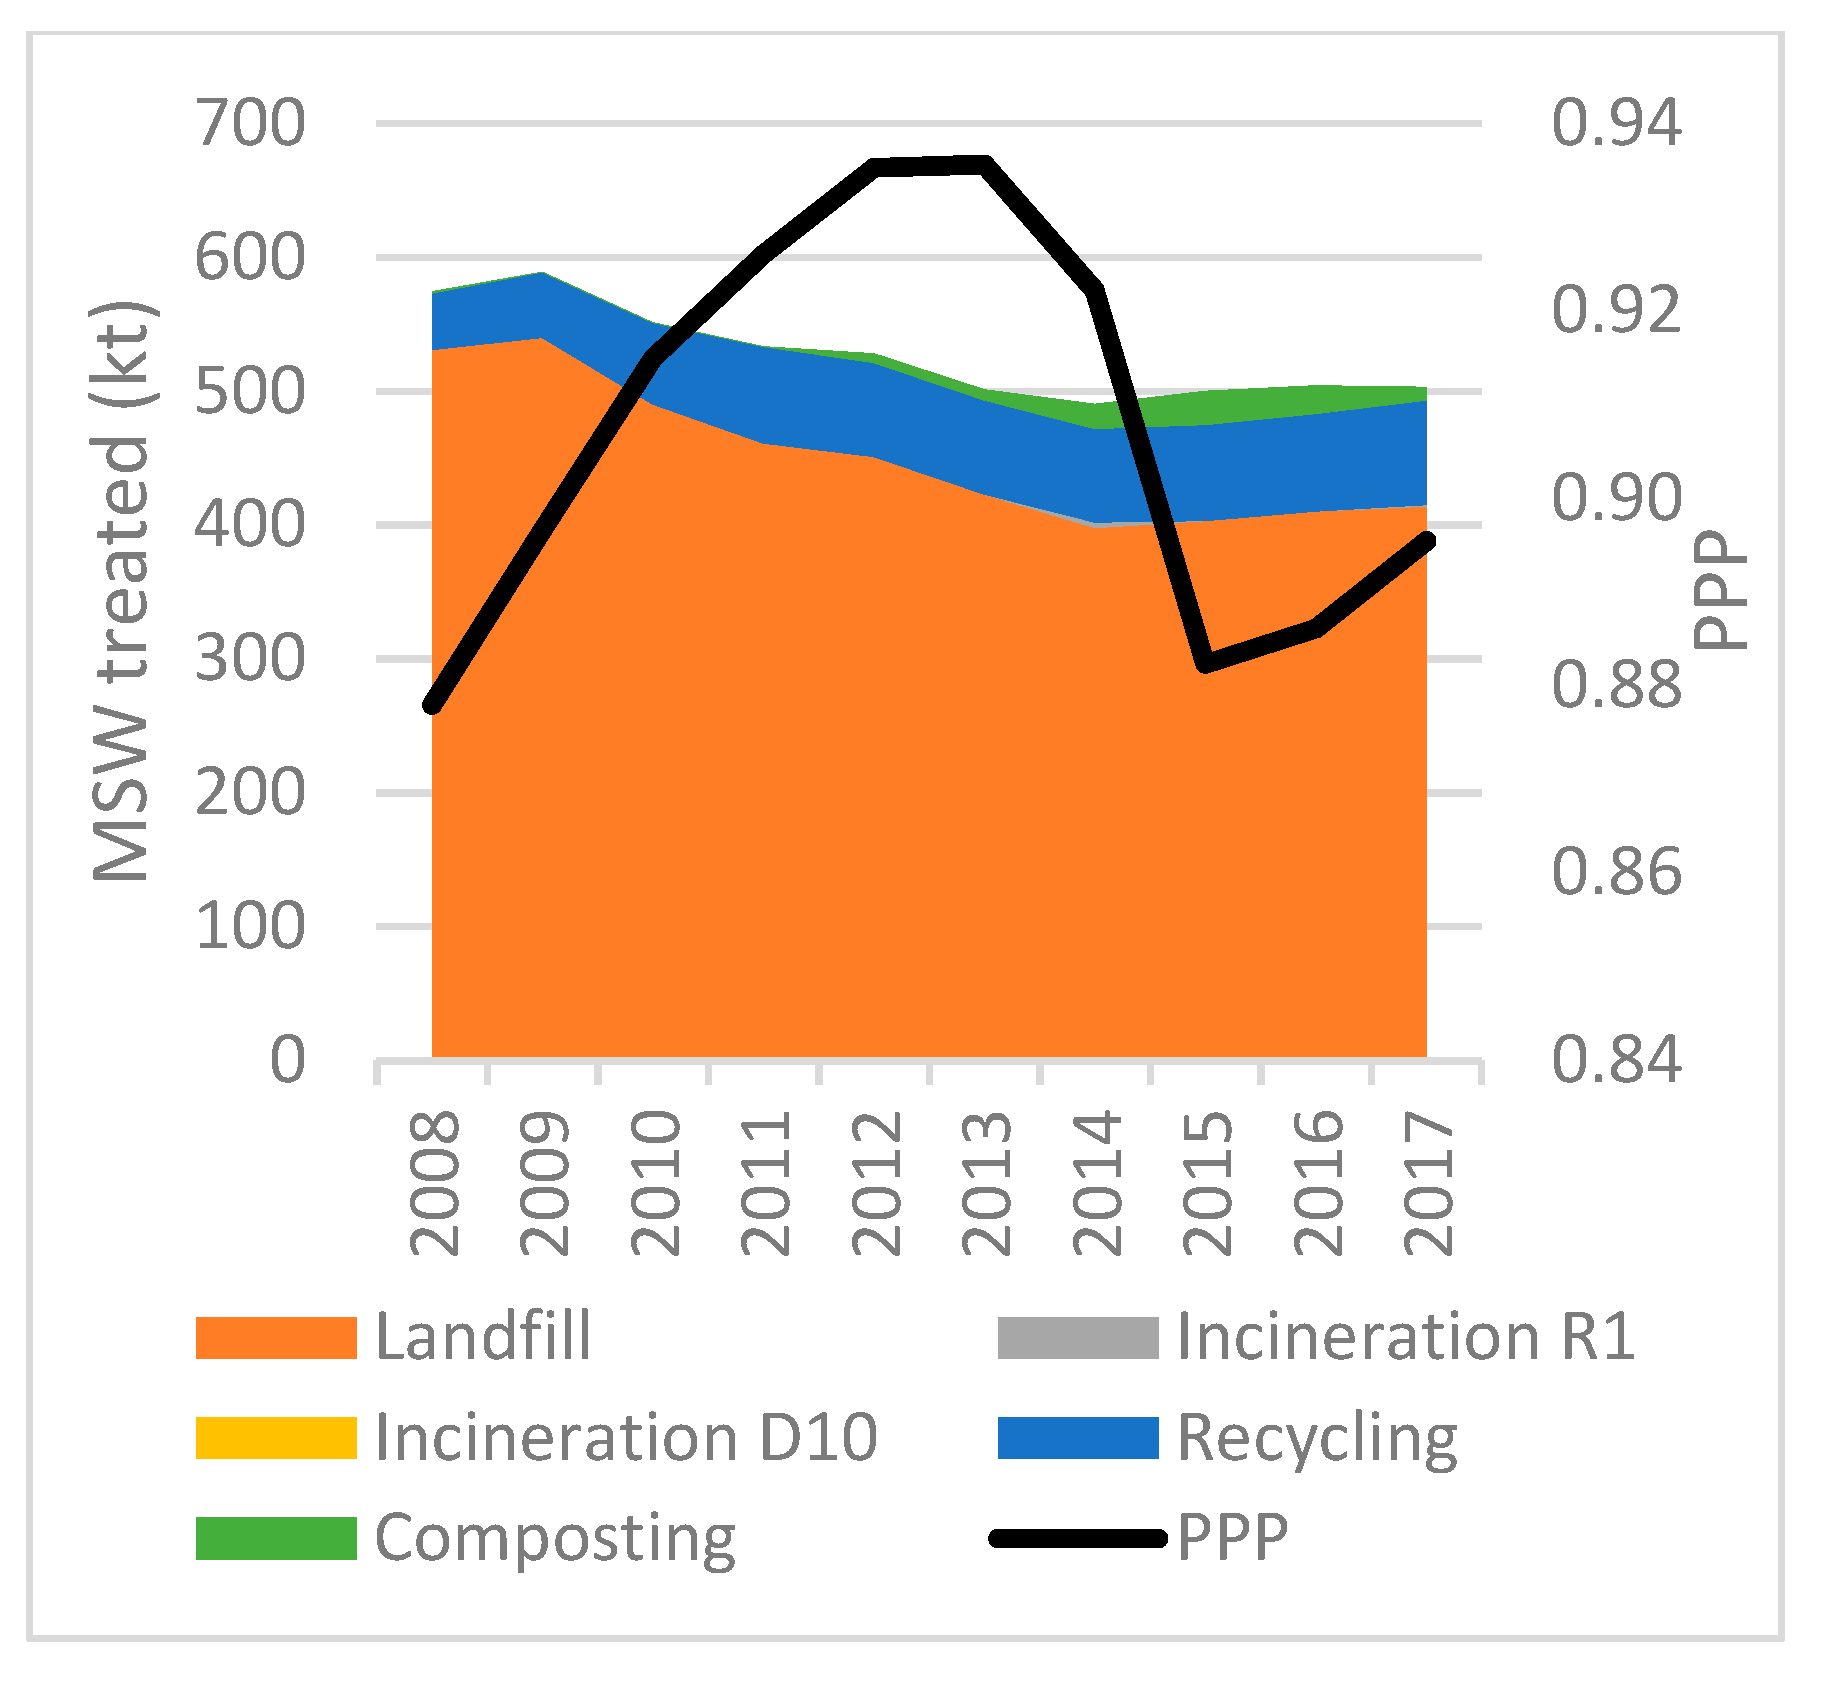
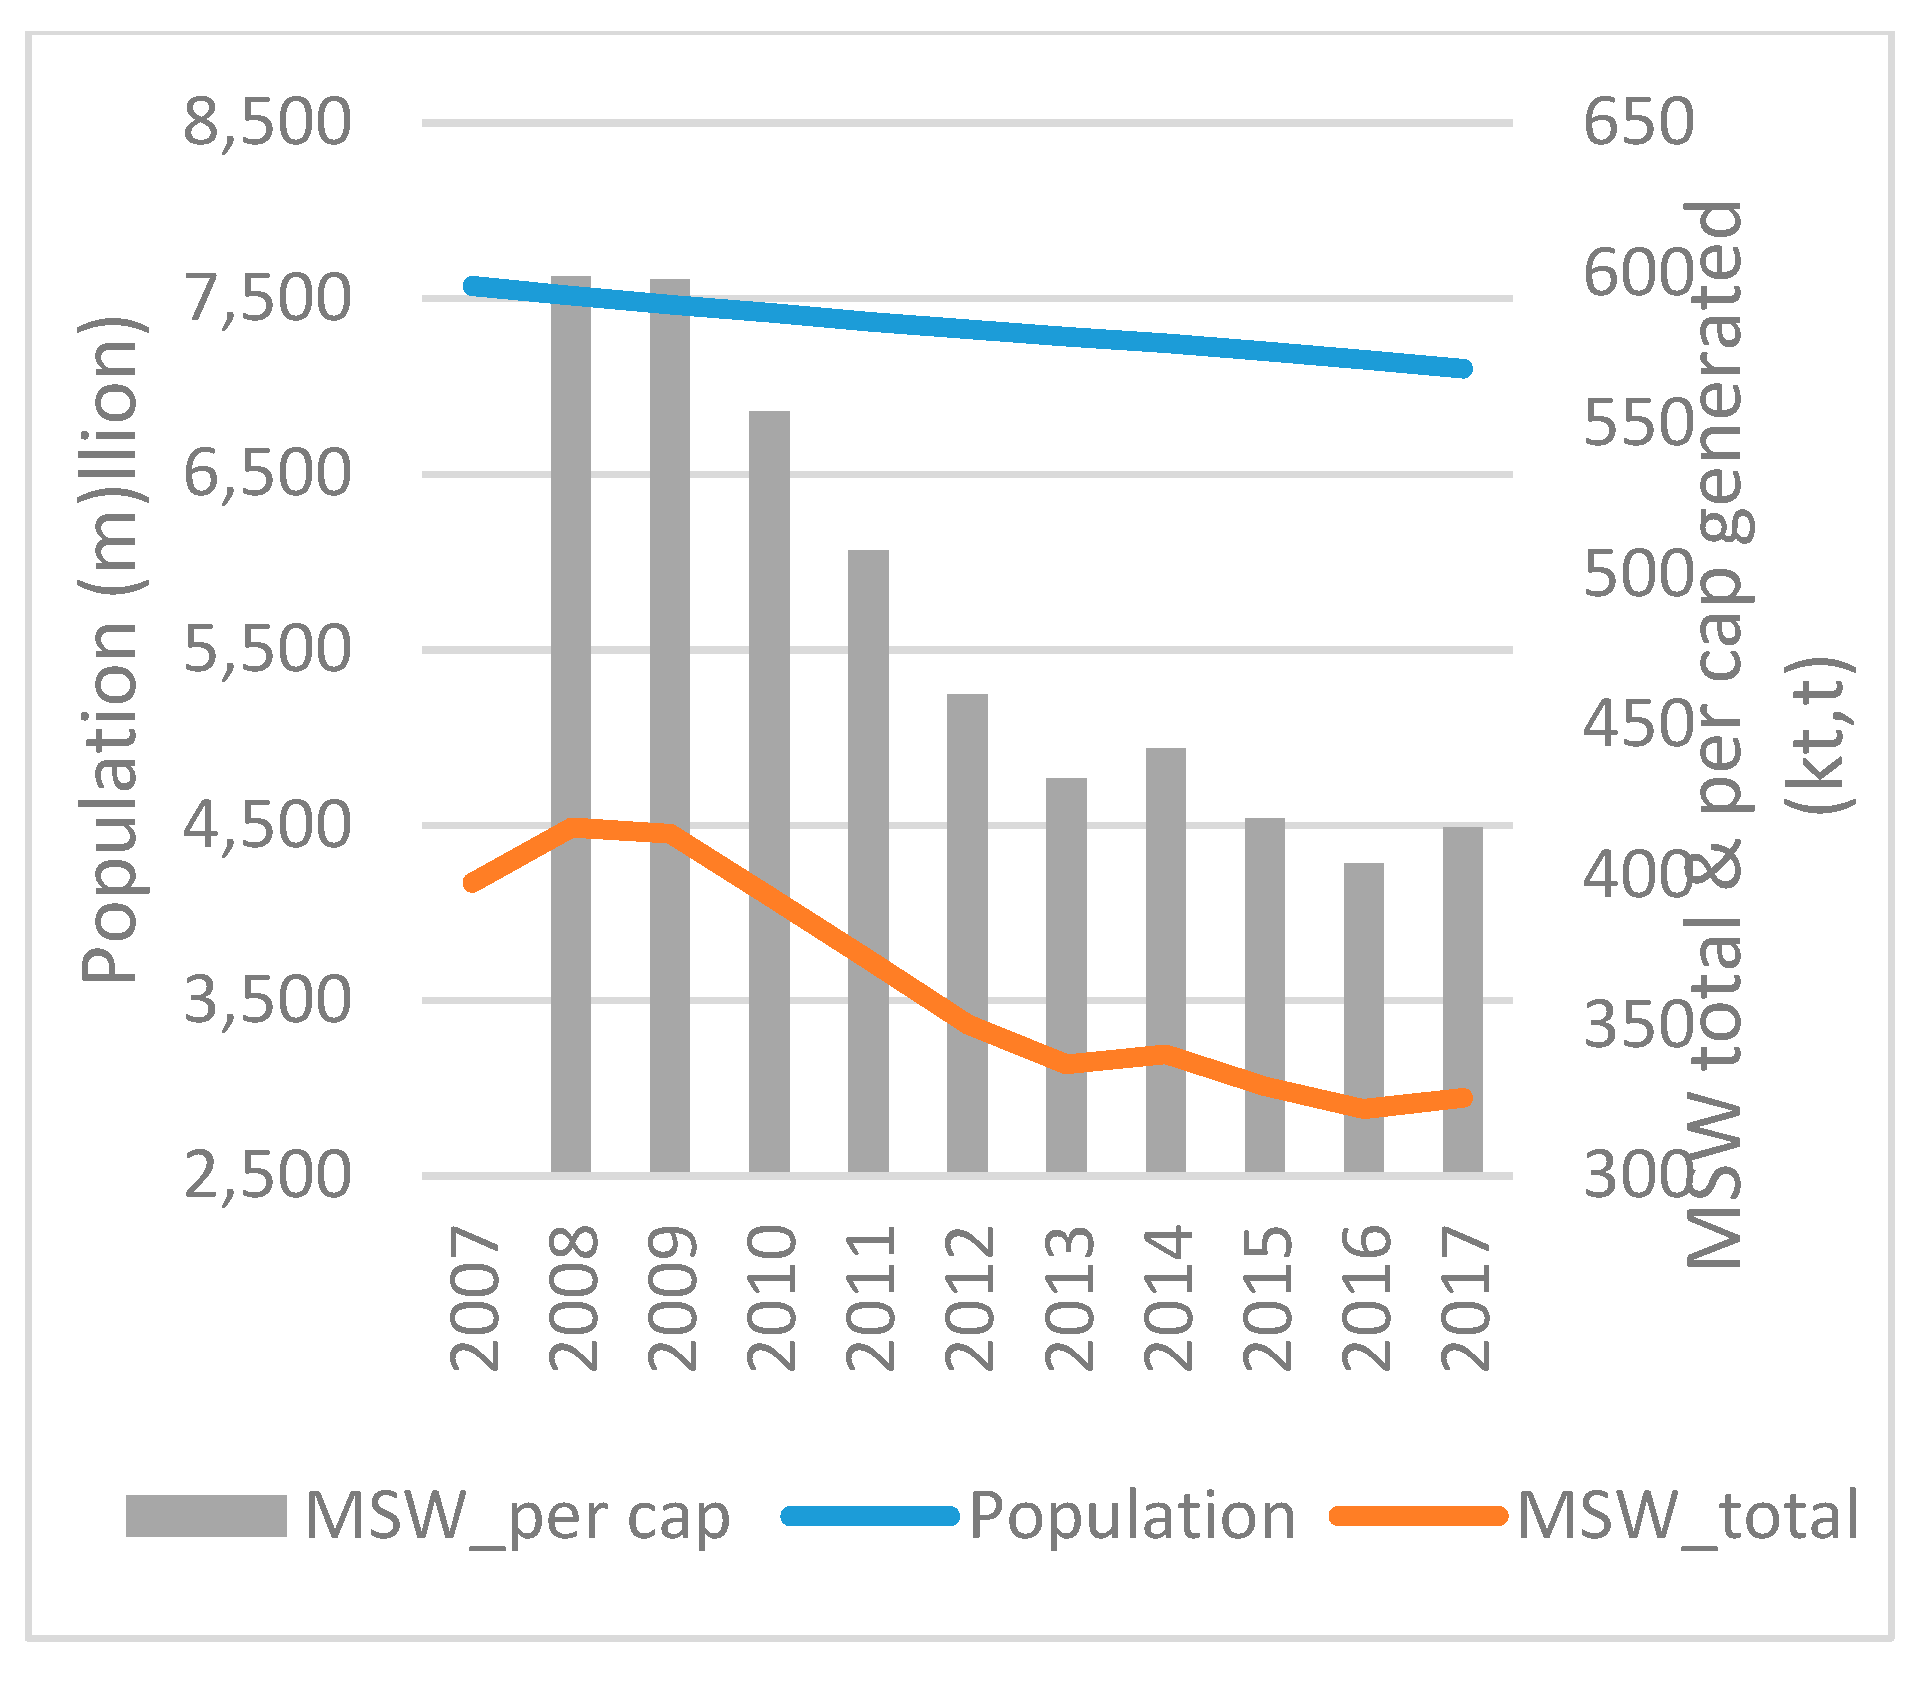
Denmark is among the countries that have adopted the most advanced ecofriendly methods for waste treatment. Landfilling represents only 4% of produced MSW, while incineration (R1) and recycling account for more than 50% and 25% respectively, followed by composting, where annually over 700 kt are treated by this method (
Figure 7). However, it would be interesting to note that both total and per capita MSW have decreased in the time period investigated. However the decrease of per capita MSW is higher than the amount of total MSW production, 6% and 1% respectively. The increase of population in this time period reached over 5%. Although there are some fluctuations in Denmark’s PPP, at the end of the time period, this finally reduced to less than 1% (
Figure 8).
• Germany
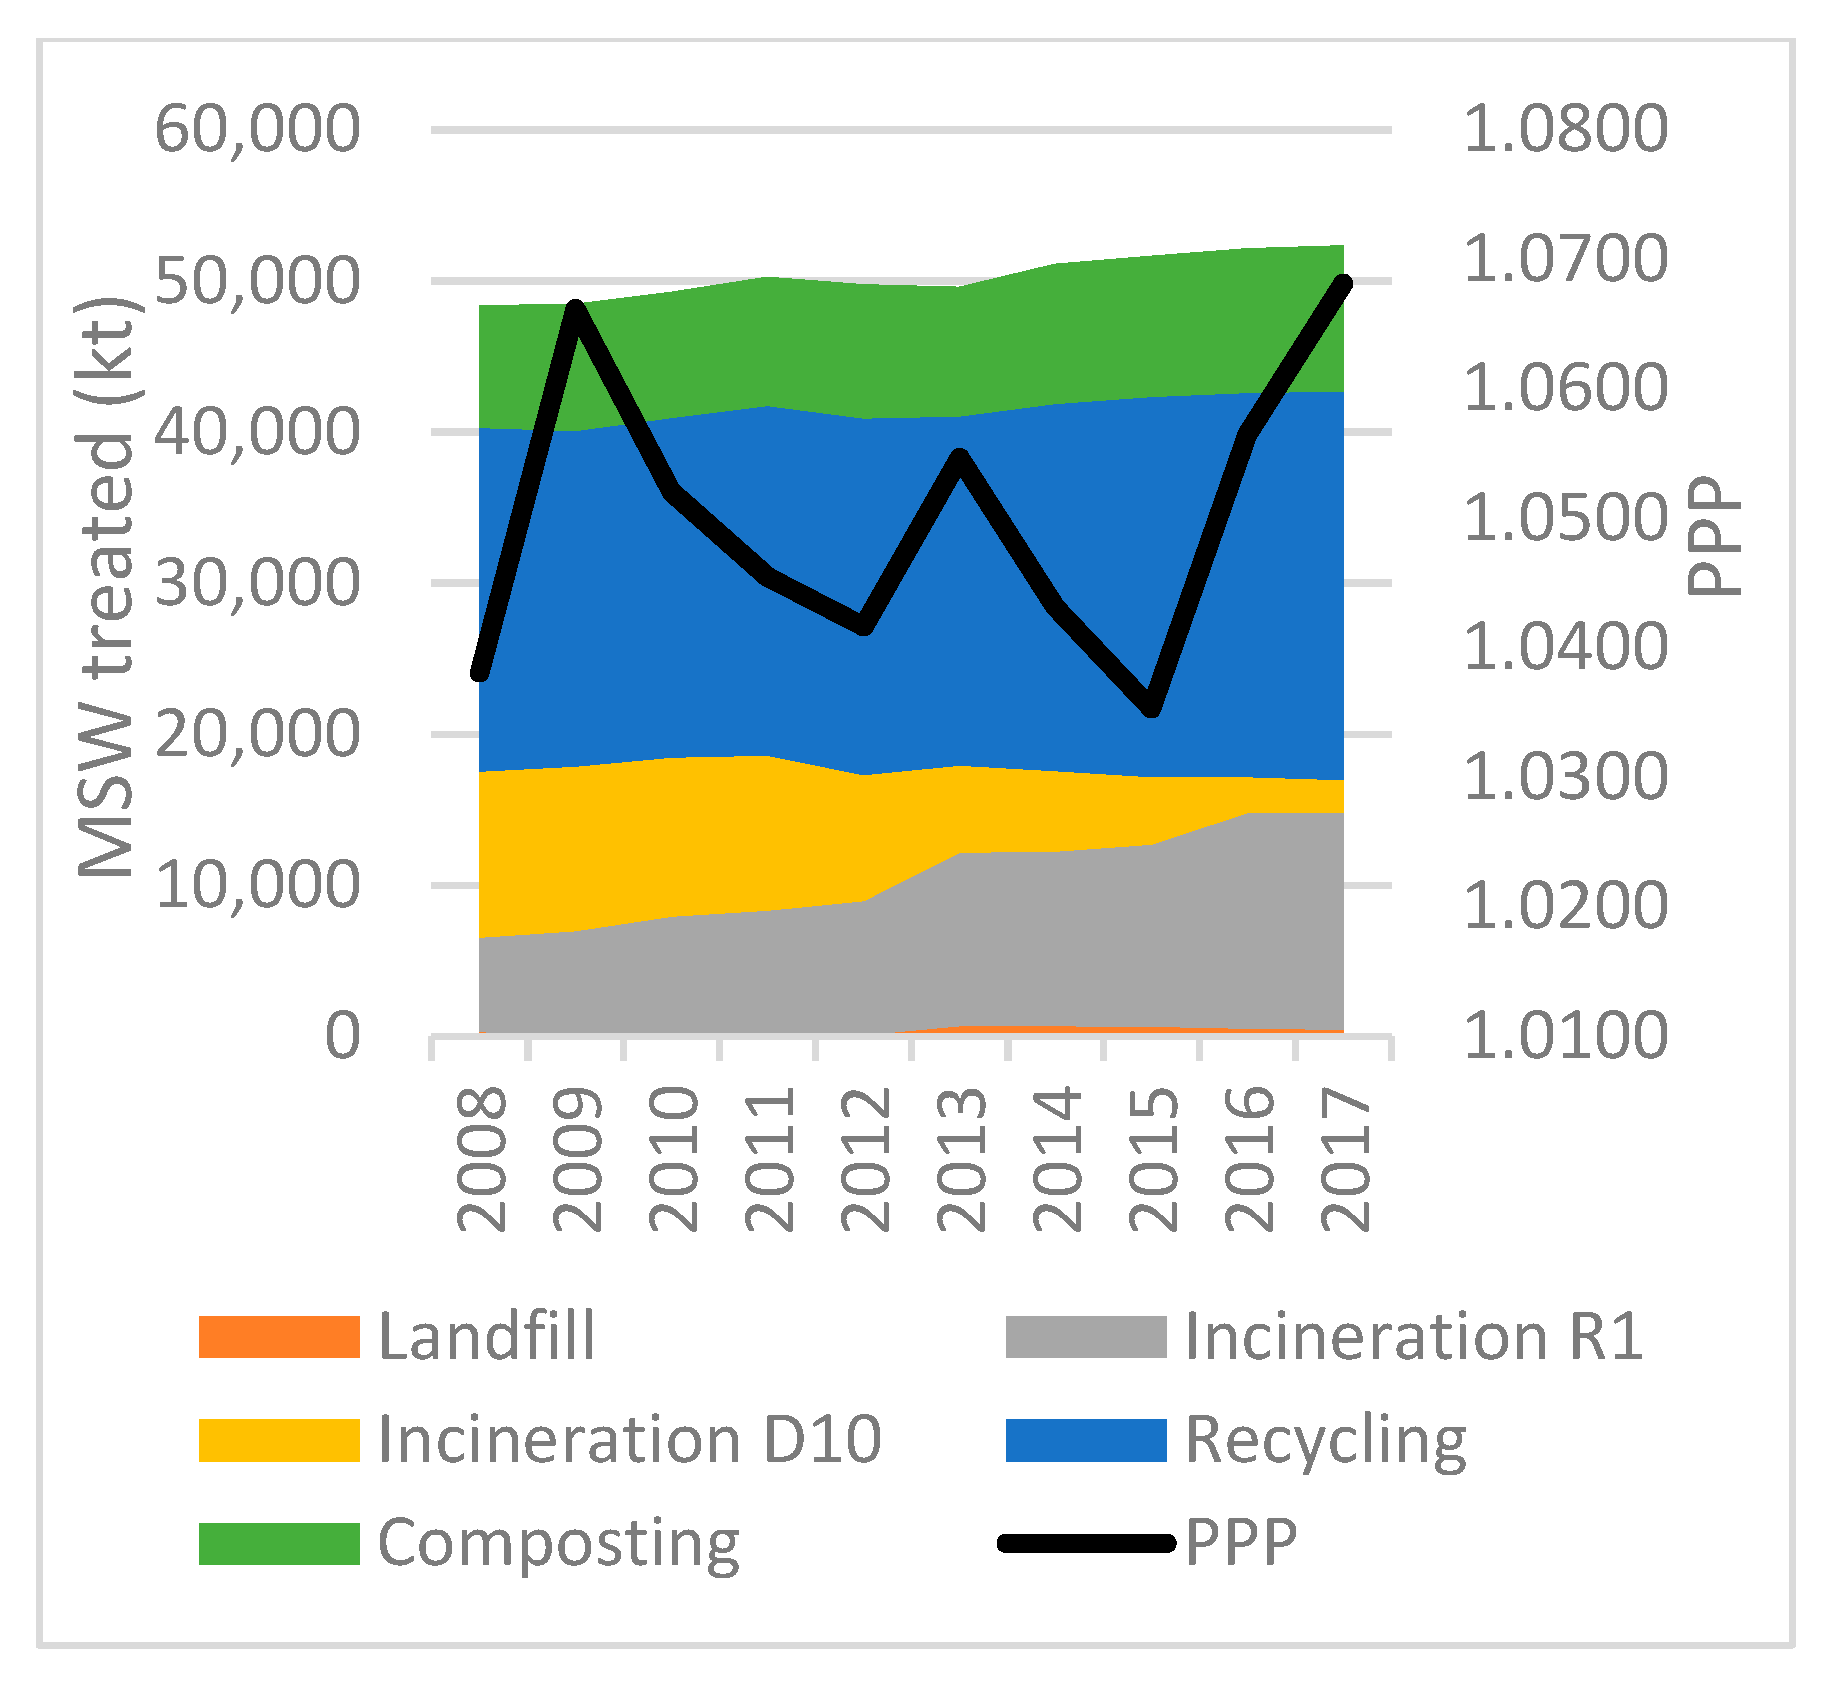
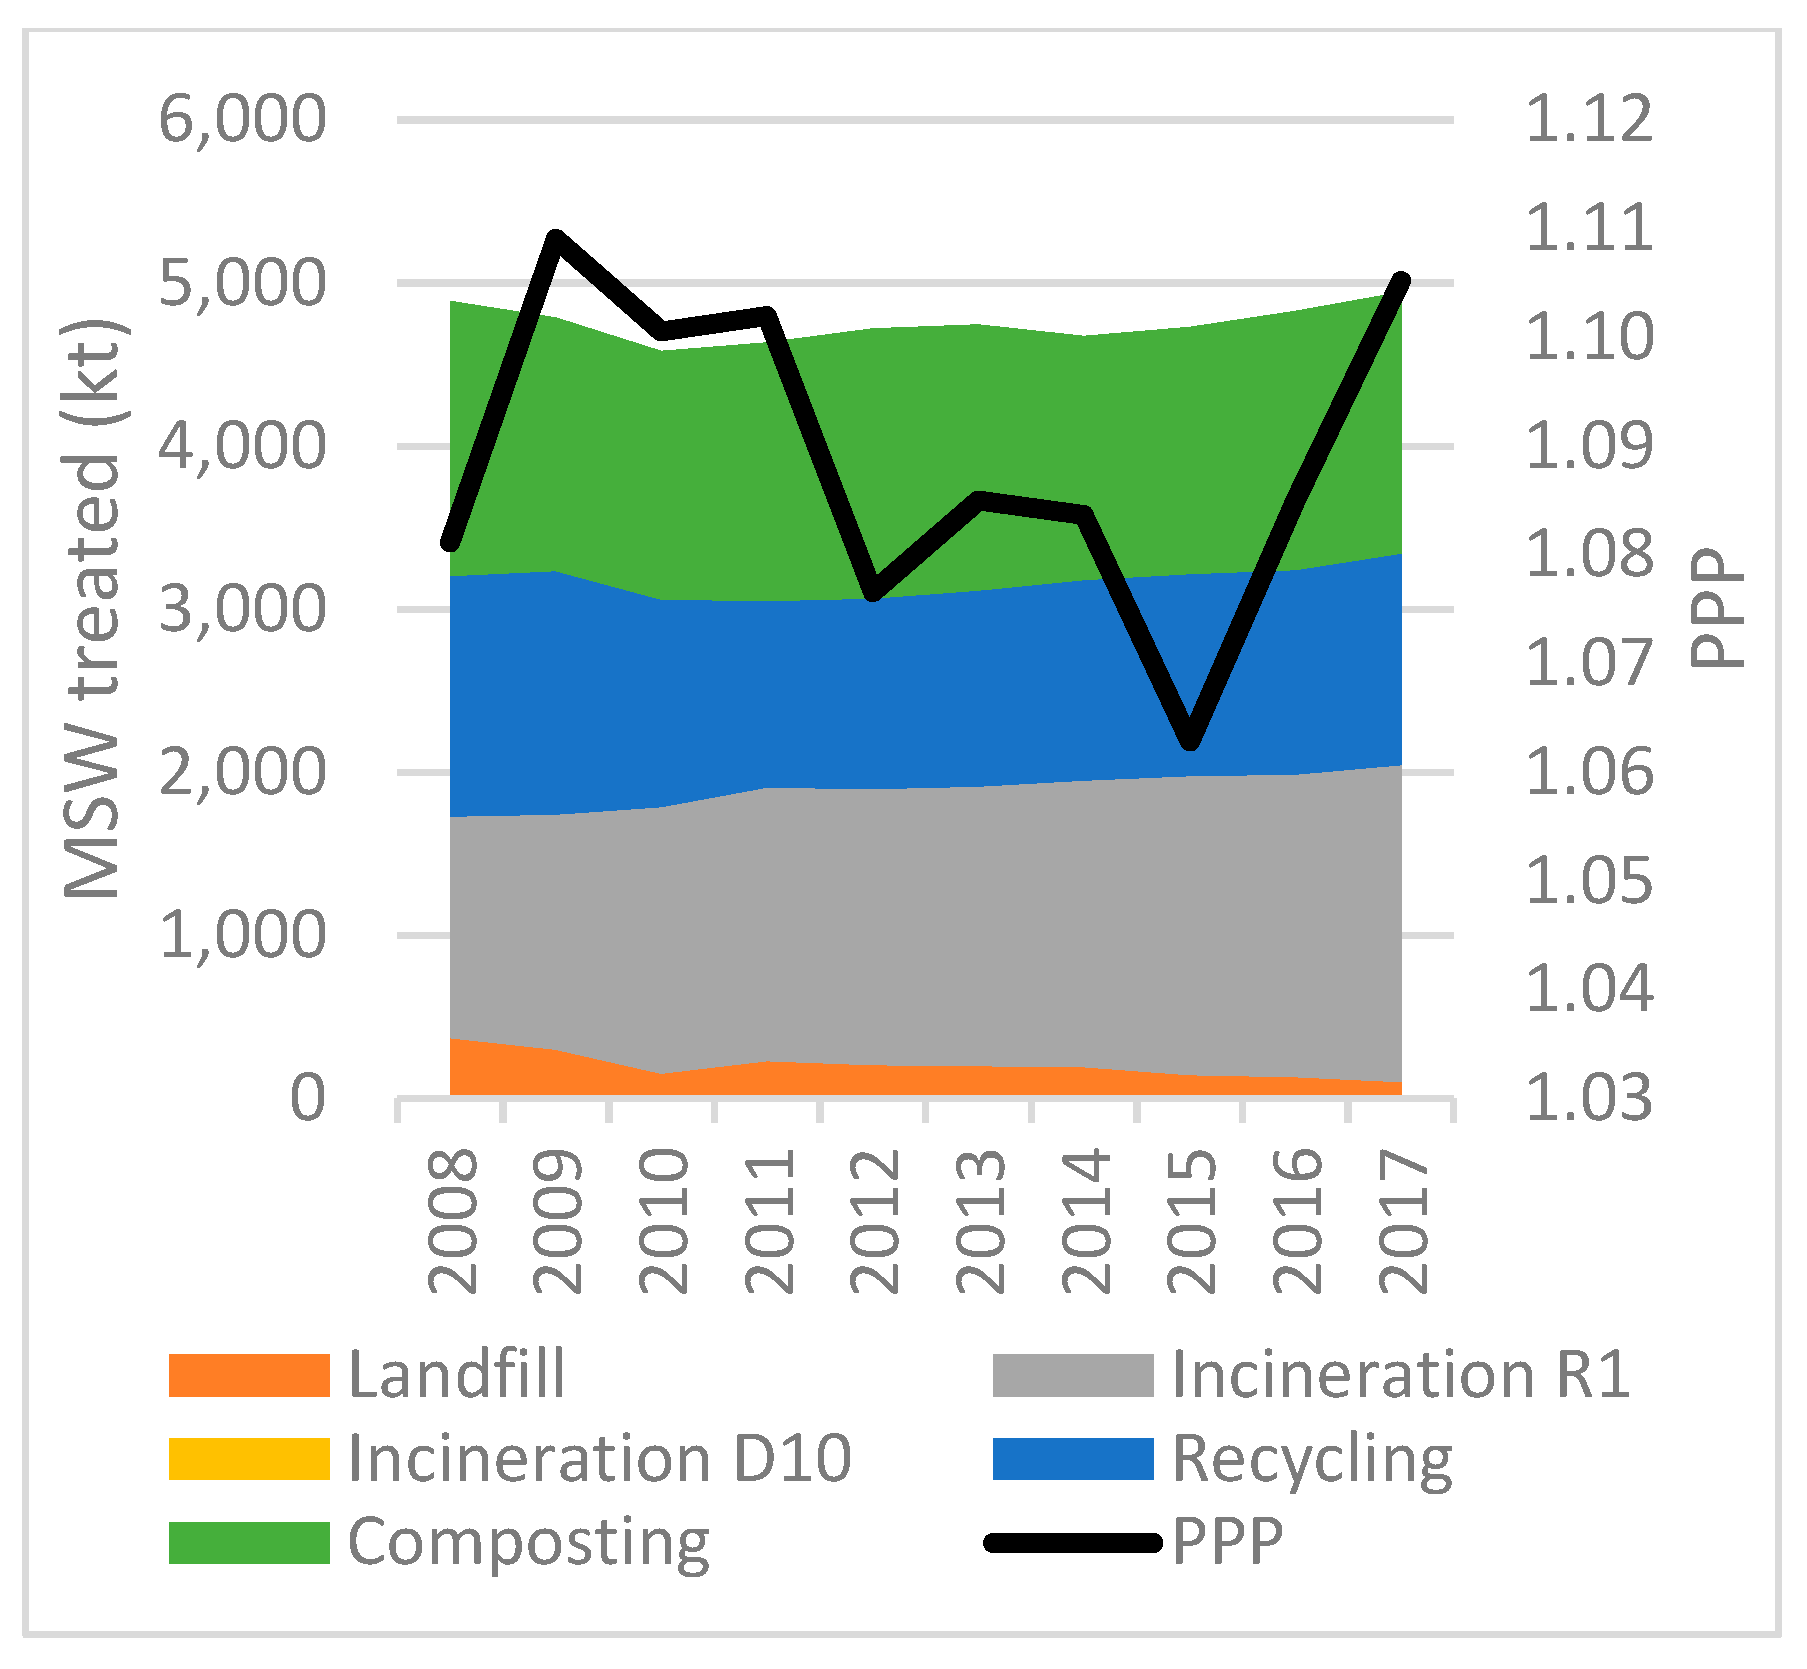
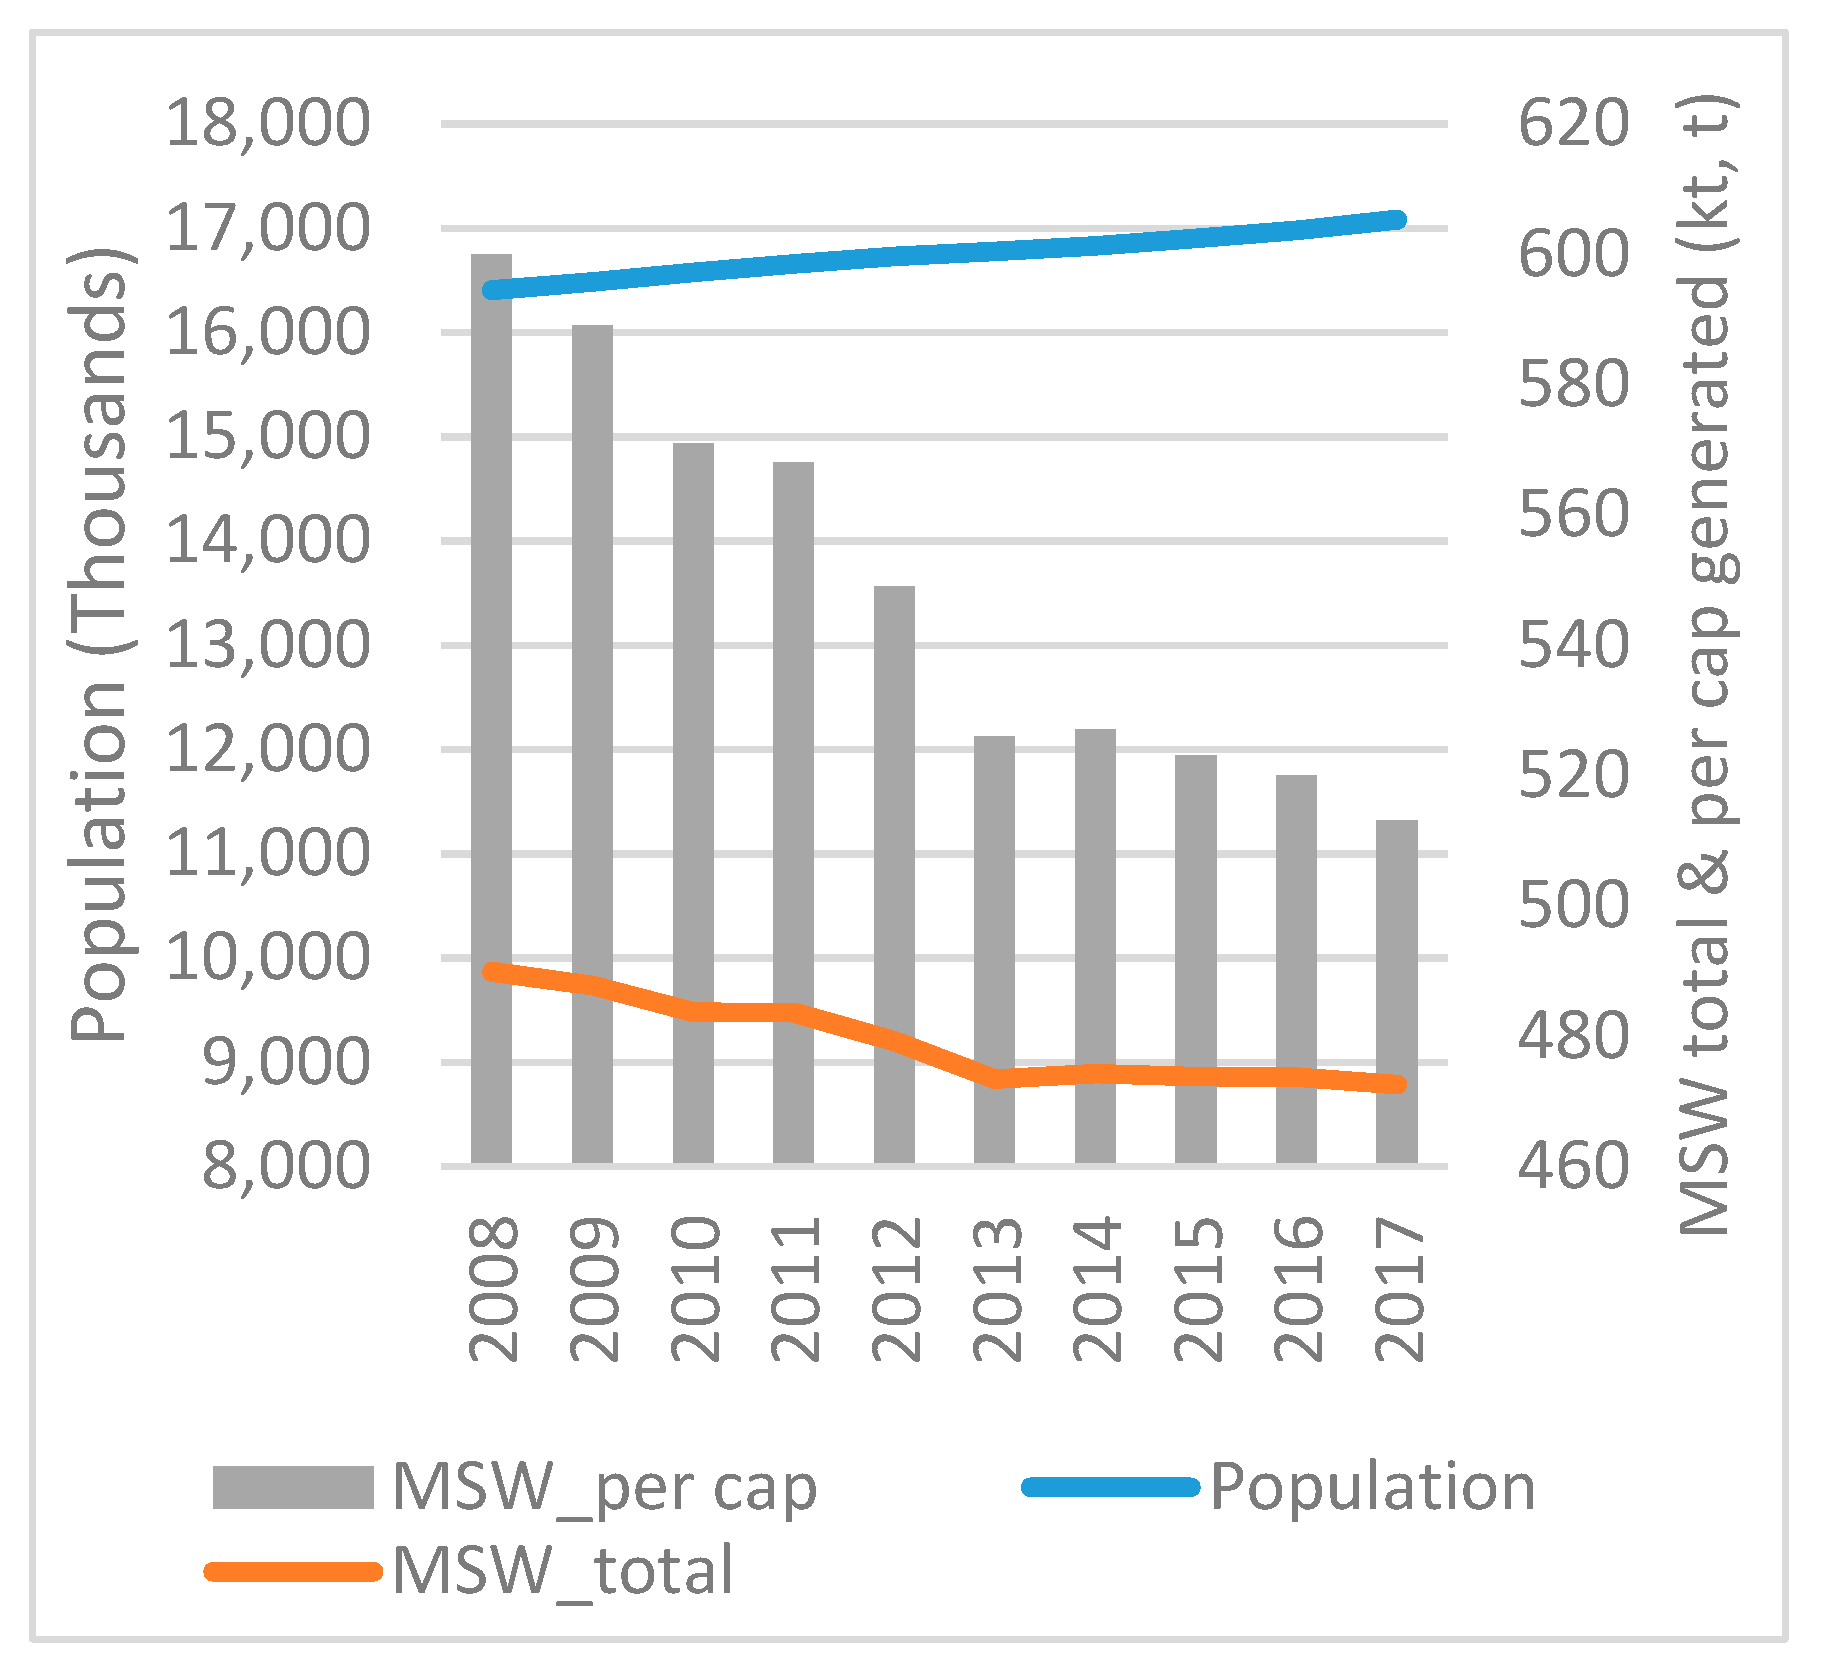
Germany is one of the most powerful countries of EU28. Although population in Germany remains stable, an increase of only 0.37% is observed, whilst production of MSW has increased by over 8% and per capita MSW has also increased by over 7% (
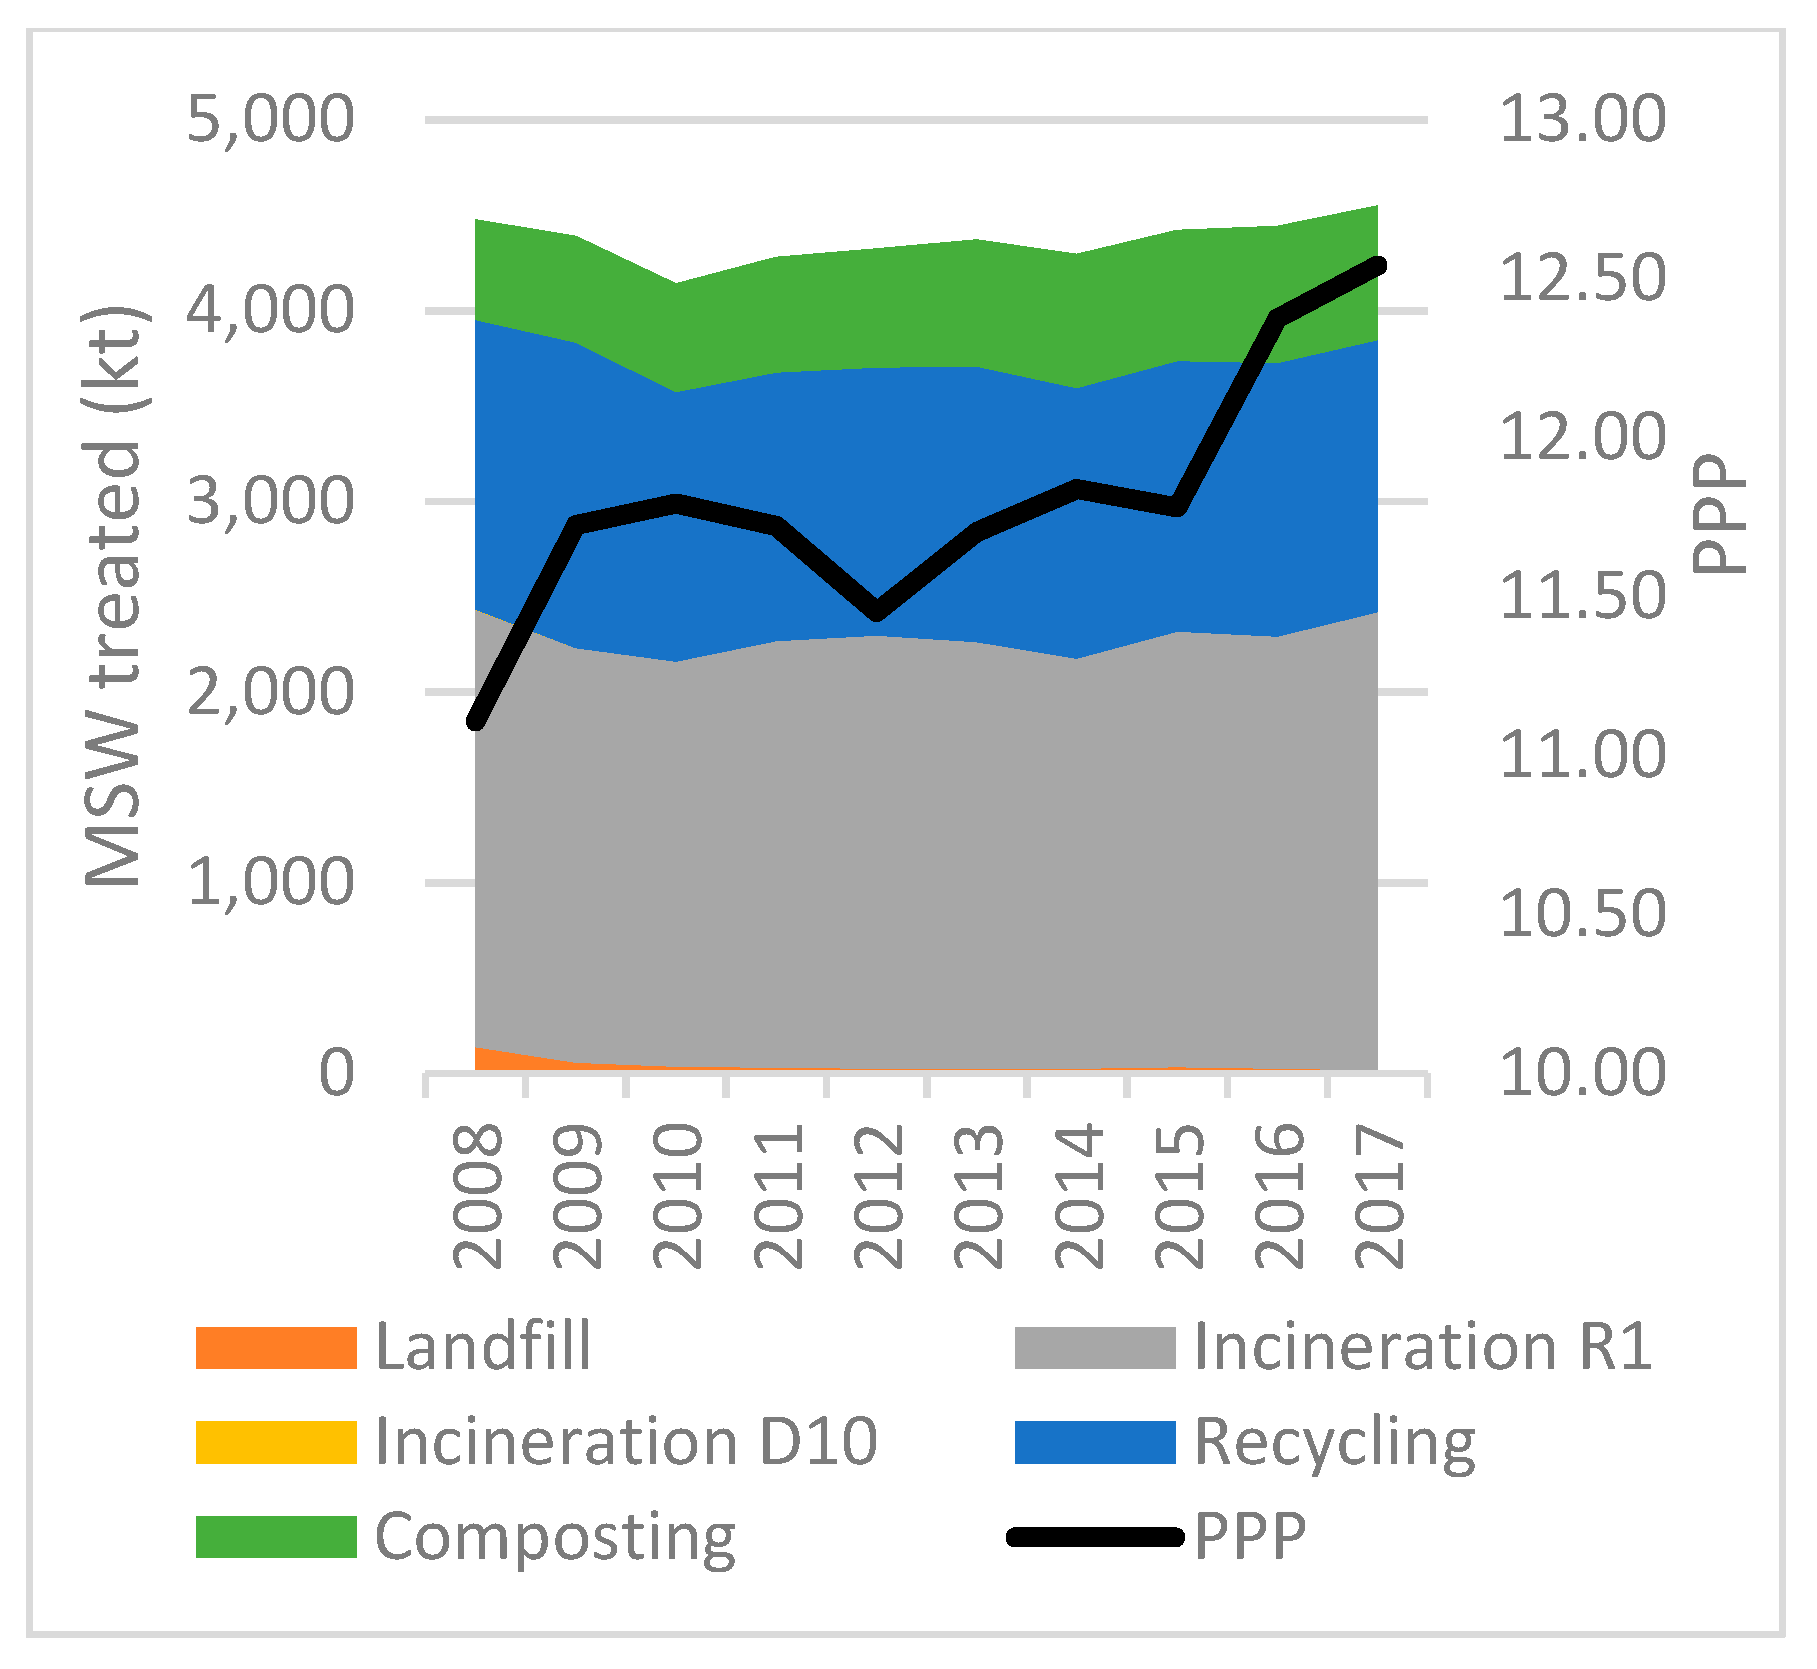
Figure 9). Purchase Power, in 2017, increased by over 5% since 2008. Thus, the increase of PPP by 1% has resulted in 2% MSW increase. Germany’s waste management system is based mainly on recycling. Since 2008, half of the MSW amount has been treated through recycling. Landfilling accounts for less than 1% of the total treated MSW. Composting has been used for treating almost 18% on average. The method used widely, after recycling, is incineration with energy recovery (R1) (
Figure 10).
According to the available data, in 2017, 14.137 kt was treated by this technique, compared to 2008 where 5.525 kt was also treated in incineration furnaces with energy recovery. This shows an increase of over 150% for the time period 2008–2017. On the other hand, incineration without energy recovery (D10) shows the largest decrease, of over 80%, and seems to present a further decrease over the years. Comparing PPP and waste management methods within the time period, what should be concluded is that an increase of PPP leads to a selection of a waste treatment method where not only waste treatment is achieved, but by-products (energy, metals) could also be achieved (
Figure 10).
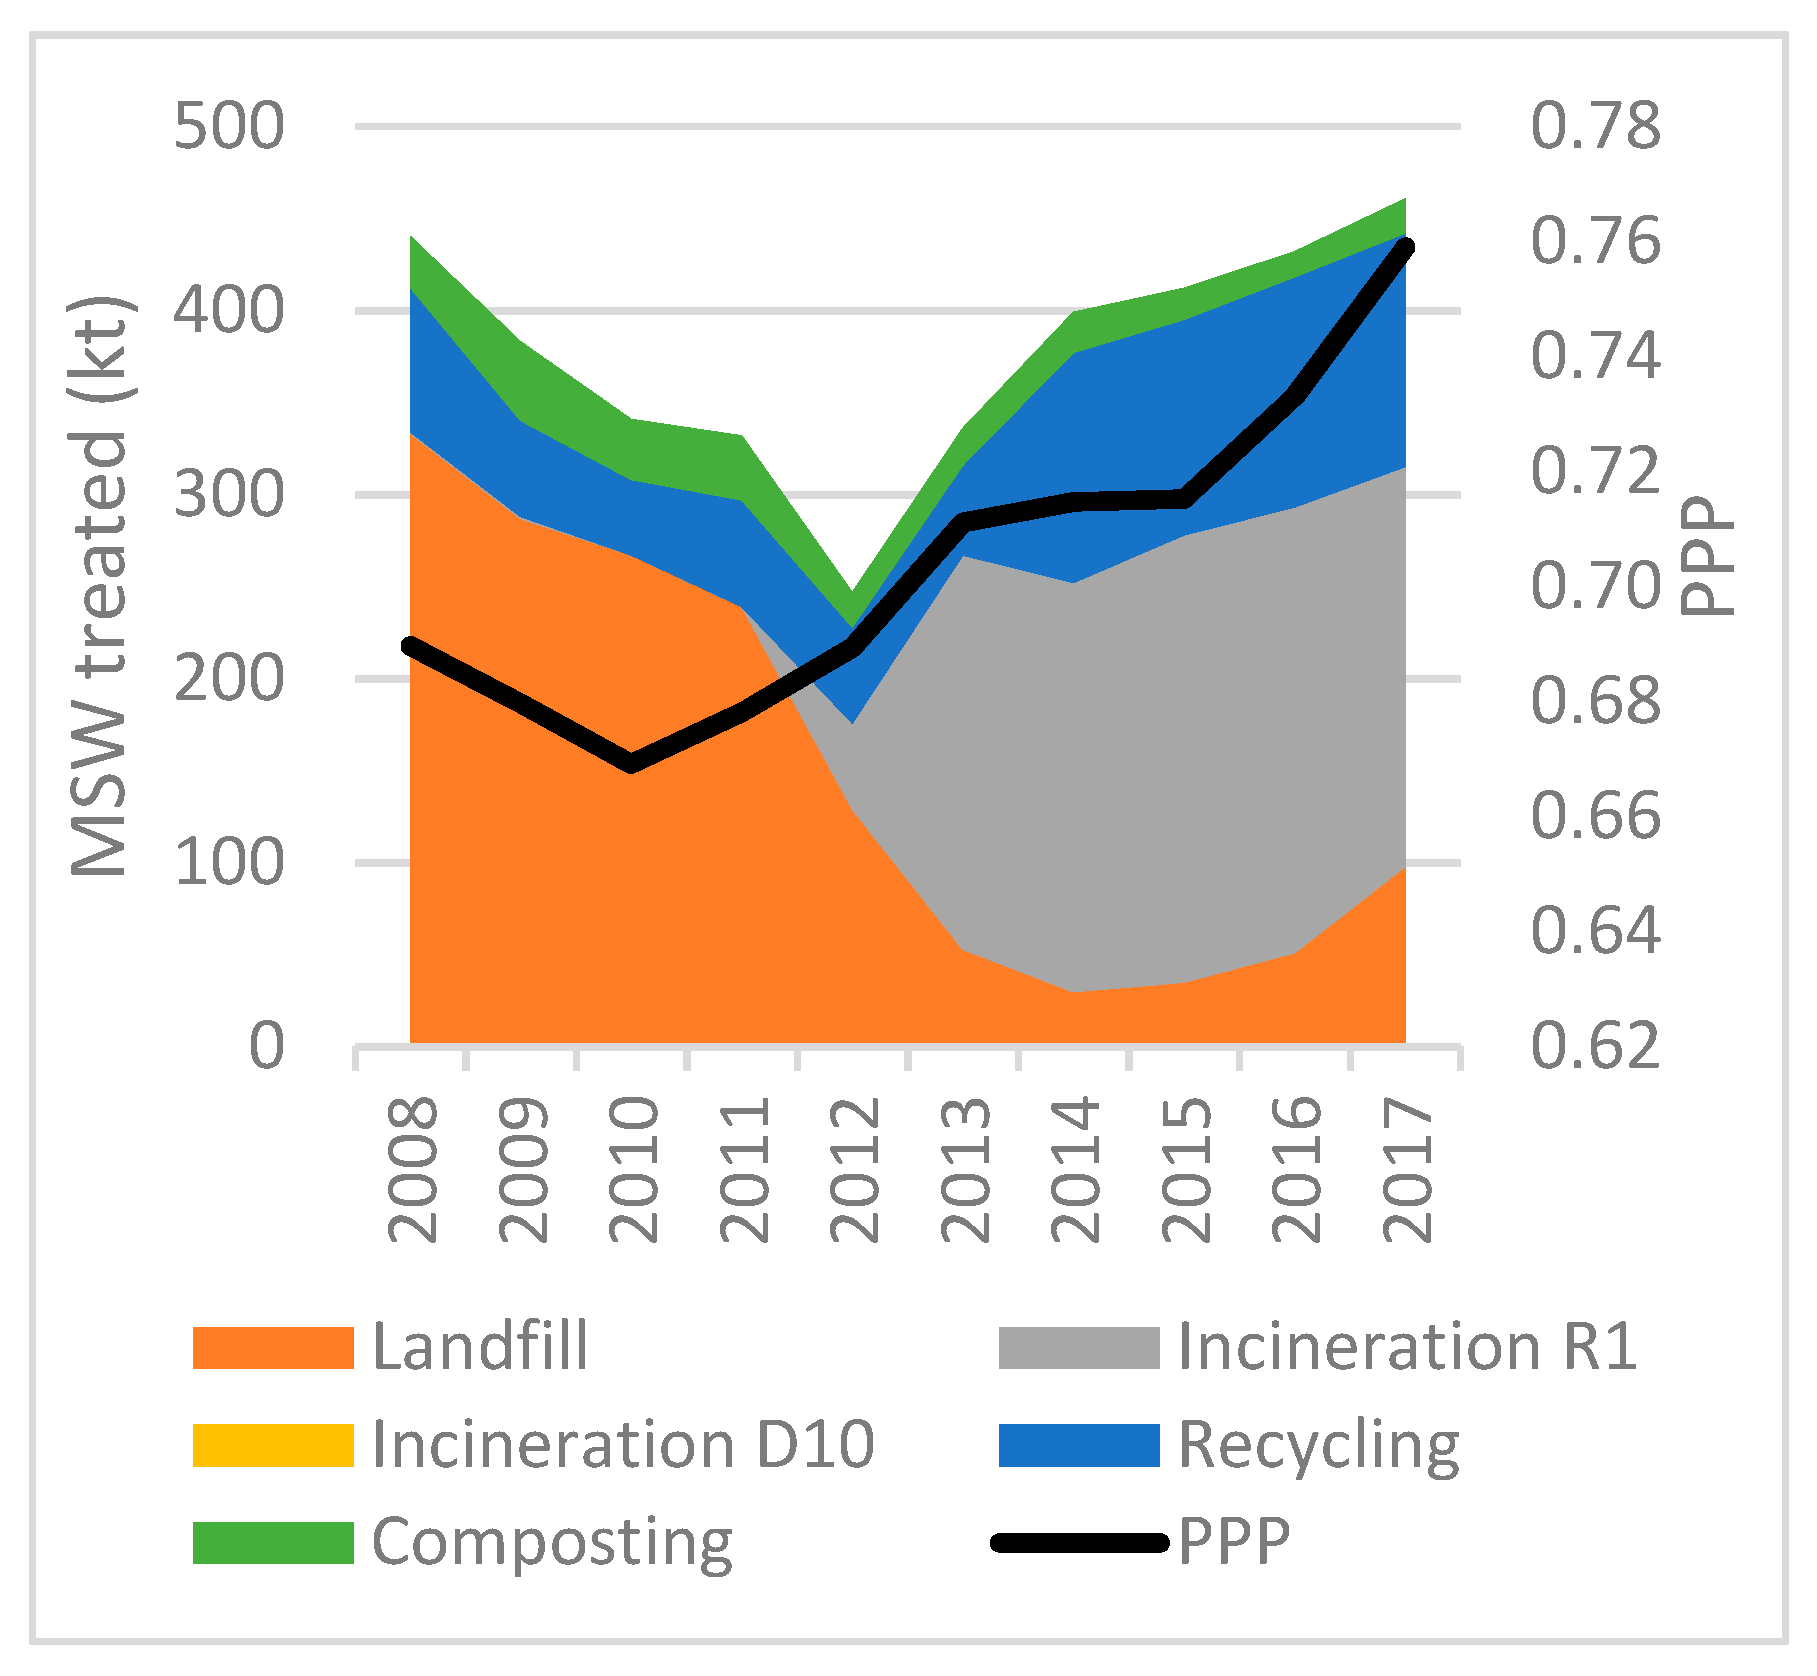
• Estonia
Estonia’s PPP is comparatively low. However, in the examined time period, PPP had increased generally to over 13% (Figure 12). On the other hand, production of MSW had decreased to almost 2%, while per capita production of MSW increased by only 0.5%. It is worth noting that MSW production decreased by about 30% from 2008 to 2012. After 2012, the increase of MSW production reached 38% (
Figure 11). In 2008, 75% of the waste produced was disposed of in landfills.
In the following decade, that percentage had fallen to less than 20%. However, there were years where landfill percentage fell to such as 7% in 2014, and 8% in 2015. A method used widely in recent years is incineration with energy recovery (R1). In 2008, 0.23% of the MSW produced was treated by this method. In 2017, 217 kt were treated by this method representing 44% of the total waste treated. Recycling and composting have also increase their share as a waste management method, reaching 26% and 4% respectively in 2017. What should also be highlighted is that until 2012 both of the previous methods had decreased rates. As mentioned above, PPP in Estonia has increased thus concluding that the main waste treatment methods selected are incineration (R1) and recycling (
Figure 12).
• Ireland
The population in Ireland has increased by over 6%, while reduction of MSW production appears for the same time period (
Figure 13). Although there are some fluctuations on PPP through the investigated years, in 2017 this decreased to 3%.
In 2008, 2.015 kt of waste was disposed in landfills. In 2016, the amount of produced MSW that was disposed was 711 kt, a reduction equal to 63%. Per capita MSW production decreased and was equal to almost 20%. The second method in the country is recycling where, on average, 35% of wastes is treated this way. Although composting is relatively low, it also increased its share within the research time by more than 70%. On the other hand, incineration (R1) has appreciably increased reaching an increase of over 800%, and being the method that 30% of the MSW production was treated with in 2016. Taking into consideration how the PPP is formulated, it is revealed that its increase positively affects composting and incineration with energy recovery (
Figure 14).
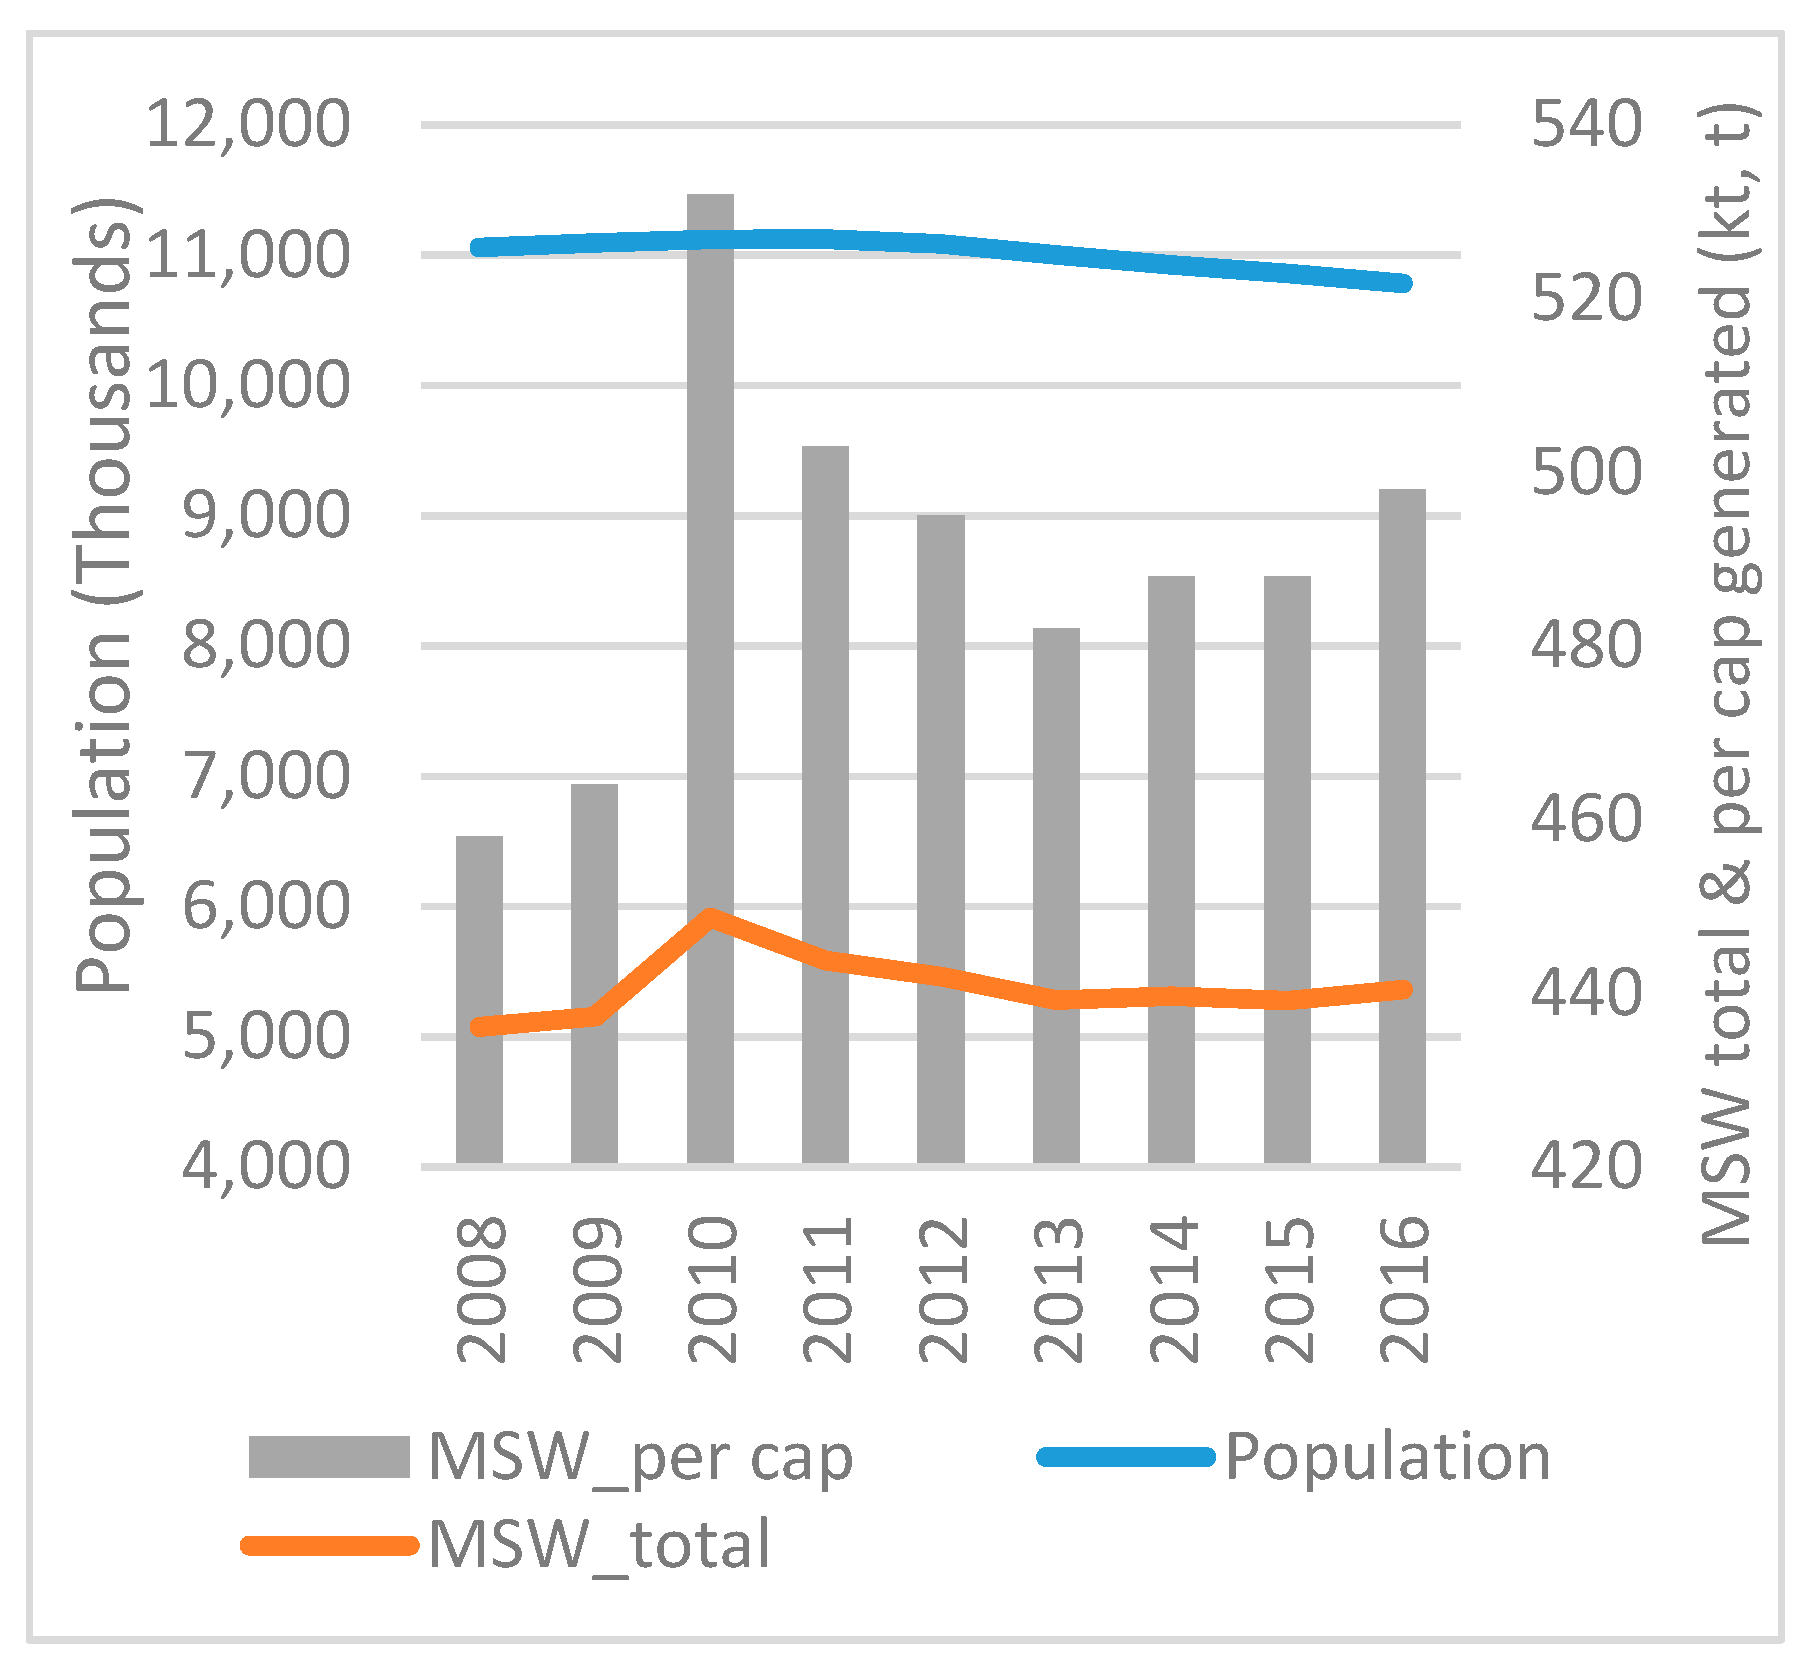
• Greece
Population and MSW production in Greece, in the first three years of the research time period (2008–2010), increased by over 0.50% and 10% respectively. From 2010–2013, both production of MSW and population decreased. However, it is worth noting that after 2013, although reduction of population persisted, MSW produced started to increase. The same trend was also followed in the case of MSW per capita (
Figure 15). PPP in Greece presents some fluctuations through the investigated years, but a strong correlation with MSW production is clear. Waste treatment in Greece is based mainly on landfills. In 2008, the percentage of MSW disposed in landfills was over 80%, one of the highest in EU28. In 2016, the percentage was, unfortunately, unaltered. Other methods used for waste treatment are recycling and composting. Contribution of both methods is relatively low. Recycling has been used for treating less than 18% of the produced MSW, while the contribution of composting in waste treatment is less than 3%. From the results obtained, any fluctuation of PPP in Greece has no effect on the adopted waste management system (
Figure 16).
• Spain
Spain is also one of the strongest countries in EU28, representing the fifth economy in EU28, based on GDP. An increase of population accounted for 1.9% while the reduction of MSW reached, in 2017, 15%. MSW per capita, produced in the same period, decreased by almost 16% (
Figure 17). Small fluctuations appear with regard to PPP in Spain. The total reduction of PPP is about 4%. Thus, any reduction in MSW amount has no correlation to PPP. Based on 2008 data, landfilling is the most used method for waste treatment accounting for 60%. All the others method are also used but their contribution is relatively low. At the end of the research time period, landfilling and composting have decreased their share compared to incineration and recycling, which both have increased their contribution. Reduction of PPP has a positive effect on turning the waste management system to a more environmentally friendly method (
Figure 18).
• France
Population in France, being the third largest economy in EU, has increased by over 4%, while reduction of MSW produced is less than 1% (
Figure 19). On the other hand, MSW per capita has decreased by over 5%. The waste management system includes all available methods. In 2008, landfill was used for treating 35% of the produced MSW, incineration (R1) furnaces accounted for 30%, while trough recycling and composting treated 17% and 14% respectively of the produced MSW.
Furthermore, incineration without energy recovery (D10) used for treating waste was under 2%. According to the available data, in 2017, landfill has decreased its share compared to all the other methods, while their contribution has increased. A small reduction of PPP is acting positively by reducing methods such as landfilling and incineration (D10), increasing, however, recycling, composting and incineration (R1) (
Figure 20).
• Croatia
Croatia is the most recent member in EU28. The population of Croatians has declined in the years investigated, and, while MSW production presents fluctuations, it finally reduced by 4% in 2017 (
Figure 21). However, production of MSW per capita marginally increased (0.24%). On the other hand, small fluctuations appear with regards to PPP throughout the years, but generally a decrease is observed of less than 3%. The waste management system in Croatia is based on landfilling, representing more than 95%. Recycling and composting are two other methods that are used but with a rather low contribution. In 2017, the disposal of waste in landfills decreased to 75%, while recycling and composting increased their share to 22% and 2% respectively (
Figure 22).
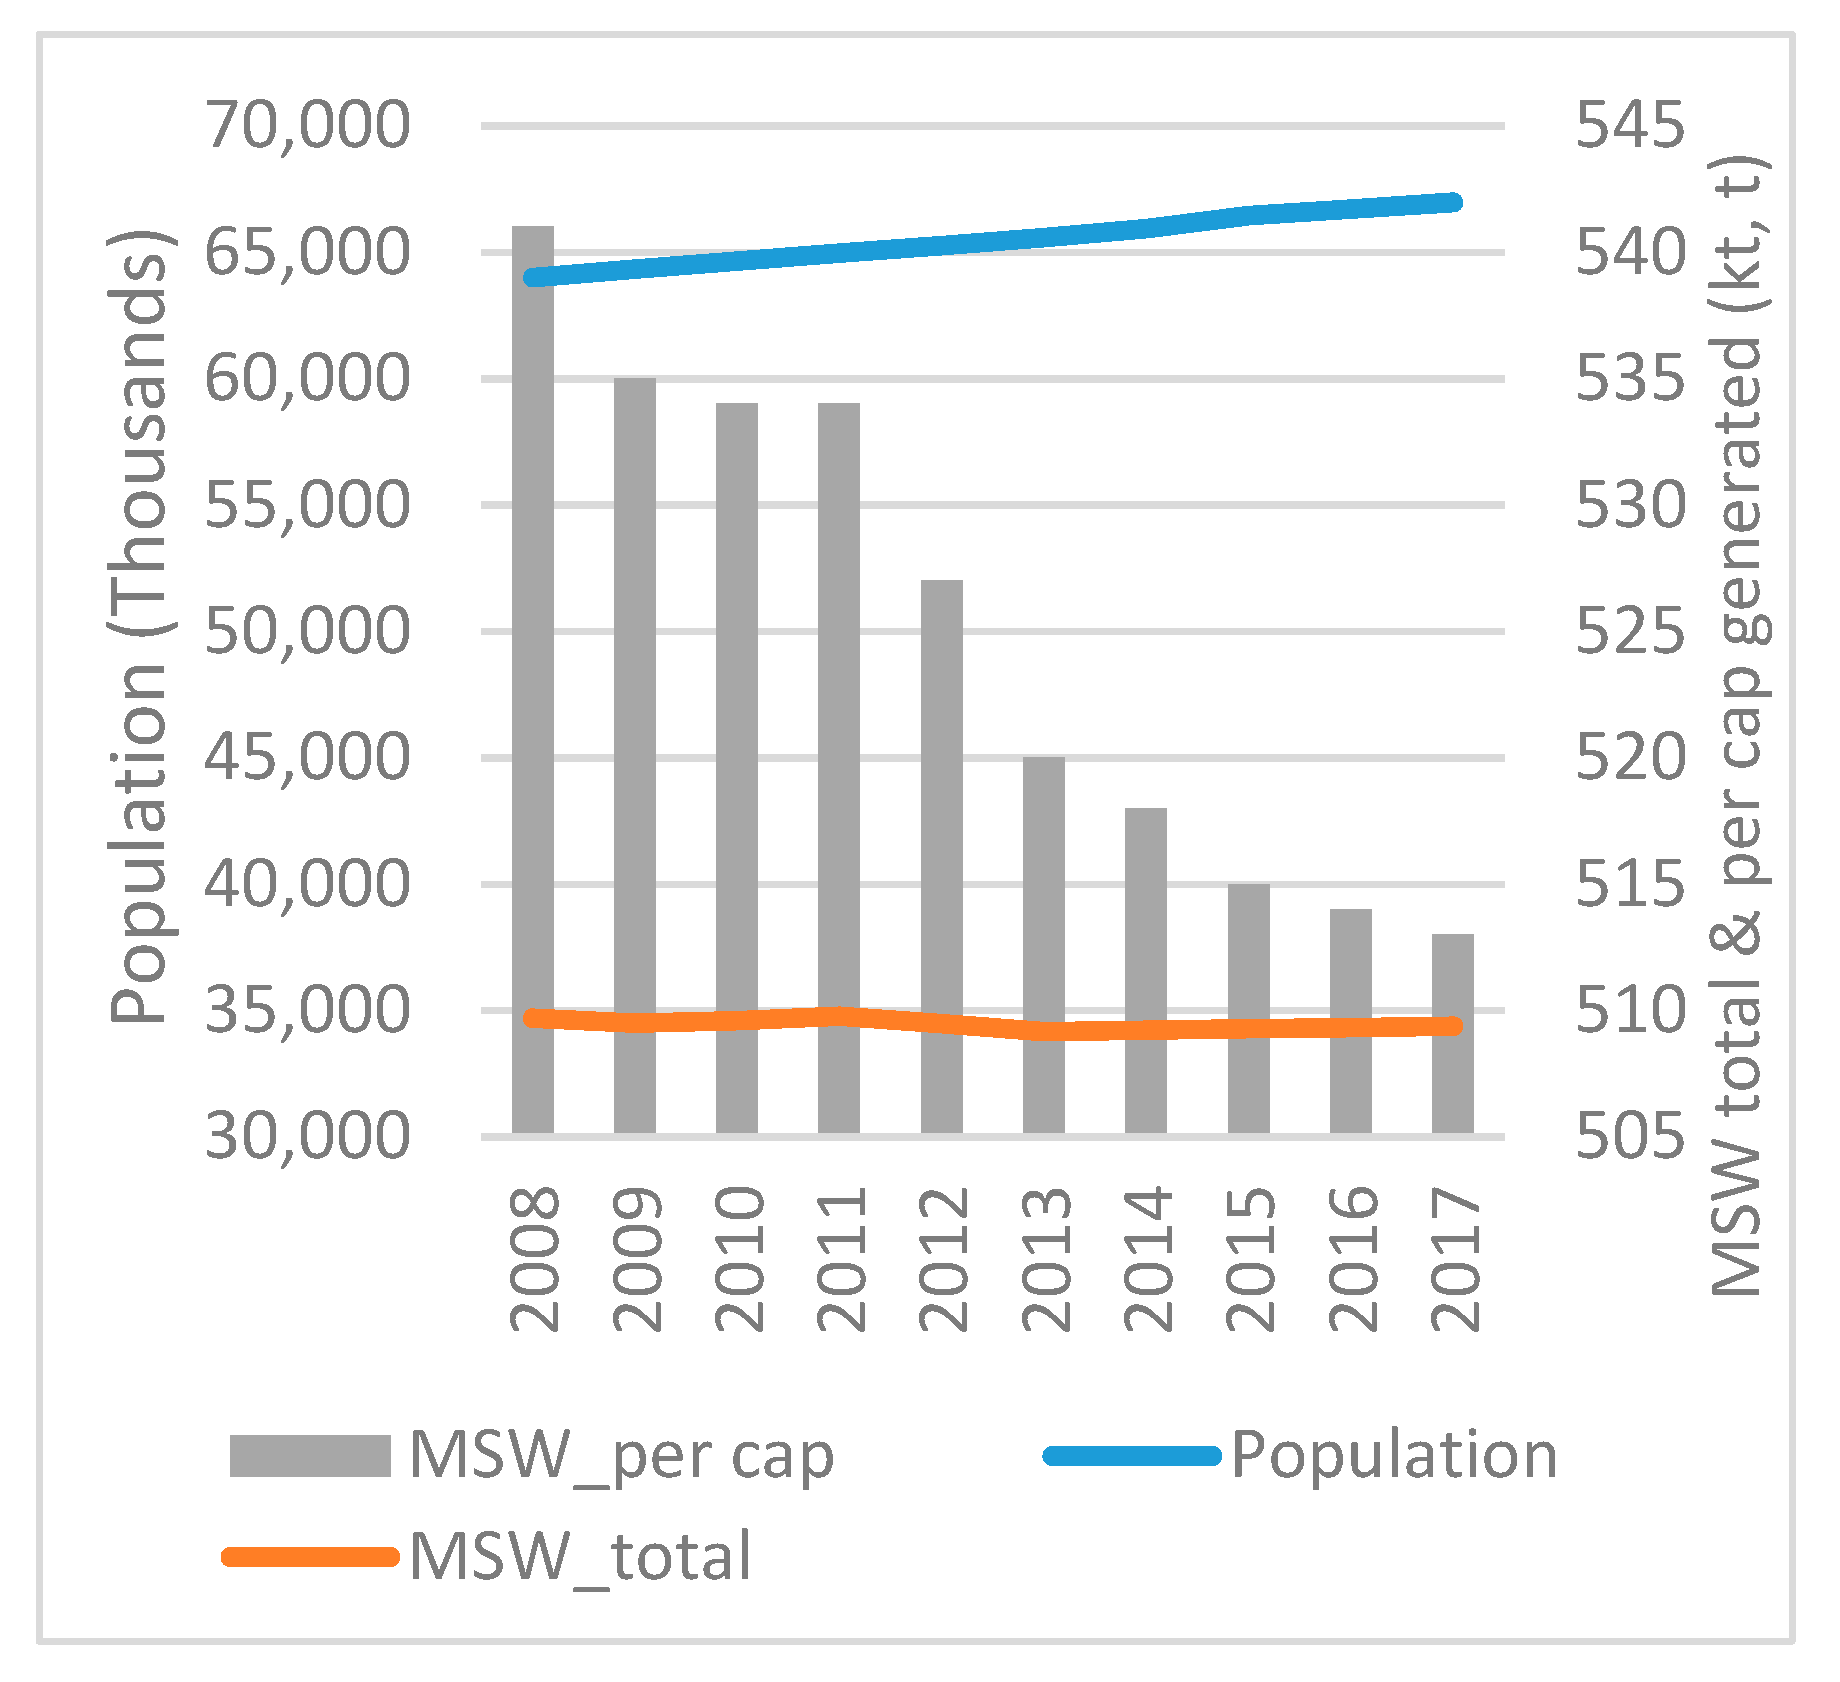
• Italy
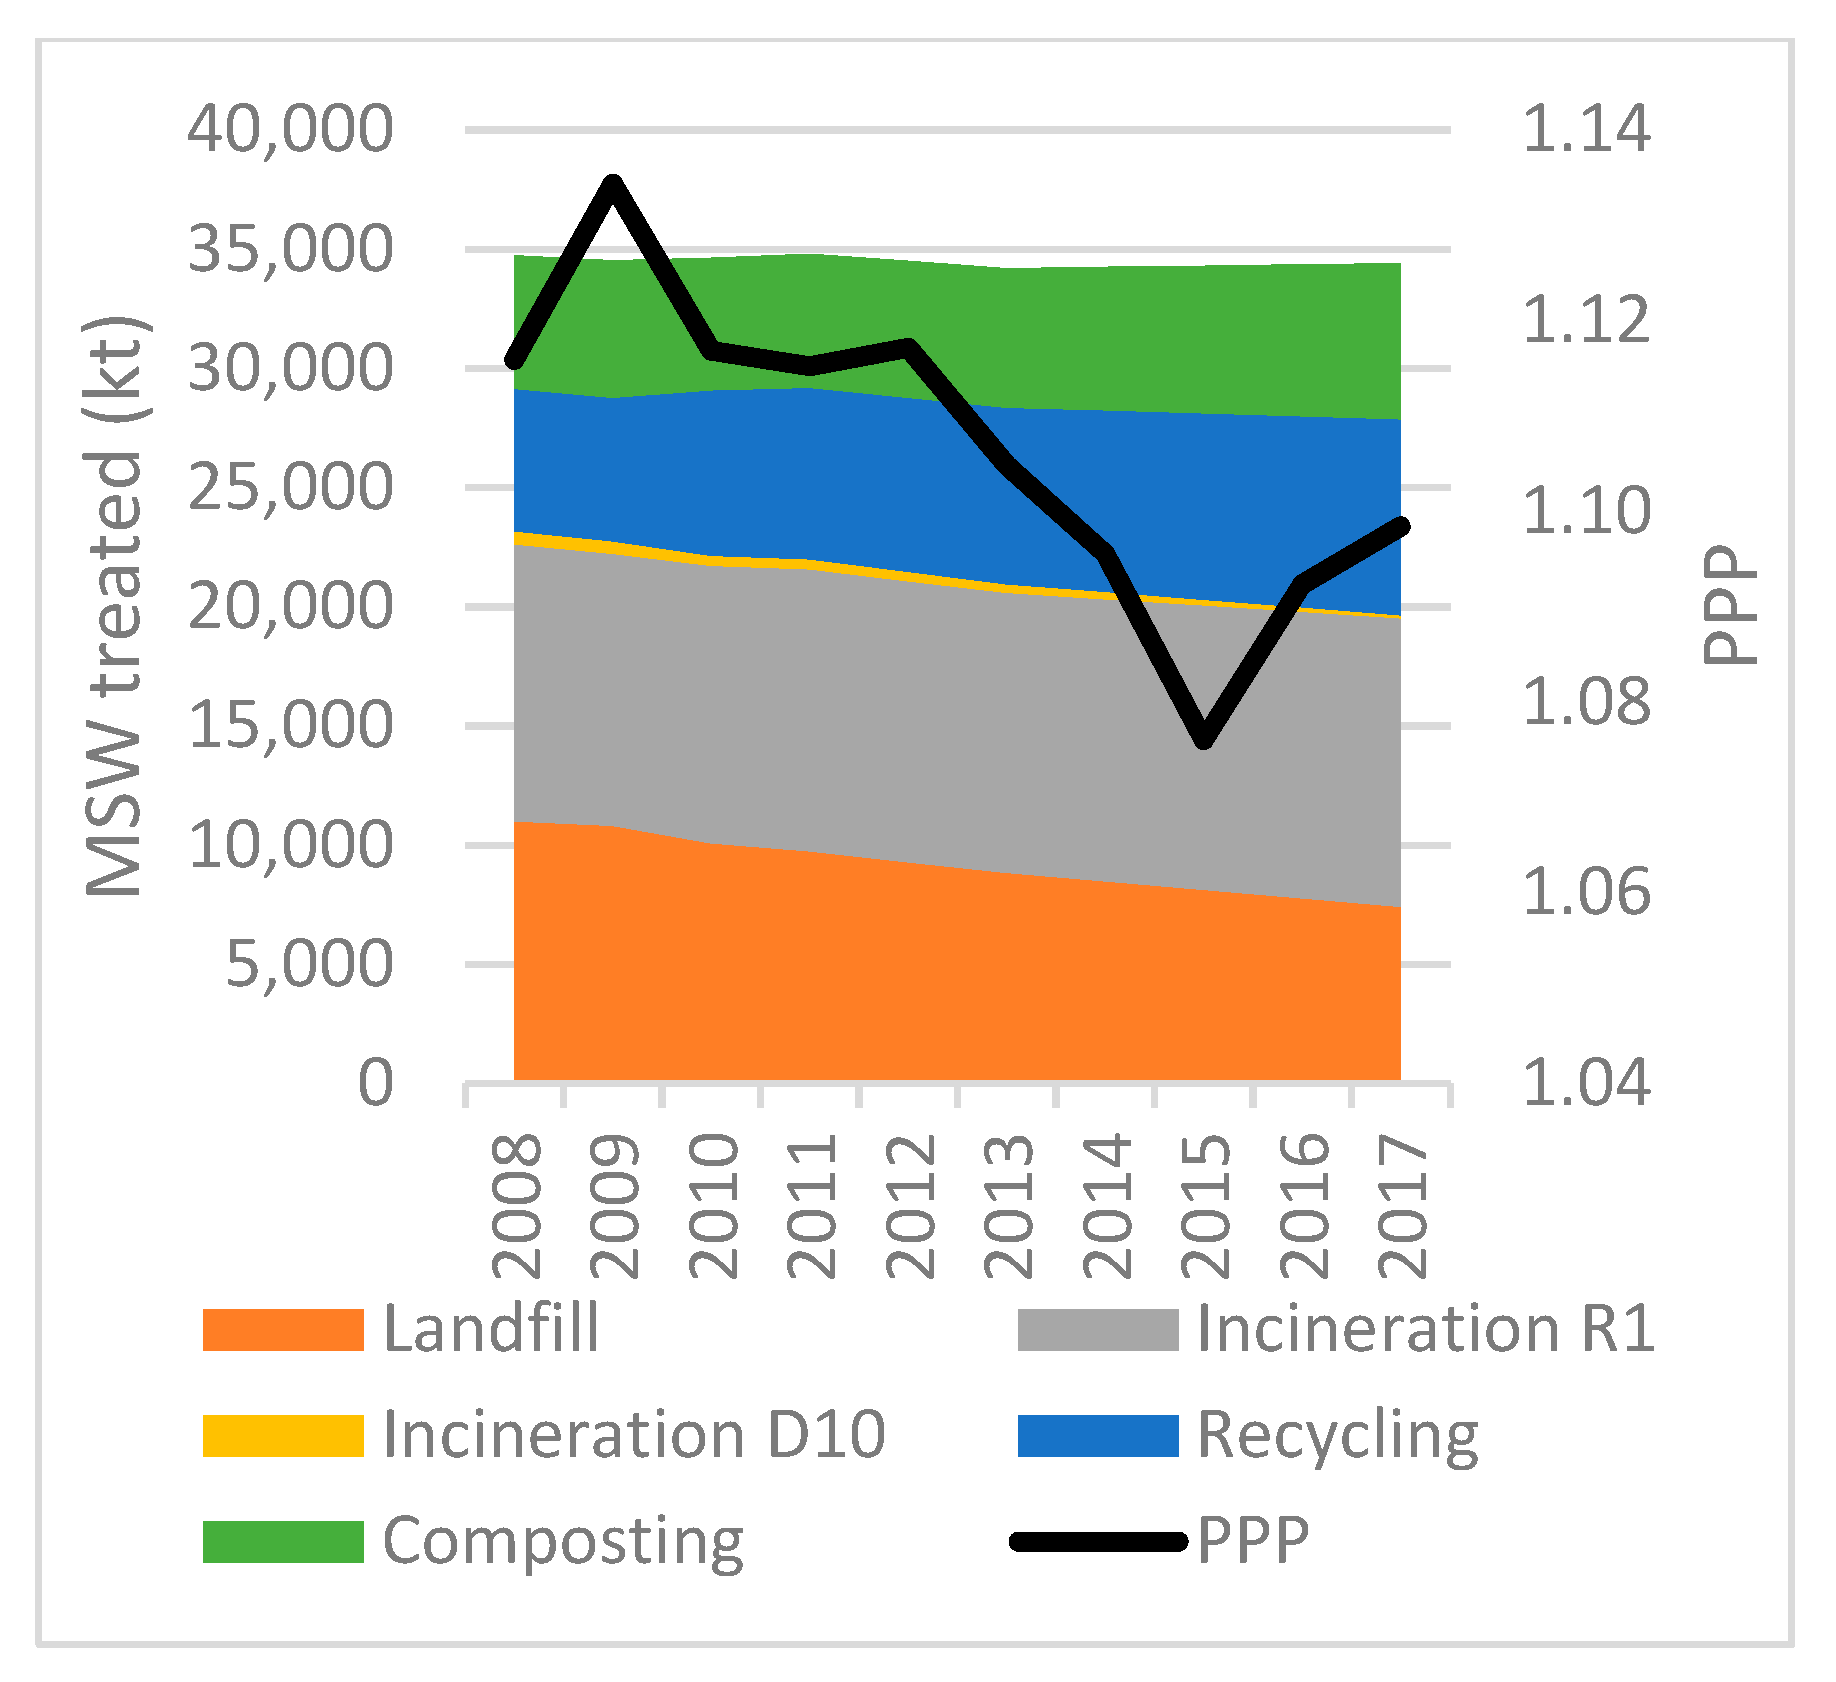
Italy, the fourth strongest economy in EU28, has decreased its MSW production appreciably over the years, reaching a reduction of almost 9%. Reduction of MSW per capita is higher and equal to 11%.
At the same time, the population in Italy has increased to over 3% (
Figure 23). According to the available data, landfilling in Italy has decreased over the years by close to 57%. All other methods have increased their share in waste treatment. Incineration (D10) contribution has increased dramatically (by over 700%), recycling has increased by over 75%, composting by over 90%, while incineration (R1) has increased its share to almost 24%. Purchase Power in Italy has met small fluctuations and finally formulated equal to 0.56%. Therefore, there is no possible correlation between PPP and any of the waste treatment methods (
Figure 24).
• Cyprus
Cyprus is one of the smallest countries in EU28. Its population, through the years investigated, has increased by over 10%, while the reduction in MSW produced is close to 5% (
Figure 25). Reduction of produced MSW per capita is higher and close to 13%. PPP in Cyprus has been, on average, almost 2%. Waste treatment is based on landfilling, with this being over 92% in 2008, while a reduction of 22% was reached in 2017. However, it is worth noting that recycling has increased its rate by over 85% while a great contribution of composting in waste treatment has also been achieved (
Figure 26).
• Latvia
Landfilling in Latvia is the major methods for waste treatment. Landfilling, in 2008, was used for treating over 90% of the MSW amount. This percentage has fallen to nearly 30%. Thus, a reduction over 65% has been achieved (
Figure 27). On the other hand, environmentally friendly methods such as recycling, composting and incineration with energy recovery have increased their shares. What should also be highlighted is the great production of MSW compared to reduced population, where this reduction reaches 11%. However, MSW per capita has dramatically increased by over 26%. Purchase Power in Latvia, which had dramatically fallen at the beginning of the research time period, finally, on average, decreased by almost 5% (
Figure 28).
• Lithuania
The population in Lithuania has decreased by over 11%, while reduction of MSW production can be seen for the same time period (6%). On the other hand, MSW per capita has increased by over 6% (
Figure 29). Although some fluctuations regarding PPP are presented through the years investigated, an increase of almost 2% was finally achieved in 2017. In 2008, 1.245 kt of waste was disposed of in landfills. In 2017, the amount of produced MSW that disposed was 421 kt, a reduction equal to 66%.
The second largest method used in the country is recycling, and, on average, 25% of waste was treated this way by the end of 2017. Although composting is relatively low, it has also increased its share within the researched time by more than 2.000%. On the other hand, incineration (R1) has appreciably increased as a treatment method and in 2017, 20% of the MSW generated was treated through Waste-to-Energy technology. Taking into consideration how the PPP is formulated, it is revealed that its increase positively affects ecofriendly waste treatment methods (
Figure 30).
• Luxembourg
Luxembourg is one of the smallest countries in EU28. The population in the country has increased by over 22% while production of MSW has also increased by over 6% (
Figure 31). What should be highlighted is the great reduction of produced MSW per capita, where the decrease reaches almost 13%. The waste management system of the country includes all the available methods except from incineration (D10). In 2007, the percentage of waste that was disposed of in landfills was 15.5%. In 2017 the amount of waste that was disposed in landfills reduced to 7%. Recycling and composting maintain almost the same share in waste treatment throughout the years, with an increase of 2% and 1% respectively based on the amount produced. In 2017, incineration with energy recovery (R1) was used for treating almost the half of the produced waste (45%). A high increase of PPP has been achieved in Luxembourg equal to 7% (
Figure 32).
• Hungary
Population and waste generation in Hungary have decreased through the years by 2.5% and 17.2% respectively. A significant reduction also appears in the case of per capita produced, where the reduction is equal to 15%. The reduction of waste produced in Hungary is one of the greatest in EU28 (
Figure 33). According to the available data, PPP in Hungary, throughout the years investigated, has also seen the greatest increase, reaching over 16%. The main waste treatment method in 2008 was landfilling, and almost 80% of the produced MSW was treated this way. In 2017, this percentage dropped to 49%. All the other methods, apart from incineration (D10) which was not used, have increased their contribution. However, it is worth highlighting the great increase of composting (263%). Incineration (R1) and recycling increased to 55% and 67% respectively (
Figure 34).
• Malta
Malta is one of the smallest countries in EU28. However, both population and waste production have increased. The population has reached an increase of over 12%, while increase of MSW is over 2.5%. However, it is worth noting that MSW per capita has decreased by over 10% (
Figure 35). On the other hand, Purchase Power in the country has also increased by close to 14%. The waste management system is based on landfilling. In 2008, 97% of the produced MSW was disposed of in landfills, while in 2017 the percentage of the amount disposed was 93%. However, it should be highlighted that recycling reached an increase of about 80%, and, throughout the years, remains the only alternative to landfilling (
Figure 36).
• The Netherlands
One of greatest reductions of MSW has been achieved in The Netherlands, which is equal to 11%. The reduction of MSW per capita has also increased by close to 15%. At the same time, the population has increased by over 4% (
Figure 37). On the other hand, PPP has increased to about 4%. Waste disposal in landfills has been quite low since 2008. Only 1.50% of the waste produced was disposed of in landfills. On the other hand, the majority of the waste produced has been treated through incineration (D10). In 2008, 40% of MSW was treated in incineration furnaces (D10). However, in 2017, this technology was used for treating just 1%. In the case of recycling and composting, some small differences are presented. Composting has increased its rate, so it is equal to 6%, while in same time period, recycling decreased its rate to almost 6%. The technology that saw the highest increase was incineration (R1). In 2008, the percentage of MSW that was treated through this technology was 9%, reaching 44% in 2017 (
Figure 38).
• Austria
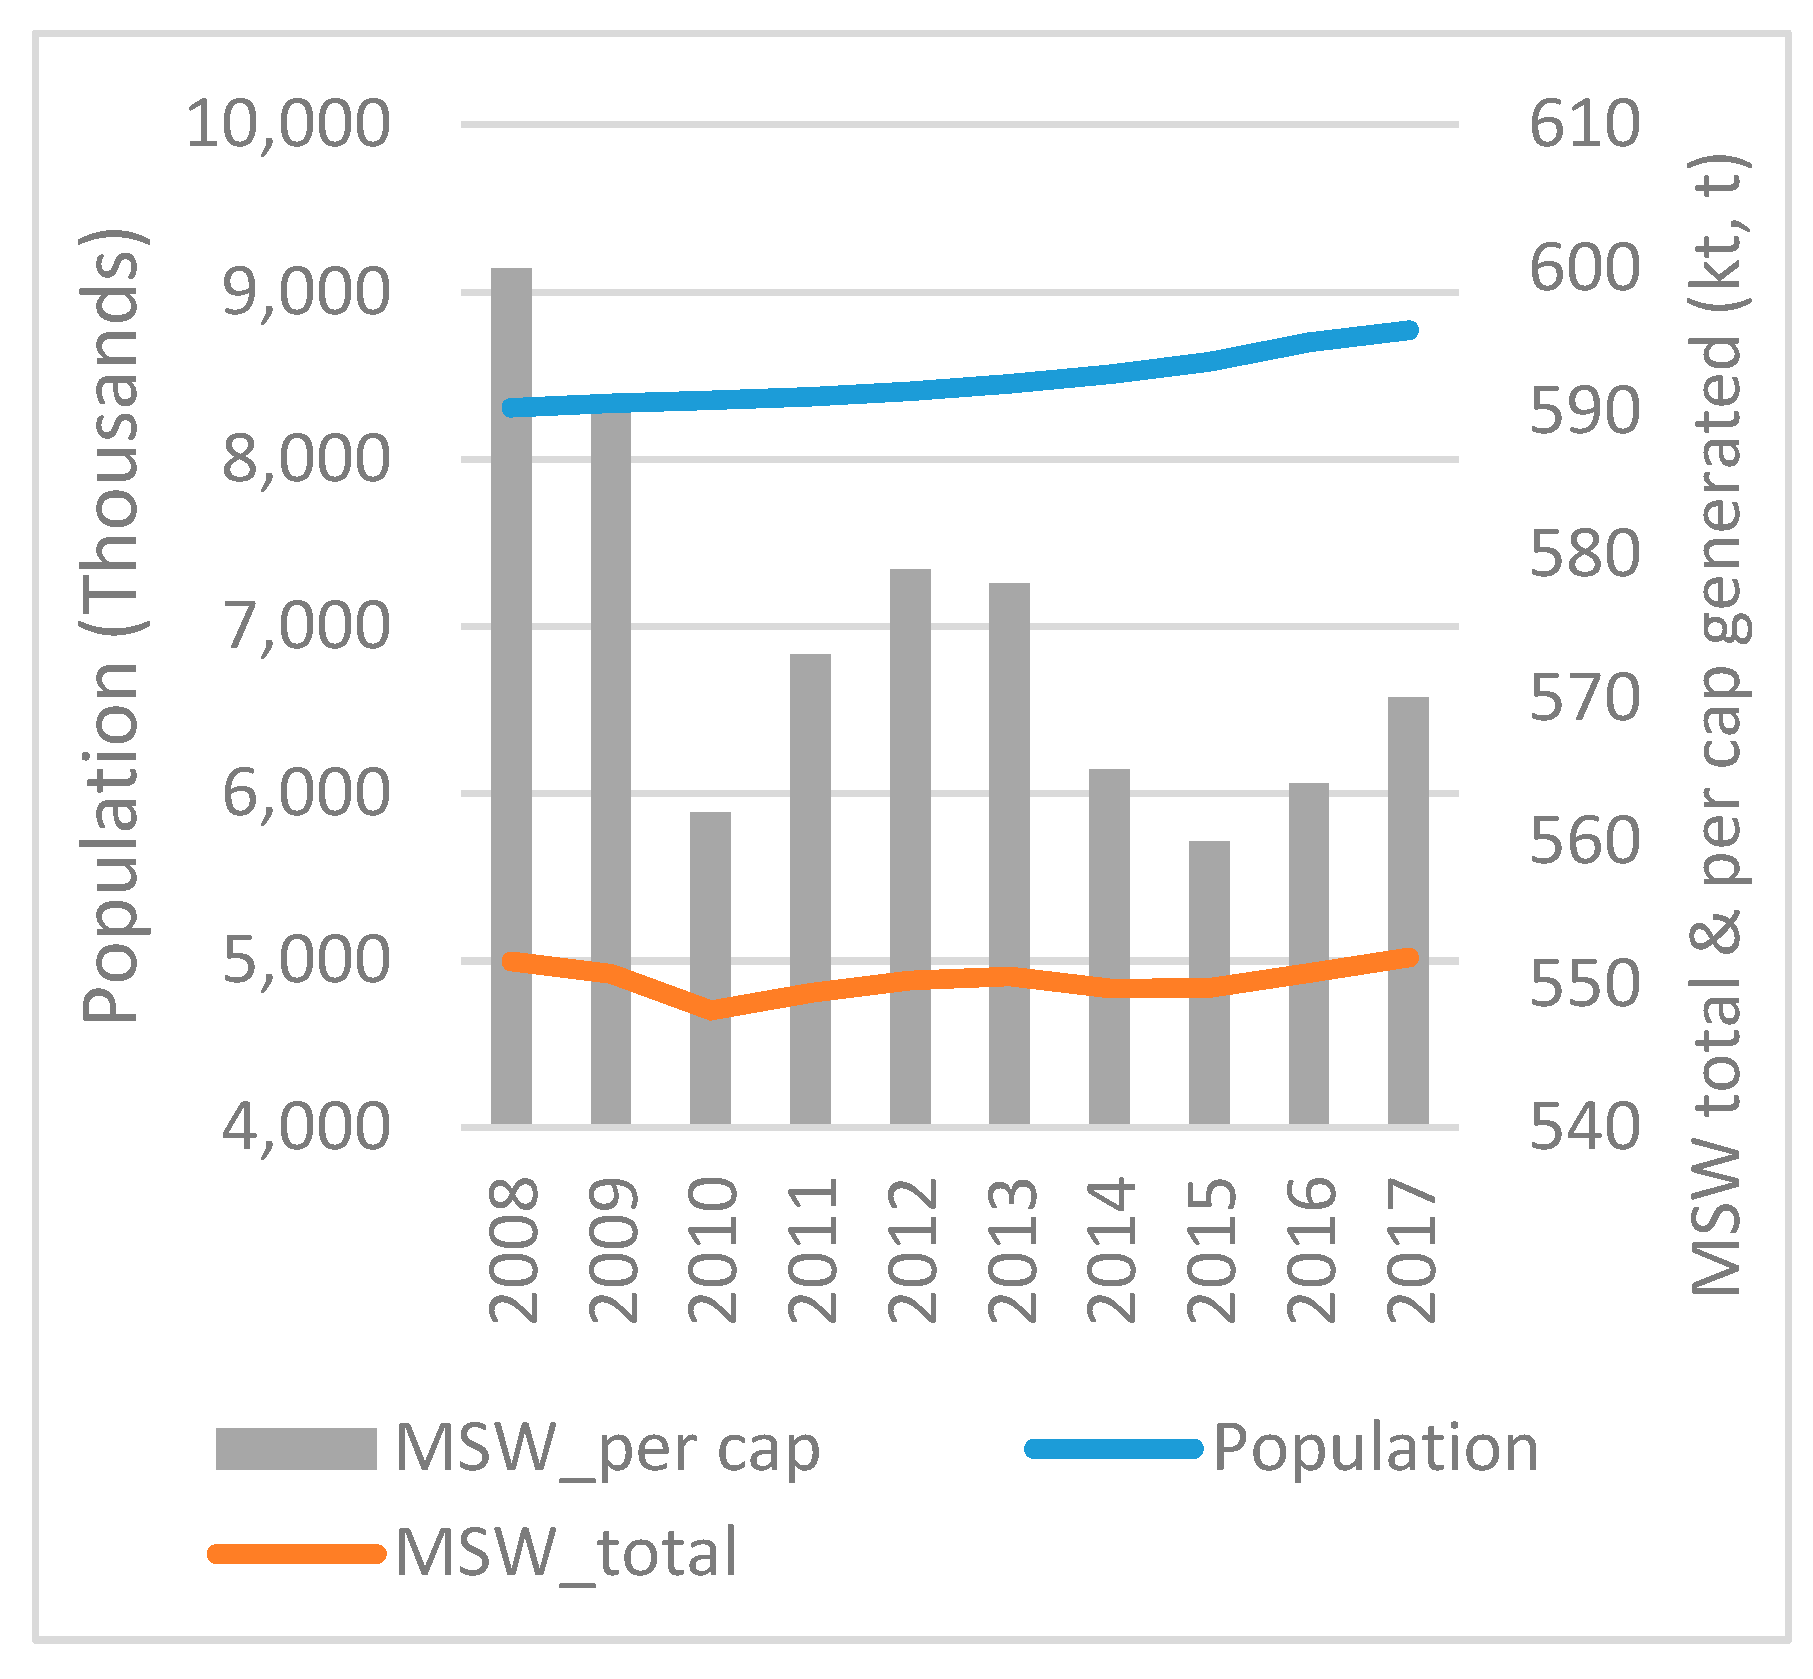
The population in Austria has increased by over 5% in the period under investigation. The amount of MSW generated has also increased by less than 1%, while production of MSW per capita has decreased by 5% (
Figure 39). On the other hand, citizens’ PPP over the examined period, has increased over 2%. Concerning the waste treatment methods in Austria, landfilling has been used to treat less than 9%.
In 2008, most of the MSW generated was treated via the composting method. representing more than 34% of the amount produced. By the end of 2017, the amount treated through this method remained almost unaltered and equal to 32%. Incineration (R1) was the second most facilitated method for waste treatment, accounting for 30%, while recycling represented 27%, in 2008. In 2017, incineration (R1) had increased its rate by over 40%, and was the most used method for waste treatment. With regards to the Purchase Power in Austria, several small fluctuations were present, but at the end of the research period, this had increased over 2% (
Figure 40).
• Poland
The population and MSW production in Poland, through the years, present minor differences. However, on average, a decrease of 0.40% and 1.90% respectively have been observed. The same reduction also appeared in MSW per capita (
Figure 41). PPP, throughout the researched time period, increased by over 6%, one of the highest in EU28. On the other hand, the waste management system in Poland was initially based on landfilling. In 2017, the waste amount that was disposed of in landfills reached over 90%, displaying an overall reduction equal to 42%. All the other available methods have increased their share in the waste management system. However, at the end of the examined time period, landfilling still remained the leading waste treatment method (
Figure 42).
• Portugal
The population in Portugal has decreased by over 2%, while MSW has also decreased by close to 9%. Almost the same reduction has also been achieved in the case of MSW per capita (
Figure 43). On the other hand, Purchase Power of citizens, throughout the years under investigation, increased by over 2%. Landfilling was the most used method in 2008, treating over 63% of the amount produced. In 2017, landfilling decreased to almost 50%. Furthermore, the contribution of incineration (R1) almost remains unaltered. Moreover, the contribution of recycling increased only 1.60%. Finally, a method that has increased appreciably its contribution in waste treatment is composting. In 2008, 6.5% was treated through this method while, at the end of 2017, 18% of the amount produced was treated through this method (
Figure 44).
• Romania
A great reduction of MSW production has taken place in Romania. The production of MSW decreased by over 35%, while the population has also decreased by close to 5% (
Figure 45). The production of MSW per capita has also dramatically decreased and is equal to 33%.
On the other hand, PPP in Romania has increased over 17%, being the highest within EU28. However, in 2007, the waste management system was based entirely on landfilling, treating 99% of the amount produced. In 2017 the landfilling method was used for 71% of MSW production. The use of other methods was almost nonexistent. In 2017, incineration (R1) was used for treating 4% of the MSW produced, recycling increased its share equal to 7%, while composting was used for treating over 6% of the waste produced (
Figure 46).
• Slovenia
The population in Slovenia has increased by almost 3%, while MSW production has reached a reduction equal to 11% (
Figure 47). As in the case of total production of MSW, great reduction has also been achieved in MSW per capita. PPP presents minor fluctuations through the years but finally increased to almost 1.60%. There are two main methods for waste treatment in Slovenia. Landfilling, where 75% of MSW is treated this way and recycling, which accounts for the remaining 25%. In 2017, the percentage of MSW that was disposed of in landfills decreased to 12%. On the other hand, incineration increased its contribution close to 10%, incineration (D10) near to 5%, while recycling and composting was used to treat 53% and 20% of the MSW produced respectively (
Figure 48).
• Slovakia
A great increase of MSW production has taken place in Slovenia. The production of MSW has increased by over 22%, while produced MSW per capita has also increased at almost at the same level. The population has also increased, but by less than 2% (
Figure 49).
Data reveals that all the available methods are included in the waste management system of Slovakia. In 2008, the share of waste that ended up in landfills was over 80%. The share of the other methods was significantly less. At the end of the examined time period, landfilling still remained the main method for MSW treatment. Any reduction observed was less than 3%. A method that was diminished was incineration (D10). MSW that was treated through the process of incineration (R1) increased by over 25%, while recycling had the greatest increase, treating 21% of the waste produced in 2017. Composting also had a great increase, where 9% of MSW was treating using this process. On the other hand, Purchase Power, regardless of any fluctuations that appeared, finally increased by less than 0.50% (
Figure 50).
• Finland
The population and MSW production increased in Finland throughout the years investigated. The population reached an increase of about 4%, while the production of MSW increased by less than 2%. On the other hand, production of MSW per capita decreased by over 3%.
Both results are relatively small (
Figure 51). Purchase Power had positive growth rates and finally increased to over 7%. In 2008, landfilling and recycling were the major waste treatment methods, treating 53% and 26% of the MSW produced respectively. In 2017, landfilling dramatically reduced and was used for treating less than 1% of MSW. Recycling increased its share to equal to 8%, while incineration (D10) was not used. On the other hand, incineration with energy recovery (R1) increased appreciably, treating almost 60% of the MSW amount. Composting also increased its contribution to equal to 13% (
Figure 52).
• Sweden
Significant growth is observed in Sweden’s population, reaching almost 9%, while the increase of MSW produced is over 2% (
Figure 53). On the other hand, what should be highlighted is the reduction of produced MSW per capita, where reduction reaches almost 7%. Purchase Power has positive growth rates and finally increased to over 12%, one of the greatest in EU28. In Sweden, the method of landfilling has been used for treating only 4% of the waste produced. Incineration with energy recovery (R1) has been used widely for waste treating, representing almost 50% of the methods used. Recycling and composting are also used in high rates for waste treatment. Recycling is the second most facilitated method. In 2017, landfilling was used for treating less than 0.50% of the MSW, while incineration (R1) and recycling were used the most with small differences. Composting, compared to other methods, reached the greatest increase, equal to 35% (
Figure 54).
• United Kingdom
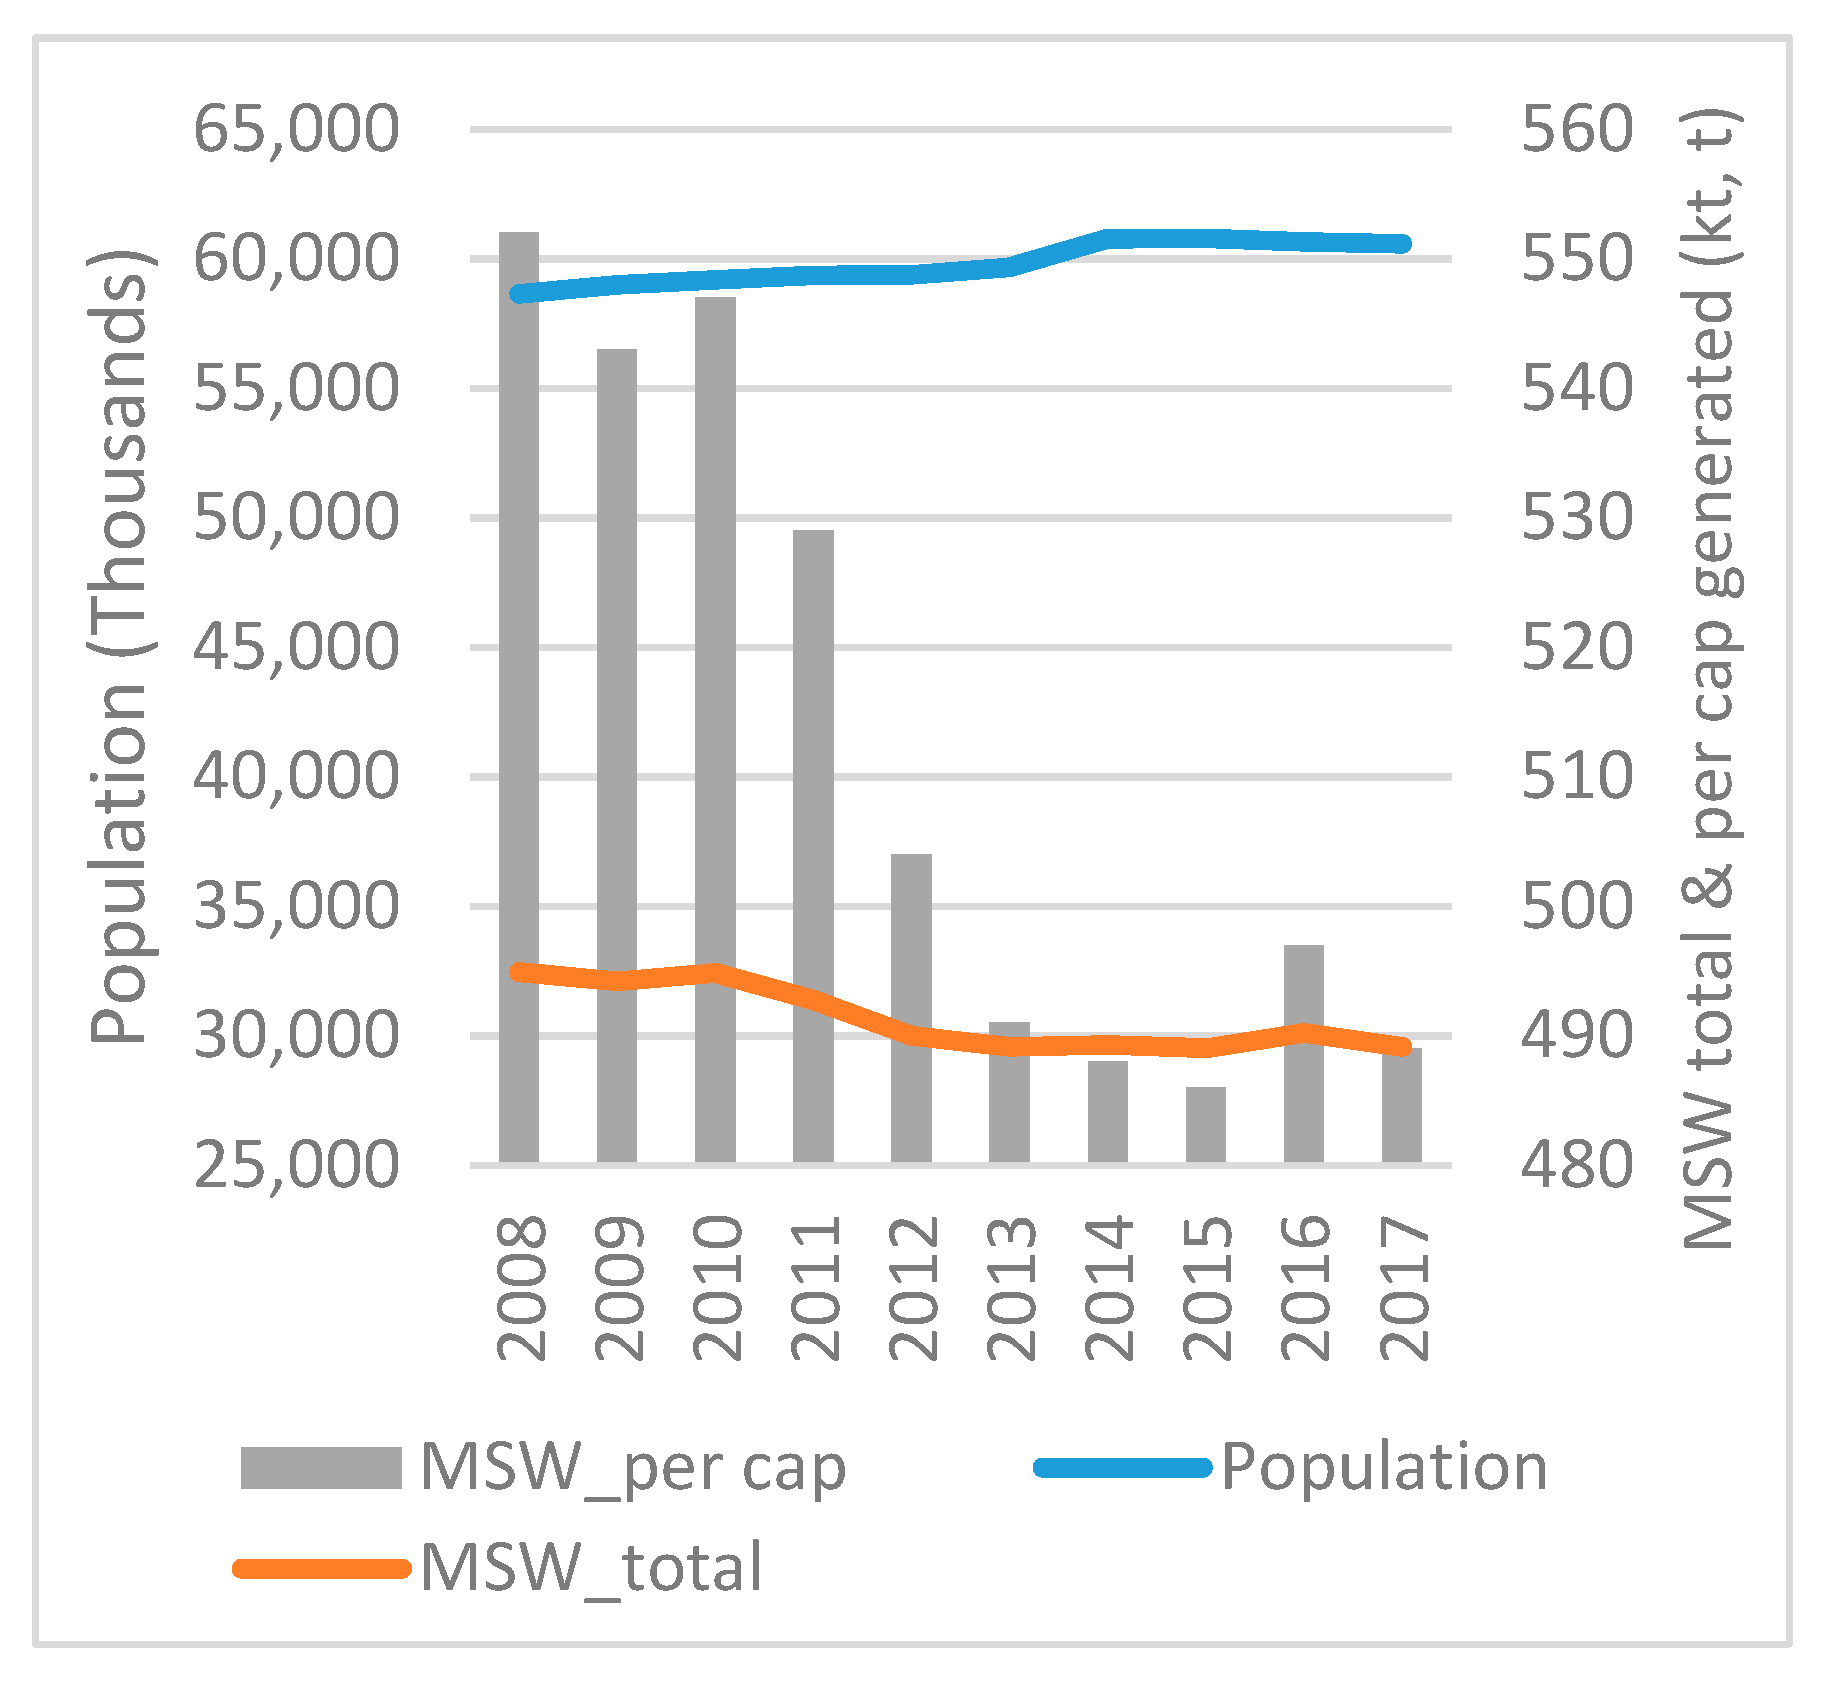
T population in the United Kingdom (UK) has increased by over 6.5%, while MSW production has decreased by over 5%. A great reduction is also observed in the amount of MSW per capita, reaching almost 11% (
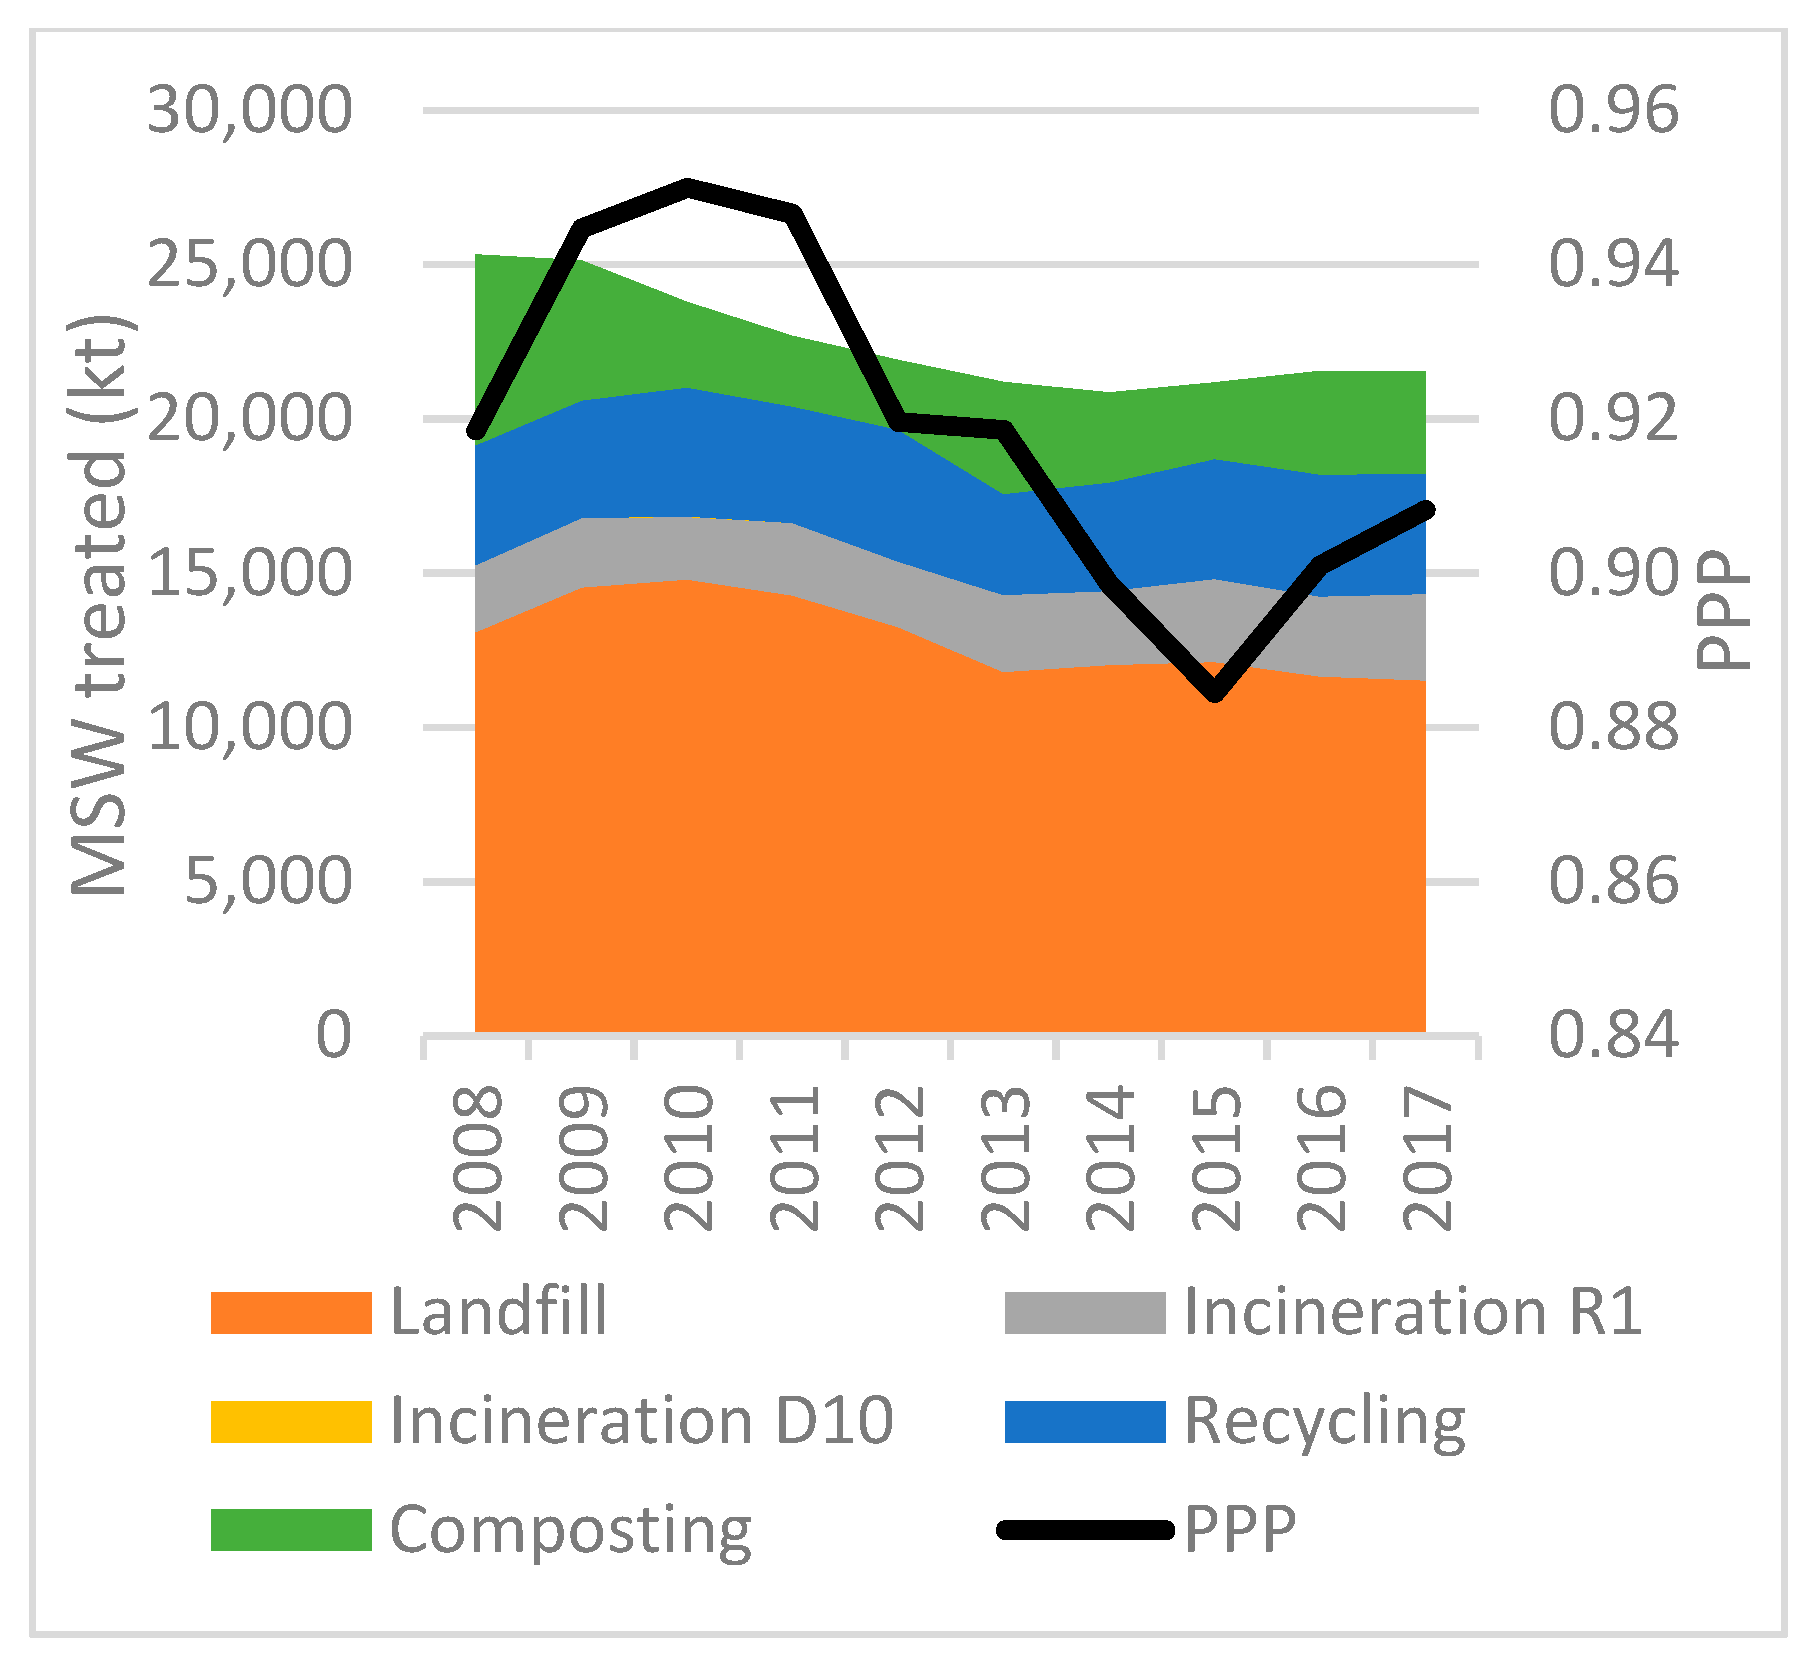
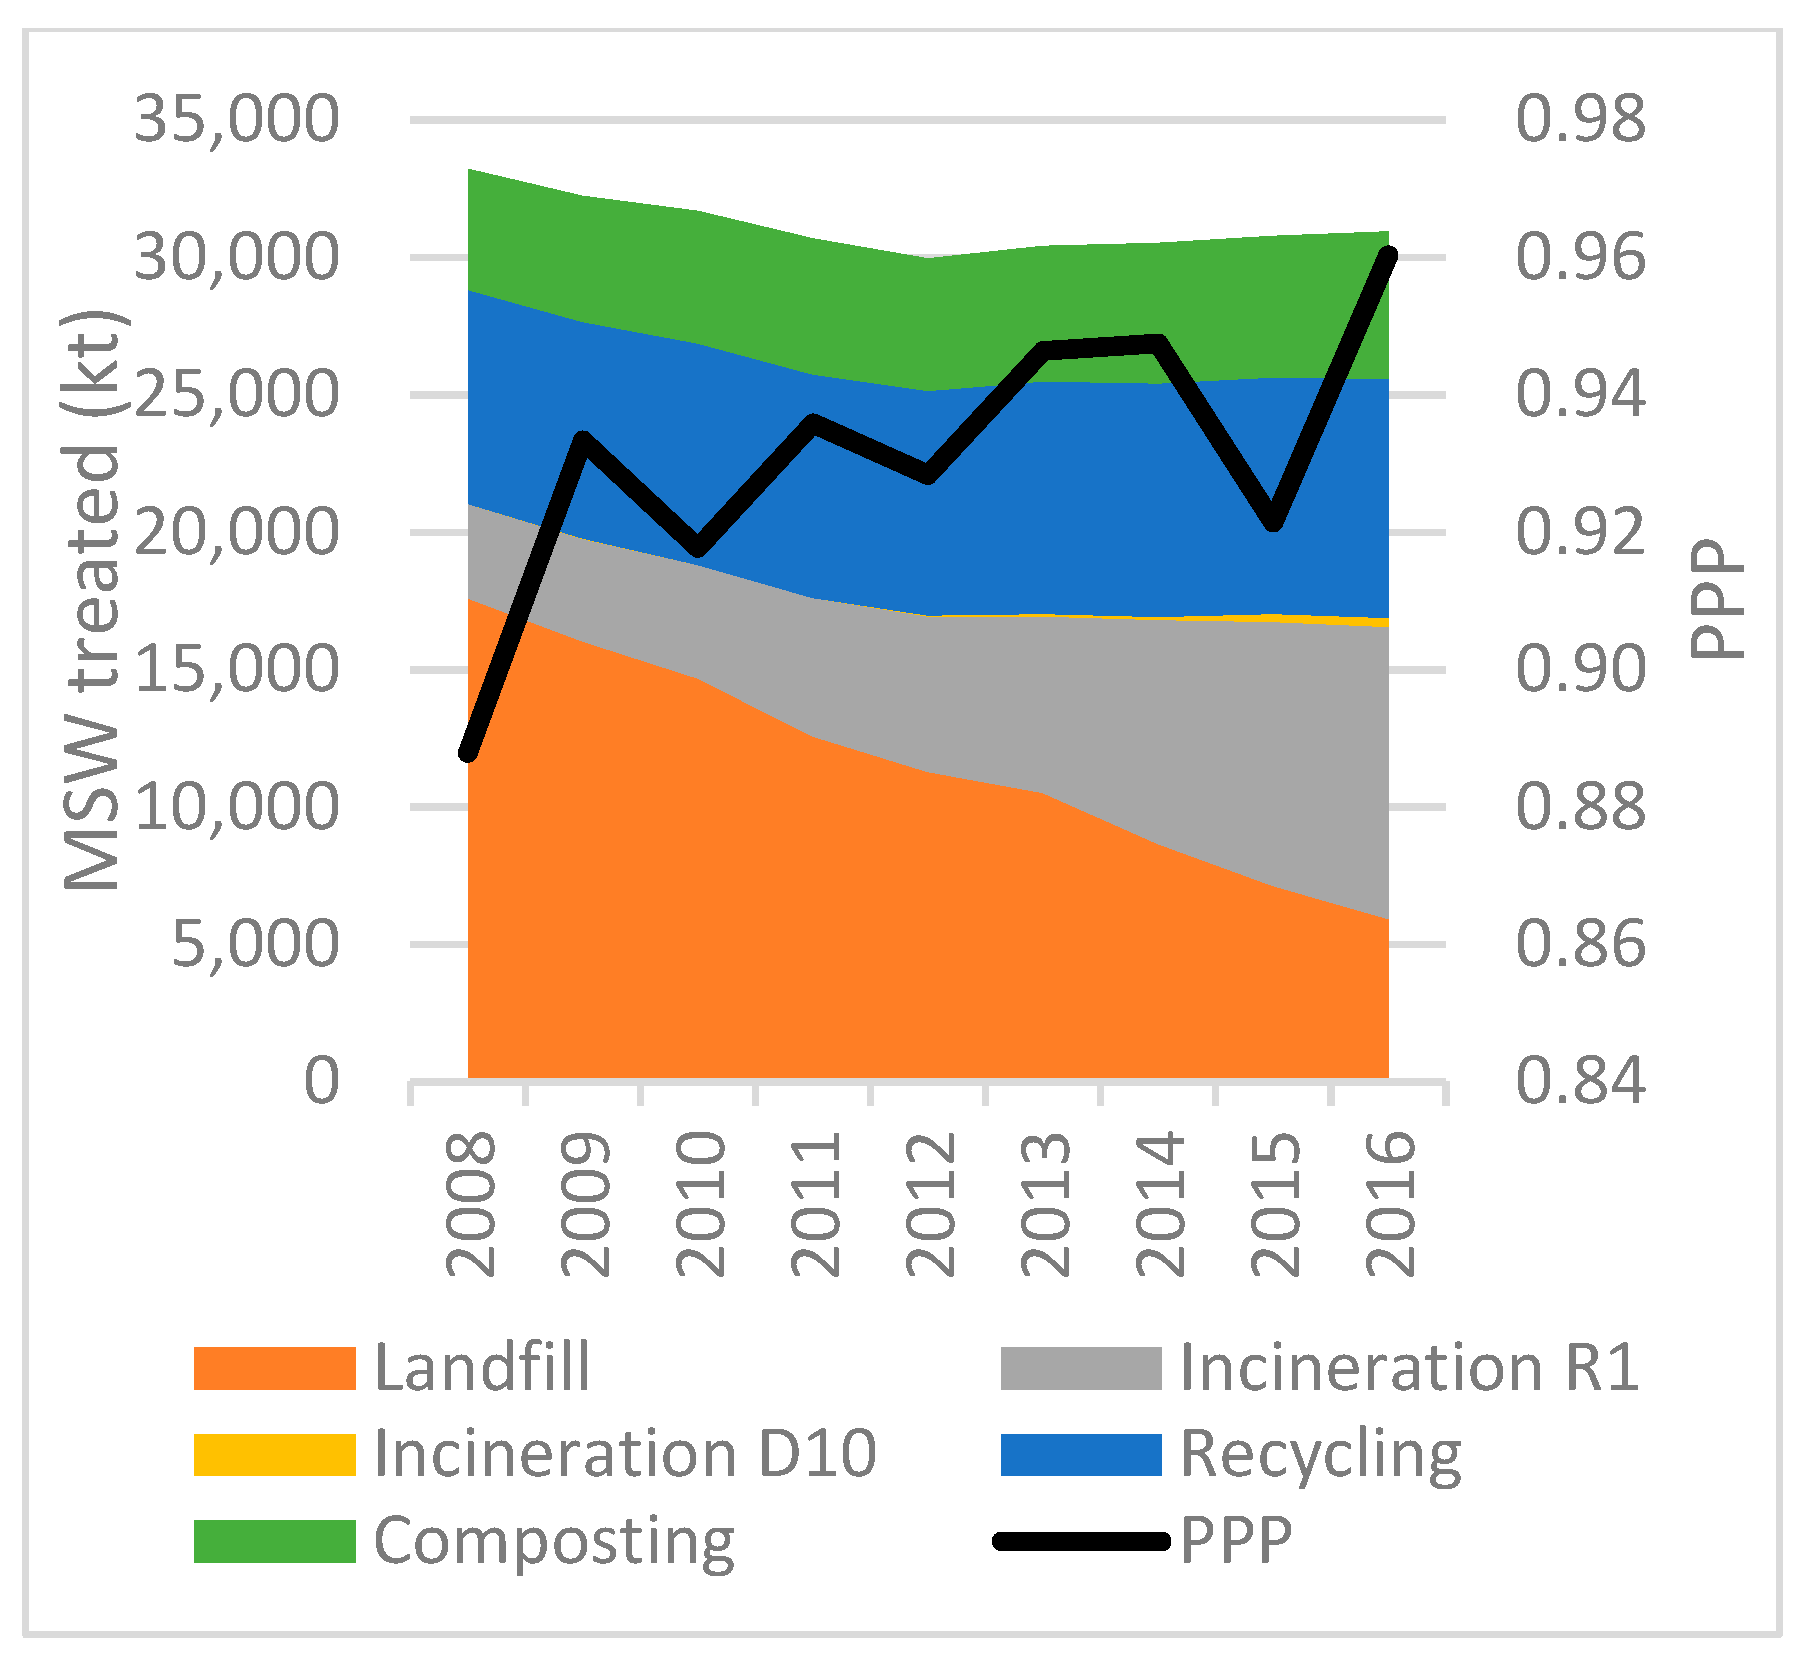
Figure 55). On the other hand, Purchase Power has seen an increased growth rate reaching, at the end of the time period assessed, an increase of over 8%. In 2007, all the available techniques were included in the waste management system of the UK. In 2007, the major method for waste treatment was landfilling. The amount of waste treated through this method represented 57% of the amount produced. Recycling and composting have been used for treating 22% and 12% of the MSW amount respectively. Incineration (R1) accounts for 9%, whilst the minimum contribution of incineration (D10) is equal to 0.02%. In 2016, landfilling reduced by over 66%, while incineration (R1) increased by over 200%. Recycling and composting increased to 12% and 22% respectively. Finally, the percentage of MSW produced and treated through incineration (D10) reached 1% (
Figure 56).


