Article

Racial/Ethnic Residential Segregation, the Distribution of Physician’s Offices and Access to Health Care: The Case of Houston, Texas

by
Kathryn Freeman Anderson
Department of Sociology, University of Houston, Houston, TX 77204-3012, USA
Soc. Sci. 2018, 7(8), 119; https://doi.org/10.3390/socsci7080119
Submission received: 11 June 2018 / Revised: 10 July 2018 / Accepted: 16 July 2018 / Published: 24 July 2018

Abstract

:
Previous research has demonstrated the impacts of racial/ethnic residential segregation on access to health care, but little work has been conducted to tease out the mechanisms at play. I posit that the distribution of health care facilities may contribute to poor access to health care. In a study of the Houston area, I examine the association between residential segregation, the distribution of physician’s offices, and two health care access outcomes of having a personal physician, as well as the travel time to their office location. Using the 2010 Health of Houston Survey combined with several census products, I test these relationships in a series of spatial and multilevel models. I find that Black segregation is related to a lower density of physician’s offices. However, I find that this distribution is not related to having a personal physician, but is related to travel times, with a greater number of facilities leading to shorter travel times to the doctor. I also find that Black segregation is positively associated with travel times, and that the distribution of physician’s offices partially mediates this relationship. In sum, these findings suggest that a more equitable provision of health care resources across urban neighborhoods would mitigate some of the negative effects of segregation.

1. Introduction

Recent research has linked racial/ethnic minority residential segregation to a number of poor health and health care outcomes. This work has demonstrated that minority residents of highly segregated areas have higher mortality rates and experience a number of poor health outcomes (Collins 1999; Subramanian et al. 2005; Williams and Collins 2001). A related body of work, although less developed than the work on health outcomes, has shown that these areas also experience poor access to health care as well, in that residents have greater difficulty obtaining health care coverage and needed health care (Anderson and Fullerton 2012; Anderson and Fullerton 2014; Dinwiddie et al. 2013). Although many possible mechanisms have been proposed to explain this association, few studies have directly tested these theoretical accountings (White and Williams 2012). Here, I propose one such mechanism—the distribution of health care facilities across urban neighborhoods. Previous work has found that poor and minority communities lack a wide variety of health care facilities and practitioners compared to their White counterparts, and this may help account for why these areas experience poorer access to health care when needed (Anderson 2017a, 2017b).
In the study presented here, I examine racial/ethnic residential segregation, the distribution of physician’s offices, and health care access in an in-depth study of Harris County, the central county of the Houston area, which encompasses the City of Houston and some surrounding areas. In particular, I analyze two outcomes measuring access to health care—whether or not the respondent has a personal physician and, if so, their typical travel time to that facility. These are meant to gain an understanding of the extent to which individuals have access to necessary outpatient care when needed, and whether or not obtaining that needed care is more burdensome for segregated communities.
While this study only examines the Houston area, it can serve as an example and test case for thinking about these processes. According to the 2010 U.S. Census figures, Houston represents the fourth largest U.S. city and the fifth largest metropolitan area, and is now, by some metrics, the most diverse U.S. city. Houston is home to sizable populations of the three largest racial/ethnic minority groups in the United States—Latinos (44%), Blacks (26%), and Asians (6%)—and no group has a 50% majority in the city. The city is also highly stratified by both race and class, making it an interesting test case of these theories. Furthermore, from an urban sociological perspective, much of what we know from this field has focused on a few U.S. cities (Chicago and New York City, in particular). However, most of the growth in U.S. cities is happening in the sprawling Sunbelt cities of the South and West (such as L.A., Atlanta, Phoenix, and Dallas). These cities are far more similar to each other than they are to Chicago. Thus, including more cities from this region in urban analyses is fruitful for better understanding the impact of urban locales on our lives. Additionally, in terms of access to health care, Houston represents a fairly conservative test of these associations. Home to the largest medical center in the world and a destination for medical travel, Houston’s residents ought to have access to readily available high quality care.
More specifically, with this study, I aim to address three central research questions. First, are minority communities less likely to have health care facilities (physician’s offices in particular)? Second, if so, is the lack of these facilities associated with poor access to health care? That is, is having an insufficient supply of physicians at the community-level related to the likelihood of having a personal physician or travel time to that physician’s office? Finally, how does segregation relate to these two outcomes, and can the distribution of facilities mediate this association? Using in-depth survey data from the Houston area combined with geographically located contextual data on segregation and health care establishments, I will attempt to address these questions. First, I will provide an overview of the current literature on the topic, the theoretical considerations in this work, and my own conceptual model. I will then describe my data sources and methods, and then discuss the findings of this study.

2. Literature Review and Theoretical Framework

2.1. Segregation and the Link to Health Care

Research over the past several decades has linked residential segregation to a number of poor health and health care outcomes for minority residents of these communities. For instance, this work has demonstrated that segregation is related to higher mortality rates for adults, as well as infant mortality and infant health outcomes (Collins 1999; Collins and Williams 1999; Ellen et al. 2000; Grady 2006; Hart et al. 1998; LeClere et al. 1997; McFarland and Smith 2011; Polednak 1997). Moreover, segregation is associated with a number of poor general health outcomes, including self-rated health, obesity, functional disability, and mental health (Anderson 2016; Anderson and Fullerton 2014; Dinwiddie et al. 2013; Gaskin et al. 2009; Lee 2009; Lee and Ferraro 2007; Rodriguez et al. 2007). A smaller body of work has also linked racial residential segregation to several poor health care outcomes, including access to health care coverage, having a personal physician, and health care utilization (Anderson and Fullerton 2012; Anderson and Fullerton 2014; Dinwiddie et al. 2013; Gaskin et al. 2009; Rodriguez et al. 2007). These results have been found for Black and Latino segregation, although less work has been conducted on the Latino case, and the relationship is not as clear-cut as in the Black case.
Focusing on access to health care specifically, despite this growing body of literature, which has established this statistical association between the two, considerably less work has been conducted that has developed and formally tested mechanisms which could link the two. Some work has put forth mechanisms or implied mechanisms, but few studies have actually measured and formally tested the mechanistic pathway between the two.
Theoretically, segregation scholars have long documented the various ways that such separation can limit opportunities for minority communities and perpetuate other forms of inequality, such as economic inequality (Charles 2003; Massey and Denton 1993; Wilson 1987). Principally, segregation can impact a number of different life outcomes, including access to health care, because segregation is primarily a process of discrimination and social exclusion. The historical roots of segregation and the functional purpose of segregation is to create social distance from minority groups in order to maintain privileged spaces for the dominant group (Massey and Denton 1993). Massey and Denton argue that it serves as an “institutional apparatus that supports other racially discriminatory processes and binds them together into a coherent and uniquely effective system of racial subordination” (1993:8). As such, segregation may hamper opportunities, create a variety of other social problems, and limit upward mobility (Charles 2003; Massey and Denton 1993). Although no longer legally enforced, segregation remains an important part of the American residential landscape, and its rates are even growing for groups like Latinos and Asians, as their populations increase in the U.S. (Iceland 2004).
As it relates to medical sociology, in a seminal piece on this topic, Williams and Collins (2001) outline a number of different ways that segregation could be linked to both poor health and health care outcomes. Writing in the fundamental cause tradition, they argue that segregation serves as a fundamental cause of poor health care outcomes in minority communities, as it patterns so many aspects of social life (Link and Phelan 1995; Williams and Collins 2001). Thus, segregation can maintain a relationship to multiple poor health care outcomes through multiple mechanisms (Williams and Collins 2001).
They outline several potential mechanisms, which I have broadly grouped into three main categories. First, they suggest that segregation can impact access to health care because segregation serves to concentrate poverty and its ill effects into one geographical area of the city and among one group, which is a perspective often employed more broadly in the work on segregation (Massey et al. 1994; Wilson 1987). As full access to the medical system, through insurance or the ability to pay for services, is largely a function of socio-economic resources in this country, the link between segregation and socio-economic status (SES) can serve as important explanatory mechanism (Williams and Collins 2001). Indeed, research has linked residential segregation to lower rates of health care coverage for minority residents (Anderson and Fullerton 2012). Another mechanism linking segregation to health care outcomes is discrimination within the medical system itself, on the basis of both place and race (Williams and Collins 2001). Studies have demonstrated that even when minority residents are able to access needed care, they are less likely to receive appropriate medical care (Mayberry et al. 2000; White and Williams 2012). Furthermore, others have documented segregation across both residential and non-residential inpatient medical facilities (Smith et al. 2007; White and Williams 2012). Finally, a third mechanism posits that segregation can lead to poor access to health care, in that it can limit access to important community resources and health-related service providers, which can limit health care accessibility (Williams and Collins 2001). Sociological research on segregation has shown that minority segregated areas can be virtual organizational deserts (Small and McDermott 2006; Wilson 1987, 1996), and health care organizations are no exception. The lack of these establishments in segregated areas then may be detrimental to access to health care (Williams and Collins 2001). This is the mechanistic pathway on which this study will focus.
Recent work has demonstrated that certain types of urban neighborhoods are less likely to have a wide variety of health/health care-related community establishments and service providers. This has been demonstrated most convincingly in the case of the food deserts literature, in which well over a 100 studies have now shown that poor and minority neighborhoods lack a variety of food resources, and that the disparity relates to both the quantity and quality of the resources available (Algert et al. 2006; Beaulac et al. 2009; Bower et al. 2014; Horowitz et al. 2004; Moore and Diez Roux 2006; Morland et al. 2002b; Powell et al. 2007; Smiley et al. 2010; Walker et al. 2010). However, beyond food resources, a number of studies have shown that poor and minority communities have disproportionately fewer establishments across a wide variety of types, including fitness and recreation, park space, retail, social services, and civic society (Allard 2009; Allard et al. 2003a, 2003b; Anderson 2017b; Estabrooks et al. 2003; Galaskiewicz et al. 2013; Gordon-Larsen et al. 2006; Marwell and Gullickson 2013; Moore et al. 2008; Small and McDermott 2006; Small and Stark 2005; Wilson et al. 2004).
All of these community establishments could be linked to the health and well-being of the communities in which they are situated. Indeed, some growing evidence demonstrates that the local provision of these establishments is consequential. For instance, the work on food deserts has demonstrated that the lack of locally provided quality food options leads to lower consumption of healthful foods, such as fruits and vegetables, and higher body mass indexes (BMIs) and health problems as a result (Blitstein et al. 2012; Inagami et al. 2006; Jetter and Cassady 2006; Morland et al. 2006; Morland et al. 2002a; Zick et al. 2009). Relatedly, the work on fitness and recreation has shown that not having sufficient fitness facilities or green/park space is associated with lower rates of physical activity and higher BMIs (Black et al. 2010; Gordon-Larsen et al. 2006).
Despite all of this recent attention to the importance of key community establishments in an area, relatively little work has been conducted on the role of health care specifically, which is the focus of the present study. With regard to segregation in particular, only a handful of studies have examined the relationship between residential segregation and the distribution of health care establishments. Generally, these findings are in accordance with the literature on food, recreation, and social services. This work has found that Black and Latino segregated communities are less likely to have a number of different kinds of health care providers and services within their communities (Anderson 2017a, 2017b; Dai 2010; Dinwiddie et al. 2013; Gaskin et al. 2012; Hayanga et al. 2009; Ko et al. 2014; Rodriguez et al. 2007). More specifically, this research has linked segregation to a lower incidence of physician’s offices, primary care providers, mental health practitioners, urgent care facilities, a number of auxiliary health care practitioners, surgical centers, and dialysis facilities, although some of this relationship was accounted for by community-level socio-economic status (Anderson 2017a, 2017b; Dai 2010; Dinwiddie et al. 2013; Gaskin et al. 2012; Hayanga et al. 2009; Ko et al. 2014; Rodriguez et al. 2007). In a longitudinal analysis, Ko et al. (2014) tracked the closure of U.S. public hospitals over time and found that high levels of segregation coupled with high poverty led to a greater likelihood of public hospital closure.
Some studies have also linked the distribution of facilities to access to health care, at least in an ecological sense and for a limited number of outcomes. For instance, Dinwiddie et al. (2013) found that the residents of highly segregated Black and Latino areas were more likely to see non-psychiatrists for their mental health care needs. In another study, Black and Latino residents of segregated areas had sufficient access to medical facilities, but did not receive as many recommended services and had greater problems seeing a specialist (Chan et al. 2012). Another study found that in Detroit, Black residents of highly segregated areas were less likely to have access to facilities that provide mammography services and had a higher rate of late stage breast cancer diagnosis (Dai 2010).
Although this limited work has been carried out with regard to access to health care, several key questions remain unanswered. First, the bulk of this literature is limited to studies that examine the distribution of health care facilities without regard to how this impacts individual-level access to health care and the ability of individuals to get the care they need given their spatial constraints (for an exception on the case of mental health practitioners, see Dinwiddie et al. (2013)). These studies have found a disparity by racial/ethnic residential segregation in the distribution of important health care facilities, but more work needs to be done in order to draw the connection to access to health care, especially as an individual-level multilevel (and not an ecological) process. Similarly, this work has not fully tested this pathway as a mechanism, or examined the extent to which the lack of these facilities in segregated communities mediates the relationship between segregation and poor access to health care.

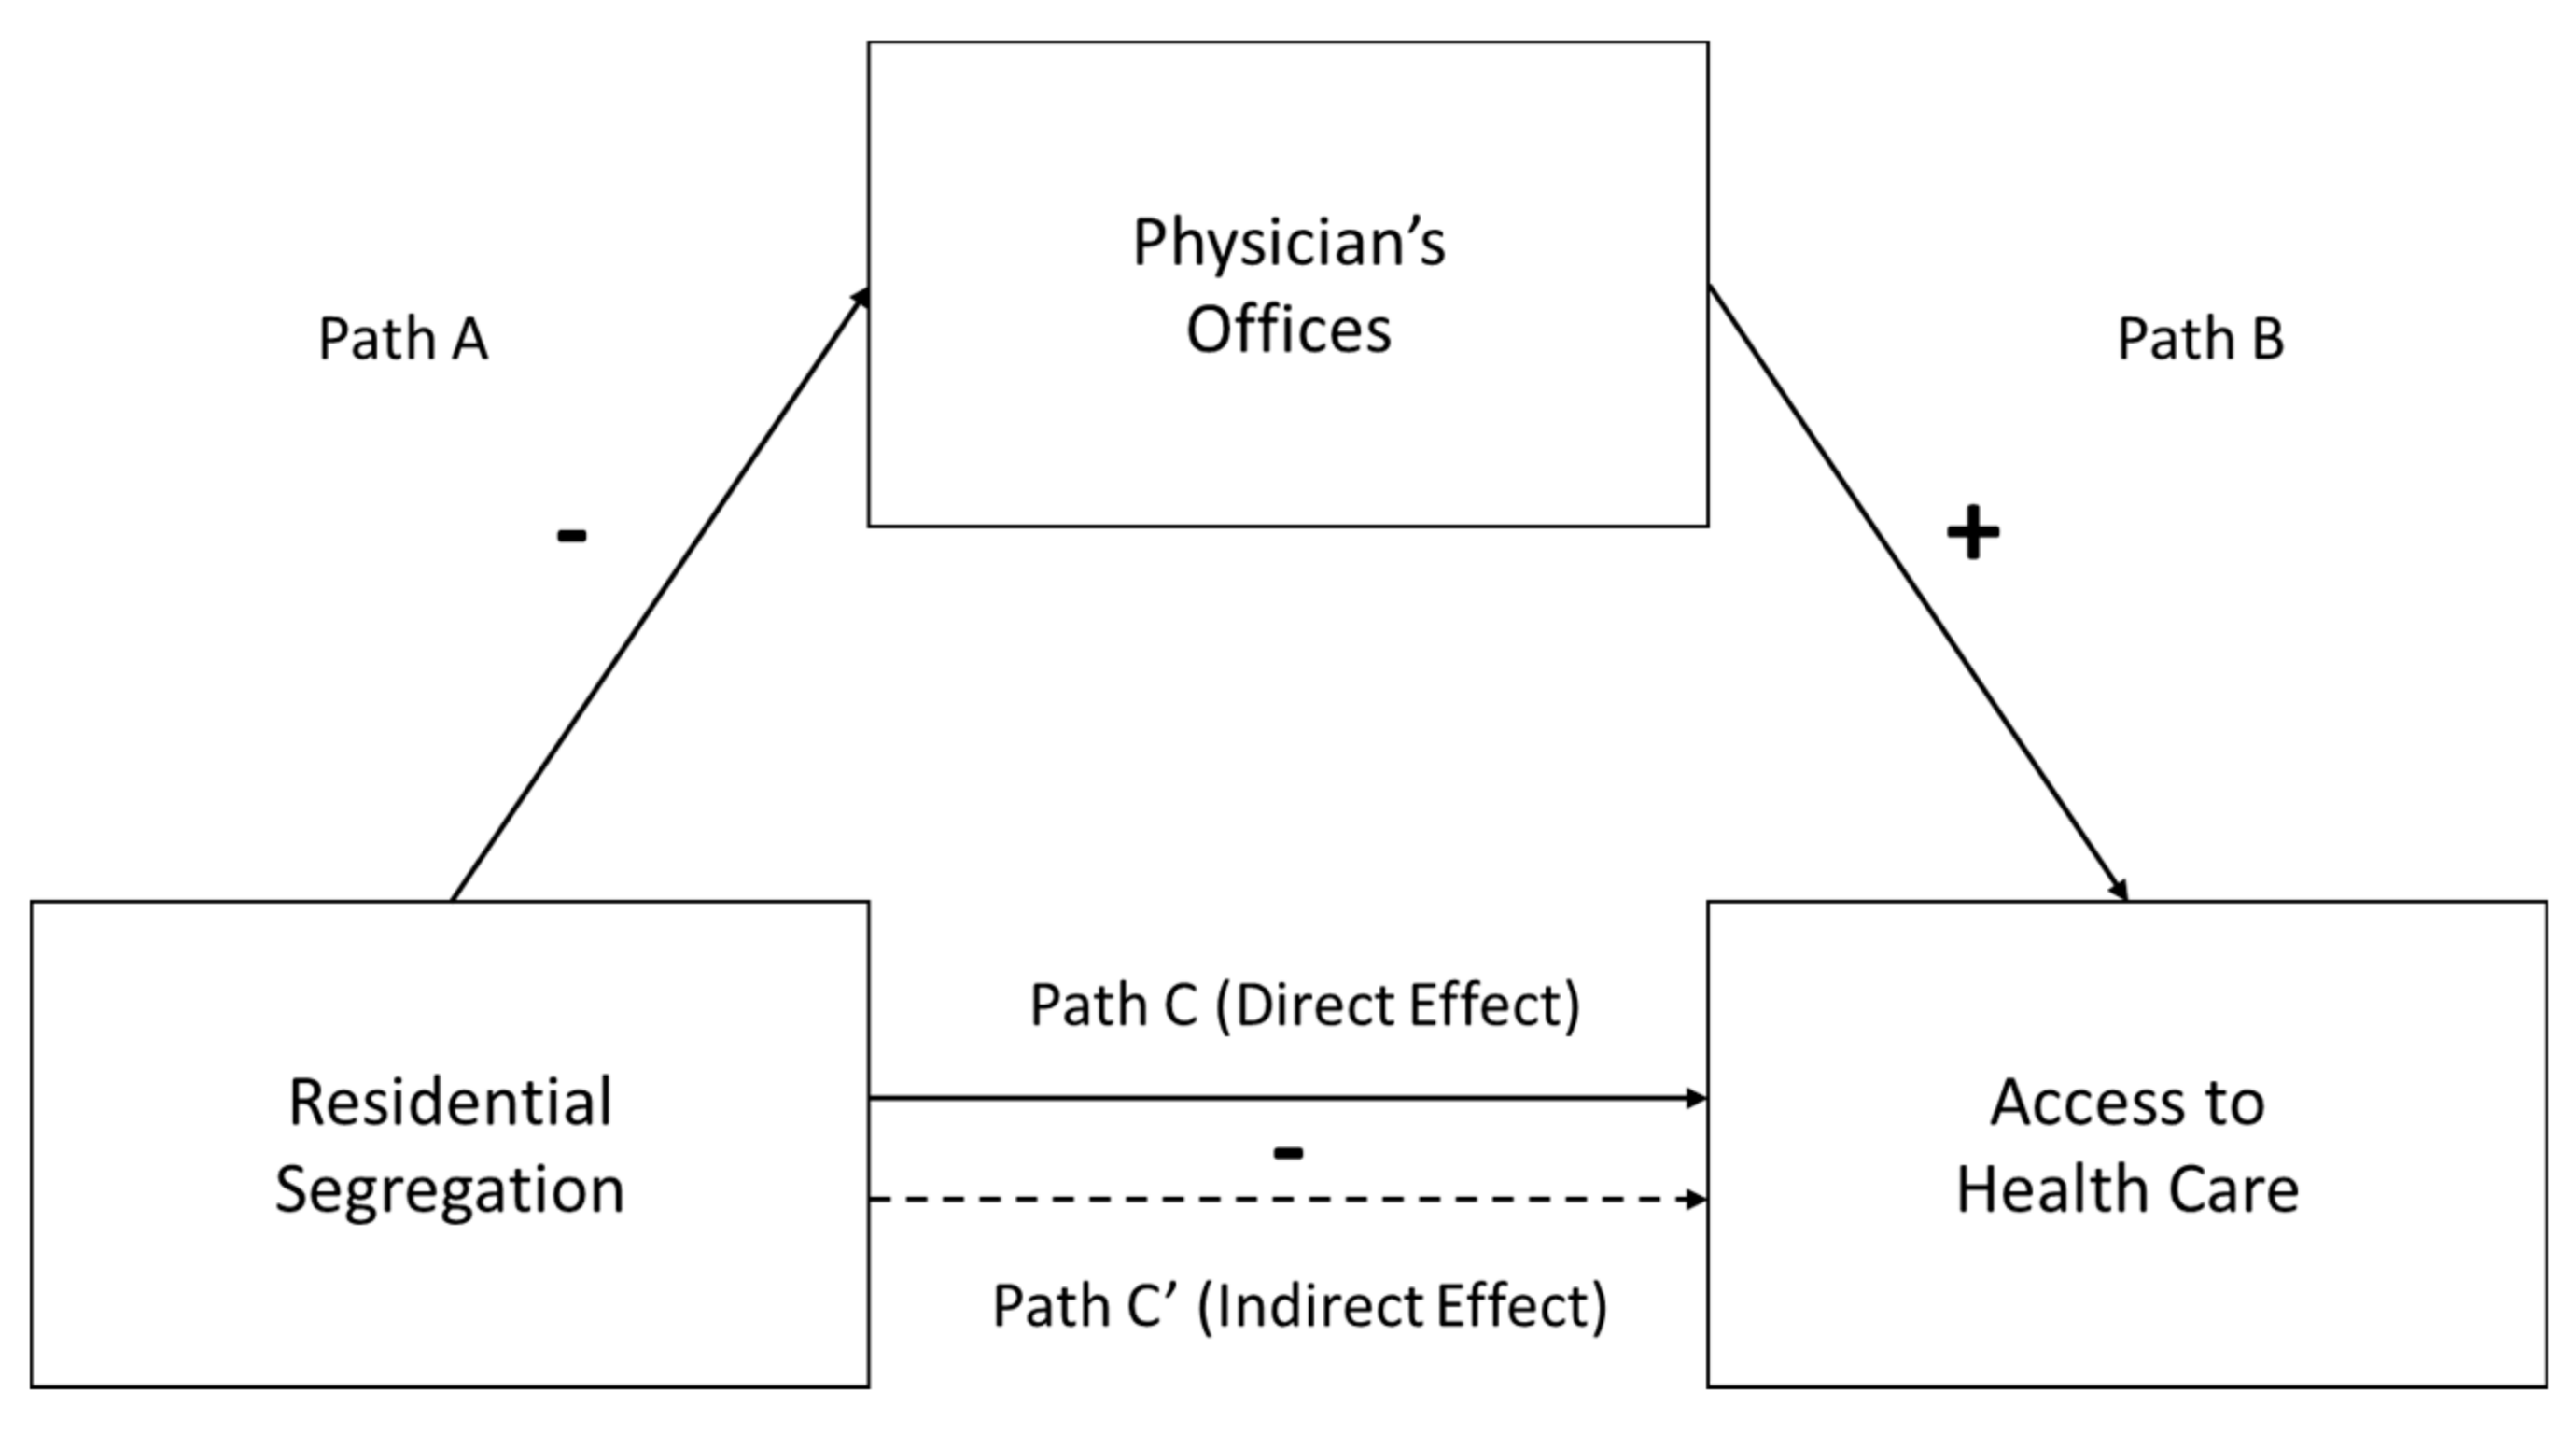
2.2. Conceptual Framework and Hypotheses

In order to build on this extant work, in this study, I examine two dimensions of access to health care using Houston, Texas as a case city of this process. Specifically, I examine whether or not segregation is related to the distribution of facilities, and in turn, whether or not an individual has access to a personal physician. If so, I further examine their travel time to that facility. Both of these measures are meant to capture some dimension of access to health care and the extent to which accessing needed care may be burdensome to an individual. My conceptual framework is visually displayed in Figure 1. From this graphic, I suggest that the distribution of physician’s offices may mediate the relationship between segregation and access to health care options.
This leads us to several hypotheses. First, I test the first pathway suggested in the figure (Path A), which posits that segregated neighborhoods are less likely to have physician’s offices located in close proximity. From previous work on the distribution of health care facilities, I would expect that this same pattern would hold in the case of Houston. Therefore, I hypothesize the following:
Hypothesis 1 (H1).
Racial/ethnic residential segregation will be related to a lower density of physician’s offices across neighborhood areas.
Next, I would expect that having more facilities in a close proximity would be associated with improved access to health care (Path B). As noted above, in this specific case, I examine two health care access outcomes, which lead to the following two hypotheses:
Hypothesis 2 (H2).
The density of physician’s offices will be related to a greater likelihood of having a personal physician, net of other personal and socio-economic resources.
Hypothesis 3 (H3).
The density of physician’s offices will be related to decreased travel times to physician’s offices (for those that have a physician), net of other personal and socio-economic resources.
Finally, given the arguments on resource distribution found in the Williams and Collins (2001) piece on segregation as a fundamental cause of health care outcomes, I expect there to be a direct relationship between segregation and poor access to health care (Path C), and that this will be partially mediated by the distribution of physician’s offices (Path C’). Therefore, I derive the following three hypotheses:
Hypothesis 4 (H4).
Racial/ethnic residential segregation will be related to a lower likelihood of having a personal physician, net of other personal and socio-economic resources.
Hypothesis 5 (H5).
Racial/ethnic residential segregation will be related to increased travel times to physician’s offices (for those that have a physician), net of other personal and socio-economic resources.
Hypothesis 6 (H6).
The association between racial/ethnic residential segregation and both of these indicators of access to health care will be mediated by the inclusion of the density of physician’s offices.
Overall, I argue that segregation will be linked to a lower density of physician’s offices in close proximity, and that this distribution will help explain differences in access to health care (having a personal physician and travel time to their office) by segregation. In order to test these hypotheses, I use the case of Houston and detail these methodological considerations here.

3. Data and Methods

3.1. Data

To test the hypotheses discussed above, I combine several sources of data. For individual-level data on access to health care, I use the 2010 Health of Houston Survey, which is a sample survey conducted by the University of Texas School of Public Health. They conducted the survey by phone, mail, and online using an address-based sampling method throughout the 2010–2011 academic year. They had an overall response rate of 28.9%. The questionnaire was also provided in three languages: English, Spanish, and Vietnamese, depending on the language needs of the interviewee. Addresses were sampled from Harris County, Texas, which is the primary county that makes up the Houston urban area and encompasses the entire City of Houston. The objective of the survey was to the document population health patterns in the Houston area in order to better understand and address them from a public health perspective.
Furthermore, in order to examine the contextual effects on individual-level access to health care, I combine this survey with three data sources from the U.S. Census, including the 2010 County Business Patterns, the 2010 decennial U.S. Census, and the 2008–2012 American Community Survey (ACS). These are all measured at the Zipcode Tabulation Area (ZCTA)-level. The County Business Patterns data includes counts of establishments by zip code, which are aggregated from Internal Revenue Service (IRS) tax records on business establishments. Using this data source, I can examine the distribution of health care providers across the Harris County area. Furthermore, I use the 2010 U.S. Census for basic demographic data, including the percentages of racial/ethnic groups across ZCTAs. Finally, I use the 2008–2012 ACS in order to examine other important area-level socio-economic variables, as these are not captured in the full decennial Census. I use an aggregation of five ACS years (2008–2012, where 2010 is the midpoint), as the data are not representative or released for small geographical units for just one year of data.
The Health of Houston survey geographically organizes their data into 28 neighborhood areas, which are aggregations of several zip codes that are named identifiable parts of the city based on local knowledge of the area. The data are meant to be representative at the neighborhood area-level. Each neighborhood area is made up of some number of zip codes ranging from two to nine, with most being composed of about four–five zip codes. Typically, there are more zip codes per neighborhood area in the city center, as these zip codes tend to be smaller in area. The Health of Houston Survey provides a geographic identifier and a crosswalk, and I merged and normalized these four sources using this identifier in ESRI’s ArcMap.

3.2. Dependent Variables

In order to address the research questions and test the conceptual pathway discussed above, I conducted three sets of analyses with three dependent variables. The first analysis is an area-level analysis examining whether or not segregation is indeed associated with the distribution of health care resources. Specifically, I look at the case of physician’s offices. This area-level dependent variable comes from the 2010 County Business Patterns. The variable reflects a count of all of the physician’s offices per 10,000 people and comes from the North American Industry Classification System (NAICS) code 621111 (offices of physicians). I normalized the variable in this fashion in order to account for population dynamics, as we might expect that areas that are more highly populated would have a greater number of physicians. This is also used as one of the main substantive independent variables in the second and third portions of this study.
The second two sets of analyses address two indicators of access to health care, and these are both measured at the individual-level. The first addresses whether or not the respondent has a personal physician. The question was specifically worded as, “Do you have one person you think of as your personal doctor or health care provider?” and gives the response options of “yes,” “more than one,” and “no.” I combined the response options of “yes” and “more than one” to create a dichotomous variable to reflect whether the respondent has a personal physician or not (1 = at least one personal physician, 0 = else).
The third dependent variable reflects the travel time to their physician’s office for those who expressed that they have access to a personal physician. This question is specifically worded as, “How long does it take you to get to the place you usually go to when you are sick or need advice about your health?” This was originally coded as a categorical variable with six response options, namely: less than 15 min, 15–30 min, 31–60 min, 61–90 min, 91–120 min, and more than 120 min. I recoded these using the midpoints of each of these ranges (and top-coding it at 120 min) in order to convert it into a continuous variable to facilitate a formal mediation test between segregation, the distribution of facilities, and the travel time to facilities. Thus, this variable reflects the travel time to the respondent’s physician’s office, with responses coded as 7.5, 22.5, 45, 75, 105, and 120 min.

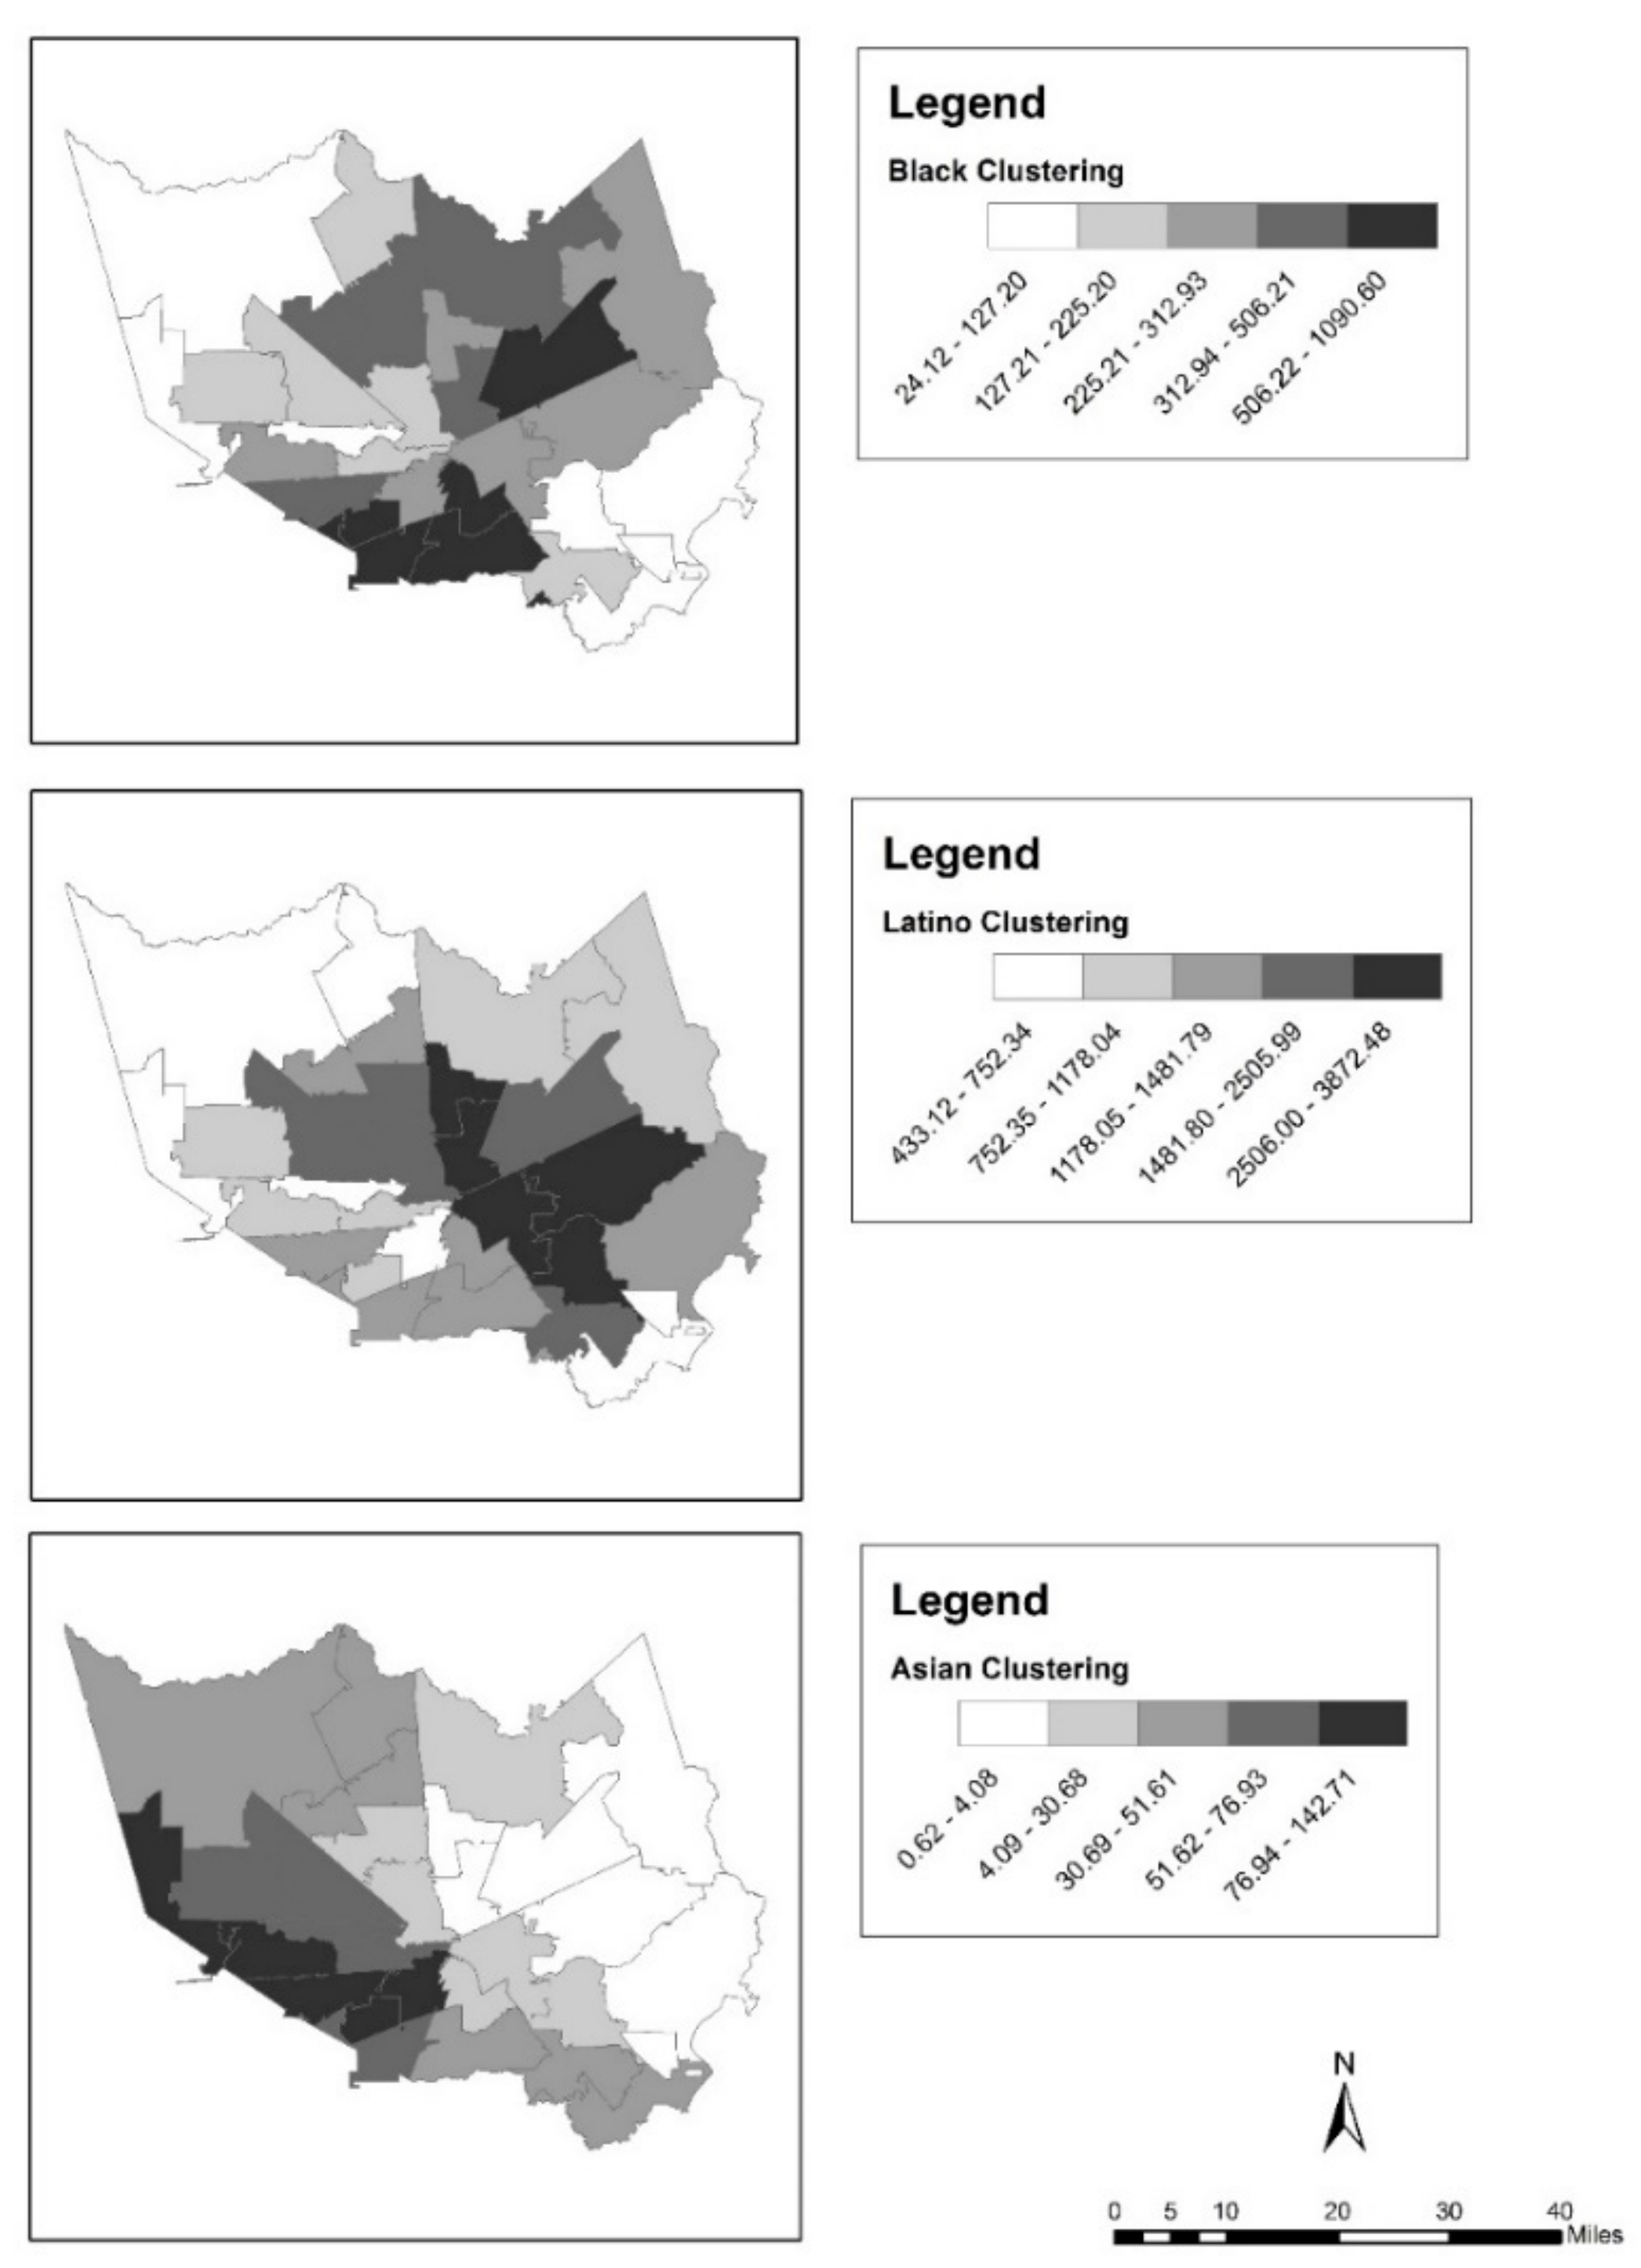
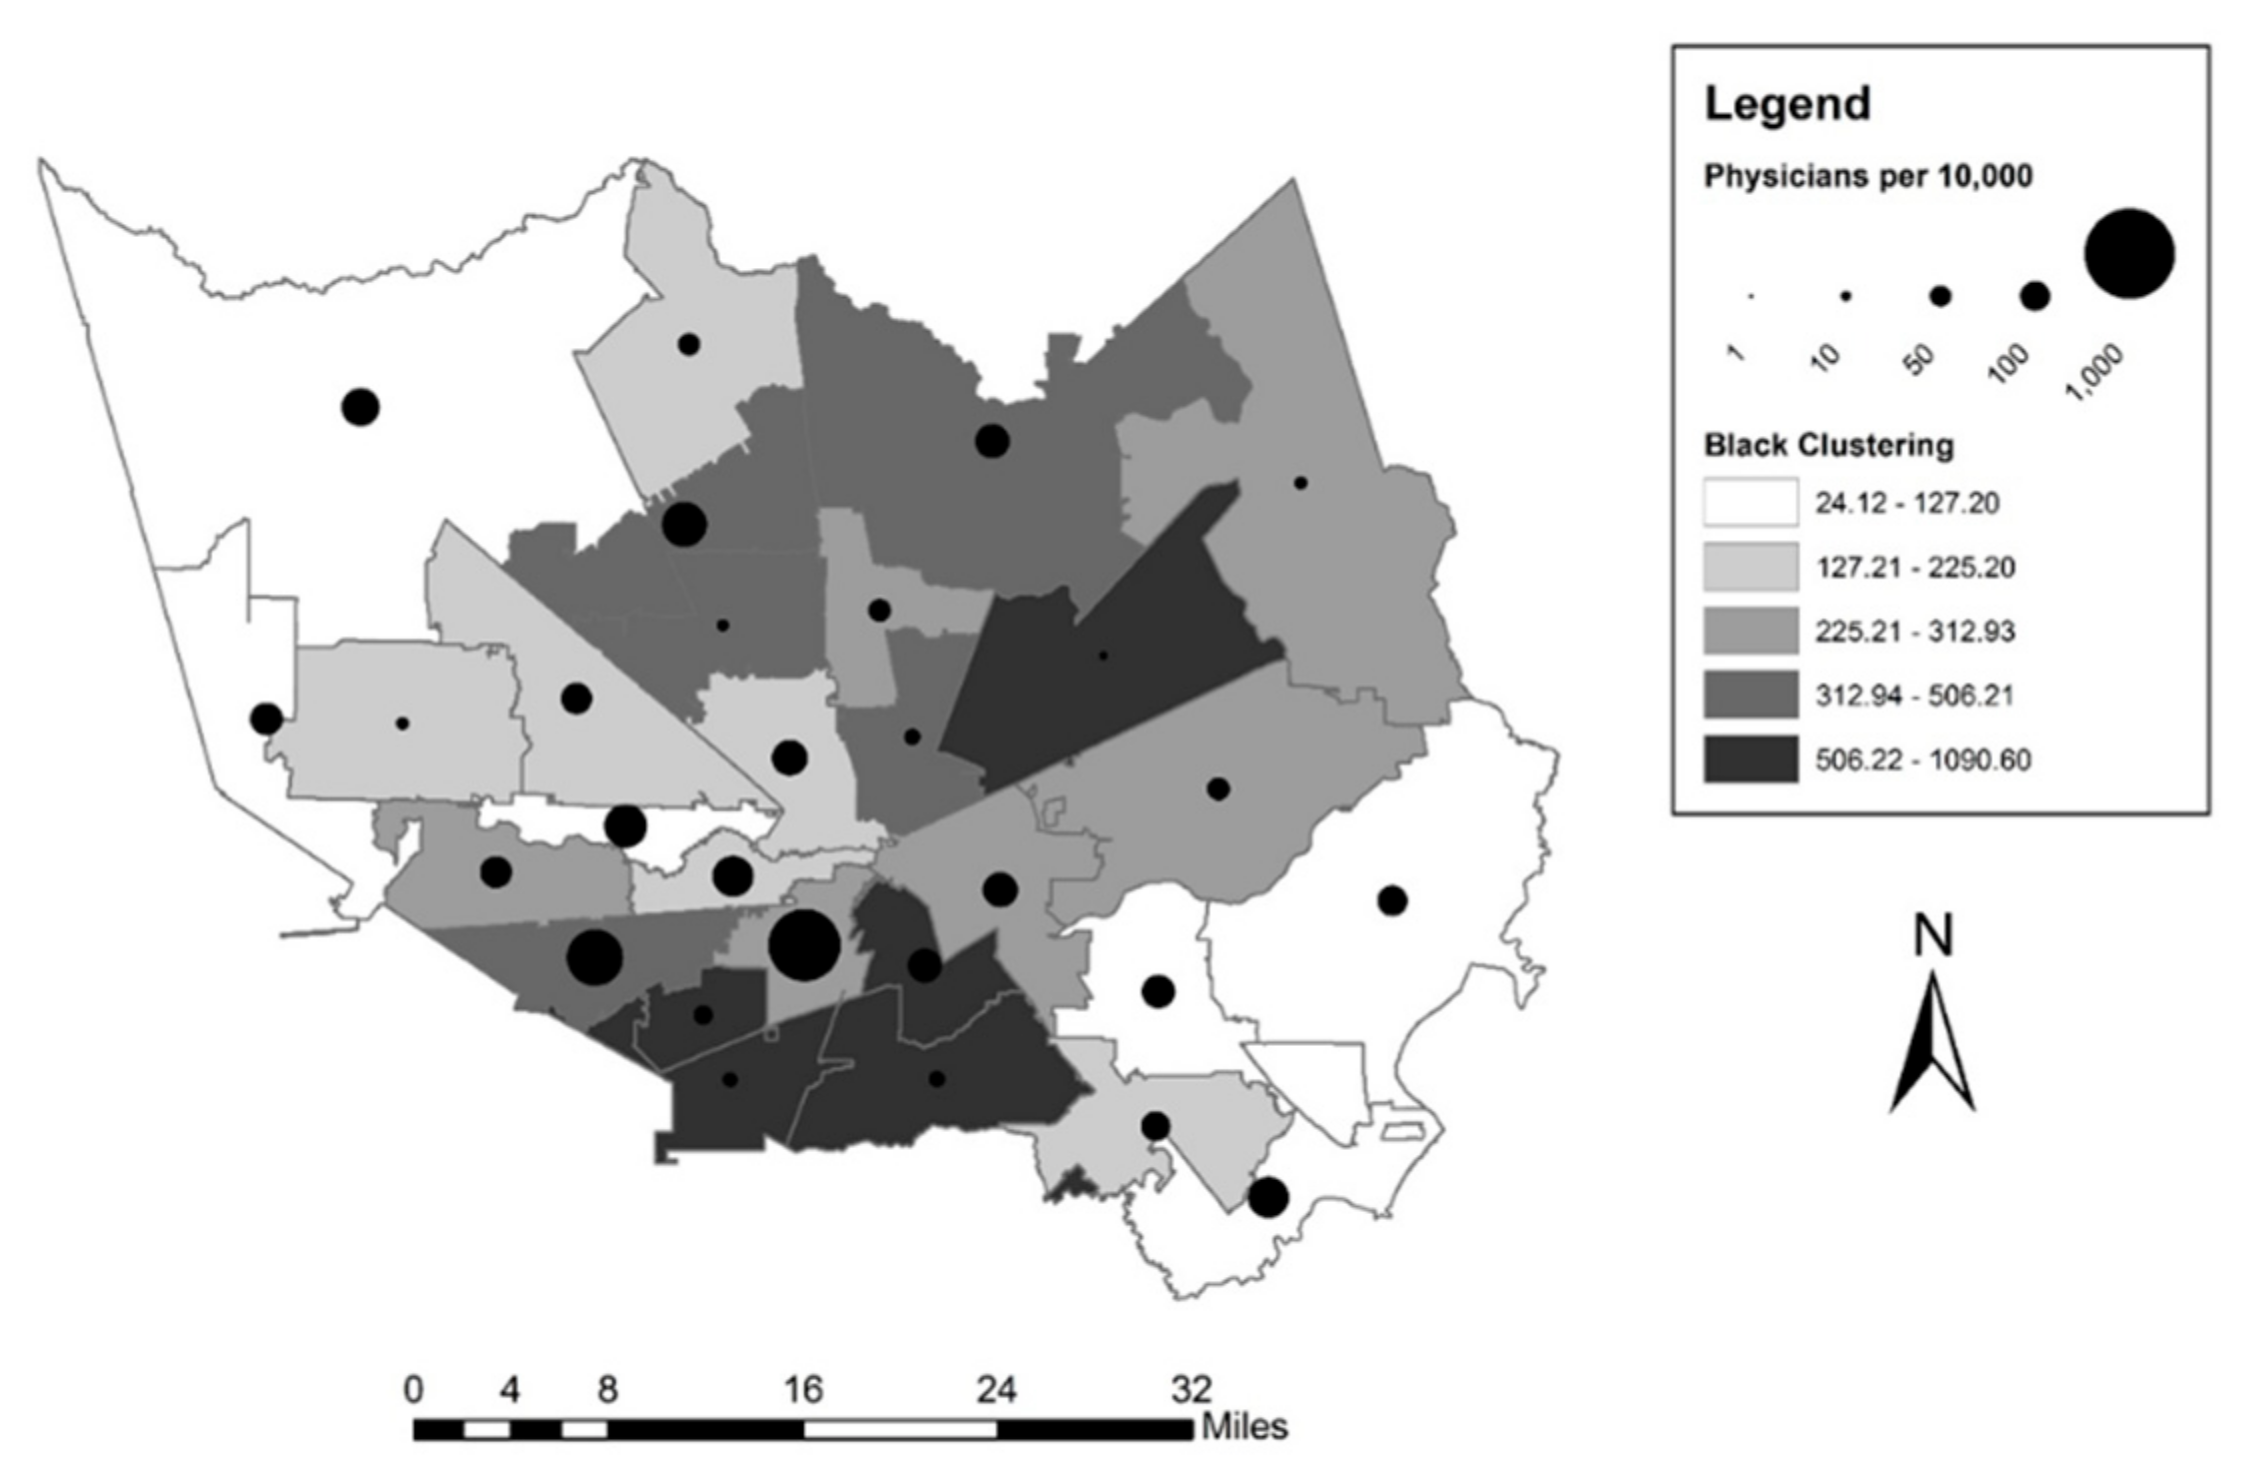
3.3. Independent Variables

For each of the three parts of the study, as discussed above, I include a series of both area-level and individual-level independent variables. The main substantive variables that I use across all three of the analyses are three measures of racial/ethnic residential segregation for the three largest racial/ethnic minority groups (both in the U.S. and in the city of Houston in particular). These are measures derived from the percent of each group respectively, but which also takes into account the relative clustering of that group in space as well. Segregation scholars have long noted that there are multiple dimensions of segregation, and this clustering coefficient is geographically-informed and accounts for both the concentration and clustering of minority groups in space (Anderson 2017b; Massey and Denton 1988). The formula for the clustering statistic for the neighborhood area i is as follows:
C i = x i j = 1 ,   j i n w i j x j
where xi is the variable for feature i, xj is the variable for feature j, and wij is the spatial weight between features i and j. The formula reflects the product of the percent of that particular group and the spatial weight (using a queen contiguity spatial weight matrix) of that variable based on the neighborhood areas which are physically adjacent. Therefore, a neighborhood with a high score on this metric would have both a high percentage of that group within the neighborhood, as well as be surrounded by neighborhoods that also have a high percentage of that group. This provides a way to code for which areas at a geographically small unit of analysis within a city are more highly segregated, as opposed to traditional segregation indices (such as dissimilarity or isolation), which are best measured at a much larger geographical unit (such as the city, county, or metropolitan area). From this formula, I include three measures: Black clustering, Latino clustering (of any race), and Asian clustering. In order to gain a sense of what these variables look like across the Houston area and the extent and patterning of segregation, I present each in a series of three maps, in Figure 2, showing a five-part quantile map of the Houston area with each of these three scores. Houston is a relatively highly segregated city. In the aggregate, Houston has dissimilarity scores of 60.61, 52.51, and 48.71 (from the 2010 U.S. Census) for Blacks, Latinos, and Asians respectively. This degree of segregation can be clearly seen across these three maps, where Black, Latino, and Asian sections of the city are demarcated.
Additionally, in the first part of the analysis, I include three area-level co-variates in order to control for factors that could account for the effect of segregation on the distribution of physician’s offices. These variables are each measured at the neighborhood-level and are as follows: percent in poverty, percent foreign born, and percent aged 65 and above. I include these in order to account for the populations that may be more likely to require health care (individuals living in poverty and the elderly), and to account for the dynamics relevant to the patterns of urban segregation (poverty and immigration).
In the second and third portions of the analysis, I also account for a number of individual-level demographic and socio-economic considerations, which all come from items in the Health of Houston Survey. Age (in years), education (in years of schooling), and percent of federal poverty line (FPL) are all treated as continuous variables. Gender (1 = female, 0 = else), marital status (1 = married, 0 = else), employment status (1 = unemployed, 0 = else), Spanish language (1 = primary Spanish speaking household, 0 = else), and whether or not the household has regular access to a car (1 = car access, 0 = else) are all coded as binary variables. Race is re-coded as a set of dummy variables with non-Latino White (1 = White, 0 = else), non-Latino Black (1 = Black, 0 = else), Latino of any race (1 = Latino, 0 = else), non-Latino Asian (1 = Asian, 0 = else), and non-Latino other (1 = other racial group, 0 = else), with Whites as the reference group. I also control for whether or not the respondent has health insurance with another set of dummy variables, which include no insurance, private insurance, and public insurance, with no insurance serving as the reference group. All of the individual-level independent variables have been group mean centered for the ease of interpretation. The descriptive statistics for all of the variables at both the area and individual-level can be found in Table 1.

3.4. Methods

As mentioned above, the analysis proceeds in three stages, and the method used for each portion reflects the unit of analysis and coding of the dependent variable. For the first analysis, which is exclusively conducted at the area-level, I estimate a series of spatial error models using a queen contiguity spatial weight matrix. The spatial error model was found to be the most appropriate from a series of LaGrange Multiplier tests to test for spatial autocorrelation given the spatially contiguous nature of the units of analysis. The models also use robust standard errors in order to account for significant heteroscedasticity from a Breusch-Pagan test. I estimate two sets of models, one with just the three racial/ethnic clustering measures to examine the gross effects of segregation, and one with the other area-level independent control variables included in order to examine the net effects of segregation after accounting for potentially important covariates. These results can be found in Table 2.
Next, for the second portion of the analysis which examines whether or not the respondent has a personal physician, I estimate a series of binary multilevel logistic regression models as the dependent variable is coded dichotomously. In this analysis, I estimate three models aimed at examining the other portions of the mediation pathway: one with just the segregation measures at the area-level (Path C), one with just physician’s offices per 10,000 (Path B), and another with both sets of variables (Path C’). Each of these models also includes all of the individual-level covariates discussed above. These results can be found in Table 3. For the third portion of the analysis, I estimate a similar set of three models, but for the third dependent variable—travel time to the physician. As this outcome is continuous, I estimate the same three sets of models, but using a series of hierarchical linear regression models. These results can be found in Table 4. As this dependent variable is continuous (and produces significant results as shown below), I also estimate a formal mediation model to examine the extent to which the distribution of physicians can mediate the relationship between residential segregation and travel time to the physician’s office. I estimated these models using a multilevel mediation test with bootstrapping in order to derive standard errors for formal significance tests. These results can be found in Table 5.

4. Results

In the first part of this analysis testing the first conceptual pathway (Path A), I examine the distribution of physician’s offices across neighborhood areas by segregation. See Table 2 for these results. In both the gross and net effects for segregation, I have found that Black concentration and clustering is related to a lower density of physician’s offices. Specifically, every 100 point increase in the Black segregation score (which has an observed range of 1066.48), is related to 1.1 fewer physician’s offices per 10,000 people in a neighborhood area. This is a sizable effect. Notably, though, only the variables for Black clustering and the population aged 65 and above are significant in either of these models. This implies that Latino and Asian segregated areas do not lack a supply of physician’s offices compared to their White counterparts, at least in the case of Houston. The results for Black segregation are also visually displayed in a map, in Figure 3. The map displays a proportional dot for the number of physician’s offices (a larger dot represents a larger number of physicians) over a quantile map of the Black clustering coefficient. From this map, this pattern becomes clearer—highly segregated Black areas have fewer physicians in their neighborhood area.
Next, I test whether or not this distribution is linked to access to health care for the residents of these areas, and the extent to which it may mediate the relationship between segregation and access to health care. First, I examine the results for having a personal physician, which can be found in Table 3. From these results, it appears as though both segregation and the distribution of physicians have little to do with one’s likelihood of having a personal physician. Only Latino segregation is related (negatively) to having a personal physician, meaning that living in a neighborhood with a high concentration and clustering of Latino residents is associated with a lower likelihood of having a personal physician, net of other personal and socio-economic factors. However, this association is not explained away by the distribution of physicians. When including the variable for the distribution of physicians per 10,000 people alone (Path B), it is not significantly associated with having a personal physician, and in the full model (Path C’), it does not account for the relationship between Latino segregation and having a personal physician. Thus, for this particular health care outcome, having a personal physician is only related to Latino segregation and is not accounted for by the distribution of physicians. Indeed, it appears as though this outcome has more to do with personal resources, as the two variables for having health insurance (private or public versus none) are the strongest coefficients in the model.
I further examine another health care access outcome, travel time to the physician’s office, for those who have access to a personal physician, and here, I find a somewhat different pattern. These results can be found in Table 4. The first set of results (Path C) demonstrates that Black clustering is positively related to the travel times to their physician’s office, meaning that living in a more highly segregated Black area is linked to a longer travel time to their physician’s office. Specifically, every 100 unit increase in the Black clustering coefficient (out of the observed range of 1066.48) leads to a 0.4 minute increase in travel time to their physician’s office. Moreover, the distribution of physicians seems to play a role here, which is in keeping with the area-level results for Black segregation. Analyzing the distribution of the physician’s offices alone (Path B), this coefficient is significant and negative, indicating that having a greater density of physician’s offices in a neighborhood area is related to lower travel times for those residents. In particular, each additional physician’s office per 10,000 people in an area, leads to a 0.156 decrease in travel time (in minutes). While this number may seem small on this scale, this translates to about a minute and half less travel time for each additional ten offices, or about fifteen minutes less travel time for each additional 100 offices per 10,000 people.
Furthermore, when examining the full model (Path C’), it is clear that this distribution partially mediates the relationship between segregation and travel time to one’s physician’s office. When including both of these in the model, the size of both of their effects is reduced, including the size of the Black clustering measure, by about 25%. After accounting for the distribution of physician’s offices, the effect of Black segregation is reduced to 0.003, or about 0.3 min for each 100 unit increase in segregation. I also formally tested this in a mediation model using bootstrapped standard errors (for just Black clustering as this was the only significant segregation coefficient in the full model), and these results can be found in Table 5. From these figures, the direct effect is reduced to non-significance, and 32.1% of the relationship between Black segregation and the travel time to the physician’s office is mediated by the distribution of physician’s offices. Thus, this provides some evidence of a mediation effect of the location of physician’s offices, at least in the case of Black segregation.

5. Discussion and Conclusions

The goal of this study is to examine the relationship between racial/ethnic residential segregation and access to health care and examine the role of the locations of physician’s offices in this process. Previous work has demonstrated that minority communities lack a wide variety of health care facilities, yet little is known about the potential consequences of this unequal distribution on health and access to health care for the minority residents of these communities. This work posits that the distribution of facilities can serve as a potential mediator between segregation and poor access to health care.
In this study presented here, I conduct an analysis in three parts and examine two main indicators of access to health care. First, in an area-level analysis, I find that Black segregation is linked to a lower density of physician’s offices, although these results do not hold for other groups, such as Latinos and Asians. This provides partial support for Hypothesis 1, and the first pathway in the conceptual model proposed above (Path A). This result is in keeping with some of the previous literature on segregation and health care facilities, which has broadly found that Black segregated communities are less likely to have a number of different kinds of health care facilities (Anderson 2017a, 2017b; Gaskin et al. 2012; Hayanga et al. 2009). However, much of this previous work has also found this association for Latino segregation, at least in the gross effects, although the effect in some cases has been explained away by area-level socio-economic factors (Anderson 2017a, 2017b; Dinwiddie et al. 2013). In the case of Houston, though, using this data source, this result only seems to apply to Black segregation.
Next, examining two different indicators of access to health care (having a personal physician and travel time to their physician’s office), I test the relationship between segregation and these two facets of health care access. For having a personal physician, only Latino segregation was significantly associated with the outcome, but this was not accounted for with the inclusion of the distribution of physician’s offices. Indeed, the variable for physician’s offices is not significantly related to having a personal physician, regardless of its connection to segregation. This result does not support Hypothesis 2 and the second pathway in the conceptual model (Path B) for this health care outcome. The result provides partial support for Hypothesis 4 for Latino segregation (Path C), although this does not support the mediation model, as outlined above (Path C’), as the distribution of facilities does not mediate the relationship between segregation and having a personal physician for Latino segregation. Given the variables included here, it is not clear what is driving this association, as other mediators are not considered. However, this finding is in keeping with a metropolitan-level analysis, which found that Latino segregation is related to a lower likelihood of having a personal physician for Latino residents (Anderson and Fullerton 2014).
For the second health care outcome, travel time to the office for those who have a personal physician, the results are more affirming of the proposed hypotheses. I find that Black segregation is positively linked to travel times, meaning that residents of Black segregated areas are having to travel further to receive care. This provides partial support for Hypothesis 5 (for Black segregation), and the primary pathway of the conceptual model (Path C). Moreover, the density of physician’s offices is negatively related to the outcome, or rather, that people who have more physician’s offices in close proximity have shorter travel times to arrive at their place of care. This provides support for Hypothesis 3, and Path B in the conceptual model. Finally, in both an informal evaluation of the regression results and the formal mediation model, the results suggest that the distribution of facilities partially mediates the relationship between Black segregation and travel times (about 32%). This provides partial support for Hypothesis 6. That it does not fully mediate the relationship between segregation and travel times is not surprising. Theoretical work on segregation as a fundamental cause of poor access to health care would suggest that the issue is multifactorial and there may be multiple mechanisms at play (Williams and Collins 2001). Thus, the distribution of facilities does not provide us with a silver bullet explanation, but it does appear to account for some portion of this relationship. Moreover, this only seems to apply to the case of Black segregation and not to other groups.
Moreover, this study provides us with several advances over the current state of this literature. This study moves beyond the majority of the literature on segregation and health care now, to examine a set of indicators of access to health care, and to conduct a mediation test between them. Most of the related studies have only examined the distribution of facilities and not how they relate to access to health care (Anderson 2017b; Gaskin et al. 2012). While I do not find evidence of a mediation effect for having a personal physician, the results point to the importance of the local provision of health care providers for travel times to see the physician. This implies that residents of Black segregated areas are facing a greater burden of reaching needed care, even if they have a personal physician. This may be particularly accentuated if the individual has travel difficulties or poor access to public transportation. Future work should consider whether or not this burden leads to a lower likelihood of utilizing these services, or poorer health outcomes as a result.
This analysis is of course not without its limitations. The most obvious limitation is that the study area is confined to the Houston area. While I would argue that Houston makes for a good case study of these processes, as noted in the introduction, the results can only be truly generalizable to this area. However, given the more detailed nature of the study, it would be difficult to replicate on a large scale. More studies in a wider variety of locales are needed in order to build this argument. Another limitation is that the data are only cross-sectional in nature. Although the study takes some steps forward in terms of testing the distribution of facilities as a mediator, longitudinal data at both the area-level (in terms of patterns of segregation and the distribution of facilities) and the individual-level (in terms of access to health care) would provide a more compelling case and causal evidence about the nature of this association. With the data provided here, I can only make correlational claims. Moreover, in order to further develop our understanding of these relationships, more detailed health care utilization data would be appropriate. These questions here merely ask the respondent if they have a personal physician and how long approximately it takes to get there. However, having more detailed data on where and what type of facility the respondent is using for their health care needs would advance this research. Similarly, future work should consider more robust measures on health care outcomes, such as the quality, treatment, and appropriateness of care that an individual receives at these facilities.
In conclusion, this study provides some evidence that the distribution of health care facilities is consequential for residents of minority segregated areas. Previous work has found that racial/ethnic segregated areas lack a wide variety of establishments and social services, and that health care is no exception. Here, I find that Black segregation is correlated with a lack of physician’s offices, and that this unequal distribution of facilities leads to longer travel times to the physician’s office for these residents (although they are not less likely to have a personal physician). This provides further evidence of the ill effects of racial/ethnic residential segregation and our society’s inaction on desegregation, especially so many years following the 1968 Fair Housing Act, which made housing discrimination illegal. As fundamental cause theory would suggest, in order to truly combat these effects from a public policy and public health perspective, we would need to dismantle the structural forces maintaining segregation. However, from a practical standpoint, as the mediation results suggest here, we could begin to chip away at this problem by providing a more equitable distribution of community resources, such as physician’s offices.

Funding

This research received no external funding.

Acknowledgments

The author would like to thank the University of Texas Health Science Center at Houston (UTHealth) School of Public Health for the use of their data set and anonymous reviewers for their helpful comments on earlier drafts of this manuscript.

Conflicts of Interest

The author declares no conflict of interest.

References

  1. Algert, Susan J., Aditya Agrawal, and Douglas S. Lewis. 2006. Disparities in Access to Fresh Produce in Low-Income Neighborhoods in Los Angeles. American Journal of Preventive Medicine 30: 365–70. [Google Scholar] [CrossRef] [PubMed]
  2. Allard, Scott W. 2009. Out of Reach: Place, Poverty, and the New American Welfare State. New Haven: Yale University Press. [Google Scholar]
  3. Allard, Scott W., Daniel Rosen, and Richard M. Tolman. 2003a. Access to Mental Health and Substance Abuse Services among Women Receiving Welfare in Detroit. Urban Affairs Review 38: 787–807. [Google Scholar] [CrossRef]
  4. Allard, Scott W., Richard M. Tolman, and Daniel Rosen. 2003b. Proximity to service providers and service utilization among welfare recipients: The interaction of place and race. Journal of Policy Analysis and Management 22: 599–613. [Google Scholar] [CrossRef] [PubMed]
  5. Anderson, Kathryn Freeman. 2016. Residential Segregation and Health Outcomes in the United States: Moving Beyond Black and White. Population Review 55: 45–74. [Google Scholar] [CrossRef]
  6. Anderson, Kathryn Freeman. 2017a. Racial Residential Segregation and the Distribution of Auxiliary Health Care Practitioners across Urban Space. Research in the Sociology of Health Care 35: 145–67. [Google Scholar]
  7. Anderson, Kathryn Freeman. 2017b. Racial Residential Segregation and the Distribution of Health-Related Organizations in Urban Neighborhoods. Social Problems 64: 256–76. [Google Scholar] [CrossRef]
  8. Anderson, Kathryn Freeman, and Andrew S. Fullerton. 2012. Racial Residential Segregation and Access to Health-Care Coverage: A Multilevel Analysis. Research in the Sociology of Health Care 30: 133–58. [Google Scholar]
  9. Anderson, Kathryn Freeman, and Andrew S. Fullerton. 2014. Residential Segregation, Health, and Health Care: Answering the Latino Question. Race and Social Problems 6: 262–79. [Google Scholar] [CrossRef]
  10. Beaulac, Julie, Elizabeth Kristjansson, and Steven Cummins. 2009. A Systematic Review of Food Deserts 1966–2007. Preventing Chronic Disease 6: 10. [Google Scholar]
  11. Black, Jennifer L., James Macinko, L. Beth Dixon, and George E. Fryer. 2010. Neighborhoods and obesity in New York City. Health & Place 16: 489–99. [Google Scholar]
  12. Blitstein, Jonathan L., Jeremy Snider, and W. Douglas Evans. 2012. Perceptions of the food shopping environment are associated with greater consumption of fruits and vegetables. Public Health Nutrition 15: 1124–29. [Google Scholar] [CrossRef] [PubMed]
  13. Bower, Kelly M., Roland J. Thorpe Jr., Charles Rohde, and Darrell J. Gaskin. 2014. The intersection of neighborhood racial segregation, poverty, and urbanicity and its impact on food store availability in the United States. Preventive Medicine 58: 33–39. [Google Scholar] [CrossRef] [PubMed] [Green Version]
  14. Chan, K. S., D. J. Gaskin, G. Y. Dinwiddie, and R. McCleary. 2012. Do Diabetic Patients Living in Racially Segregated Neighborhoods Experience Different Access and Quality of Care? Medical Care 50: 692–99. [Google Scholar] [CrossRef] [PubMed]
  15. Charles, Camille Z. 2003. The dynamics of racial residential segregation. Annual Review of Sociology 29: 167–207. [Google Scholar] [CrossRef]
  16. Collins, Chiquita A. 1999. Racism and health: Segregation and causes of death amenable to medical intervention in major US cities. In Socioeconomic Status and Health in Industrial Nations: Psychological, and Biological Pathways. Edited by Nancy E. Adler, Michael Marmot, Bruce S. McEwen and Judith Stewart. New York: The NY Academy of Sciences, pp. 396–98. [Google Scholar]
  17. Collins, Chiquita A., and David R. Williams. 1999. Segregation and mortality: The deadly effects of racism? Sociological Forum 14: 495–523. [Google Scholar] [CrossRef]
  18. Dai, Dajun. 2010. Black residential segregation, disparities in spatial access to health care facilities, and late-stage breast cancer diagnosis in metropolitan Detroit. Health & Place 16: 1038–52. [Google Scholar]
  19. Dinwiddie, Gniesha Y., Darrell J. Gaskin, Kitty S. Chan, Janette Norrington, and Rachel McCleary. 2013. Residential segregation, geographic proximity and type of services used: Evidence for racial/ethnic disparities in mental health. Social Science & Medicine 80: 67–75. [Google Scholar] [Green Version]
  20. Ellen, Ingrid Gould, David M. Cutler, and William Dickens. 2000. Is Segregation Bad for Your Health?: The Case of Low Birth Weight. Brookings-Wharton Papers on Urban Affairs, 203–38. [Google Scholar] [CrossRef]
  21. Estabrooks, Paul A., Rebecca E. Lee, and Nancy C. Gyurcsik. 2003. Resources for physical activity participation: Does availability and accessibility differ by neighborhood socioeconomic status? Annals of Behavioral Medicine 25: 100–4. [Google Scholar] [CrossRef] [PubMed]
  22. Galaskiewicz, Joseph, Olga V. Mayorova, and Beth M. Duckles. 2013. Studying the Roles of Nonprofits, Government, and Business in Providing Activities and Services to Youth in the Phoenix Metropolitan Area. Annals of the American Academy of Political and Social Science 647: 50–82. [Google Scholar] [CrossRef]
  23. Gaskin, Darrell J., Gniesha Y. Dinwiddie, Kitty S. Chan, and Rachael R. McCleary. 2012. Residential Segregation and the Availability of Primary Care Physicians. Health Services Research 47: 2353–76. [Google Scholar] [CrossRef] [PubMed]
  24. Gaskin, Darrell J., Adrian Price, Dwayne T. Brandon, and Thomas A. LaVeist. 2009. Segregation and Disparities in Health Services Use. Medical Care Research and Review 66: 578–89. [Google Scholar] [CrossRef] [PubMed]
  25. Gordon-Larsen, Penny, Melissa C. Nelson, Phil Page, and Barry M. Popkin. 2006. Inequality in the built environment underlies key health disparities in physical activity and obesity. Pediatrics 117: 417–24. [Google Scholar] [CrossRef] [PubMed]
  26. Grady, Sue C. 2006. Racial disparities in low birthweight and the contribution of residential segregation: A multilevel analysis. Social Science & Medicine 63: 3013–29. [Google Scholar]
  27. Hart, Kevin D., Stephen J. Kunitz, Ralph R. Sell, and Dana B. Mukamel. 1998. Metropolitan governance, residential segregation, and mortality among African Americans. American Journal of Public Health 88: 434–38. [Google Scholar] [CrossRef] [PubMed]
  28. Hayanga, Awori J., Heather E. Kaiser, Rakhi Sinha, Sean M. Berenholtz, Marty Makary, and David Chang. 2009. Residential Segregation and Access to Surgical Care by Minority Populations in US Counties. Journal of the American College of Surgeons 208: 1017–22. [Google Scholar] [CrossRef] [PubMed]
  29. Horowitz, Carol R., Kathryn A. Colson, Paul L. Hebert, and Kristie Lancaster. 2004. Barriers to Buying Healthy Foods for People with Diabetes: Evidence of Environmental Disparities. American Journal of Public Health 94: 1549–54. [Google Scholar]
  30. Iceland, John. 2004. Beyond Black and, White-Metropolitan residential segregation in multi-ethnic America. Social Science Research 33: 248–71. [Google Scholar] [CrossRef]
  31. Inagami, Sanae, Deborah A. Cohen, Brian Karl Finch, and Steven M. Asch. 2006. You Are Where You Shop: Grocery Store Locations, Weight, and Neighborhoods. American Journal of Preventive Medicine 31: 10–17. [Google Scholar] [CrossRef] [PubMed]
  32. Jetter, Karen M., and Diana L. Cassady. 2006. The Availability and Cost of Healthier Food Alternatives. American Journal of Preventive Medicine 30: 38–44. [Google Scholar] [CrossRef] [PubMed]
  33. Ko, Michelle, Jack Needleman, Kathryn Pitkin Derose, Miriam J. Laugesen, and Ninez A. Ponce. 2014. Residential Segregation and the Survival of U.S. Urban Public Hospitals. Medical Care Research and Review 71: 243–60. [Google Scholar] [CrossRef] [PubMed]
  34. LeClere, Felicia B., Richard G. Rogers, and Kimberley D. Peters. 1997. Ethnicity and mortality in the United States: Individual and community correlates. Social Forces 76: 169–98. [Google Scholar] [CrossRef]
  35. Lee, Min-Ah. 2009. Neighborhood residential segregation and mental health: A multilevel analysis on Hispanic Americans in Chicago. Social Science & Medicine 68: 1975–84. [Google Scholar]
  36. Lee, Min-Ah, and Kenneth F. Ferraro. 2007. Neighborhood Residential Segregation and Physical Health among Hispanic Americans: Good, Bad, or Benign? Journal of Health and Social Behavior 48: 131–48. [Google Scholar] [CrossRef] [PubMed]
  37. Link, Bruce G., and Jo Phelan. 1995. Social Conditions as Fundamental Causes of Disease. Journal of Health and Social Behavior 35: 80–94. [Google Scholar] [CrossRef]
  38. Marwell, Nicole P., and Aaron Gullickson. 2013. Inequality in the Spatial Allocation of Social Services: Government Contracts to Nonprofit Organizations in New York City. Social Service Review 87: 319–53. [Google Scholar] [CrossRef]
  39. Massey, Douglas S., and Nancy A. Denton. 1988. The Dimensions of Residential Segregation. Social Forces 67: 281–315. [Google Scholar] [CrossRef] [Green Version]
  40. Massey, Douglas S., and Nancy A. Denton. 1993. American Apartheid: Segregation and the Making of the Underclass. Cambridge: Harvard University Press. [Google Scholar]
  41. Massey, Douglas S., Andrew B. Gross, and Kumiko Shibuya. 1994. Migration, Segregation, and the Geographic Concentration of Poverty. American Sociological Review 59: 425–45. [Google Scholar] [CrossRef]
  42. Mayberry Robert M., Fatima Mili, and Elizabeth Ofili. 2000. Racial and ethnic differences in access to medical care. Medical Care Research Review 57: 108–45. [Google Scholar] [CrossRef] [PubMed]
  43. McFarland, Michael, and Cheryl A. Smith. 2011. Segregation, Race, and Infant Well Being. Population Research and Policy Review 30: 467–93. [Google Scholar] [CrossRef]
  44. Moore, Latetia V., Ana V. Diez Roux, Kelly R. Evenson, Aileen P. McGinn, and Shannon J. Brines. 2008. Availability of recreational resources in minority and low socioeconomic status areas. American Journal of Preventive Medicine 34: 16–22. [Google Scholar] [CrossRef] [PubMed]
  45. Moore, Latetia V., and Ana V. Diez Roux. 2006. Associations of Neighborhood Characteristics with the Location and, Type of Food Stores. American Journal of Public Health 96: 325–31. [Google Scholar] [CrossRef] [PubMed]
  46. Morland, Kimberly, Ana V. Diez Roux, and Steve Wing. 2006. Supermarkets, Other Food Stores, and Obesity: The Atherosclerosis Risk in Communities Study. American Journal of Preventive Medicine 30: 333–39. [Google Scholar] [CrossRef] [PubMed]
  47. Morland, Kimberly, Steve Wing, and Ana Diez Roux. 2002a. The Contextual Effect of the Local Food Environment on Residents’ Diets: The Atherosclerosis Risk in Communities Study. American Journal of Public Health 92: 1761–67. [Google Scholar] [CrossRef]
  48. Morland, Kimberly, Steve Wing, Ana Diez Roux, and Charles Poole. 2002b. Neighborhood characteristics associated with the location of food stores and food service places. American Journal of Preventive Medicine 22: 23–29. [Google Scholar] [CrossRef]
  49. Polednak, Anthony P. 1997. Segregation, poverty, and mortality in urban African Americans. New York: Oxford University Press. [Google Scholar]
  50. Powell, Lisa M., Sandy Slater, Donka Mirtcheva, Yanjun Bao, and Frank J. Chaloupka. 2007. Food store availability and neighborhood characteristics in the United States. Preventive Medicine 44: 189–95. [Google Scholar] [CrossRef] [PubMed]
  51. Rodriguez, Rudolph A., Saunak Sen, Kala Mehta, Sandra Moody-Ayers, Peter Bacchetti, and Ann M. O’Hare. 2007. Geography matters: Relationships among urban residential segregation, dialysis facilities, and patient outcomes. Annals of Internal Medicine 146: 493–501. [Google Scholar] [CrossRef] [PubMed]
  52. Small, Mario L., and Monica McDermott. 2006. The presence of organizational resources in poor urban neighborhoods: An analysis of average and contextual effects. Social Forces 84: 1697–724. [Google Scholar] [CrossRef]
  53. Small, Mario Luis, and Laura Stark. 2005. Are poor neighborhoods resource deprived? A case study of childcare centers in New York. Social Science Quarterly 86: 1013–36. [Google Scholar] [CrossRef]
  54. Smiley, Melissa J., Ana V. Diez Roux, Shannon J. Brines, Daniel G. Brown, Kelly R. Evenson, and Daniel A. Rodriguez. 2010. A spatial analysis of health-related resources in three diverse metropolitan areas. Health & Place 16: 885–92. [Google Scholar]
  55. Smith, David Barton, Zhanlian Feng, Mary L. Fennell, Jacqueline S. Zinn, and Vincent Mor. 2007. Separate and unequal: Racial segregation and disparities in quality across U.S. nursing homes. Health Affairs 26: 1794–94. [Google Scholar] [CrossRef] [PubMed]
  56. Subramanian, Subu V., Dolores Acevedo-Garcia, and Theresa L. Osypuk. 2005. Racial residential segregation and geographic heterogeneity in black/white disparity in poor self-rated health in the US: a multilevel statistical analysis. Social Science & Medicine 60: 1667–79. [Google Scholar]
  57. Walker, Renee E., Christopher R. Keane, and Jessica G. Burke. 2010. Disparities and access to healthy food in the United States: A review of food deserts literature. Health & Place 16: 876–84. [Google Scholar]
  58. White, Kellee, Jennifer S. Haas, and David R. Williams. 2012. Elucidating the Role of Place in Health Care Disparities: The Example of Racial/Ethnic Residential Segregation. Health Services Research 47: 1278–99. [Google Scholar] [CrossRef] [PubMed]
  59. Williams, David R., and Chiquita Collins. 2001. Racial residential segregation: A fundamental cause of racial disparities in health. Public Health Reports 116: 404–16. [Google Scholar] [CrossRef]
  60. Wilson, Dawn K., Karen A. Kirtland, Barbara E. Ainsworth, and Cheryl L. Addy. 2004. Socioeconomic status and perceptions of access and safety for physical activity. Annals of Behavioral Medicine 28: 20–28. [Google Scholar] [CrossRef] [PubMed]
  61. Wilson, William J. 1987. The Truly Disadvantaged: The Inner City, the Underclass, and Public Policy. Chicago: University of Chicago Press. [Google Scholar]
  62. Wilson, William J. 1996. When Work Disappears: The World of the New Urban Poor. New York: Knopf, Distributed by Random House, Inc. [Google Scholar]
  63. Zick, Cathleen D., Ken R. Smith, Jessie X. Fan, Barbara B. Brown, Ikuho Yamada, and Lori Kowaleski-Jones. 2009. Running to the Store? The relationship between neighborhood environments and the risk of obesity. Social Science & Medicine 69: 1493–500. [Google Scholar]
Figure 1. Conceptual model of segregation, physician’s offices, and access to health care.
Socsci 07 00119 g001
Figure 2. Map of Black, Latino, and Asian clustering quantiles in Houston’s Harris County.
Socsci 07 00119 g002
Figure 3. Map of distribution of physician’s offices over neighborhood areas by Black clustering quantiles in Houston’s Harris County.
Socsci 07 00119 g003
Table 1. Descriptive statistics for variables used in statistical models.
Variable NameMeanSDRangeDescription
Area Level Variables
Physician’s Offices8.9310.040.53 to 46.52Physician’s offices per 10,000 people
% Black Clustering358.53293.2324.12 to 1090.60Clustering measure of percent Black
% Latino Clustering1588.71981.90433.12 to 3872.48Clustering measure of percent Latino
% Asian Clustering43.8139.370.62 to 142.71Clustering measure of percent Asian
% in Poverty17.388.234.4 to 34.5Percent under the federal poverty line
% Foreign Born23.738.277.52 to 45.29Percent born outside of the U.S.
% Age 65 and Up8.592.354.65 to 16.20Percent aged 65 and above
Individual-Level Dependent Variables
Personal Physician0.770.420 to 11 = At least one physician, 0 = else
Travel Time to Physician21.8416.077.5 to 12Travel time to physician’s office in minutes
Individual-Level Independent Variables
Age10.172.005 to 15Age in categories
Female0.630.480 to 11 = female, 0 = else
Race
  White (ref.)0.400.490 to 11 = White, 0 = else
  Black0.190.390 to 11 = Black, 0 = else
  Latino0.240.430 to 11 = Latino, 0 = else
  Asian0.140.340 to 11 = Asian, 0 = else
  Other0.030.160 to 11 = other racial category, 0 = else
Education14.553.360 to 20Education in years of schooling
Married0.520.500 to 11 = married, 0 = else
Spanish speaking0.090.290 to 11 = Spanish-speaking household, 0 = else
Unemployed0.110.310 to 11 = Spanish-speaking household, 0 = else
% FPL260.30147.230.01 to 500Household income as a percent of the federal poverty line
Car Use0.930.260 to 11 = Regular access to car, 0 = else
Health Insurance
  No Insurance (ref.)0.230.420 to 11 = No health insurance, 0 = else
  Private0.540.500 to 11 = Private health insurance, 0 = else
  Public0.230.420 to 11 = Public health insurance, 0 = else
Notes: Individual-level N = 5116. Area-level N = 28. Data come from the 2010 Health of Houston Survey, the 2010 U.S. Census, the 2008–2012 American Community Survey, and the 2010 County Business Patterns. FPL = federal poverty line.
Table 2. Coefficients and (standard errors) from spatial error models of physicians per 10,000.
Variable NameβSEβSE
Black Clustering−0.011 *(0.004)–0.011 ***(0.003)
Latino Clustering−0.002(0.002)–0.001(0.003)
Asian Clustering0.063(0.050)0.099(0.124)
% in Poverty 0.333(0.236)
% Foreign Born –0.098(0.505)
% Age 65 and Up 2.023 ***(0.323)
Lambda0.193(0.213)–0.346(0.223)
Constant13.600 **(4.802)–9.664 *(4.491)
Pseudo R20.238 0.414
Notes: N = 28. * = p < 0.05, ** = p < 0.01, *** = p < 0.001 (two-tailed). β = Coefficient. SE = Standard error.
Table 3. Odds ratios and (standard errors) from multilevel binary logistic regression models of having a personal physician.
Path CPath BPath C’
Variable NameORSEORSEORSE
Fixed Effects
Individual-Level Variables
Age1.319 ***(0.031)1.320 ***(0.031)1.319 ***(0.031)
Female1.833 ***(0.144)1.828 ***(0.143)1.832 ***(0.144)
Race (reference = White)
  Black0.945(0.114)0.947(0.115)0.944(0.114)
  Latino0.892(0.109)0.888(0.108)0.892(0.109)
  Asian0.858(0.104)0.858(0.104)0.858(0.104)
  Other0.947(0.227)0.948(0.227)0.948(0.227)
Education1.019(0.014)1.019(0.014)1.019(0.014)
Married1.269 **(0.102)1.268 **(0.101)1.286 **(0.101)
Spanish Speaking0.827(0.115)0.825(0.115)0.828(0.115)
Unemployed0.858(0.094)0.853(0.094)0.857(0.094)
% FLP1.000(0.000)1.000(0.000)1.000(0.000)
Car Use1.263(0.183)1.267(0.185)1.263(0.183)
Health Insurance (reference = none)
  Private Insurance5.044 ***(0.515)5.110 ***(0.523)5.048 ***(0.517)
  Public Insurance4.263 ***(0.534)4.317 ***(0.543)4.271 ***(0.535)
Area-Level Variables
Black Clustering0.971(0.000) 0.949(0.000)
Latino Clustering0.824 **(0.000) 0.807 ***(0.000)
Asian Clustering0.936(0.002) 0.955(0.002)
Physicians per 10,000 0.998(0.006)0.991(0.006)
Random Effect
Intercept Variance0.035 0.061 0.030
Level 2 Pseudo R20.419 0.016 0.516
Notes: Level 1 N = 5116. Level 2 N = 28. * = p < 0.05, ** = p < 0.01, *** = p < 0.001 (two-tailed). OR = Odds ratio. SE = Standard error. Because of the scale of the variables, the odds ratios for each of the area-level racial clustering coefficients have been x-standardized using the Level 2 standard deviations. The Level 2 Pseudo R2 is the proportional reduction in the intercept variance from a model with only Level 1 variables to the current model. The intercept variance for the model with only Level 1 variables is 0.062.
Table 4. Coefficients and (standard errors) from hierarchical linear regression models of travel time to physician’s office.
Path CPath BPath C’
Variable NameβSEβSEβSE
Fixed Effects
Individual-Level Variables
Age0.014(0.140)0.015(0.140)0.015(0.140)
Female−0.208(0.474)−0.203(0.474)−0.205(0.474)
Race (reference = White)
  Black2.994 ***(0.704)2.999 ***(0.704)2.999 ***(0.704)
  Latino1.190(0.746)1.186(0.746)1.192(0.746)
  Asian4.009 ***(0.730)4.000 ***(0.730)3.998 ***(0.730)
  Other3.464 *(1.432)3.442 *(1.432)3.442 *(1.433)
Education0.122(0.083)0.122(0.083)0.122(0.083)
Married−0.585(0.482)−0.580(0.482)−0.579(0.482)
Spanish Speaking−0.806(0.965)−0.806(0.965)−0.814(0.966)
Unemployed2.129 **(0.760)2.139 **(0.760)2.134 **(0.760)
% FLP−0.005 **(0.002)−0.005 **(0.002)−0.005 **(0.002)
Car Use−8.790 ***(0.927)−8.791 ***(0.927)−8.787 ***(0.927)
Health Insurance (reference = none)
  Private Insurance−0.602(0.680)−0.603(0.680)−0.602(0.680)
  Public Insurance1.406(0.808)1.408(0.808)1.405(0.808)
Area-Level Variables
Black Clustering0.004 **(0.001) 0.003 **(0.001)
Latino Clustering0.000(0.000) 0.000(0.000)
Asian Clustering−0.012(0.010) −0.003(0.007)
Physicians per 10,000 −0.156 ***(0.031)−0.123 ***(0.029)
Random Effects
Level 1 Error Variance243.215 243.238 243.335
Level 2 Error Variance1.794 1.099 0.371
Level 2 Pseudo R20.525 0.709 0.902
Note: Level 1 N = 4961. Level 2 N = 28. * = p < 0.05, ** = p < 0.01, *** = p < 0.001 (two-tailed). β = Coefficient. SE = Standard error. The Level 2 Pseudo R2 is the proportional reduction in the Level 2 error variance from a model with only Level 1 variables to the current model. The Level 2 error variance for model with only Level 1 variables is 3.773.
Table 5. Coefficients and bootstrapped standard errors of the mediation test between the Black clustering, physician’s offices, and travel time to the physician’s office.
EffectCoefficientSE
Indirect Effect0.0010.001
Direct Effect0.0030.001
Total Effect0.004 *0.002
Proportion of total effect mediated 0.321
Ratio of indirect to direct effect 0.472
Ratio of total to direct effect 1.472
Notes: Level 1 N = 4961. Level 2 N = 28. * = p < 0.05, ** = p < 0.01 *** = p < 0.001 (two-tailed). SE = Standard error.

