1. Introduction
Social capital has become a central concept in understanding how communities mobilize resources, coordinate action, and navigate crises. Long before the term gained widespread traction, scholars recognized that relationships, trust, and civic life shape the social fabric of places and influence collective outcomes (
Hanifan 1916;
Jacobs 1961;
Putnam 1993). In disaster and resilience research specifically, social capital is now widely regarded as a key determinant of how communities prepare for, withstand, and recover from hazards (
Aldrich 2012;
Norris et al. 2008). Recognizing the need for a systematic, policy-relevant measure of these relational capacities,
Kyne and Aldrich (
2020) developed the Social Capital Index (SoCI), the first county-level, publicly available composite index designed explicitly to measure bonding, bridging, and linking social capital in the United States.
The publication of the SoCI represented a significant methodological advance. Drawing on 19 indicators derived from the U.S. Census and related administrative sources,
Kyne and Aldrich (
2020) introduced a transparent and reproducible framework for quantifying social capital at a scale relevant to emergency management, hazard mitigation, and community resilience. Since its release, the SoCI has been widely adopted by researchers, practitioners, and government agencies. Its diffusion across fields, including environmental science, geography, public administration, public health, and sociology, reflects its growing scientific influence and cross-sectoral utility. This pattern parallels the trajectory of other major composite indices, such as the Social Vulnerability Index (SoVI), which achieved broad recognition through scholarly uptake and subsequent methodological refinement (
Cutter et al. 2003).
Now, five years after the SoCI’s introduction, there is a compelling need to revisit and reassess both its conceptual foundations and its empirical diffusion. The theoretical landscape of social capital has continued to evolve, offering clearer distinctions among bonding, bridging, and linking relationships and new insights into their contributions to community outcomes (
Szreter and Woolcock 2004;
Woolcock 1998). At the same time, improvements in publicly available data enable more precise measurement of the demographic, organizational, and institutional components of social capital. The widespread engagement with the SoCI across the academic literature further provides an opportunity to examine how the index has been interpreted, adapted, and applied in diverse research settings.
Building on this motivation, the present study addresses three guiding research questions:
What are the conceptual roots of the Social Capital Index (SoCI)?: This question examines the historical, theoretical, and empirical conversations that shaped understandings of social capital and informed the development of the original index.
How has the SoCI diffused across scholarly and applied communities since 2020?: To address this question, we analyze how the index has traveled through academic and practitioner circles by tracing its citation patterns, co-citation networks, disciplinary pathways, and global uptake.
How can the SoCI be advanced, updated, and methodologically refined?: In pursuing this question, we introduce an expanded SoCI that integrates 2022 data, additional indicators, refined normalization procedures, and an overall strengthened measurement framework.
This study makes three primary contributions. First, it situates the SoCI within the broader conceptual evolution of social capital, clarifying how classical theoretical perspectives and modern multidimensional frameworks converge in its operationalization. Second, it provides the first systematic assessment of the SoCI’s scholarly diffusion, offering insight into how a novel composite index becomes embedded within interdisciplinary research communities. Third, it advances the original methodology by developing an updated and more comprehensive SoCI, expanding the indicator set from 19 to 26 variables and enhancing its analytic capacity for resilience, vulnerability, and community studies. Together, these contributions strengthen the empirical foundations of social capital research and support more nuanced assessments of the relational structures that shape local resilience across the United States.
3. Tracing the Diffusion of the SoCI
Understanding how the Social Capital Index (SoCI) has circulated through scholarly and applied communities is essential for evaluating its broader impact and situating the index within the evolving landscape of resilience and social capital research. Since its introduction in 2020, the SoCI has been adopted by researchers across a wide range of disciplines, drawn into studies of vulnerability and climate impacts, integrated into analyses of public health and governance, and applied to questions of planning, infrastructure, and disaster response. Examining these diffusion patterns provides insight into how the index is being used, where it has gained the most traction, and how it has contributed to interdisciplinary conversations about social structure and community resilience.
To systematically assess this diffusion, we employ three complementary approaches. First, we analyze disciplinary diffusion (
Section 3.1) to identify the fields in which the SoCI has been most widely cited and to understand the breadth of its interdisciplinary reach. Second, we examine annual citation patterns (
Section 3.2), using time-series trends to evaluate the pace and trajectory of scholarly uptake over the first five years since publication. Finally, we conduct a co-citation analysis (
Section 3.3) to map the intellectual context in which the SoCI is situated, identifying the foundational theories, methodological traditions, and research communities with which it is most frequently associated. Together, these analyses illuminate not only how widely the SoCI has diffused but also the conceptual networks and disciplinary communities that shape its interpretation and use. By integrating insights from disciplinary distribution, citation trajectories, and co-citation structures, this section provides a comprehensive portrait of the SoCI’s influence and its role within the broader scholarly ecosystem concerned with social capital, vulnerability, and resilience.
3.1. Disciplinary Diffusion of the Social Capital Index (SoCI)
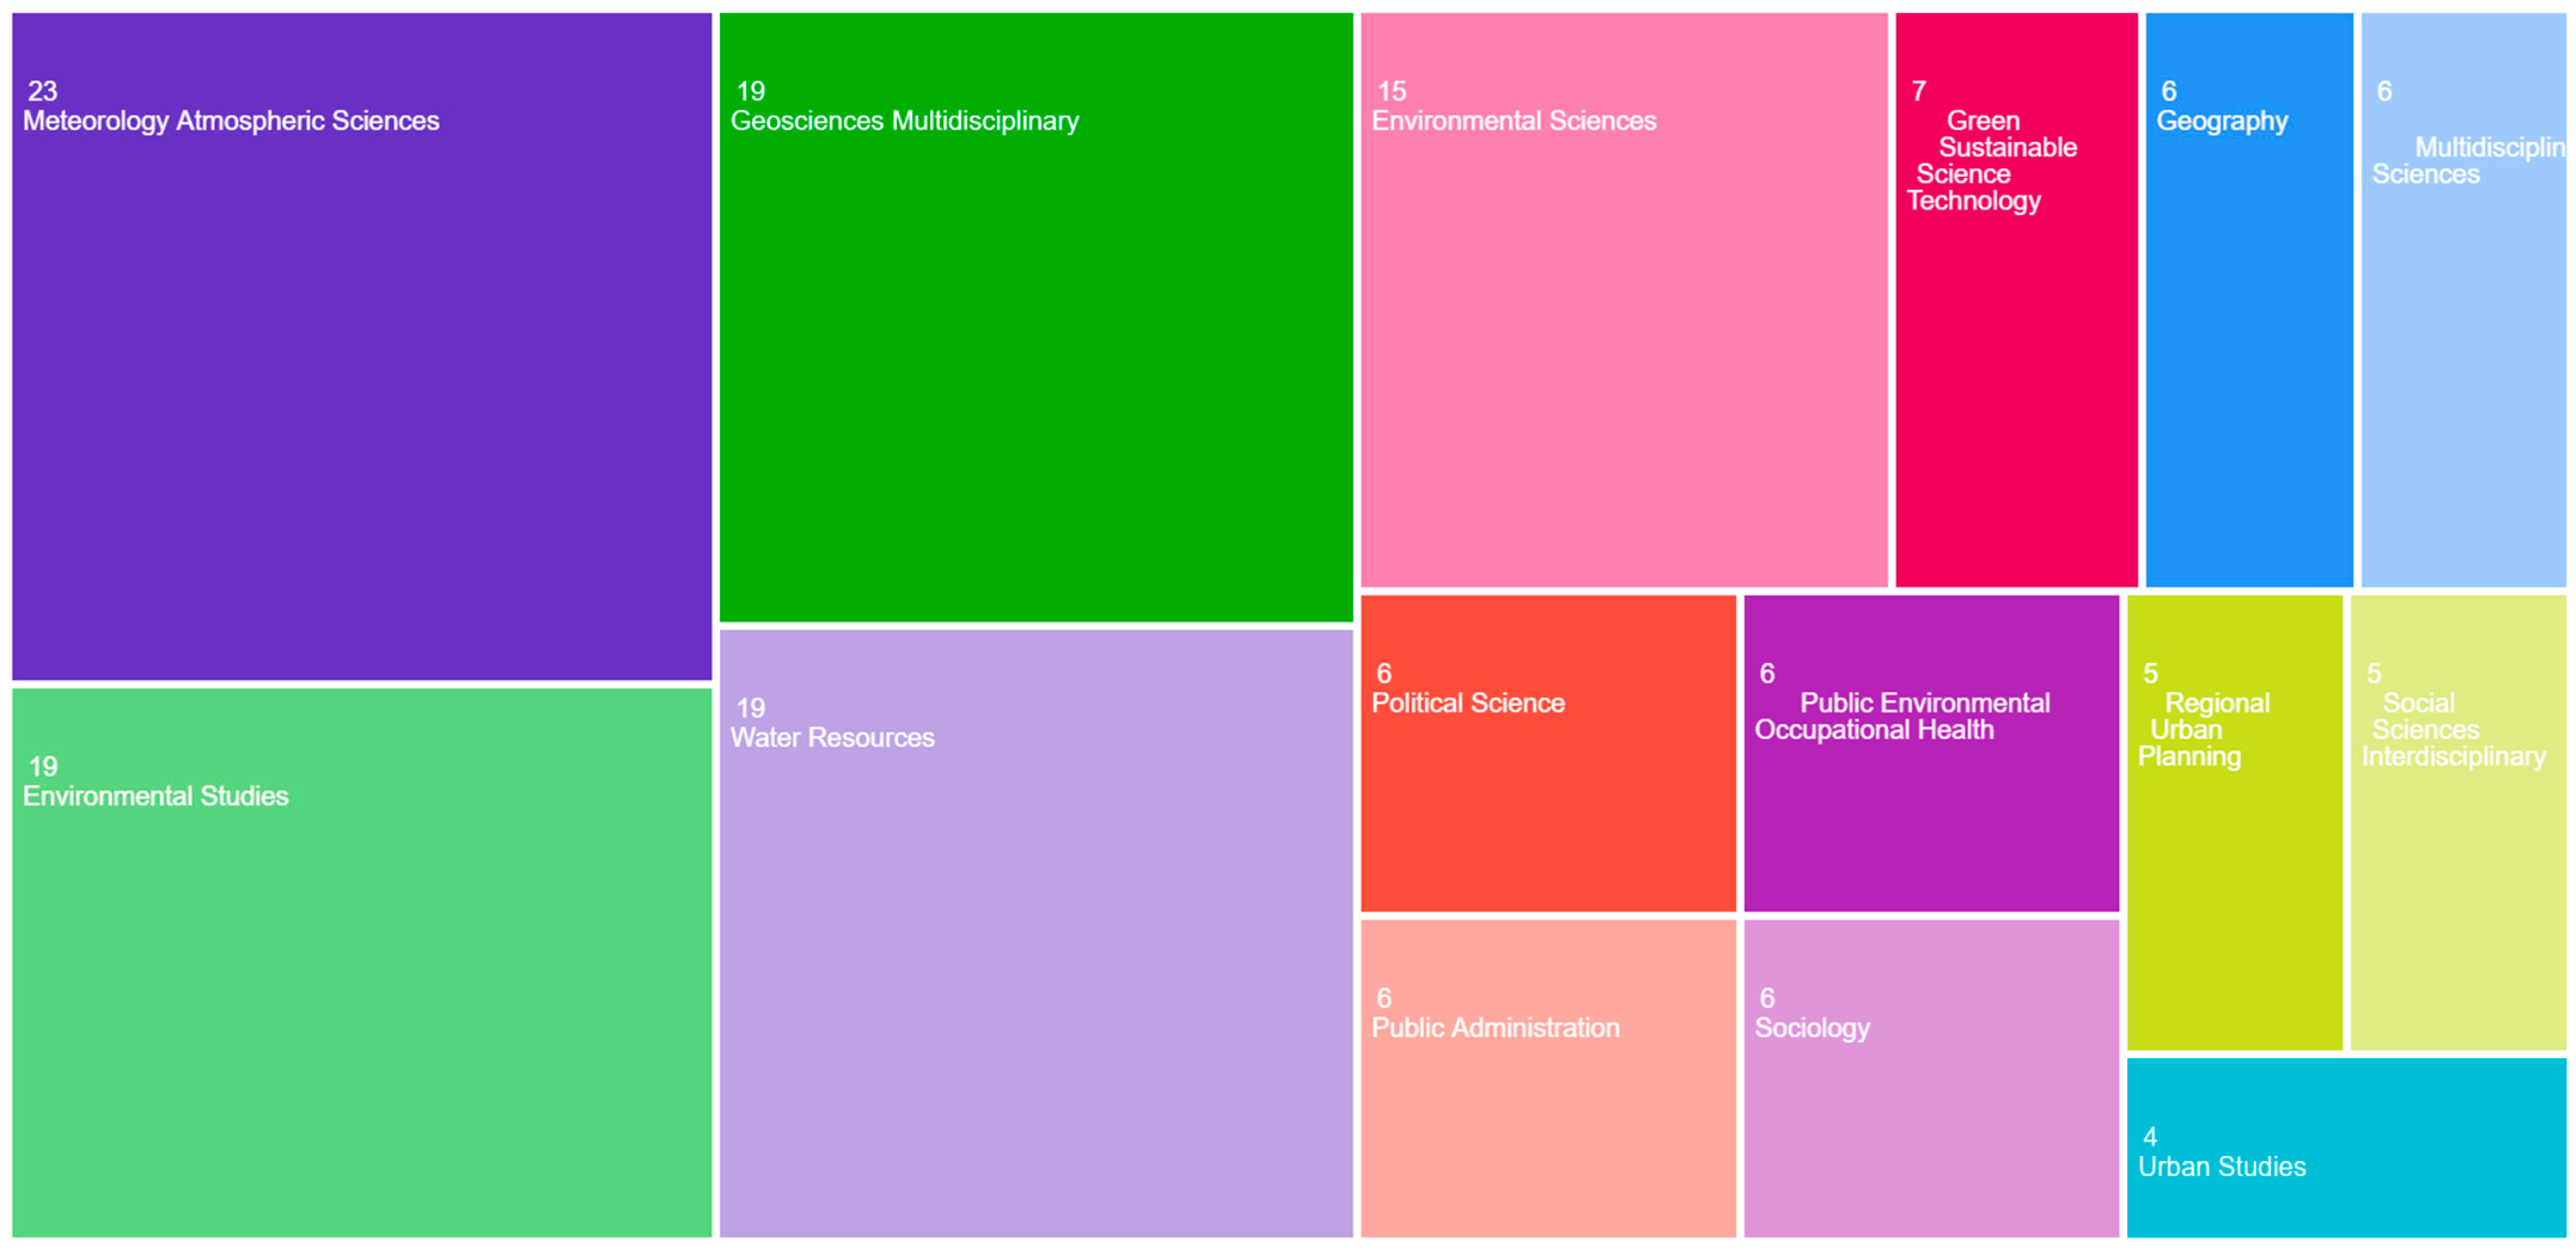
The disciplinary diffusion analysis shows that the Social Capital Index (SoCI) has achieved broad and diverse uptake across the scientific community, with 91 citing publications distributed across more than twenty fields (
Figure 1,
Appendix A,
Table A1) (
Clarivate 2024), and 204 citations recorded by Google Scholar (accessed 15 February 2026). The largest share of citations emerges from meteorology and atmospheric sciences (23 records; 25.3%), demonstrating the index’s strong connection to climate-related hazards, extreme weather events, and atmospheric risk assessments. Closely following are environmental studies (19; 20.9%), geosciences multidisciplinary (19; 20.9%), and water resources (19; 20.9%), reflecting substantial integration of the SoCI into research on hydrological hazards, watershed vulnerability, flood risk, and broader earth system processes.
Additional diffusion within environmental sciences (15; 16.5%) and green and sustainable science and technology (7; 7.7%) indicates that the SoCI is increasingly used to examine sustainability transitions, environmental governance, and the social dimensions of climate adaptation. Together, the environmental and physical science categories represent the majority of early uptake, highlighting the central role of social capital in interdisciplinary hazard and climate research.
At the same time, the SoCI has diffused widely across the social sciences and policy-oriented disciplines. Notably, political science, public administration, public and environmental health, sociology, geography, and multidisciplinary sciences each account for 6 records (6.6%), demonstrating consistent engagement across governance, health equity, community resilience, and spatial social science domains. Fields such as regional and urban planning (5; 5.5%) and social sciences interdisciplinary (5; 5.5%) have also incorporated the SoCI, highlighting its relevance for understanding urban inequalities, spatial vulnerability, and planning for resilience.
The index’s reach extends into additional applied and professional fields, including urban studies (4; 4.4%), business (3; 3.3%), civil engineering (3; 3.3%), and psychology (3; 3.3%), suggesting growing interest in organizational resilience, infrastructure vulnerability, and psychosocial dimensions of community functioning. More specialized areas, such as construction and building technology, development studies, law, management, and operations research, each contribute 2 citations (approximately 2.2%), reflecting emerging but notable engagement. Even traditionally less connected fields such as agronomy and anthropology have begun referencing the SoCI, each with 1 citation (1.1%), indicating nascent but expanding interdisciplinary crossover.
Collectively, these patterns show that the SoCI is not confined to disaster or resilience studies but has instead become a cross-cutting analytical tool adopted across environmental sciences, public policy, health, planning, engineering, and the broader social sciences. The distribution of citations suggests that the index is valued both for its methodological clarity and for its ability to integrate social structure into analyses of risk, vulnerability, and community well-being. This wide-ranging disciplinary diffusion underscores the SoCI’s growing influence and its role as a bridge between environmental processes, social systems, and institutional structures.
3.2. Patterns of Diffusion Reflected in Annual Citations
The citation trajectory of
Kyne and Aldrich (
2020) demonstrates a clear pattern of rising scholarly engagement since the Social Capital Index (SoCI) was first introduced (
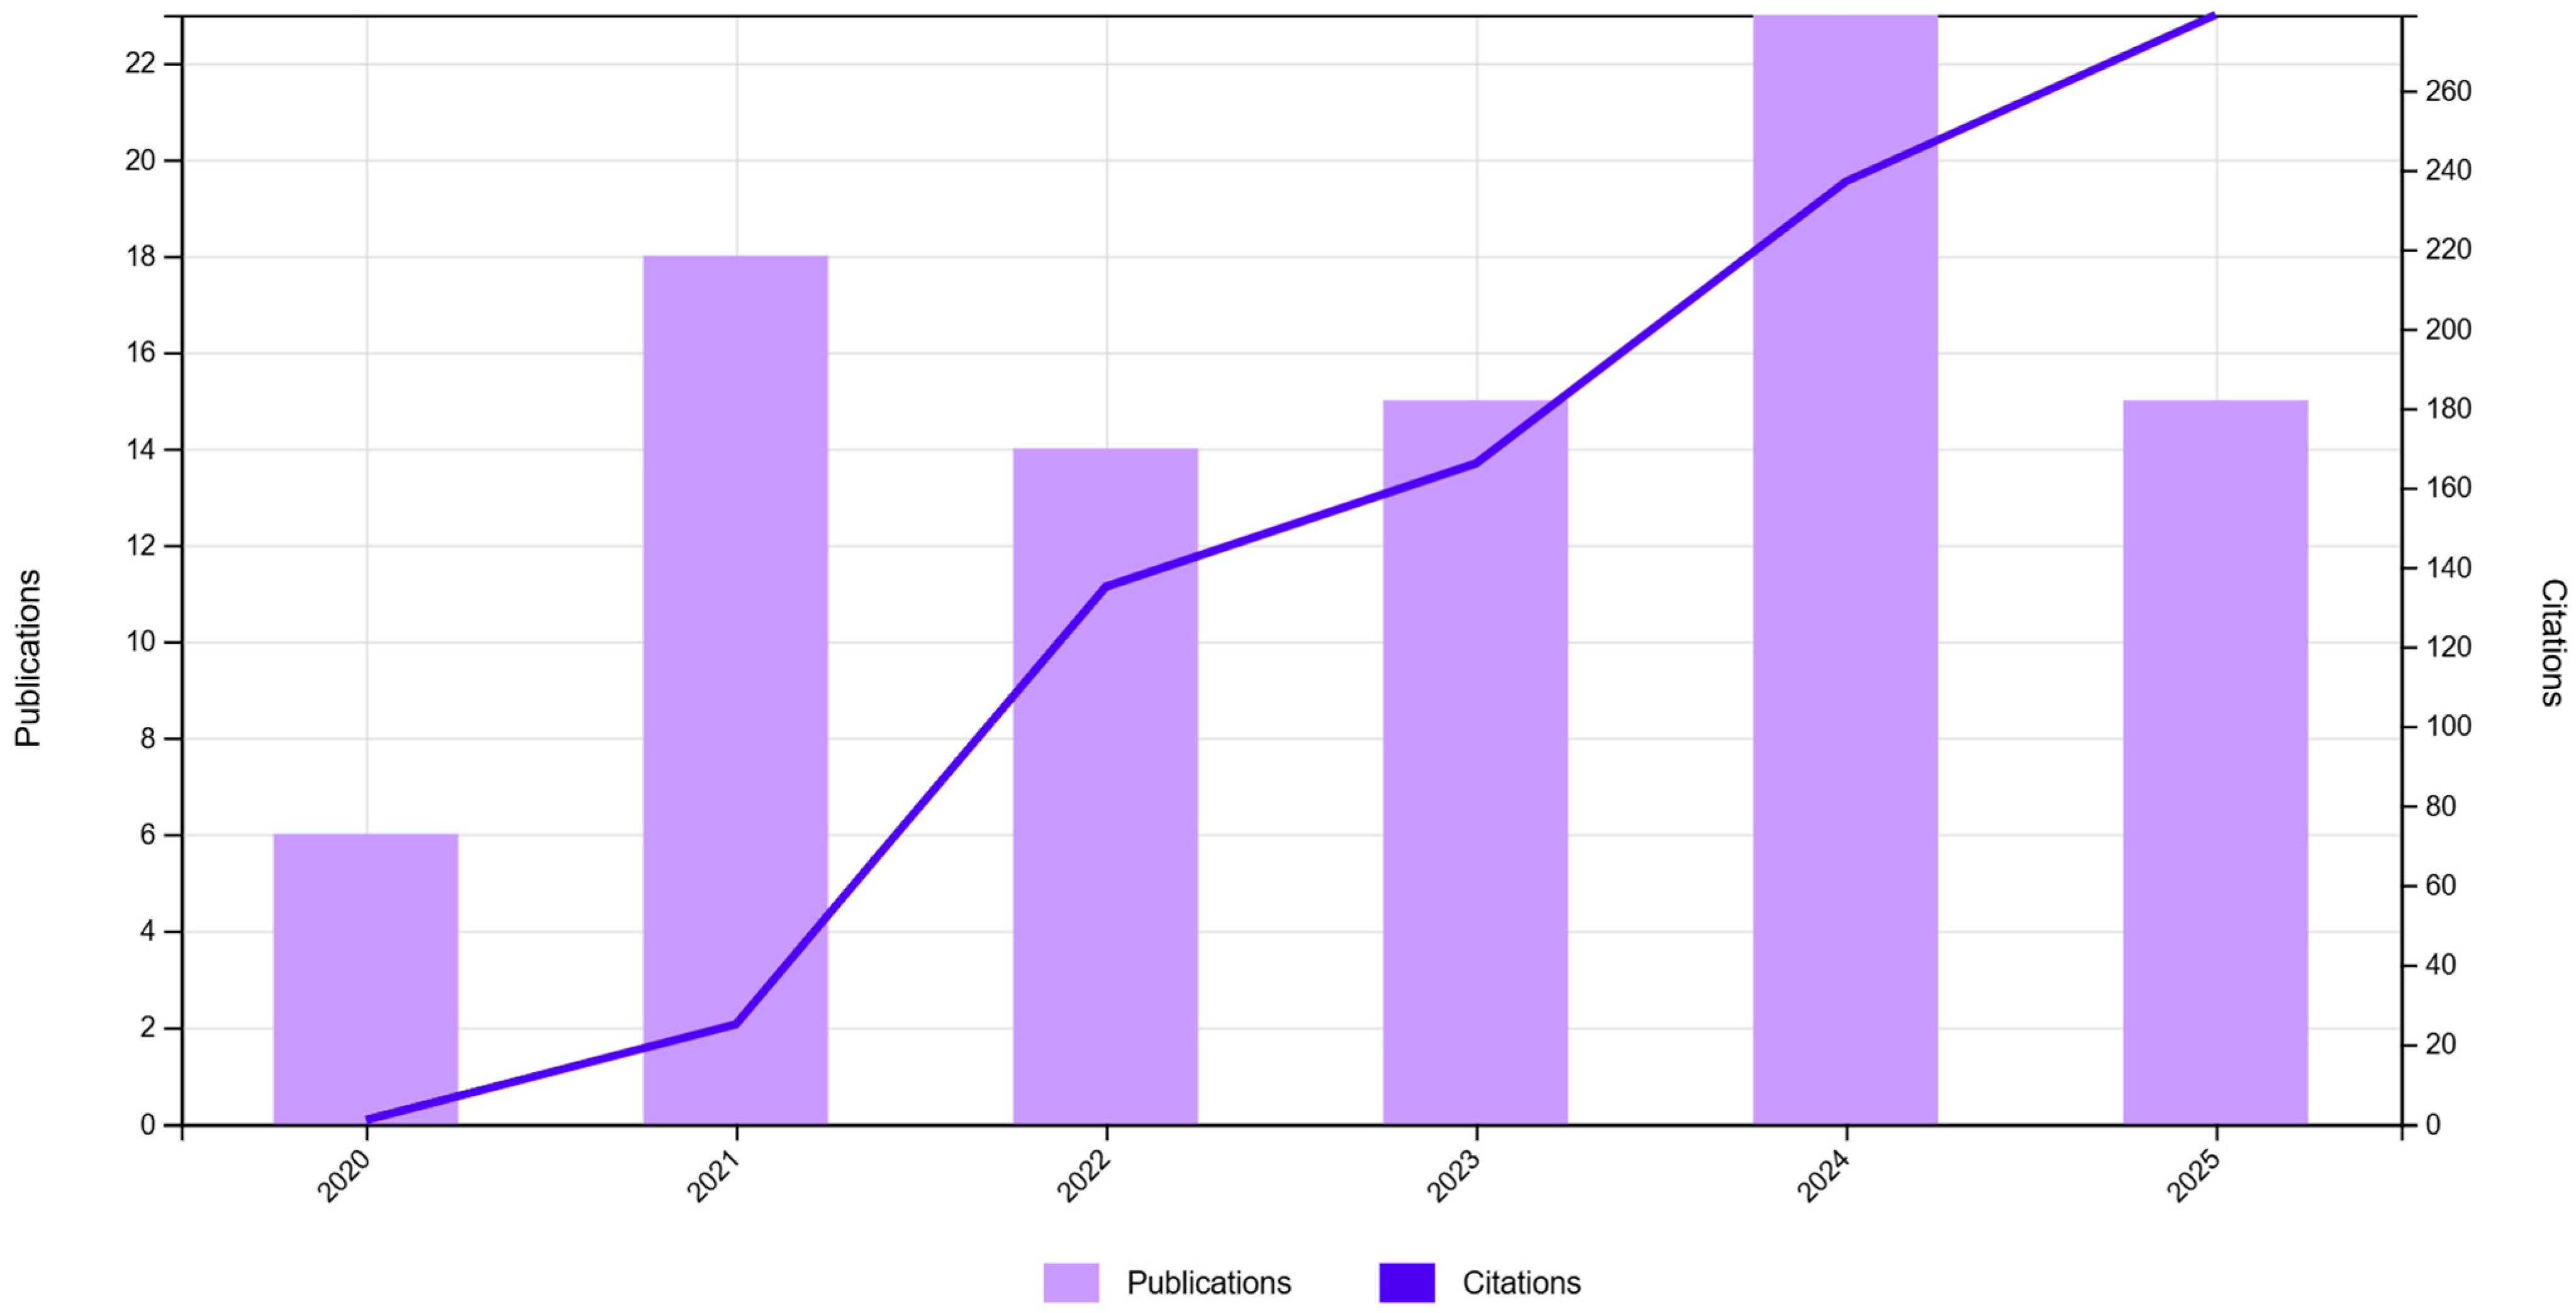
Figure 2). Web of Science records show that publications citing the SoCI increased steadily from 2020 to 2024, beginning with 6 citing documents in its release year and rising to more than 20 by 2024 (
Clarivate 2024). This growth is mirrored in citation counts, which climbed rapidly from near zero in 2020 to well over 250 cumulative citations by 2024, with the upward trend continuing into 2025.
This pattern indicates not only early uptake but also accelerated diffusion as the index gained visibility across research communities. The sharp increases observed in 2022 and 2023 coincide with the expanding use of the SoCI in environmental sciences, public health, urban planning, disaster research, and interdisciplinary social science fields. Citation behavior suggests that the SoCI has become an increasingly influential methodological tool for analyzing relational capacity, vulnerability, and resilience across U.S. counties.
Overall, the time-series pattern reflects both the growing recognition of the index and the broader shift toward quantitative, composite measures of social capital in resilience and hazard research.
3.3. Trajectory of SoCI Diffusion in the Scholarly Literature
Since its publication in 2020, the SoCI article (
Kyne and Aldrich 2020) has experienced a steady and accelerating pattern of scholarly uptake. Web of Science records show 91 citations within the first four years, indicating strong early adoption relative to comparable methodological contributions in disaster and resilience research (
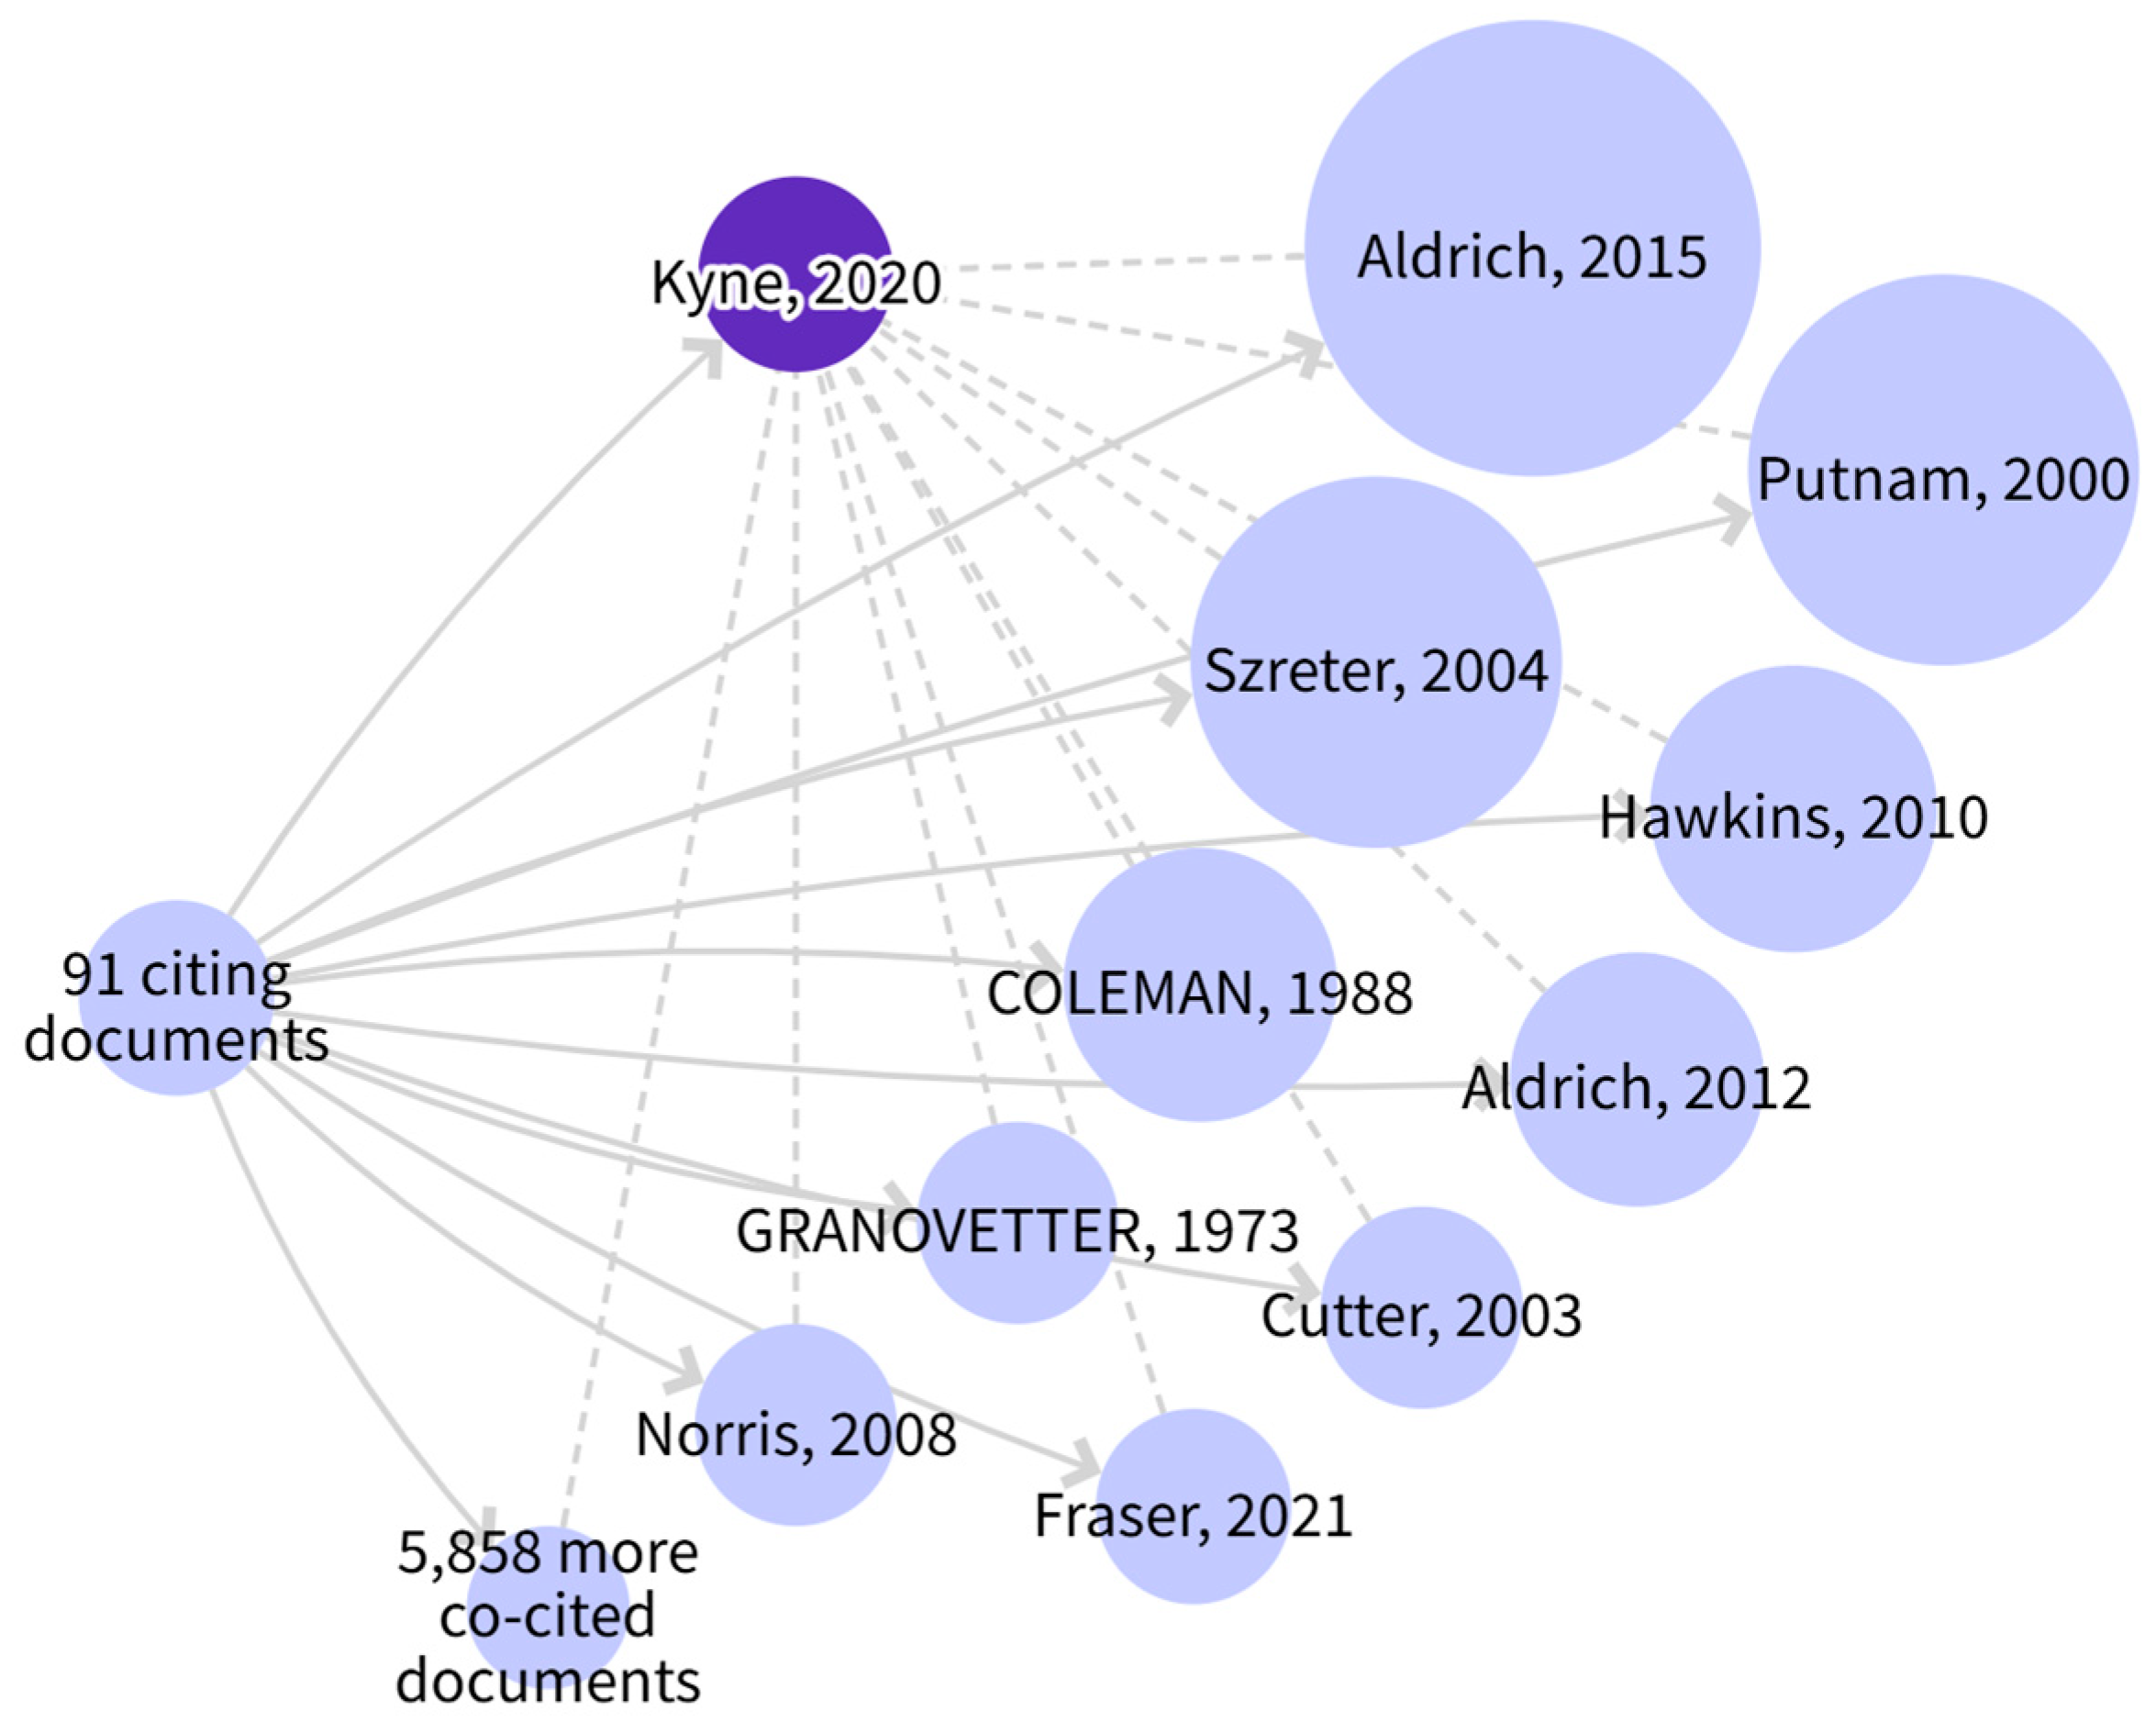
Clarivate 2024). The citation trajectory demonstrates a clear upward trend, with the highest annual citation counts occurring in 2022–2024, suggesting that engagement with the index is not only growing but expanding into new disciplinary arenas. This expanding intellectual footprint is further illustrated by the co-citation network (
Figure 3), which shows how the SoCI has become embedded within multiple scholarly traditions.
Citing documents span fields such as environmental sciences, public health, geography, public administration, urban studies, and sociology, confirming that the SoCI has achieved genuinely interdisciplinary reach. Additionally, citations appear in a range of applied and practitioner-oriented venues, reflecting the index’s utility for emergency management, hazard mitigation, and community resilience assessments. The breadth of citing journals and publication types underscores the SoCI’s value as both a conceptual and methodological contribution.
Taken together, the citation trend data reveal that the SoCI has become a widely recognized and increasingly influential tool for quantifying social capital, with continued growth likely as composite indicators gain prominence in resilience and vulnerability research.
Taken together, the disciplinary diffusion patterns, annual citation trends, and co-citation networks demonstrate that the SoCI has become a widely recognized and increasingly influential tool within the fields of resilience, hazard mitigation, environmental science, public policy, and the broader social sciences. Its rapid uptake across diverse scholarly communities reflects both its conceptual clarity and its practical usefulness for quantifying relational capacity at the county level. Importantly, the co-citation analysis reveals that the SoCI is situated at the intersection of foundational social capital theory, disaster and resilience scholarship, and empirical indicator development, underscoring its function as a bridge between theoretical frameworks and applied research needs.
This expanding influence also highlights the importance of revisiting and strengthening the index to better reflect contemporary data availability, evolving theoretical insights, and the diverse applications emerging across disciplines. Building on the momentum documented in this section, the next part of the paper introduces the updated 2025 version of the Social Capital Index, outlining its expanded indicators, improved normalization procedures, and enhanced conceptual alignment with current research on social structure and community resilience.
4. Advancing Social Capital
Building on the insights gained from early methodological experimentation, the updated 2025 Social Capital Index (SoCI) advances the original framework by integrating new data sources, expanding indicator coverage, and refining the operationalization of bonding, bridging, and linking social capital. These revisions respond directly to conceptual critiques, empirical observations, and lessons learned from the diffusion of the index across diverse disciplinary communities. As scholars increasingly incorporate social capital into analyses of community resilience, hazard vulnerability, and institutional performance, the need for a more sensitive and comprehensive measurement system has become clear.
The 2022 SoCI reflects this evolution. It incorporates updated 2022 U.S. Census and administrative datasets, adds twelve new indicators across bridging and linking dimensions, and improves the precision of several bonding measures. Together, these enhancements move the SoCI from an inaugural measurement tool to a more mature, theoretically aligned, and empirically robust index capable of supporting longitudinal, spatial, and policy-relevant research.
Section 4.2 outlines the construction of the revised index and describes the methodological improvements that distinguish the 2022 version from its 2019 predecessor.
4.1. Early Methodological Experimentation
Since its publication, the SoCI has undergone iterative methodological refinement and conceptual updating. Researchers have expanded indicator sets, improved normalization practices, refined treatments of ACS sentinel values, and incorporated newer measures of associational and institutional ties (
Kyne and Aldrich 2020). The transition from the 2010-based index to an updated 2025 version using 2022 data reflects more than a routine data refresh; it represents a substantial strengthening of the measurement framework. These improvements include expanded bridging and linking indicators, more precise operationalization of demographic equality, and closer alignment with contemporary theories of social connectedness and institutional embeddedness (
Szreter and Woolcock 2004). This innovation path mirrors the developmental arc described for SoVI, in which the index matured through iterative testing, expanded data inputs, and continuous methodological experimentation (
Cutter 1996;
Cutter et al. 2003).
The original SoCI was built on the premise that publicly available data could meaningfully approximate bonding, bridging, and linking capital at a national scale. Bonding capital was captured through demographic and socioeconomic similarity, language and communication capacity, and age structure, factors linked to cohesion and mutual support. Bridging capital drew on measures of associational life, including religious, civic, and youth organizations, which provide opportunities for cross-group interaction. Linking capital reflected political and institutional connections, including voter eligibility and government employment, which facilitate access to authority and decision-making structures (
Kyne and Aldrich 2020). All variables were normalized to a 0–1 range and equally weighted, following composite indicator best practices where strong theoretical guidance for differential weighting is absent.
Early methodological experimentation focused on three central questions: (1) the stability and behavior of indicators; (2) the sensitivity of the index to alternative weighting and normalization parameters; and (3) the conceptual and spatial coherence of the bonding, bridging, and linking dimensions. Initial analyses revealed that organizational density and institutional ties exhibited greater spatial variability than demographic equality measures, indicating that some elements of social capital are more unevenly distributed across U.S. counties. Exploratory tests using z-scores, alternative standardizations, and selective indicator removal showed that while broad regional patterns remained stable, local classification shifts occurred, highlighting the importance of indicator robustness, a challenge also observed in early SoVI work (
Cutter et al. 2003).
Additional analyses examined the independent spatial footprints of bonding, bridging, and linking capital. Bonding capital tended to be concentrated in parts of the Midwest and Northeast, bridging capital was highest in northern and western counties with strong associational networks, and linking capital displayed patterns tied to government employment and civic engagement. These distinct spatial signatures confirmed that the sub-indices captured substantively different dimensions of community social structure.
Finally, early validation tests established a link between SoCI scores and disaster-related outcomes.
Kyne and Aldrich (
2020) found that higher levels of social capital were associated with fewer fatalities and fewer federal disaster declarations, though results for property damage were less consistent. This pattern, where some outcomes align strongly with index scores and others less so, parallels findings from early SoVI validation literature (
Cutter et al. 2003;
Finch et al. 2010).
Overall, early methodological experiments demonstrated that the original SoCI was conceptually coherent, empirically interpretable, and sufficiently stable for national-scale analysis. At the same time, they highlighted the need for expanded indicator coverage, particularly within the bridging and linking dimensions, to more fully represent the social infrastructure that shapes community resilience. These insights directly informed the updated 2025 SoCI, which advances the index into a more mature and comprehensive measurement instrument.
4.2. Construction of the Revised 2025 Social Capital Index (SoCI)
The 2025 revision of the Social Capital Index (SoCI) expands and strengthens the measurement framework first developed in the 2020 SoCI by
Kyne and Aldrich (
2020). Grounded in the well-established tripartite conceptualization of bonding, bridging, and linking social capital (
Aldrich 2012;
Putnam 2000;
Woolcock and Narayan 2000), the updated index incorporates substantial improvements enabled by advances in data availability, indicator refinement, and methodological rigor. Motivated by emerging, higher-resolution county-level datasets and the need for greater analytical precision, the revised SoCI increases the number of indicators from 19 in 2010 to 26 in 2022. The study relies on data from two publicly accessible sources, specifically the 2022 American Community Survey (ACS) (
U.S. Census Bureau 2022b) and the 2021 NaNDA dataset (
Melendez et al. 2024). The NaNDA dataset is provided at the census-tract level and was collapsed to the county level to align with the unit of analysis used in this study.
Table 1 provides a side-by-side comparison of the indicator sets for both versions.
The Social Capital Index (SoCI) is a composite, county-level measure of the relational capacity of communities to mobilize resources, coordinate collective action, and engage with institutions. Conceptually, the SoCI captures the structure and density of social relationships that facilitate cooperation within groups, across groups, and between communities and formal institutions. Empirically, the index operationalizes this construct through observable indicators of bonding, bridging, and linking social capital, aggregated to provide a parsimonious summary of community relational infrastructure.
Bonding social capital refers to the strength of ties among socially similar individuals and groups, characterized by shared identities, close-knit relationships, and inward-looking solidarity. These ties support trust, reciprocity, and mutual aid, particularly during periods of stress or crisis. In the SoCI, bonding social capital is operationalized through indicators of demographic similarity and equality—such as racial income equality and educational equality—which reflect the degree of internal cohesion within communities.
Bridging social capital captures connections that span socially diverse groups, enabling cooperation and information exchange across differences in identity, background, or affiliation. These cross-cutting ties expand access to resources and perspectives beyond homogenous networks and are essential for collective problem-solving at the community scale. In the SoCI, bridging social capital is measured through indicators of associational life, including the density and spatial distribution of civic, religious, youth, and veteran organizations, which function as platforms for intergroup interaction and coordination.
Linking social capital reflects vertical relationships between individuals or community organizations and institutions that hold formal authority, resources, and decision-making power. These ties enable communities to access external support, influence policy processes, and secure assistance during recovery and reconstruction. In the SoCI, linking social capital is operationalized through indicators of political and institutional embeddedness, including measures of engagement with governmental structures and organizational employment linkages, which serve as proxies for potential access to institutional channels.
Together, these definitions provide the deductive foundation for the construction of the SoCI: observable indicators are selected not as outcomes of social capital but as structural proxies for the presence and configuration of social relationships that constitute bonding, bridging, and linking social capital at the county level.
Bonding Social Capital: The bonding social capital sub-index retains its original ten indicators but benefits from enhanced operationalization. Bonding capital reflects intra-group cohesion, demographic similarity, and inward-looking forms of solidarity (
Kyne and Aldrich 2020;
Putnam 2000). Although no new variables were added, several indicators underwent methodological refinement to improve accuracy and conceptual alignment. For example, the Racial Income Equality indicator (RINCEQ) was reconstructed to properly handle ACS sentinel values and missingness, and the Educational Equality measure (EDUEQ) was recalculated using a revised transformation procedure that more accurately captures educational disparities. These updates enhance the statistical precision and clarity of the bonding sub-index while maintaining its original conceptual structure (
Appendix C).
Bridging Social Capital: The bridging dimension experienced the most substantial expansion, growing from three indicators in 2020 to eight in 2025. Bridging capital captures cross-group interactions and the organizational structures that facilitate cooperation across diverse populations (
Jang et al. 2024;
Woolcock 1998). Eight new indicators were added, including normalized measures of civic, youth, veteran, and religious organizations per 1000 residents, as well as new density-based metrics reflecting the geographic distribution of each organizational type. These additions transform the bridging sub-index from a set of simple organizational tallies into a multidimensional representation of associational life that considers both accessibility and spatial concentration. As a result, the 2025 SoCI presents a more comprehensive and empirically rigorous depiction of the relational infrastructure that supports intergroup connectivity.
Linking Social Capital: Linking social capital underwent the most extensive conceptual and empirical enhancement, expanding from two indicators in 2020 to nine in 2025. Linking capital reflects vertical connections between individuals and institutions with authority, resources, and decision-making power (
Aldrich 2012;
Woolcock and Narayan 2000). The updated index introduces seven new indicators designed to capture institutional embeddedness more fully. These include improved measures of political linkage at local, state, and federal levels, as well as new organizational employment linkage indicators for religious, civic, youth, and veteran-serving institutions (
Jang et al. 2024). Collectively, these measures provide a more complete assessment of community members’ access to institutional structures and underscore the essential role of linking capital in shaping resilience, resource distribution, and recovery capacity (
Kyne and Aldrich 2020).
Index Integration and Normalization: Across bonding, bridging, and linking dimensions, the revised 2025 SoCI incorporates twelve new indicators, resulting in a 26-indicator index with broader conceptual reach and enhanced empirical robustness. All indicators were normalized to a 0–1 range using min–max transformations, merged via county-level FIPS identifiers, and aggregated into their respective bonding, bridging, and linking sub-indices using row totals that accommodate missing data. Consistent with the methodological strategy of the original index (
Kyne and Aldrich 2020), the final SoCI score is calculated as the equal-weighted mean of the three sub-index values. This approach preserves parsimony, ensures comparability across counties, and establishes a forward-compatible foundation for longitudinal extension and future updates (
Jang et al. 2024).
To strengthen the conceptual coherence of the index, the twelve new indicators, eight for bridging and four for linking, were added based on a two-step selection process. A comprehensive review of recent social capital scholarship identified specific conceptual gaps in the original index, especially those related to organizational connectivity and institutional embeddedness. In parallel, candidate variables were drawn from publicly available, nationally consistent datasets and evaluated for data quality, theoretical relevance, and temporal compatibility. Only indicators meeting both criteria and avoiding redundancy with existing measures were incorporated into the revised index.
Although the SoCI assigns equal weight to the three subdimensions, the bonding dimension contains more indicators (10) than bridging and linking (8 each), which introduces a minor implicit weighting imbalance. This structure reflects the composition of the original index rather than a theoretical preference for bonding capital. While the expanded set of bridging and linking indicators substantially improves conceptual balance, bonding still contributes slightly more raw information to the overall score. Alternative weighting schemes were examined, including factor-analytic and proportionate weighting, but equal weighting across the three dimensions remained the most theoretically consistent and empirically stable approach. This minor imbalance is therefore acknowledged as a limitation.
The revised SoCI also incorporates data from different years, specifically, 2022 ACS data and 2021 NaNDA organizational data, while some disaster outcomes reflect 2021 conditions. Consequently, the index represents a slightly later snapshot of county-level social capital. Following common practice in resilience and social vulnerability research, SoCI 2022 is treated as a reasonable proxy for pre-existing community conditions, though this temporal mismatch is noted as a limitation.
Further adjustments were required in modeling disaster outcomes. Several dependent variables exhibited zero inflation, particularly in counties with no recorded damages or federal disaster declarations. To address skewness without losing meaningful zero values, the outcomes were transformed using log (x + 1), which preserves zeroes while reducing the influence of extreme values. Zero-inflated Poisson and negative binomial models were evaluated; however, the log transformation provided the most stable and interpretable basis for comparing SoCI effects across all outcomes.
Taken together, the expanded measurement framework and enhanced methodological rigor of the revised 2025 SoCI not only improve the conceptual clarity of each sub-index but also strengthen the reliability of county-level comparisons nationwide. With all indicators normalized and integrated into a unified scoring system, the index is now better equipped to capture the diverse structural, demographic, and institutional contexts that shape social capital across the United States. Having established the construction and internal logic of the updated SoCI, an important next step is to examine how these refined measures manifest geographically. The following section investigates the spatial distribution of social capital across U.S. counties, revealing distinct regional patterns and disparities that offer critical insight into the geography of community capacity.
4.3. Geographic Distribution of the SoCI
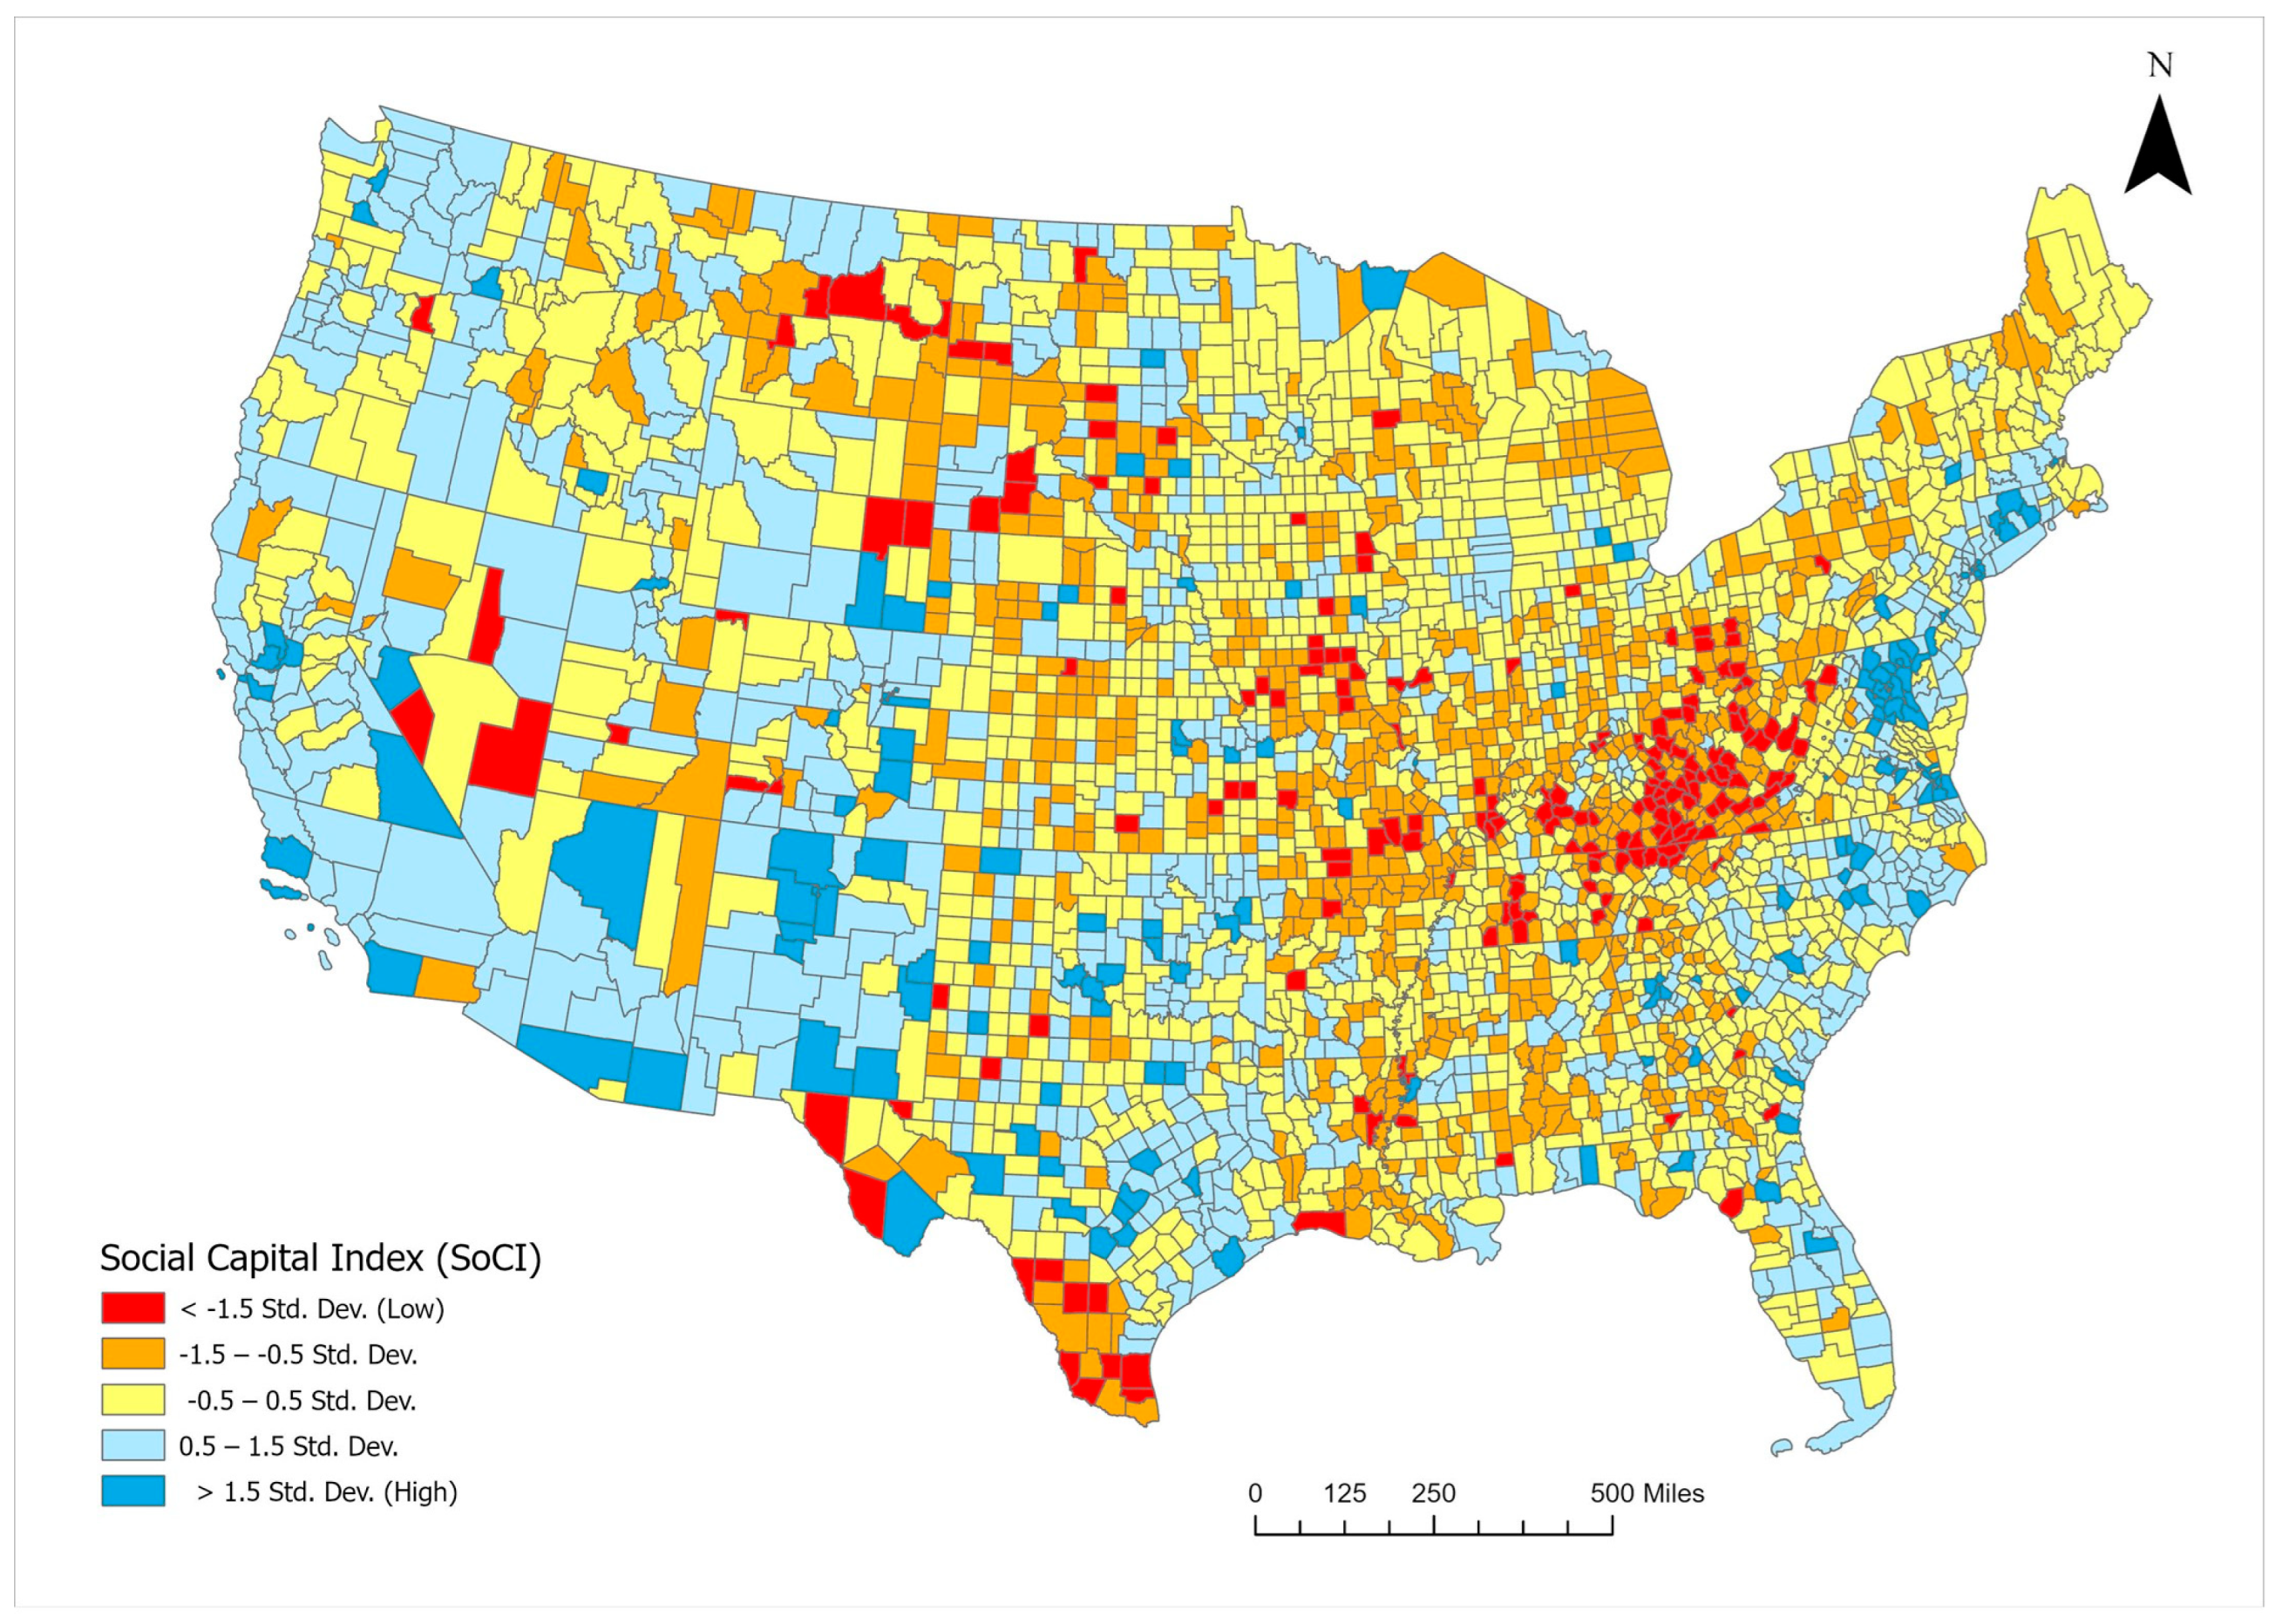
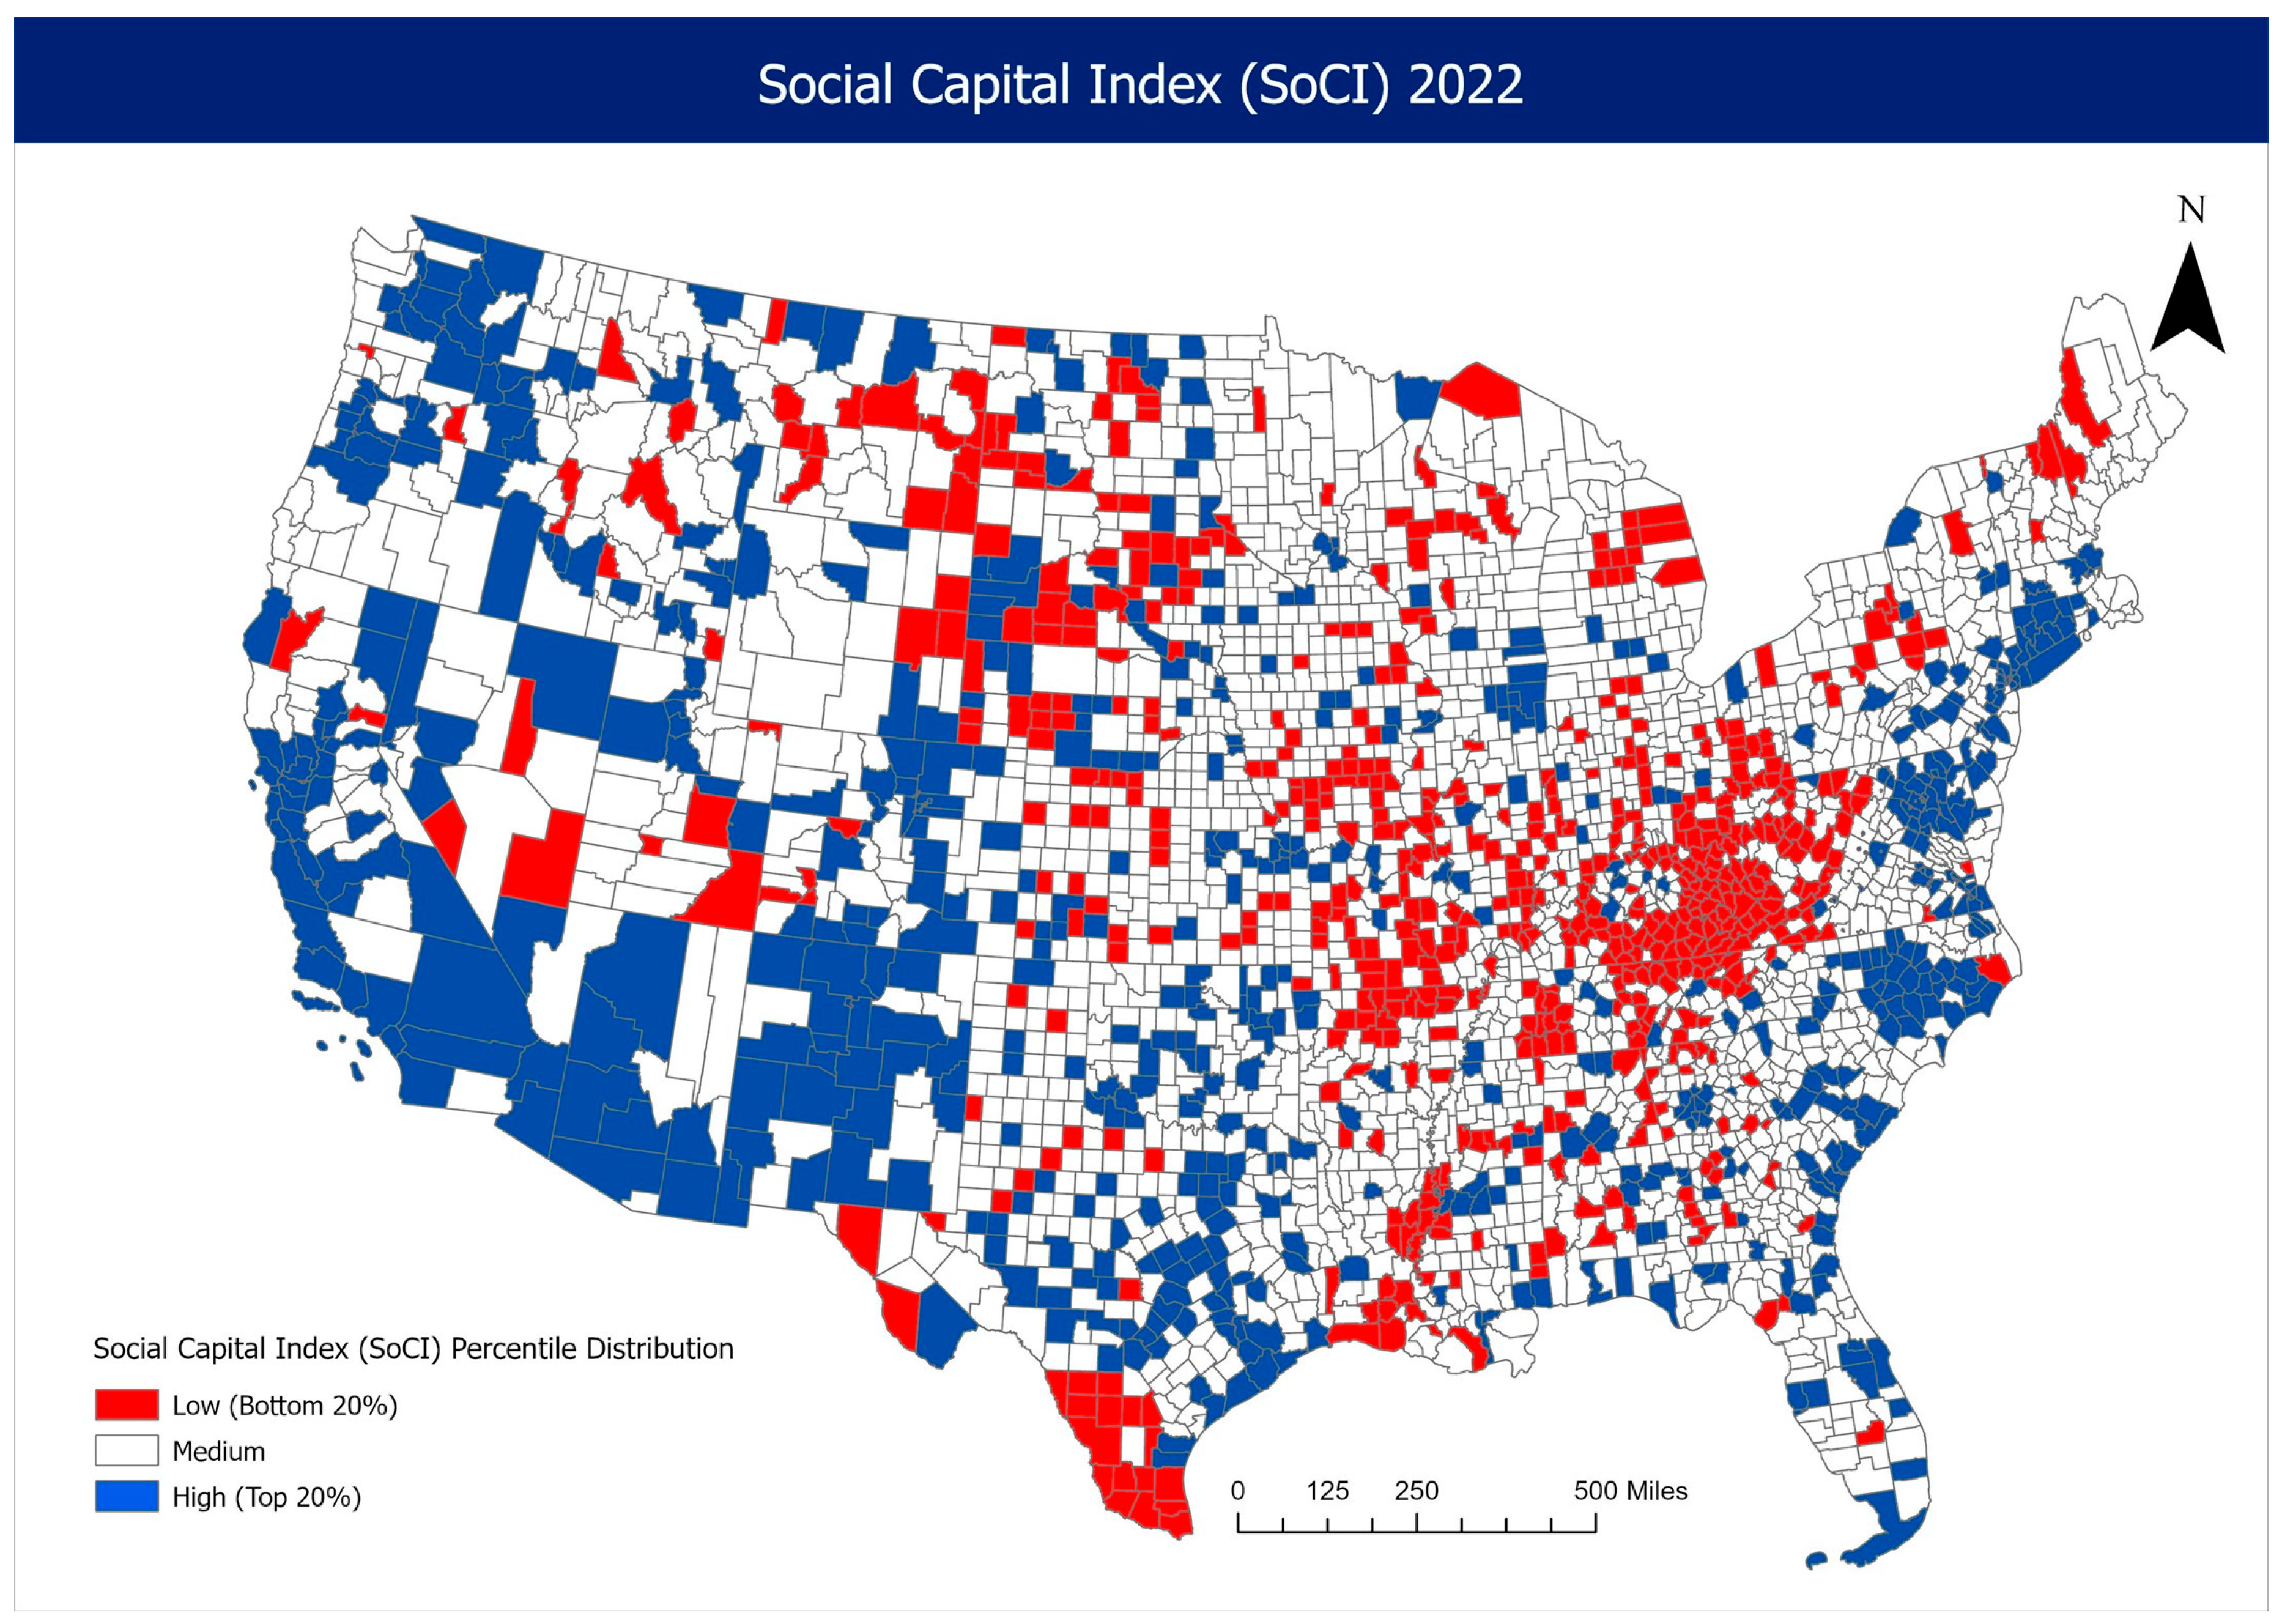
Figure 4 presents the national spatial distribution of the updated 2025 Social Capital Index (SoCI) across all 3144 U.S. counties and county equivalents, classified using a five-class standard deviation scheme. One notion is that the number of U.S. counties and county-equivalents increased from 3143 to 3144 in June 2022, when the U.S. Census Bureau formally recognized Connecticut’s nine Councils of Governments as county-equivalent units for statistical purposes (
U.S. Census Bureau 2022c,
2023). This change is reflected in the 2022 American Community Survey (ACS) and all subsequent federal datasets, and analyses using post-2022 data should adopt the updated total of 3144 county equivalents (
U.S. Census Bureau 2022a). The distribution is centered around the national mean: 1320 counties (41.98%) fall within ±0.5 standard deviations, indicating that most counties exhibit moderate levels of social capital. An additional 683 counties (21.72%) fall between −1.5 and −0.5 SD, while 779 counties (24.78%) fall between +0.5 and +1.5 SD. At the extremes, 204 counties (6.49%) score below −1.5 SD and 158 counties (5.03%) exceed +1.5 SD, reflecting pockets of exceptionally low and high relational capacity.
Low-SoCI counties (<−1.5 SD) form several distinct clusters, most prominently across Central Appalachia, the Deep South, and sections of South Texas. Additional low-SoCI pockets appear in isolated rural areas of the Great Plains and Southwest. These regions share long-documented structural challenges, including limited associational life, constrained institutional presence, and persistent economic disadvantage. Their low scores reflect weaker bridging and linking networks, particularly limited civic infrastructure and sparse nonprofit density.
Counties with moderate to high SoCI scores (+0.5 to +1.5 SD) are concentrated in the Mountain West, Upper Midwest, and parts of the Northeast and Mid-Atlantic, while the highest-scoring counties (>+1.5 SD) form dense clusters in Utah, Idaho, Colorado, Minnesota, Wisconsin, and northern New England. These areas typically exhibit strong civic participation, robust nonprofit sectors, and dense institutional networks, the hallmarks of bridging and linking social capital.
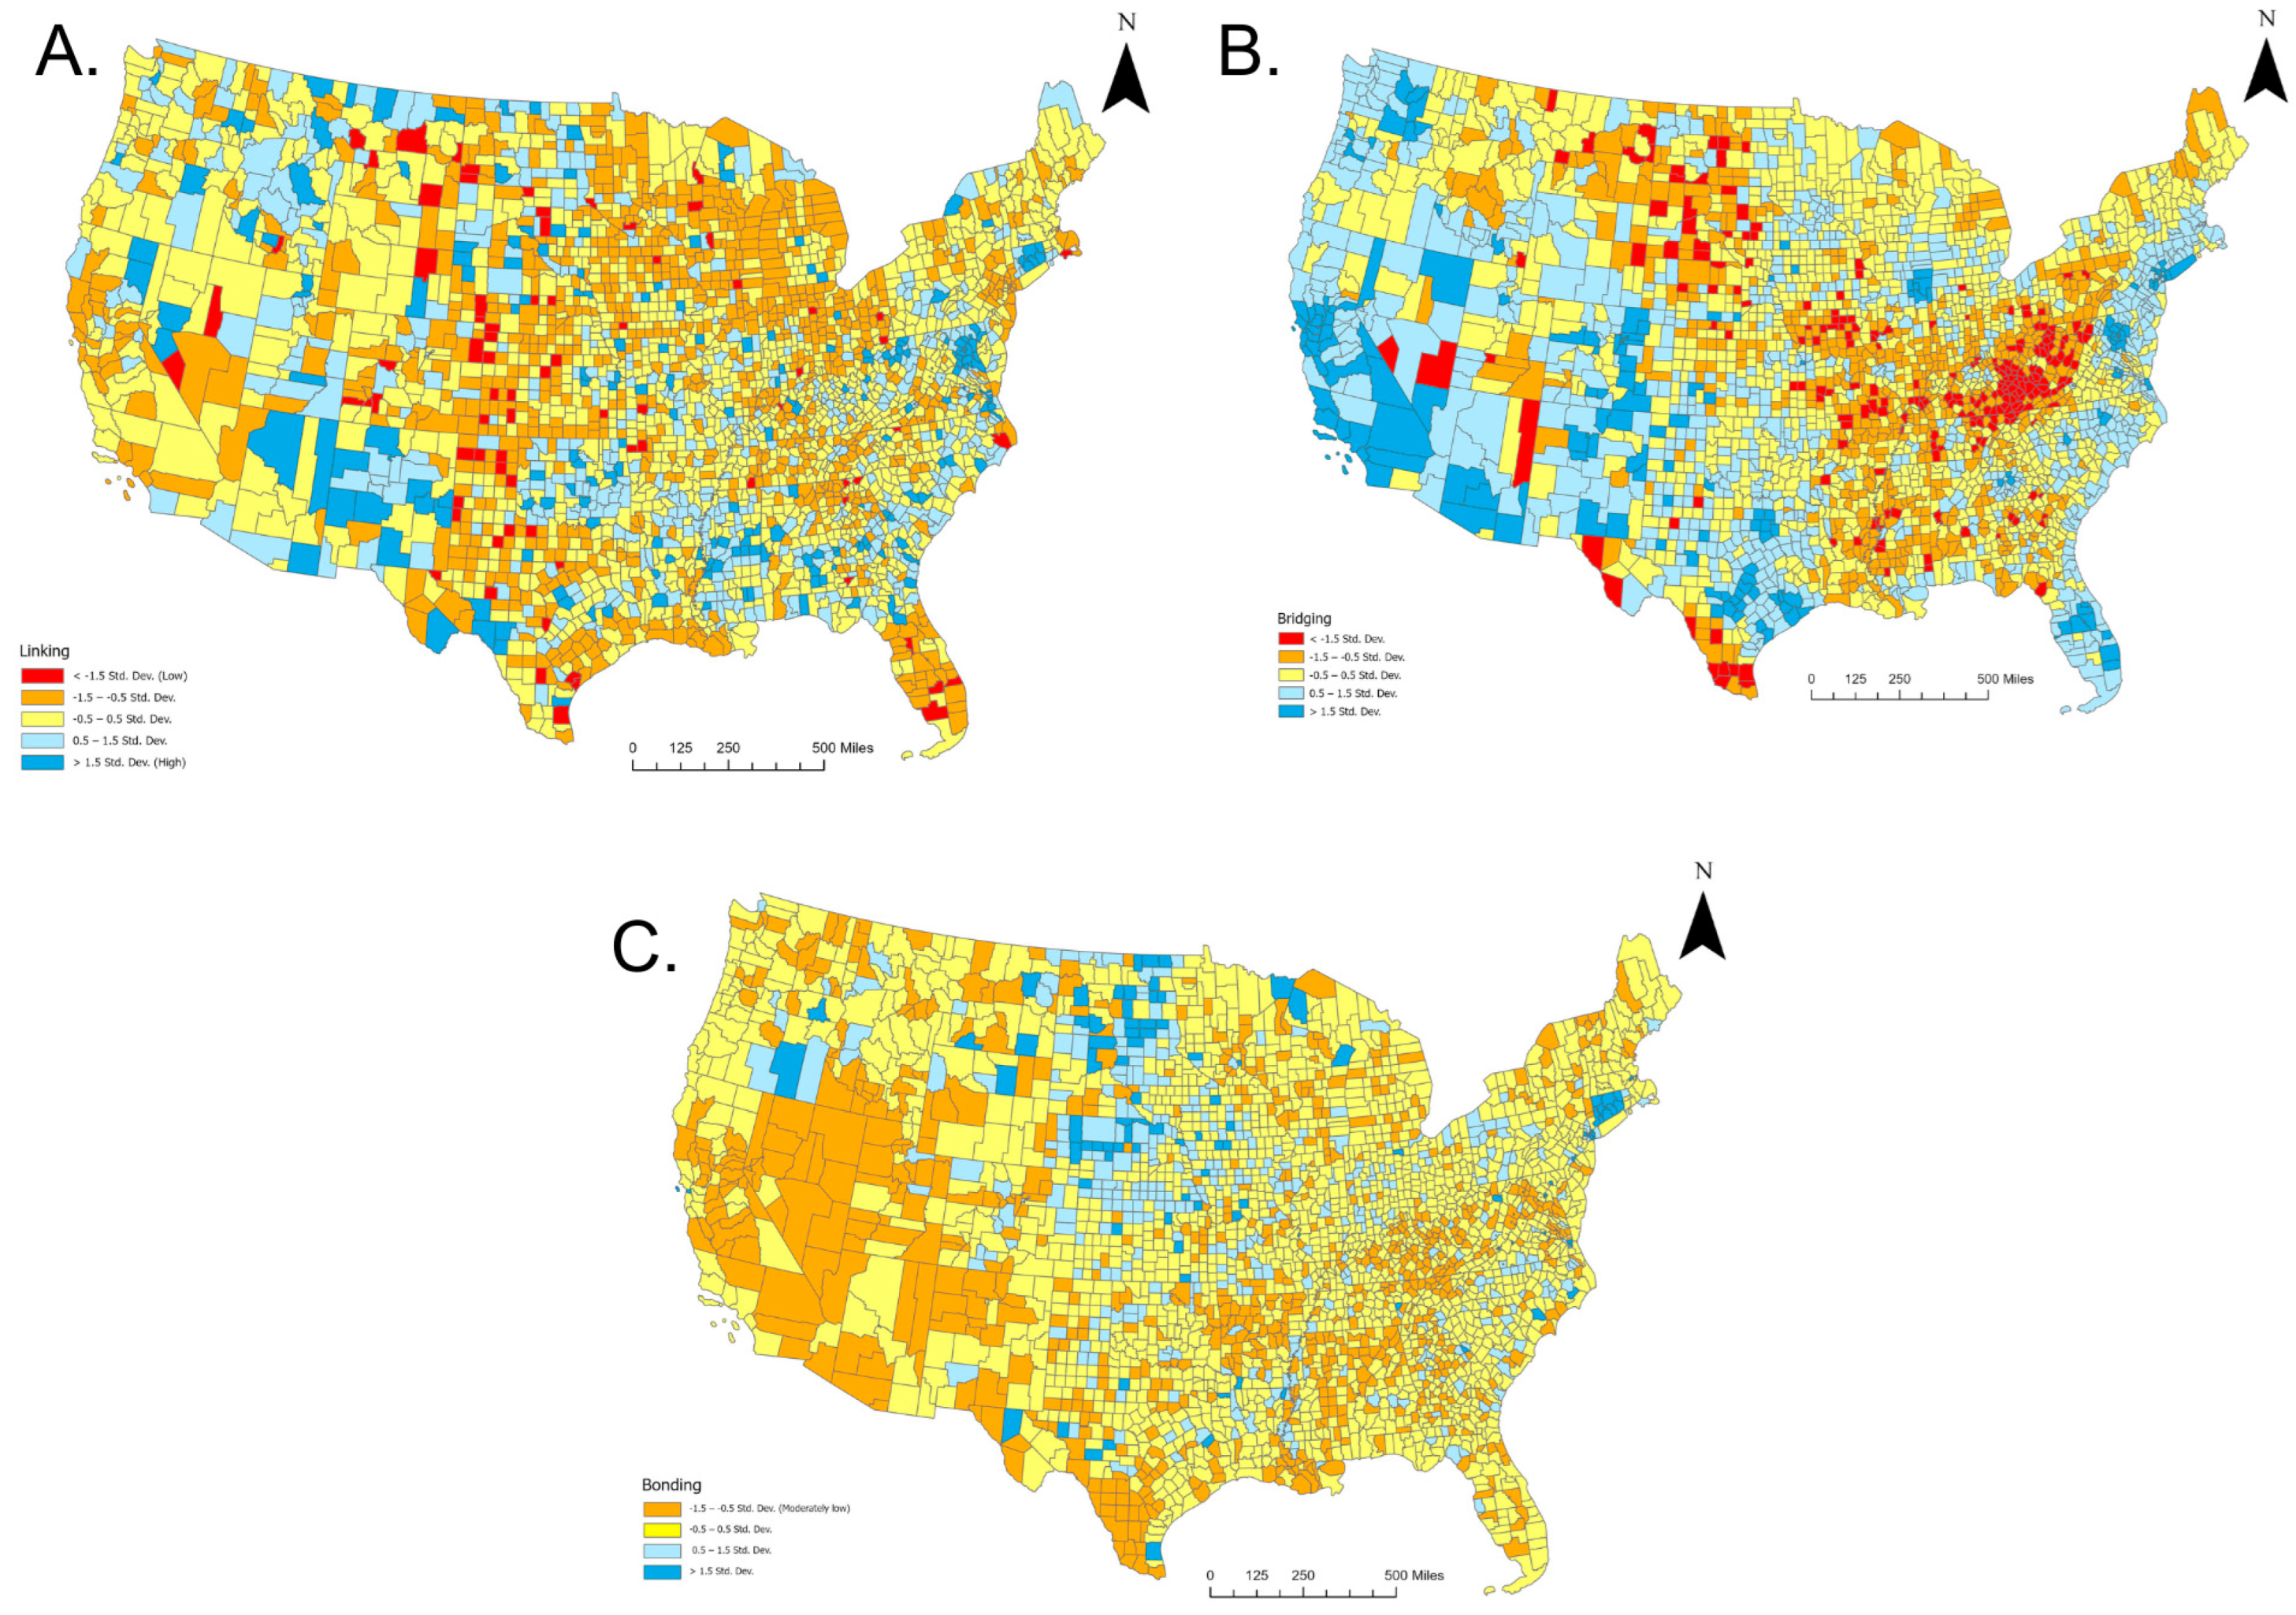
Appendix A,
Figure A1 further disaggregates these patterns across the SoCI components. Linking capital is highest in the Mountain West and lowest in Appalachia and the Deep South, mirroring long-standing differences in governmental capacity and institutional trust. Bridging capital peaks in the Upper Midwest and Mountain West, areas known for dense civic infrastructures. Bonding capital, by contrast, is more evenly distributed, with elevated levels in Utah, Idaho, and select Northeastern counties, reflecting cohesive demographic and cultural structures.
Together, these results reveal substantial spatial variation in the distribution of social capital across the United States. High-SoCI regions are characterized by strong civic ecosystems, diversified organizational infrastructures, and high levels of citizen engagement, whereas low-SoCI regions reflect persistent demographic, economic, and infrastructural barriers to developing bridging and linking networks. These geographic disparities underscore the importance of place-based strategies aimed at strengthening civic infrastructure and institutional connectivity.
4.4. Comparison of the 2010 and 2022 Social Capital Indexes (SoCIs)
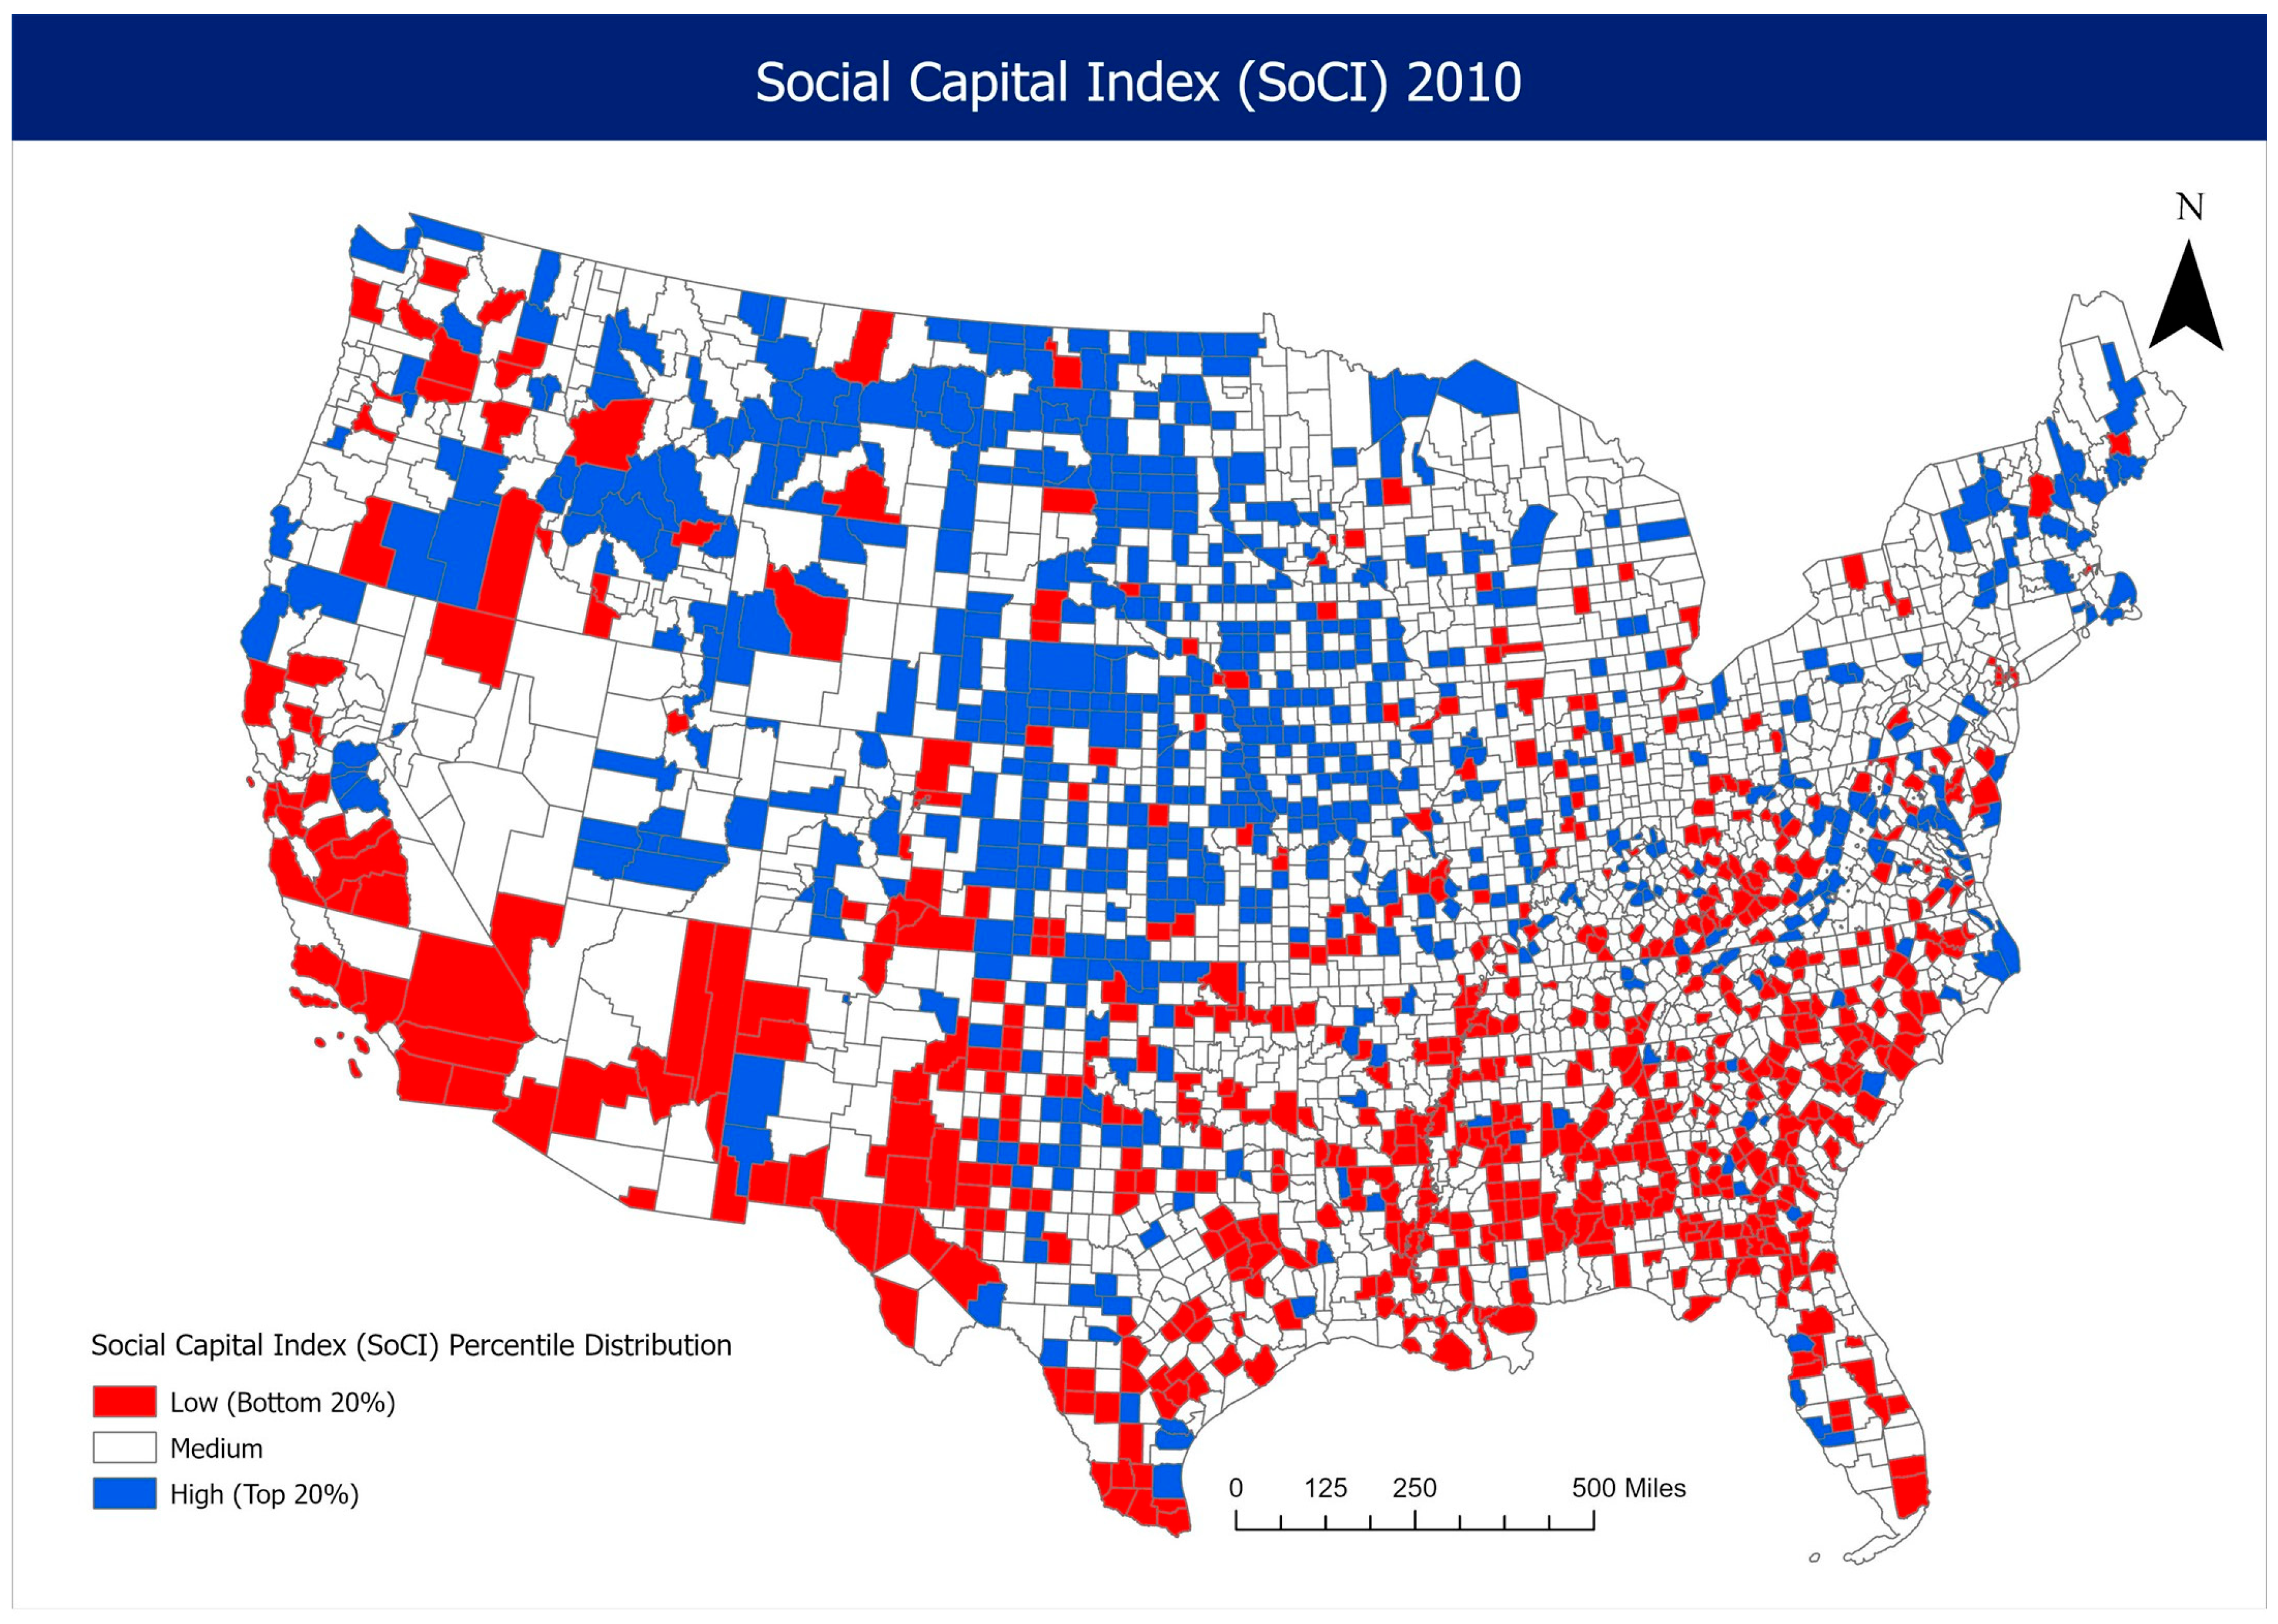
A comparison of the 2010 and 2022 Social Capital Index (SoCI) reveals strong continuity in the overall national distribution of social capital as well as meaningful spatial reconfigurations across U.S. counties (
Figure 5,
Appendix A,
Figure A2). Despite substantial changes in data sources and the expansion from 19 to 26 indicators, the percentile distribution of counties remains essentially unchanged. In both years, approximately 20% of counties fall into the low category, 60% into the medium category, and 20% into the high category, indicating that the broad national landscape of social capital remains structurally stable over time. This stability suggests that bonding, bridging, and linking relationships are deeply rooted in enduring demographic, organizational, and institutional contexts.
At the spatial level, however, the maps demonstrate notable shifts. In 2010, high-SoCI counties were concentrated in the Mountain West, the Upper Midwest, and parts of northern New England, consistent with regions long recognized for strong civic participation, dense nonprofit sectors, and robust community institutions. Low-SoCI counties in 2010 were heavily clustered across Appalachia, the Deep South, and portions of the Southwest, reflecting persistent structural barriers and weaker institutional and associational infrastructures.
By 2022, several new geographic patterns emerge. High-SoCI counties expanded across much of the western United States, including Oregon, Washington, California, Nevada, Utah, Colorado, and Idaho, forming a broader and more contiguous band of high social capital than observed in 2010. These gains likely reflect growth in civic organizations, expanding nonprofit infrastructures, and strengthened local governance capacity. At the same time, high-SoCI regions persist in the Northeast and parts of the Upper Midwest, though less uniformly than in the previous decade.
Conversely, low-SoCI clusters intensified in Appalachia, the central Deep South, and across the Texas border region, mirroring long-standing structural constraints as well as contemporary demographic pressures and organizational decline. Additional pockets of low social capital appear in isolated rural counties across Arizona, New Mexico, Montana, and the Dakotas. These spatial contractions and expansions point to shifting patterns of population change, economic restructuring, and evolving organizational ecologies.
Despite these regional shifts, medium-SoCI counties remain dominant across the central and interior United States, reflecting broadly moderate but stable levels of relational capacity across much of rural and small-town America.
Taken together, the comparison of the 2010 and 2022 SoCI underscores both continuity and localized transformation in the geography of social capital. While the national percentile structure remains fixed, the movement of specific counties into higher or lower categories highlights the value of routine index updates to capture evolving demographic, institutional, and civic dynamics, particularly in regions undergoing rapid economic or population change. These spatial shifts help identify emerging areas of vulnerability as well as regions where social capital resources have strengthened over time.
4.5. Empirical Validation and Outcome Analysis
Updated validation analysis: This study integrates two primary data sources to examine the relationships among natural disaster losses, social vulnerability, social capital, and community resilience across U.S. counties. The first dataset,
Losses from Natural Disasters, produced by economists at the Federal Reserve Bank of New York, provides annual county-level estimates of direct damages resulting from natural hazards in the United States (
Federal Reserve Bank of New York 2024). These estimates are derived from the National Oceanic and Atmospheric Administration’s (NOAA) Storm Events Database, which documents the occurrence, location, duration, and consequences of more than fifty weather and climate hazards. The dataset includes detailed information for each disaster event, including event and episode identifiers, county Federal Information Processing System (FIPS) codes, hazard duration, hazard type, and measures of property and crop damages, as well as direct and indirect injuries and fatalities.
Drawing on a ten-year analytical window spanning 2012–2022, three dependent variables were developed: the natural logarithm of total inflation-adjusted damages (ln_dtad), total injuries (ln_injt), and total fatalities (ln_fatt). Additional covariates were derived to capture population exposure and event frequency, including ln_pop (county population size), ln_evid (number of disaster events), and ln_days (total hazard duration in days). These variables allow for systematic comparison of hazard impacts across counties that vary widely in population and exposure characteristics.
To evaluate the influence of social and community conditions on disaster outcomes, the second dataset incorporates three indices widely used in hazards and emergency management research. The Social Capital Index (SoCI) measures the strength of community networks, civic engagement, and social cohesion, factors that facilitate preparedness, collective action, and recovery. The Social Vulnerability Index (SoVI) captures demographic and socioeconomic characteristics associated with heightened hazard susceptibility, including poverty, age structure, housing conditions, disability, and linguistic isolation. Finally, the Baseline Resilience Indicators for Communities (BRIC) Index provides a composite assessment of county-level resilience capacity, including economic stability, infrastructural robustness, community competence, and institutional readiness. Together, these indices offer complementary perspectives on the social determinants of disaster impacts, enabling a multidimensional assessment of how community structure, vulnerability, and resilience shape the severity of hazard losses across the United States.
A series of regression models were estimated to assess whether these indices predict three types of disaster outcomes: damages, injuries, and fatalities. Each model regressed one of the outcome variables, ln_dtad, ln_injt, or ln_fatt, on one of the three NRI indices, controlling for population size, event frequency, and event duration. The general specification was
Three blocks of models were estimated, one each for SoCI, SoVI, and the Resilience Index. All models used robust standard errors and were based on 3144 county-year observations spanning 2010 to 2022.
Prior scholarship guided expectations regarding the anticipated associations of these indices with disaster outcomes. Higher levels of social capital have been linked to increased disaster preparedness and more rapid recovery (
Aldrich 2012;
Kyne and Aldrich 2020); therefore, SoCI was expected to exhibit negative associations with fatalities and possibly with physical damages, although prior work suggests this relationship may be complex or nonlinear. Based on vulnerability theory and evidence that socially vulnerable populations experience disproportionate hazard impacts (
Bakkensen et al. 2017), SoVI was expected to show positive associations with damages, injuries, and fatalities. Because resilience captures the capacity to absorb and recover from shocks, the Resilience Index was expected to display negative associations with all outcome variables (
Table 2). Based on this literature, the following hypotheses are proposed and empirically tested.
H1 (Damages): Disaster-related damages are positively associated with social vulnerability and negatively associated with community resilience, while social capital is expected to exhibit a protective or context-dependent association.
H2 (Injuries): Disaster-related injuries are negatively associated with social capital and community resilience and positively associated with social vulnerability.
H3 (Fatalities): Disaster-related fatalities are negatively associated with social capital and community resilience and positively associated with social vulnerability.
The empirical results provide strong evidence for the protective influence of social capital in contemporary disaster contexts while offering more limited support for its earlier-period effects. In the updated 2020 models, the SoCI 2022 index shows a strong and statistically significant association with reduced disaster damages and injuries. Higher levels of social capital are significantly associated with reduced disaster impacts. Specifically, SoCI 2022 is linked to substantially lower total damages (
b = −0.8013, SE = 0.3313,
p < 0.05) and fewer total injuries (
b = −0.3656, SE = 0.0980,
p < 0.001). Although the coefficient for fatalities is negative (
b = −0.0928, SE = 0.0667), it does not reach statistical significance, suggesting that while social capital meaningfully dampens property and injury losses, its influence on mortality outcomes is less pronounced (
Table 3).
The 2023 regression analyses reveal clear and consistent patterns across the three social indices (
Table 3). The updated Social Vulnerability Index (
CDC and ATSDR 2022) is positively and significantly associated with all disaster outcomes, including logged damages (
b = 0.0997, SE = 0.0294,
p < 0.001), injuries (
b = 0.0481, SE = 0.0091,
p < 0.001), and fatalities (
b = 0.0351, SE = 0.0058,
p < 0.001). These findings reaffirm that counties exhibiting higher structural vulnerability continue to experience disproportionately greater physical, human, and economic disaster losses.
In contrast, the Social Capital Index (SoCI 2022) is strongly and negatively associated with disaster impacts. Higher levels of social capital correspond to significantly lower logged damages (b = −1.4114, SE = 0.3562, p < 0.001), injuries (b = −0.2326, SE = 0.0921, p < 0.01), and fatalities (b = −0.1324, SE = 0.0661, p < 0.01). These results highlight the protective role of bonding, bridging, and linking social networks in reducing both immediate and severe disaster consequences. Meanwhile, the BRIC 2020 index shows mixed effects—its coefficients are negative but only statistically significant for injuries (b = −0.6817, SE = 0.1370, p < 0.001) and fatalities (b = −0.7562, SE = 0.1001, p < 0.001), suggesting that resilience capacity mitigates human impacts more consistently than economic losses.
Collectively, the 2023 findings demonstrate a coherent and theoretically consistent pattern: structural vulnerability amplifies disaster damages, injuries, and fatalities, while community relational capacity—captured by social capital and selected resilience indicators—serves as an important buffer against both economic losses and human impacts. Overall, the results largely support the study’s hypotheses, with social vulnerability consistently increasing disaster losses, social capital significantly reducing adverse outcomes across all measures, and community resilience exhibiting a protective effect for injuries and fatalities.
Predictive Performance of SoCI 2022 for 2021 and 2022 Disaster Outcomes: We also evaluated the predictive validity of the updated Social Capital Index (SoCI 2022) for disaster outcomes in 2021 and 2022 (
Appendix A,
Table A2 and
Table A3). Across both years, higher social capital consistently predicted lower damages and fewer injuries. In the 2021 models, SoCI 2022 was strongly associated with reduced damages (β = −1.153,
p < 0.001) and injuries (β = −0.295,
p < 0.001), while the negative association with fatalities did not reach statistical significance (β = −0.082,
p = 0.14). Results for 2022 show a similar pattern: SoCI 2022 significantly reduced damages (β = −0.804,
p = 0.02) and injuries (β = −0.366,
p < 0.001), whereas the effect on fatalities remained negative but non-significant (β = −0.094,
p = 0.18). The consistency of these findings across consecutive years demonstrates the stability of the updated index and its ability to capture social structures that mitigate the human and economic impacts of disasters.
Comparative performance: The comparative results show that the expanded 26-indicator Social Capital Index (SoCI 2022) substantially outperforms the original 19-indicator version (SoCI 2010) in explaining variation in disaster outcomes. The baseline SoCI 2010 models demonstrate limited predictive capability: the index is not significantly associated with 2010 damages (β = −0.063,
p = 0.772) or injuries (β = −0.026,
p = 0.847), and only a modest protective association emerges for fatalities (β = −0.172,
p = 0.032). These patterns indicate that the earlier, narrower indicator set captured only a restricted portion of the social capital dimensions that shape local disaster impacts (
Table 4).
By contrast, the updated SoCI 2022 displays stronger and more consistent predictive power for 2020 outcomes. Higher levels of social capital are significantly associated with reduced damages (β = −0.801, p = 0.016) and fewer injuries (β = −0.366, p < 0.001). Although the association with fatalities remains negative, it does not reach statistical significance (β = −0.093, p = 0.165). Even though the magnitude of the 2022 coefficients is somewhat smaller than in earlier provisional models, the sustained direction and significance patterns underscore that the expanded index captures a broader—and more contemporary—set of community capacities, including civic infrastructure, organizational density, and institutional linkages, that collectively support disaster resilience.
As with most observational county-level analyses, the potential for endogeneity warrants caution. Counties with higher social capital may also possess unobserved advantages—such as more effective governance, stronger economic bases, or robust infrastructure—that independently reduce disaster losses. Although the models adjust for population size, hazard frequency, and exposure duration, unmeasured protective factors may still influence coefficient estimates. To mitigate this risk, we compare findings across three indices (SoCI, SoVI, BRIC) and observe consistent patterns; however, establishing causal inference falls beyond the scope of the present study. Future research employing longitudinal designs or instrumental-variable strategies would help to better isolate the causal mechanisms linking social capital to disaster outcomes.
Taken together, the comparison highlights the analytical value of the expanded SoCI 2022. By incorporating a more diverse and comprehensive set of indicators, the revised index yields a fuller assessment of community social capital and offers improved explanatory power for disaster-related losses relative to the original version. Across both index models, population size, hazard frequency, and hazard exposure duration behave as theoretically expected, further reinforcing the robustness of the empirical framework.
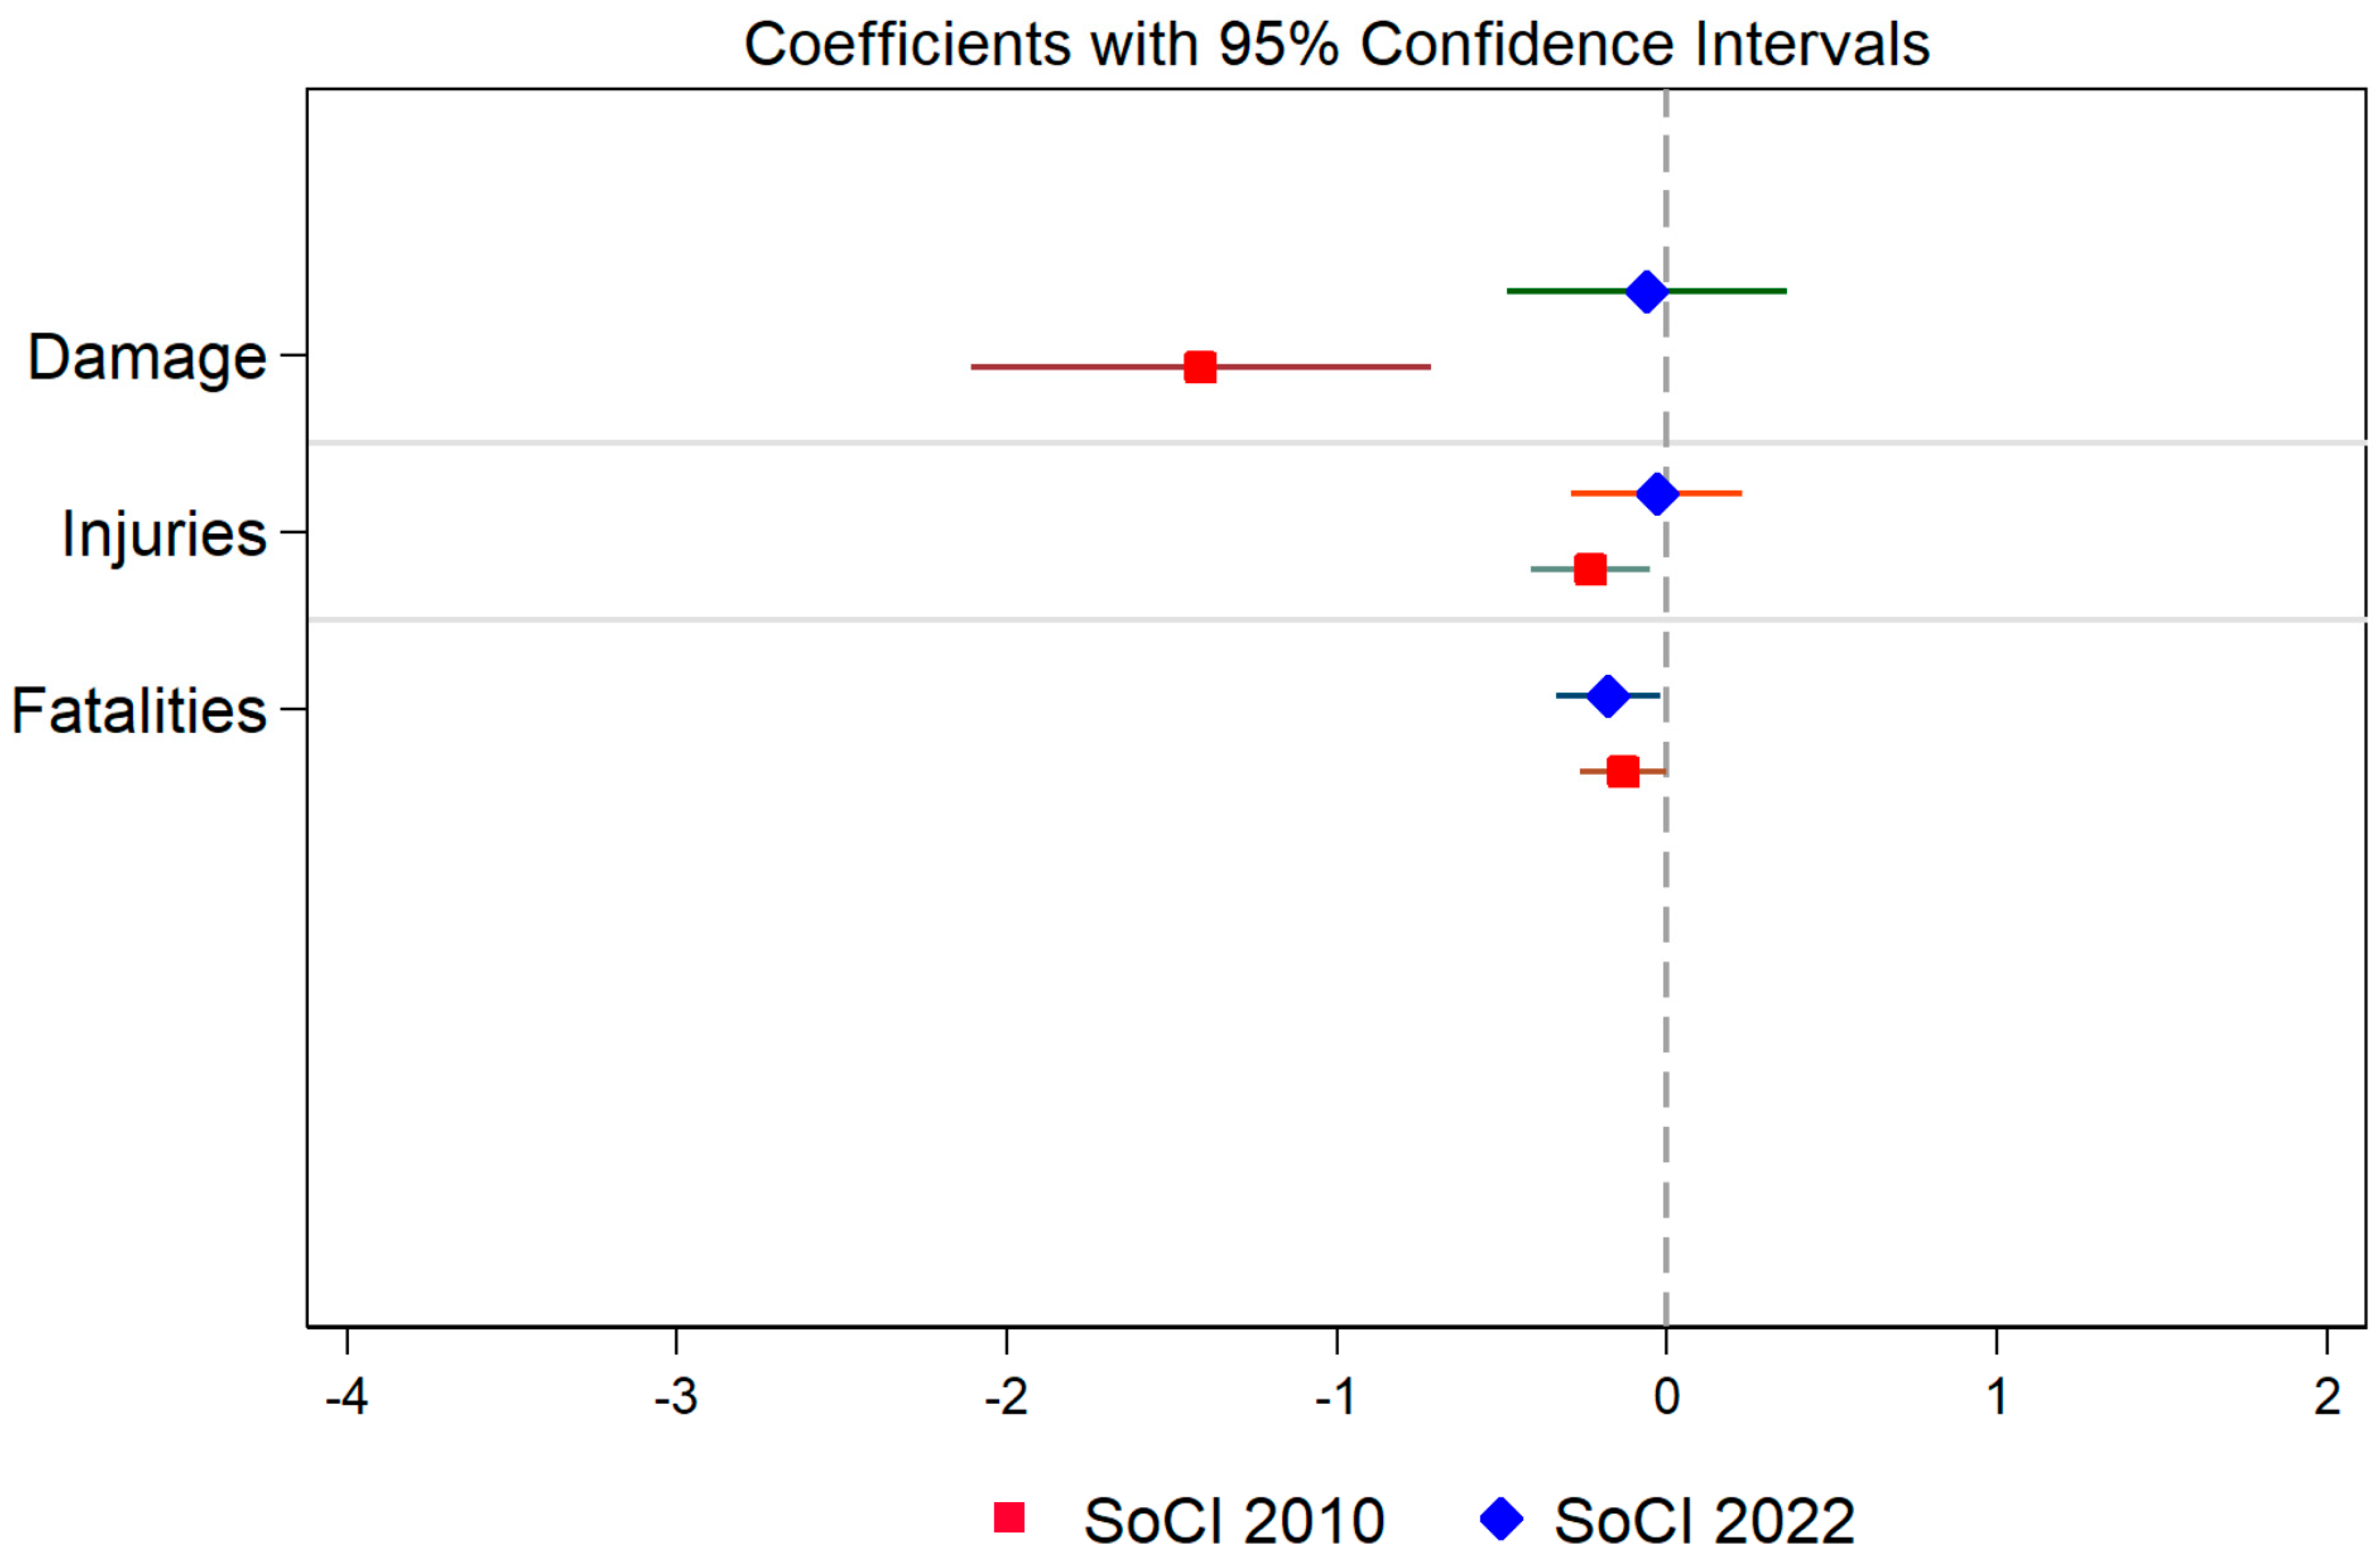
Figure 6 compares the estimated effects of the Social Capital Index from 2010 and 2022 on 2023 disaster damages, injuries, and fatalities, displaying regression coefficients with their 95% confidence intervals. The results show that the original SoCI 2010 offers limited predictive value: its coefficients for damages and injuries are small and statistically insignificant, while only fatalities show a modest protective association.
In contrast, the expanded SoCI 2022 demonstrates substantially stronger and more consistent effects. The coefficients for damages and injuries are significantly negative, with confidence intervals fully below zero, indicating that higher levels of contemporary social capital are associated with fewer economic losses and fewer disaster-related injuries. Although the 2022 coefficient for fatalities is also negative, its confidence interval slightly overlaps the null, suggesting a non-significant association.
Overall, the figure underscores the analytical gains from using the updated 26-indicator SoCI. Compared with the earlier index, SoCI 2022 captures a broader set of civic, organizational, and institutional capacities, yielding a more accurate assessment of how social capital influences disaster outcomes.
4.6. Case Study Illustrations of County-Level Social Capital Change (2010–2022)
To illustrate how substantial gains in county-level social capital can enhance community capacity and institutional connectedness, we highlight three counties that experienced the largest increases in the Social Capital Index (SoCI) between 2010 and 2022: Bronx County (NY), New York County/Manhattan (NY), and Falls Church City (VA) (
Table 5,
Appendix A,
Table A4). These counties registered some of the steepest SoCI improvements nationally and represent urban jurisdictions where demographic change, economic restructuring, and expanding civic and organizational networks have strengthened key dimensions of bonding, bridging, and linking capital. Detailed demographic profiles and component-level indicator changes are provided in
Appendix B.4,
Appendix B.5 and
Appendix B.6 and
Table A9,
Table A10 and
Table A11.
Bronx County, New York, exhibited one of the sharpest increases, with its SoCI rising from 0.70 in 2010 to 2.76 in 2022 (+2.06; +318%). The county’s 2010 profile showed moderate bonding but very weak bridging and linking capital. By 2022, bridging social capital had expanded dramatically—reflecting growth in civic, youth, and community-based organizations—while bonding capital strengthened and linking capital showed modest improvement. These changes unfolded alongside demographic aging, shifts in income parity, and increased ethnoracial concentration, collectively supporting a significant rise in overall SoCI.
New York County (Manhattan), New York, recorded the largest SoCI increase in the nation, rising from 0.89 to 4.04 (+3.15; +365%). Unlike the Bronx, Manhattan began with relatively high levels across all three domains. By 2022, bridging capital had increased to exceptionally high levels, supported by dense civic, cultural, and philanthropic institutions, while bonding capital also strengthened. Linking capital declined slightly but remained comparatively strong. The county’s trajectory reflects Manhattan’s position as a major economic and organizational hub, with expanded civic mobilization and institutional engagement contributing to markedly higher social capital.
Falls Church City, Virginia, also experienced substantial growth, with its SoCI increasing from 1.19 in 2010 to 3.28 in 2022 (+2.10; +175%). Entering the period with already strong bonding, bridging, and linking capacity, the city achieved balanced gains across all three components. Rising educational and income equality, increased local and state governmental linkage, and improved gender and racial parity contributed to a uniformly strengthened social-capital profile. Falls Church represents a case in which population growth, socioeconomic stability, and strong governance structures reinforce each other to generate broad-based increases in social capital.
To illustrate how declines in county-level social capital translate into weakened resilience capacity, we highlight the three counties that experienced the largest reductions in the Social Capital Index (SoCI) between 2010 and 2022: Garfield County (MT), Borden County (TX), and King County (TX) (
Table 6 and
Table A5). These counties not only registered the steepest SoCI decreases nationally but also represent rural populations where demographic aging, institutional thinning, and limited civic infrastructure create pronounced vulnerabilities. Detailed profiles, including population dynamics, demographic change, and shifts in normalized SoCI component variables, are provided in
Appendix B.1,
Appendix B.2 and
Appendix B.3 and
Table A6,
Table A7 and
Table A8.
Garfield County, Montana, experienced the largest proportional decline, with its SoCI falling from 0.96 in 2010 to 0.19 in 2022 (−0.77; −80%). In 2010, the county exhibited modest bonding capital but minimal bridging and linking ties, typical of very small and isolated rural counties. By 2022, even these limited bonding resources had eroded, and bridging and linking capacity remained extremely low, reflecting continued demographic aging, reduced social homogeneity, and limited civic and institutional presence.
Borden County, Texas, showed a nearly identical decline, dropping from 0.94 to 0.18 (−0.76; −81%). The county began 2010 with fragile bonding networks and almost no bridging or linking capital. Subsequent population loss, declining social similarity, and reductions in organizational and governmental linkage further weakened its already thin civic ecosystem, leaving the county with minimal structural resources to support resilience.
King County, Texas, also experienced a substantial decline, with SoCI decreasing from 0.90 to 0.20 (−0.70; −78%). Despite moderate bonding ties in 2010, the county had very limited bridging and linking capacity. By 2022, both bonding and bridging capital had weakened further, and linking measures—already close to zero—remained unchanged. Persistent depopulation, an aging demographic profile, and the absence of nonprofit and governmental institutions contributed to this downward trajectory.
5. Discussion
This study set out to (1) trace the conceptual foundations of the Social Capital Index (SoCI), (2) assess its interdisciplinary diffusion, and (3) advance, validate, and apply an updated SoCI using 2022 data. Together, the findings show that the SoCI is both theoretically grounded and empirically effective as a measure of the geography and consequences of social capital across U.S. counties.
5.1. Conceptual Contributions
The historical and theoretical review demonstrates that the SoCI is grounded in a long intellectual lineage connecting classical social theory, modern social capital scholarship, and contemporary community resilience research. Its tripartite structure—bonding, bridging, and linking capital—draws from foundational contributions by Bourdieu, Coleman, Putnam, and Woolcock, yet adapts these concepts for county-level operationalization. The revised 2025 SoCI strengthens this foundation by expanding indicators of associational life, organizational density, and institutional embeddedness, thereby aligning with current research emphasizing how horizontal ties and vertical linkages jointly shape community resilience (
Aldrich and Meyer 2015;
Szreter and Woolcock 2004).
At the same time, the conceptual literature underscores that social capital is not universally beneficial. Scholars have long noted that strong bonding ties can take exclusionary or even harmful forms, fostering insularity, in-group favoritism, and reduced information flow (
Portes 1998;
Portes and Landolt 1996). Such dynamics may concentrate benefits within tightly knit groups while limiting the participation and support available to marginalized residents (
Portes 1998;
Portes and Landolt 1996). In disaster contexts, these “negative social capital” effects can impede cross-group coordination, slow response, and reinforce existing social and institutional inequalities (
Aldrich 2012;
Aldrich and Meyer 2015).
By incorporating bonding, bridging, and linking dimensions, the SoCI reflects this dual conceptual heritage, capturing the cohesive, connective, and institutional dimensions of social capital while recognizing that each may carry both enabling and constraining effects for community resilience.
5.2. Diffusion and Scholarly Impact
Citation and co-citation analyses show that the SoCI has diffused rapidly across disciplines, including environmental sciences, hazards and climate adaptation, public health, public administration, sociology, and urban planning. Co-citation networks place
Kyne and Aldrich (
2020) at the intersection of foundational social capital theory and empirical resilience research, demonstrating that the SoCI serves as a conceptual and methodological bridge between theoretical debates and applied quantitative work. The steady growth in annual citations indicates that the index now plays a central role in interdisciplinary conversations about vulnerability, resilience, and community capacity.
5.3. Advancing Measurement: Methodological Considerations
The transition from a 19-indicator index in 2010 to a 26-indicator index in 2022 represents a substantive methodological advancement. The expanded SoCI incorporates new indicators capturing civic, youth, veteran, and religious organizations; organizational employment; and political and governmental linkages, thereby reflecting a richer spectrum of associational and institutional ties. Although the core bonding indicators were retained, several were refined to improve conceptual alignment and data quality, including updated measures of educational equality, racial income homogeneity, and communication capacity.
Importantly, the Social Capital Index developed for this study diverges in meaningful ways from widely used alternatives such as the Rupasingha–Goetz and Penn State indices (
Rupasingha et al. 2006). Those measures emphasize associational density and formal civic engagement—primarily counting organizational presence, voter turnout, census response, volunteering, and community participation. As a result, they capture institutional civic capacity but only a portion of the broader social capital construct. In contrast, the SoCI integrates bonding, bridging, and linking dimensions by incorporating racial and ethnic similarity, income and educational equality, language competency, political and governmental linkages, and updated organizational densities. This broader framework provides a more multidimensional and hazard-relevant representation of social capital, better suited for explaining variation in disaster impacts.
Several methodological issues warrant further consideration. First, equal weighting was adopted in line with composite-indicator best practices, which recommend uniform weights in the absence of strong theoretical justification for differential weighting. Notably, the expanded 2022 index delivers substantially stronger predictive performance than the original 2010 version, suggesting that the improved coverage meaningfully enhances measurement validity.
Second, data limitations required careful handling rather than routine imputation. Several ACS indicators contain the sentinel value −0.666666, reflecting suppressed or unreliable estimates due to confidentiality constraints or insufficient sample sizes. Because these values indicate genuine nonreportability, replacing them through imputation would have introduced artificial variation. Similarly, NaNDA organizational indicators include true zeros for counties that lack civic, youth, veteran, or religious organizations entirely. These zeros represent real structural absences rather than missing data, and imputing alternative values would distort the local civic landscape.
Third, robustness checks demonstrate that findings remain stable across alternative specifications. SoCI coefficients retain their negative direction and substantive magnitude when applying different normalization procedures or when selectively excluding individual indicators, confirming that observed relationships are not artifacts of particular modeling decisions.
Together, these methodological considerations highlight both the rigor and transparency of the updated SoCI while reinforcing its suitability for contemporary resilience and hazard analysis.
5.4. Empirical Validation: Social Capital, Vulnerability, and Resilience
Outcome analyses show that the updated SoCI captures structural dimensions that meaningfully shape disaster impacts. In the 2021 models, higher SoCI scores are associated with significantly lower damages and fewer injuries, even after accounting for population exposure, event frequency, and hazard duration. As anticipated, SoVI is positively associated with losses, confirming that structural vulnerability amplifies disaster impacts, while BRIC demonstrates robust protective effects for injuries and fatalities. Model-fit statistics indicate complementary strengths across the three indices: SoCI most strongly predicts damages, SoVI captures structural disadvantage, and BRIC captures adaptive capacity.
Comparing the 2010 and 2022 SoCIs makes these improvements clear. The 2010 index shows limited predictive power, with only modest associations for fatalities. The expanded 2022 index exhibits stronger and more consistent protective effects, suggesting that the broadened indicator set captures contemporary organizational density, civic capacity, and institutional linkages more effectively. Nevertheless, temporal differences must be interpreted with caution, as they reflect both genuine changes in social capital and improved measurement sensitivity.
Case studies of Bronx County, New York County, and Falls Church City demonstrate these patterns on the ground. The Bronx and Manhattan show dramatic increases driven by explosive growth in bridging capital, reflecting expansion of mutual-aid networks, nonprofits, and civic organizations, while Falls Church exemplifies stable, high-level bonding, bridging, and linking capital. Together, these cases illustrate how civic mobilization, social infrastructure, and institutional engagement contribute to rapid gains in social capital (
Fraser et al. 2024;
Klinenberg 2018).
A substantial body of economic research demonstrates that social capital contributes to economic performance by reducing transaction costs and facilitating cooperation in markets. Using cross-country data,
Knack and Keefer (
1997) show that generalized trust and civic norms are strongly associated with higher income growth and investment, independent of education and institutional quality (
Knack and Keefer 1997). Extending this logic, the Social Capital Index (SoCI) provides a framework for examining how subnational variation in social capital relates not only to disaster resilience but also to broader patterns of local economic performance and recovery.
At the same time, the richness of the data underlying the Social Capital Index (SoCI) supports multiple complementary interpretations. While the SoCI captures meaningful empirical patterns associated with disaster outcomes, observed correlations may also reflect broader socioeconomic and demographic structures, including income distributions, housing conditions, and population characteristics. Accordingly, outcomes related to disaster impacts, race, income, education, and housing are interpreted as important community attributes in their own right, without requiring strong claims that they directly represent distinct forms of social capital.
5.5. Policy Applications and Implementation Toolkit
To support practitioners in translating the Social Capital Index into actionable strategies,
Table 7 presents a practitioner-focused implementation guide that links SoCI components to concrete planning and policy activities. An essential starting point is to identify priority gaps by examining bonding, bridging, and linking scores to determine where community capacity is weakest. Low bonding capital may indicate a need to strengthen neighborhood cohesion and peer support networks, consistent with evidence that strong interpersonal ties enhance mutual aid and post-crisis recovery (
Aldrich and Meyer 2015;
Putnam 2000). Low bridging capital highlights opportunities to expand civic associations, volunteer programs, and youth engagement—key pathways for fostering inclusive collective action (
Granovetter 1973;
Szreter and Woolcock 2004). Weak linking capital, by contrast, signals deficits in institutional trust, representation, and vertical connectivity; in such cases, participatory governance processes and improved government outreach can meaningfully enhance community resilience (
McGuire and Silvia 2010;
Norris et al. 2008).
Using the bottom 20% of SoCI scores as the threshold for “low social capital” follows established resilience and equity frameworks that designate the lowest quintile as a priority tier for intervention (
Cutter et al. 2003;
Flanagan et al. 2011). Although normative, this percentile-based cutoff offers a clear and policy-relevant method for identifying counties with weak bonding, bridging, and linking capacity, conditions that elevate disaster vulnerability and impede equitable recovery (
Aldrich 2012;
Aldrich and Meyer 2015). As such, counties in the lowest quintile represent critical focal points for community resilience programs, hazard communication efforts, and investments in social infrastructure.
A growing body of research underscores the central role of social infrastructure—parks, community centers, libraries, religious institutions, and other public spaces—in shaping these capacities. Such institutions serve as the physical and relational backbone through which communities cultivate bridging and linking networks, support civic participation, and maintain continuity of services during crises (
Fraser et al. 2024;
Klinenberg 2018). These insights further reinforce the value of integrating SoCI scores into community planning processes.
Building on this foundation, the toolkit highlights several strategic applications. Emergency managers can use SoCI data to prioritize preparedness outreach in communities with low bridging or linking capital, groups that may face barriers to receiving hazard information or accessing emergency resources (
Tierney 2014). Planners can incorporate SoCI components into resilience, hazard mitigation, and land-use plans, aligning with recommendations that social infrastructure and social capital be embedded within broader resilience frameworks (
Aldrich 2012). Public health agencies can apply SoCI insights to identify populations needing enhanced communication, translation services, or community liaison support, particularly during public health emergencies when information gaps can exacerbate disparities (
Kim and Schneider 2008).
Strengthening cross-sector collaboration is equally important. Research shows that resilience improves when local governments, nonprofits, faith organizations, and mutual-aid networks coordinate resources, share information, and build sustained relationships (
Chamlee-Wright and Storr 2011;
Imperiale and Vanclay 2016).
Table 7 encourages practitioners to intentionally cultivate these collaborative networks as part of routine preparedness and long-term resilience planning.
Monitoring change over time also enhances the strategic value of the SoCI. Because social capital evolves through civic-engagement programs, nonprofit expansion, and investments in public spaces, annual or biennial tracking of SoCI scores enables jurisdictions to evaluate whether social infrastructure and community-building initiatives are producing measurable improvements (
Cutter et al. 2010;
Fraser et al. 2024).
Finally, the toolkit stresses the need to interpret quantitative SoCI scores alongside qualitative, contextual information. Community feedback, stakeholder interviews, local histories, and ethnographic insights remain essential for capturing informal or culturally embedded forms of social capital—particularly in rural, tribal, and other marginalized communities where relational networks may be strong but not easily quantified (
Fine 2010;
Portes 1998).
Taken together, these applications demonstrate that when used holistically, the SoCI becomes a powerful decision-support tool that can guide equitable, socially grounded resilience planning. By linking quantitative indicators with qualitative knowledge and local expertise, practitioners can more effectively identify vulnerabilities, strengthen community ties, and build durable capacity for collective action and disaster resilience.
5.6. Limitations and Future Directions
Several limitations of this study merit recognition and point to important avenues for future research. First, the Social Capital Index (SoCI) is constructed at the community (county) level and therefore captures aggregate relational structures rather than individual-level social ties. While this approach aligns with the study’s focus on community capacity and disaster outcomes, it necessarily abstracts from the micro-level relational processes through which social capital is generated and enacted. Developing individual-level measures of social capital and examining how such relationships aggregate into community-level characteristics would offer valuable theoretical and empirical insight. However, comparable individual-level indicators are not currently available through publicly accessible datasets; addressing this gap would likely require the development of a national survey instrument and primary data collection, potentially supported through dedicated federal research funding.
Second, differences in indicator availability between 2010 and 2022 complicate direct longitudinal comparisons of the SoCI. Although the expanded 2022 index demonstrates improved conceptual coverage and predictive validity, future work may benefit from the development of harmonized “core” indicators to support more precise temporal analyses. In addition, county-level measurement may obscure important intra-county variation, particularly in large metropolitan areas where social capital, vulnerability, and resilience can vary substantially across neighborhoods.
Third, the measurement of linking social capital remains an important challenge. While employment-based and institutional indicators provide scalable proxies for institutional presence and potential access, they do not directly capture relational ties between community organizations and governmental actors. Future research would benefit from measures that explicitly assess cross-institutional relationships, such as formal partnerships, collaborative governance arrangements, or repeated interactions between civic groups and public agencies, and from methodologies capable of evaluating the strength and direction of these ties. Advancing such measures will likely require new administrative datasets or primary data collection, but would substantially improve the conceptual and empirical precision of linking social capital assessment.
Fourth, although this study has strengthened the theoretical articulation of social capital and incorporated explicit, testable hypotheses, further work is needed to examine nonlinear relationships, interaction effects, and the dynamic interplay between social capital, social infrastructure, and public policy. Machine-learning approaches, alternative weighting schemes, and disaggregated analyses of bonding, bridging, and linking capital may uncover distinct pathways through which communities build, lose, or transform social capital over time.
Finally, while the SoCI demonstrates applicability across multiple domains, including disaster resilience and economic outcomes, claims regarding its scope and explanatory power should continue to be interpreted with appropriate caution. Observed correlations may reflect broader socioeconomic and demographic structures—such as income distributions, housing conditions, and population characteristics—that shape both social capital and disaster impacts. Future research should continue to explore these alternative interpretations while leveraging the SoCI to examine clearly demonstrable empirical relationships.
Overall, despite these limitations, the expanded 2025 revision of the SoCI offers strong conceptual foundations, enhanced empirical validity, and broad interdisciplinary relevance. Paired with the Implementation Toolkit, the updated index provides researchers, planners, and policymakers with a robust, theory-driven instrument for diagnosing community capacity, guiding interventions, and advancing equitable resilience across U.S. counties.