
Super-Cocooning Against Property Crime: Do Visual Primes Affect Support and Does Race Matter


Abstract
1. Introduction
1.1. Super-Cocooning Effectiveness
1.2. Public Perceptions of Crime Prevention Strategies
1.3. The Present Study
2. Materials and Methods
2.1. Survey Distribution
2.2. Research Design
2.3. Variables
2.4. Analytic Strategy
3. Results
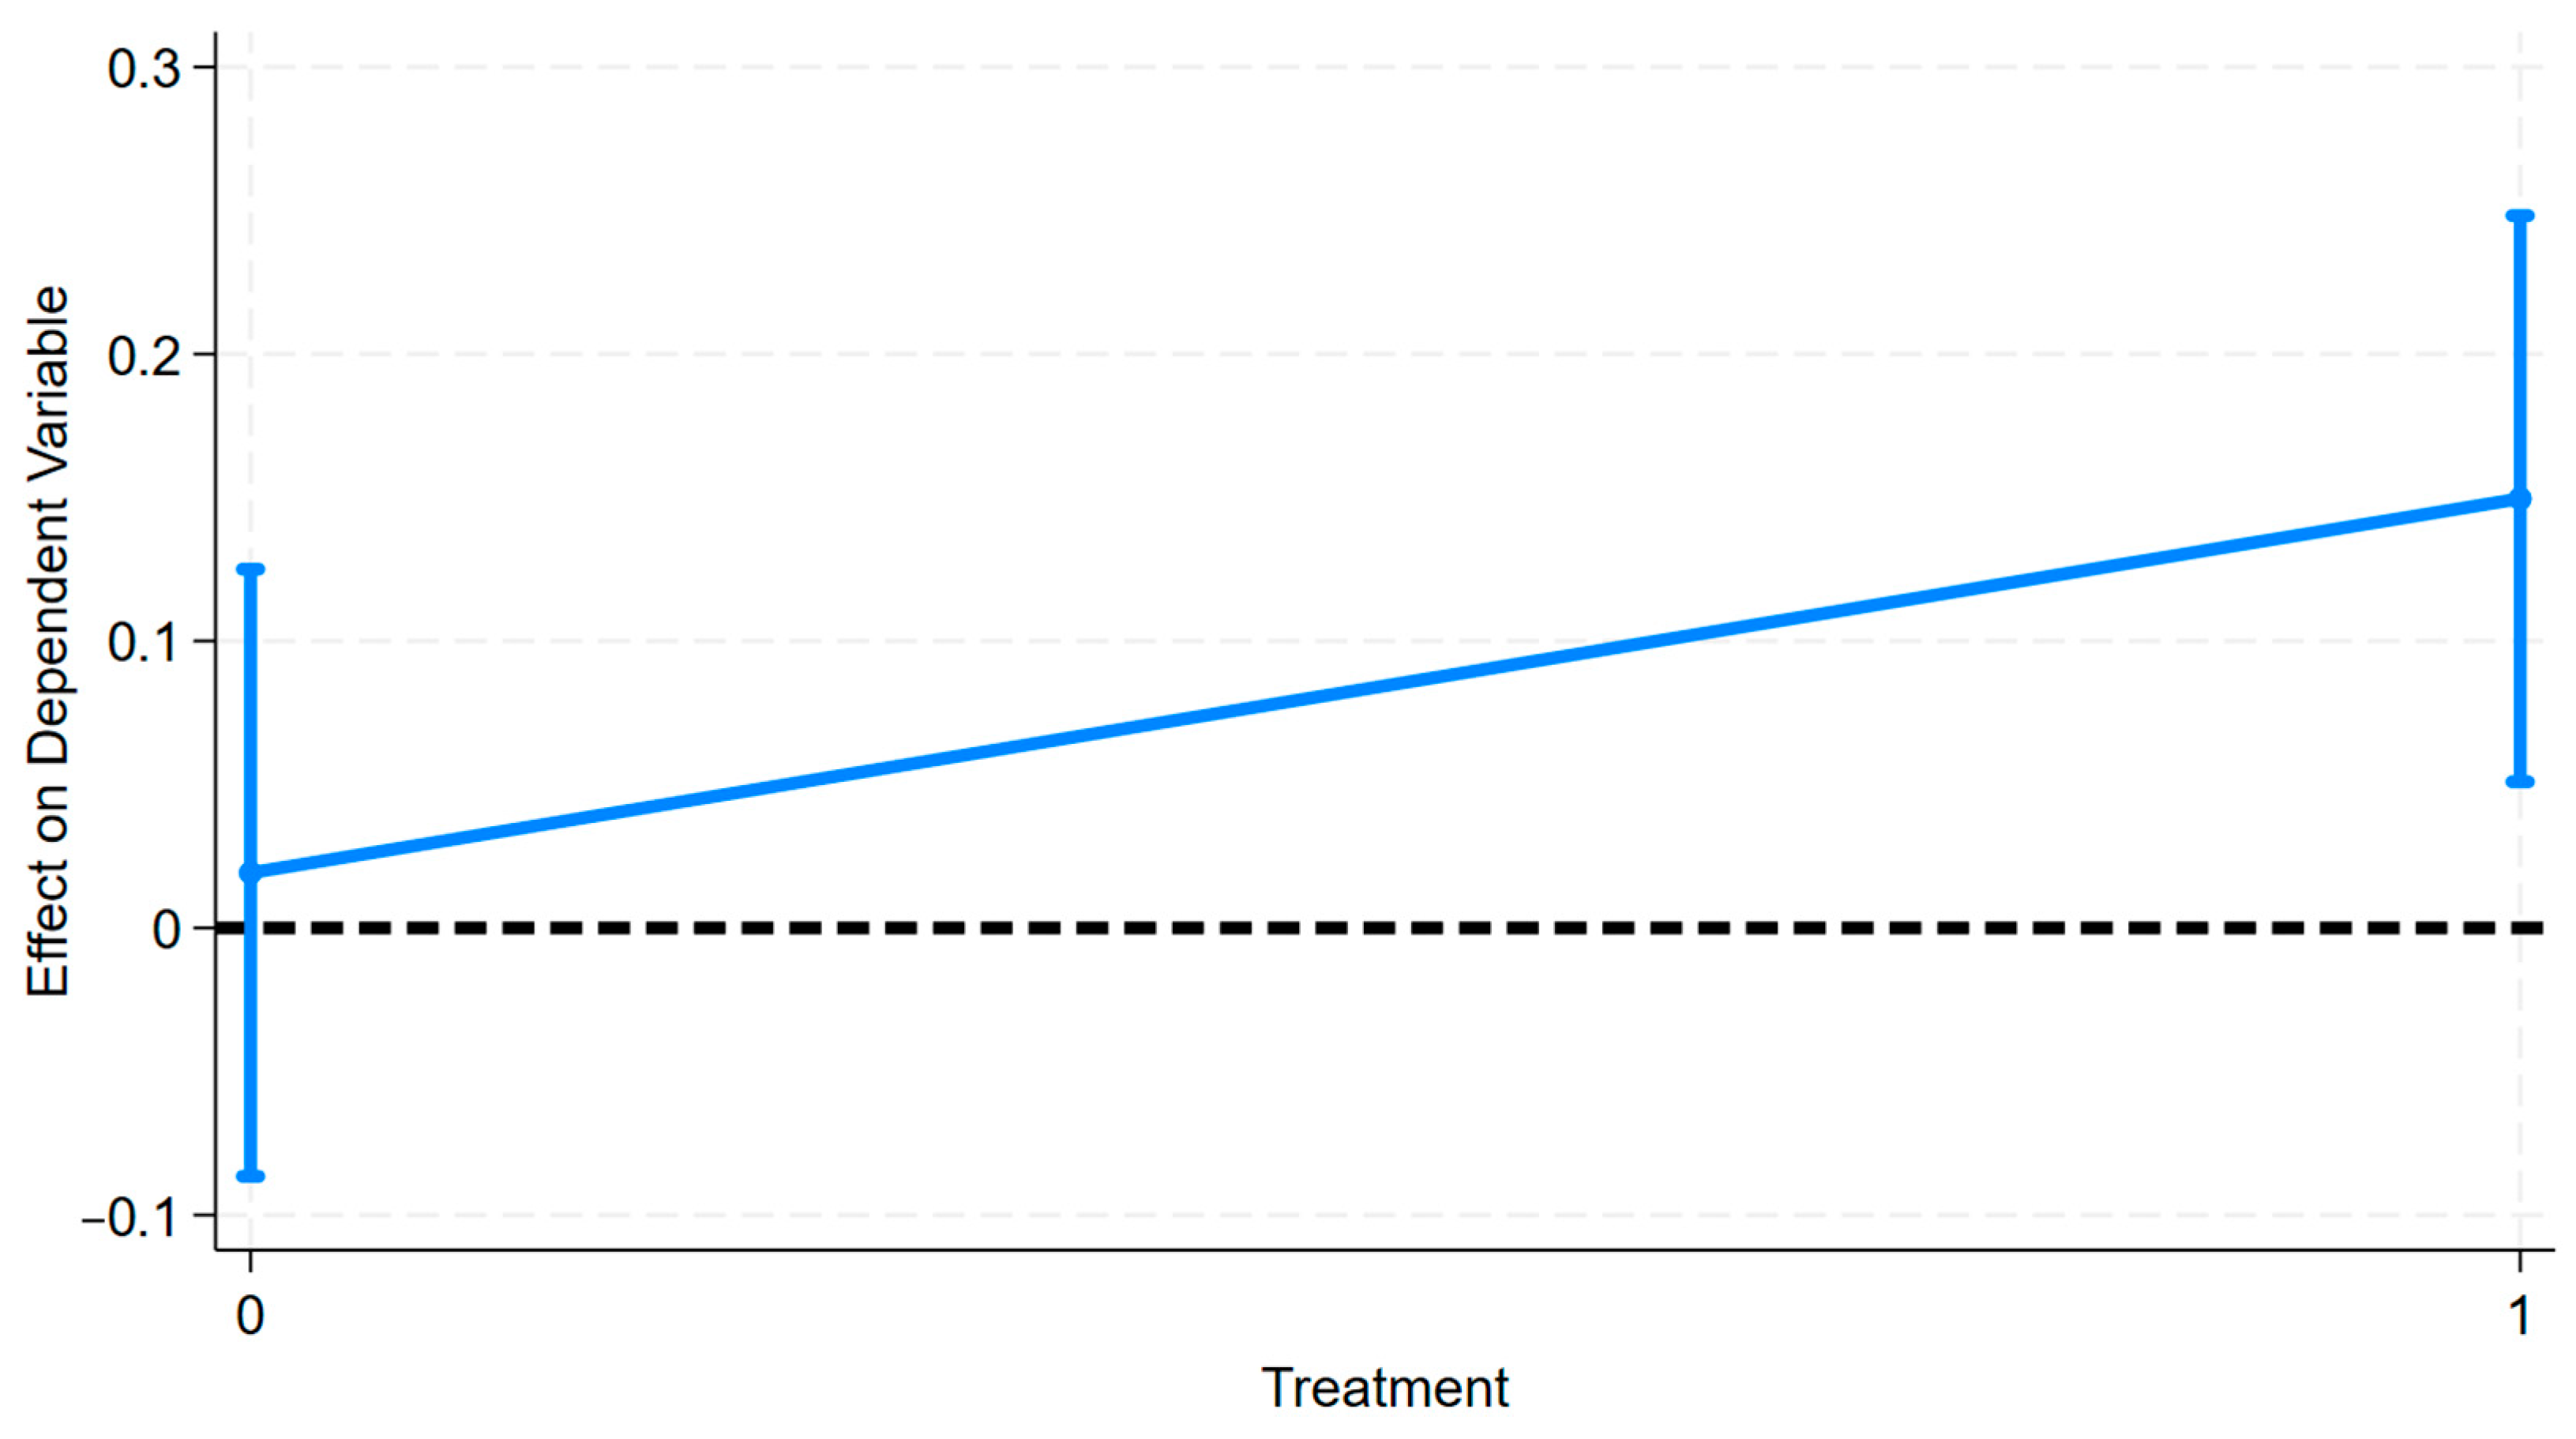
Heterogeneity Tests
4. Discussion
5. Conclusions
Author Contributions
Funding
Institutional Review Board Statement
Informed Consent Statement
Data Availability Statement
Conflicts of Interest
Appendix A

| Variable | Hanger Treatment (N = 1209) | Hanger Control (N = 1209) | Chi2 |
|---|---|---|---|
| Mean/% of Subsample | Mean/% of Subsample | p | |
| Trust and Confidence | 3.97 | 3.99 | 0.8 |
| Procedural Justice | 3.63 | 3.66 | 0.3 |
| Willingness To Obey | 3.88 | 3.87 | 0.9 |
| Political Ideology | |||
| Liberal | 15.62% | 13.24% | 0.1 |
| Moderate | 36.54% | 40.16% | 0.1 |
| Conservative | 47.84% | 46.60% | 0.6 |
| Gender | |||
| Male | 44.89% | 45.81% | 0.7 |
| Female | 55.11% | 54.19% | 0.7 |
| Race/Ethnicity | |||
| Black | 12.27% | 12.28% | 0.9 |
| Other Race | 7.31% | 8.65% | 0.2 |
| White | 80.42% | 79.07% | 0.4 |
| Non-White | 19.58% | 20.93% | 0.4 |
| Education | 0.7 | ||
| No diploma/GED | 0.35% | 0.69% | - |
| High school degree | 8.28% | 7.16% | - |
| Some college | 18.48% | 17.69% | - |
| Two-year degree | 14.30% | 14.84% | - |
| Four-year degree | 31.82% | 32.70% | - |
| Postgraduate degree | 26.77% | 26.92% | - |
| Age | 0.3 | ||
| 18–24 | 0.52% | 1.12% | - |
| 25–34 | 4.96% | 6.12% | - |
| 35–44 | 12.62% | 13.71% | - |
| 45–54 | 20.02% | 19.83% | - |
| 55–64 | 24.11% | 24.14% | - |
| 65+ | 37.77% | 35.09% | - |
| Married | 66.90% | 65.83% | 0.6 |
| Crime Victim | 9.57% | 9.40% | 0.9 |
| Employed | 51.35% | 53.02% | 0.4 |
| Police Contact | 31.94% | 31.63% | 0.9 |
| Variable | Mean/% | S.D. | Min–Max |
|---|---|---|---|
| Super-Cocooning Outcome | 4.04 | 0.74 | 1–5 |
| Trust and Confidence | 3.96 | 0.92 | 1–5 |
| Procedural Justice | 3.64 | 0.99 | 1–5 |
| Willingness To Obey | 3.87 | 0.74 | 1–5 |
| Liberal | 0.14 | 0.35 | 0–1 |
| Moderate | 0.38 | 0.49 | 0–1 |
| Conservative | 0.47 | 0.50 | 0–1 |
| Male | 0.45 | 0.50 | 0–1 |
| Female | 0.55 | 0.50 | 0–1 |
| Black | 0.12 | 0.33 | 0–1 |
| Other Race | 0.08 | 0.27 | 0–1 |
| White | 0.80 | 0.40 | 0–1 |
| Non-White | 0.20 | 0.40 | 0–1 |
| Education | 4.51 | 1.29 | 1–6 |
| No High School Degree | 0.52% | - | - |
| High School Degree | 7.72% | - | - |
| Some College but No Degree (yet) | 18.12% | - | - |
| 2-Year College Degree | 14.56% | - | - |
| 4-Year College Degree | 32.25% | - | - |
| Postgraduate Degree | 26.83% | - | - |
| Age | 4.70 | 1.28 | 1–6 |
| 18–24 | 0.82% | - | - |
| 25–34 | 5.54% | - | - |
| 35–44 | 13.17% | - | - |
| 45–54 | 19.92% | - | - |
| 55–64 | 24.12% | - | - |
| 65+ | 36.42% | - | - |
| Married | 0.66 | 0.47 | 0–1 |
| Crime Victim | 0.09 | 0.29 | 0–1 |
| Employed | 0.52 | 0.50 | 0–1 |
| Police Contact | 0.32 | 0.47 | 0–1 |
| Variables | Measures |
|---|---|
| Combined Mean Scale of Dependent Variable (alpha = 0.918) | [1] This is an effective strategy in preventing future neighborhood burglaries. [2] This strategy will increase my trust with police. [3] This strategy will help me feel safer in my neighborhood. [4] This strategy will make the police more visible in the neighborhood. [5] I would support police doing this in my neighborhood. [6] This strategy shows that police are aware of neighborhood crime. |
| Procedural Justice (alpha = 0.958) | [1] Treat everyone equally. [2] Clearly explain the reasons for their actions. [3] Treat people with dignity and respect. [4] Treat people fairly. [5] Respect people’s rights. [6] Listen to suspects before making any decisions about how to handle a case. |
| Trust and Confidence in Police (alpha = 0.939) | [1] The police protect people’s basic rights. [2] The police are generally honest. [3] Most police officers do their jobs well. [4] The police can be trusted to do what’s right for my neighborhood. |
| Willingness to Obey (alpha = 0.779) | [1] I always try to follow the law even when I think it is wrong. [2] You should do what the police tell you even if you disagree. [3] You should accept police decisions even if you think they are wrong. [4] People should obey the law even if it goes against what they think is right. |
| Variable | All Groups | Treatment | Control |
|---|---|---|---|
| Mean (S.D.) | Mean (S.D.) | Mean (S.D.) | |
| Effective in preventing future burglaries | 0.65 (0.47) | 0.65 (0.48) | 0.65 (0.48) |
| Will increase trust in police | 0.65 (0.47) | 0.64 (0.48) | 0.66 (0.47) |
| It will help me feel safer in my neighborhoods | 0.69 (0.46) | 0.67 (0.47) | 0.71 (0.46) |
| It will make the police more visible in the neighborhood | 0.87 (0.33) | 0.85 (0.35) | 0.89 (0.31) |
| I would support police doing this in my neighborhood | 0.88 (0.33) | 0.87 (0.34) | 0.89 (0.32) |
| This strategy shows that police are aware of neighborhood crime | 0.91 (0.28) | 0.92 (0.28) | 0.91 (0.29) |
| Dependent Variables | Treatment | Control | p |
|---|---|---|---|
| Mean (S.D.) | Mean (S.D.) | ||
| Combined mean scale (alpha = 0.918) | 4.015 (0.74) | 4.063 (0.74) | 0.113 |
| Effective in preventing future burglaries | 3.798 (0.97) | 3.792 (1.00) | 0.884 |
| Will increase trust in police | 3.792 (0.94) | 3.855 (0.96) | 0.104 |
| It will help me feel safer in my neighborhoods | 3.813 (0.99) | 3.911 (0.98) | 0.015 |
| It will make the police more visible in the neighborhood | 4.157 (0.81) | 4.174 (0.75) | 0.000 |
| I would support police doing this in my neighborhood | 4.245 (0.83) | 4.271 (0.82) | 0.441 |
| This strategy shows that police are aware of neighborhood crime | 4.284 (0.73) | 4.269 (0.74) | 0.625 |

| 1 | These statements were presented to respondents in random order. |
| 2 | For the main heterogeneity tests of non-White X treatment, we used the non-White category as it provides a larger sub-sample than parsing out Black from non-White. As discussed below, we also estimated these interactions on Black respondents, in which findings did not substantively change. |
References
- AAPOR. 2023. American Association for Public Opinion Research. Available online: https://aapor.org/response-rates/ (accessed on 29 March 2025).
- Adams, Ian T., Scott M. Mourtgos, and Justin Nix. 2023. Turnover in Large US Policing Agencies Following the George Floyd Protests. Journal of Criminal Justice 88: 102105. [Google Scholar] [CrossRef]
- Ariel, Barak, Cristobal Weinborn, and Lawrence W. Sherman. 2016. ‘Soft’ Policing at Hot Spots—Do Police Community Support Officers Work? A Randomized Controlled Trial. Journal of Experimental Criminology 12: 277–317. [Google Scholar] [CrossRef]
- Bannister, Jon, Monsuru Adepeju, and Mark Ellison. 2025. Is the Policing Prioritisation of and Response to Crime Equitable? An Examination of Frontline Policing Deployment to Incidents of Violence-against-the-Person. In Handbook on Crime and Inequality. Cheltenham: Edward Elgar Publishing, pp. 126–47. [Google Scholar]
- Boehme, Hunter M., and Scott M. Mourtgos. 2024. The Effect of Formal De-Policing on Police Traffic Stop Behavior and Crime Rates: Early Evidence from LAPD’s Policy to Restrict Discretionary Traffic Stops. Criminology & Public Policy 23: 517–42. [Google Scholar]
- Boehme, Hunter M., Brandon Tregle, and Cory Schnell. 2025. ‘You Keep Me Hanging on’: Evidence from the Columbia Door Hanger Experiment. Journal of Experimental Criminology, 1–16. [Google Scholar] [CrossRef]
- Boehme, Hunter M., Deanna Cann, and Deena A. Isom. 2022. Citizens’ Perceptions of over-and under-Policing: A Look at Race, Ethnicity, and Community Characteristics. Crime & Delinquency 68: 123–54. [Google Scholar]
- Boehme, Hunter M., Sohee Jung, Irick A. Geary, Jr., Robert A. Brown, and Peter Leasure. 2024. Does the Public Want the Police to Stop, Stopping? An Experimental Look at the Impact of Outcome Data on Public Perceptions of Police Discretionary Traffic Stops. Journal of Experimental Criminology, 1–18. [Google Scholar] [CrossRef]
- Bowers, Kate J., and Shane D. Johnson. 2004. Who Commits near Repeats? A Test of the Boost Explanation. Western Criminology Review 5: 12–24. [Google Scholar]
- Braga, Anthony A., Brandon S. Turchan, Andrew V. Papachristos, and David M. Hureau. 2019. Hot Spots Policing and Crime Reduction: An Update of an Ongoing Systematic Review and Meta-Analysis. Journal of Experimental Criminology 15: 289–311. [Google Scholar] [CrossRef]
- Brunson, Rod K. 2007. ‘Police Don’t like Black People’: African-American Young Men’s Accumulated Police Experiences. Criminology & Public Policy 6: 71–101. [Google Scholar]
- Busenbark, John R., Scott D. Graffin, Robert J. Campbell, and Eric Young Lee. 2022. A Marginal Effects Approach to Interpreting Main Effects and Moderation. Organizational Research Methods 25: 147–69. [Google Scholar] [CrossRef]
- De Waardt, Mijke. 2016. Naming and Shaming Victims: The Semantics of Victimhood. International Journal of Transitional Justice 10: 432–50. [Google Scholar] [CrossRef]
- Gau, Jacinta M., and Rod K. Brunson. 2010. Procedural Justice and Order Maintenance Policing: A Study of Inner-city Young Men’s Perceptions of Police Legitimacy. Justice Quarterly 27: 255–79. [Google Scholar] [CrossRef]
- Geller, Amanda, Jeffrey Fagan, Tom Tyler, and Bruce G. Link. 2014. Aggressive Policing and the Mental Health of Young Urban Men. American Journal of Public Health 104: 2321–27. [Google Scholar] [CrossRef] [PubMed]
- Gibson, Chris L., Jihong Zhao, Nicholas P. Lovrich, and Michael J. Gaffney. 2002. Social Integration, Individual Perceptions of Collective Efficacy, and Fear of Crime in Three Cities. Justice Quarterly 19: 537–64. [Google Scholar] [CrossRef]
- Hagan, John, Carla Shedd, and Monique R. Payne. 2005. Race, Ethnicity, and Youth Perceptions of Criminal Injustice. American Sociological Review 70: 381–407. [Google Scholar] [CrossRef]
- Johnson, Shane D. 2008. Repeat Burglary Victimisation: A Tale of Two Theories. Journal of Experimental Criminology 4: 215–40. [Google Scholar] [CrossRef]
- Johnson, Shane D., and Kate J. Bowers. 2010. Permeability and Burglary Risk: Are Cul-de-Sacs Safer? Journal of Quantitative Criminology 26: 89–111. [Google Scholar] [CrossRef]
- Johnson, Shane D., Toby Davies, Alex Murray, Paul Ditta, Jyoti Belur, and Kate Bowers. 2017. Evaluation of Operation Swordfish: A near-Repeat Target-Hardening Strategy. Journal of Experimental Criminology 13: 505–25. [Google Scholar] [CrossRef]
- Keeter, Scott, Nick Hatley, Courtney Kennedy, and Arnold Lau. 2017. What Low Response Rates Mean for Telephone Surveys. Pew Research Center 15: 1–39. [Google Scholar]
- Koper, Christopher S., Weiwei Liu, Bruce G. Taylor, Xiaoyun Wu, William D. Johnson, and Jackie Sheridan. 2024. The Effects of Hot Spot Policing on Community Experiences and Perceptions in a Time of COVID-19 and Calls for Police Reform. Police Quarterly 27: 292–334. [Google Scholar] [CrossRef]
- Leeper, Thomas J. 2017. Interpreting Regression Results Using Average Marginal Effects with R’s Margins. Available at the Comprehensive R Archive Network (CRAN) 32: 1–32. [Google Scholar]
- Mailers Haven. 2023. The Highest Quality: Most Responsive Mailing Lists. Available online: https://www.mailershaven.com/ (accessed on 29 March 2025).
- Mazerolle, Lorraine, and Janet Ransley. 2006. Third Party Policing. Cambridge, UK: Cambridge University Press. [Google Scholar]
- Mazerolle, Lorraine, Sarah Bennett, Jacqueline Davis, Elise Sargeant, and Matthew Manning. 2013. Procedural justice and police legitimacy: A systematic review of the research evidence. Journal of Experimental Criminology 9: 245–74. [Google Scholar] [CrossRef]
- Metcalfe, Christi, and Justin T. Pickett. 2018. The Extent and Correlates of Public Support for Deterrence Reforms and Hot Spots Policing. Law & Society Review 52: 471–502. [Google Scholar]
- Mourtgos, Scott M., Ian T. Adams, and Justin Nix. 2022. Elevated Police Turnover Following the Summer of George Floyd Protests: A Synthetic Control Study. Criminology & Public Policy 21: 9–33. [Google Scholar]
- Mourtgos, Scott M., Ian T. Adams, and Justin Nix. 2024. Staffing Levels Are the Most Important Factor Influencing Police Response Times. Policing: A Journal of Policy and Practice 18: paae002. [Google Scholar] [CrossRef]
- O’Brien, Timothy L. 2020. Arresting Confidence: Mass Incarceration and Black–White Differences in Perceptions of Legal Authorities. Social Science Quarterly 101: 1905–19. [Google Scholar] [CrossRef]
- Pease, Ken. 1998. Repeat Victimisation: Taking Stock. London: Home Office Police Research Group, vol. 90. [Google Scholar]
- Pease, Ken, and Gloria Laycock. 1999. Revictimisation: Reducing the Heat on Hot Victims. Trends & Issues in Crime & Criminal Justice (128). Available online: https://www.aic.gov.au/publications/tandi/tandi128 (accessed on 9 July 2025).
- Peck, Jennifer H. 2015. Minority Perceptions of the Police: A State-of-the-Art Review. Policing: An International Journal of Police Strategies & Management 38: 173–203. [Google Scholar]
- Pegram, Roger, Geoffrey C. Barnes, Molly Slothower, and Heather Strang. 2018. Implementing a Burglary Prevention Program with Evidence-Based Tracking: A Case Study. Cambridge Journal of Evidence-Based Policing 2: 181–91. [Google Scholar] [CrossRef]
- Pickett, Justin T. 2017. Methodological Myths and the Role of Appeals in Criminal Justice Journals: The Case of Response Rates. ACJS Today 41: 61–69. [Google Scholar]
- Pickett, Justin T., Frank Cullen, Shawn D. Bushway, Ted Chiricos, and Geoffrey Alpert. 2018. The Response Rate Test: Nonresponse Bias and the Future of Survey Research in Criminology and Criminal Justice. Available online: http://www.asc41.com/Criminologist/2018/Jan-Feb_2018_TheCriminologist.pdf (accessed on 9 July 2025).
- Ratcliffe, Jerry H., and George Kikuchi. 2019. Harm-Focused Offender Triage and Prioritization: A Philadelphia Case Study. Policing: An International Journal 42: 59–73. [Google Scholar] [CrossRef]
- Reid, Lesley Williams, J. Timmons Roberts, and Heather Monro Hilliard. 1998. Fear of Crime and Collective Action: An Analysis of Coping Strategies. Sociological Inquiry 68: 312–28. [Google Scholar] [CrossRef]
- Sampson, Robert J., and Janet L. Lauritsen. 1994. Violent Victimization and Offending: Individual-, Situational-, and Community-Level Risk Factors. In Understanding and Preventing Violence, Vol. 3. Social Influences. Washington, DC: National Academy Press. [Google Scholar]
- Schnell, Cory. 2024. ‘Don’t Call It a Comback!’ A Study of Repeat Victimization and the Cycle of Violence at Micro-Places. Security Journal 37: 1483–508. [Google Scholar] [CrossRef]
- Sherman, Lawrence W. 2022. ‘Just Right’ Policing: A Job for Science. Cambridge Journal of Evidence-Based Policing 6: 134–39. [Google Scholar] [CrossRef]
- Sherman, Lawrence W., Heather Strang, Katrin Mueller-Johnson, Cristobal Weinborn, Sara Valdebenito, Kent McFadzien, and Lucy Strang. 2017. Mobilizing Civil Society against Residential Burglary. The Evidence. Available online: https://www.tryghed.dk/-/media/files/pdf/publikationer/trivsel/mobilising-civil-society-against-residential-burglary---the-evidence.pdf (accessed on 9 July 2025).
- Simpson, Rylan, Mark McCutcheon, and Darryl Lal. 2020. Reducing Speeding via Inanimate Police Presence: An Evaluation of a Police-directed Field Study Regarding Motorist Behavior. Criminology & Public Policy 19: 997–1018. [Google Scholar]
- Smith, Michael R., Rob Tillyer, and Brandon Tregle. 2024. Hot Spots Policing as Part of a City-Wide Violent Crime Reduction Strategy: Initial Evidence from Dallas. Journal of Criminal Justice 90: 102091. [Google Scholar] [CrossRef]
- Stokes, Nicola, and Joseph Clare. 2019. Preventing Near-Repeat Residential Burglary through Cocooning: Post Hoc Evaluation of a Targeted Police-Led Pilot Intervention. Security Journal 32: 45–62. [Google Scholar] [CrossRef]
- Thompson, Alexandra, and Susannah N. Tapp. 2022. Criminal Victimization, 2022. Bureau of Justice Statistics. Available online: https://peerreviewedpolitics.com/pdf/2024/09/06/cv22.pdf (accessed on 9 July 2025).
- Tregle, Brandon, Robert Tillyer, and Mike Smith. 2024. Hot Spots Policing: Assessing the Impact on Officer-Initiated Activity. Police Quarterly, 10986111251317475. [Google Scholar] [CrossRef]
- Tyler, Tom R., and Jeffrey Fagan. 2008. Legitimacy and Cooperation: Why Do People Help the Police Fight Crime in Their Communities. Ohio State Journal of Criminal Law 6: 231. [Google Scholar] [CrossRef]
- Tyler, Tom R., and Yuen J. Huo. 2002. Trust in the Law: Encouraging Public Cooperation with the Police and Courts. Russell Sage Foundation. New York: Russell Sage Foundation. [Google Scholar]
- Tyler, Tom R., Jeffrey Fagan, and Amanda Geller. 2014. Street Stops and Police Legitimacy: Teachable Moments in Young Urban Men’s Legal Socialization. Journal of Empirical Legal Studies 11: 751–85. [Google Scholar] [CrossRef]
- Tyler, Tom R., Jonathan Jackson, and Avital Mentovich. 2015. The consequences of being an object of suspicion: Potential pitfalls of proactive police contact. Journal of Empirical Legal Studies 12: 602–36. [Google Scholar] [CrossRef]
- Vaughn, Paige E., Kyle Peyton, and Gregory A. Huber. 2022. Mass Support for Proposals to Reshape Policing Depends on the Implications for Crime and Safety. Criminology & Public Policy 21: 125–46. [Google Scholar]
- Weems, James R. 2014. Testing PCSO Cocooning of near Repeat Burglary Locations. Unpublished Master’s thesis, Institute of Criminology, University of Cambridge, Cambridge, UK. [Google Scholar]
- Weisburd, David. 2011. Effects of Problem-Oriented Policing on Crime and Disorder. Collingdale: Diane Publishing. [Google Scholar]
- Weitzer, Ronald, and Steven A. Tuch. 2004. Race and perceptions of police misconduct. Social Problems 51: 305–25. [Google Scholar] [CrossRef]
- Williams, Richard. 2012. Using the Margins Command to Estimate and Interpret Adjusted Predictions and Marginal Effects. The Stata Journal 12: 308–31. [Google Scholar] [CrossRef]
| AME (S.E.) | p | 95% C.I. | |
|---|---|---|---|
| Treatment | −0.048 (0.030) | 0.113 | −0.107–0.011 |
| N | 2412 | ||
| R-Squared | 0.001 | ||
| RMSE | 0.744 | ||
| AME (S.E) | p | 95% C.I. | |
|---|---|---|---|
| Treatment | −0.033 (0.027) | 0.211 | −0.085–0.019 |
| Trust/Confidence | 0.180 (0.033) | 0.000 | 0.115–0.245 |
| Legitimacy | 0.195 (0.029) | 0.000 | 0.139–0.251 |
| Obey | 0.118 (0.023) | 0.000 | 0.073–0.164 |
| Liberal | 0.001 (0.044) | 0.986 | −0.086–0.088 |
| Moderate | 0.025 (0.030) | 0.399 | −0.033–0.083 |
| Non-White | 0.082 (0.028) | 0.028 | 0.009–0.156 |
| Male | −0.127 (0.028) | 0.000 | −0.182–−0.072 |
| Education | −0.026 (0.010) | 0.012 | −0.046–−0.006 |
| Age | 0.001 (0.014) | 0.962 | −0.026–0.027 |
| Married | −0.004 (0.029) | 0.898 | −0.061–0.054 |
| Employed | −0.020 (0.032) | 0.525 | −0.082–0.042 |
| Crime Victim | −0.006 (0.054) | 0.916 | −0.113–0.101 |
| Police Contact | −0.005 (0.030) | 0.866 | −0.064–0.054 |
| N | 2247 | ||
| R-Squared | 0.288 | ||
| RMSE | 0.625 | ||
| AME (S.E.) | p | C.I. | |
|---|---|---|---|
| Treatment X Non-White | 0.150 (0.050) | 0.003 | 0.051–0.248 |
| Control X Non-White | 0.019 (0.054) | 0.721 | −0.087–0.125 |
| Trust/Confidence | 0.180 (0.003) | 0.000 | 0.115–0.245 |
| Legitimacy | 0.195 (0.029) | 0.000 | 0.139–0.252 |
| Obey | 0.117 (0.023) | 0.000 | 0.072–0.162 |
| Liberal | 0.000 (0.044) | 0.994 | −0.087–0.087 |
| Moderate | 0.024 (0.029) | 0.414 | −0.034–0.082 |
| Male | −0.129 (0.028) | 0.000 | −0.184–−0.074 |
| Education | −0.026 (0.010) | 0.012 | −0.046–−0.006 |
| Age | 0.001 (0.014) | 0.932 | −0.025–0.028 |
| Married | −0.004 (0.029) | 0.891 | −0.062–0.054 |
| Employed | −0.017 (0.032) | 0.580 | −0.079–0.044 |
| Crime Victim | −0.008 (0.055) | 0.877 | −0.115–0.099 |
| Police Contact | −0.005 (0.030) | 0.878 | −0.063–0.054 |
| N | 2247 | ||
| R-Squared | 0.290 | ||
| RMSE | 0.624 |
Disclaimer/Publisher’s Note: The statements, opinions and data contained in all publications are solely those of the individual author(s) and contributor(s) and not of MDPI and/or the editor(s). MDPI and/or the editor(s) disclaim responsibility for any injury to people or property resulting from any ideas, methods, instructions or products referred to in the content. |
© 2025 by the authors. Licensee MDPI, Basel, Switzerland. This article is an open access article distributed under the terms and conditions of the Creative Commons Attribution (CC BY) license (https://creativecommons.org/licenses/by/4.0/).
Share and Cite
Boehme, H.M.; Tregle, B. Super-Cocooning Against Property Crime: Do Visual Primes Affect Support and Does Race Matter. Soc. Sci. 2025, 14, 429. https://doi.org/10.3390/socsci14070429
Boehme HM, Tregle B. Super-Cocooning Against Property Crime: Do Visual Primes Affect Support and Does Race Matter. Social Sciences. 2025; 14(7):429. https://doi.org/10.3390/socsci14070429
Chicago/Turabian StyleBoehme, Hunter M., and Brandon Tregle. 2025. "Super-Cocooning Against Property Crime: Do Visual Primes Affect Support and Does Race Matter" Social Sciences 14, no. 7: 429. https://doi.org/10.3390/socsci14070429
APA StyleBoehme, H. M., & Tregle, B. (2025). Super-Cocooning Against Property Crime: Do Visual Primes Affect Support and Does Race Matter. Social Sciences, 14(7), 429. https://doi.org/10.3390/socsci14070429