

What Are the Statistics That Improve Education?

 ,
,  , , , ,
  , ,
, ,  and
and
Abstract
1. Introduction
2. Materials and Methods
2.1. Research Questions
2.2. Research Design
2.3. Collection of Data Sources
- -
- UNESCO (UIS browser);
- -
- OECD (PISA, TIMSS, and PIRLS);
- -
- Europe (Education at a glance, OECD Data explorer, Eurostat Database);
- -
- World Bank (World Bank Open Data).
2.4. Data Analysis

| Country | Cohort | Educational Level | Year | Age | Boys’ Enrolment | Girls’ Enrollment | Total Enrolment | Risk of Poverty (%) | Risk of Poverty Children Under 18 (%) | Investment in Education (Million Euros) | Education Expenditure (GDP %) |
|---|---|---|---|---|---|---|---|---|---|---|---|
| Belgium | 1999 | Primary | 2005–2006 | 6–7 | 55,507 | 54,472 | 109,979 | ND | ND | ND | 1.40 |
| Belgium | 1999 | Primary | 2006–2007 | 7–8 | 59,605 | 57,023 | 116,628 | ND | 12.2 | ND | 1.41 |
| Belgium | 1999 | Primary | 2007–2008 | 8–9 | 59,880 | 57,339 | 117,219 | ND | 13.3 | ND | 1.41 |
| Belgium | 1999 | Primary | 2008–2009 | 9–10 | 60,191 | 57,578 | 117,769 | ND | 14.4 | ND | 1.53 |
| Belgium | 1999 | Primary | 2009–2010 | 10–11 | 60,468 | 57,843 | 118,311 | ND | 11.7 | ND | 1.5 |
| Belgium | 1999 | Primary | 2010–2011 | 11–12 | 59,859 | 57,149 | 117,008 | ND | 14.8 | ND | 1.55 |
| Belgium | 1999 | Lower secondary | 2011–2012 | 12–13 | 45,786 | 45,746 | 91,532 | 21 | 14.3 | ND | 2.8 |
| Belgium | 1999 | Lower secondary | 2012–2013 | 13–14 | 59,039 | 56,491 | 115,530 | 21.6 | 12.8 | 3672.70 | ND |
| Belgium | 1999 | Upper secondary | 2013–2014 | 14–15 | 38,956 | 40,979 | 79,935 | 20.8 | 13.3 | 7561.7 | ND |
| Belgium | 1999 | Upper secondary | 2014–2015 | 15–16 | 54,300 | 53,813 | 108,113 | 21.2 | 13.2 | 7619.5 | ND |
| Belgium | 1999 | Upper secondary | 2015–2016 | 16–17 | 57,898 | 57,068 | 114,966 | 21.1 | 13.9 | 7734.70 | ND |
| Belgium | 1999 | Upper secondary | 2016–2017 | 17–18 | 57,579 | 56,663 | 114,242 | 20.9 | 14 | 7866.40 | ND |
| Belgium | 1999 | Upper secondary | 2017–2018 | 18–19 | NA | NA | NA | 20.6 | 13 | 8070.10 | ND |
| Belgium | 2004 | Primary | 2010–2011 | 6–7 | 55,794 | 54,706 | 110,500 | ND | 14 | ND | 1.55 |
| Belgium | 2004 | Primary | 2011–2012 | 7–8 | 59,852 | 57,330 | 117,182 | 21 | 14.3 | ND | 1.53 |
| Belgium | 2004 | Primary | 2012–2013 | 8–9 | 60,300 | 57,750 | 118,050 | 21.6 | 12.8 | 6231.30 | ND |
| Belgium | 2004 | Primary | 2013–2014 | 9–10 | 60,559 | 57,965 | 118,524 | 20.8 | 13.3 | 6311.80 | ND |
| … | … | … | … | … | … | … | … | … | … | … | … |
| Country | Cohort | Educational Level | Year | Age | Achieving in Mathematics (%) Both Sexes | Achieving in Mathematics (%) Both Sexes—Rural | Achieving in Mathematics (%) Both Sexes—Urban | Achieving in Mathematics (%) Both Sexes—Immigrant | Achieving in Mathematics (%) Both Sexes—Poor Socioeconomic Background |
|---|---|---|---|---|---|---|---|---|---|
| Bulgaria | 1999 | Pre-Primary | 2005–2006 | 6–7 | |||||
| Bulgaria | 1999 | Primary | 2006–2007 | 7–8 | |||||
| Bulgaria | 1999 | Primary | 2007–2008 | 8–9 | |||||
| Bulgaria | 1999 | Primary | 2008–2009 | 9–10 | |||||
| Bulgaria | 1999 | Primary | 2009–2010 | 10–11 | |||||
| Bulgaria | 1999 | Lower Secondary | 2010–2011 | 11–12 | |||||
| Bulgaria | 1999 | Lower Secondary | 2011–2012 | 12–13 | |||||
| Bulgaria | 1999 | Lower Secondary | 2012–2013 | 13–14 | 56.24 | ||||
| Bulgaria | 1999 | Upper Secondary | 2013–2014 | 14–15 | |||||
| Bulgaria | 1999 | Upper Secondary | 2014–2015 | 15–16 | |||||
| Bulgaria | 1999 | Upper Secondary | 2015–2016 | 16–17 | |||||
| Bulgaria | 1999 | Upper Secondary | 2016–2017 | 17–18 | |||||
| Bulgaria | 1999 | Upper Secondary | 2017–2018 | 18–19 | |||||
| Bulgaria | 2004 | Pre-Primary | 2010–2011 | 6–7 | |||||
| Bulgaria | 2004 | Primary | 2011–2012 | 7–8 | |||||
| Bulgaria | 2004 | Primary | 2012–2013 | 8–9 | |||||
| Bulgaria | 2004 | Primary | 2013–2014 | 9–10 | |||||
| Bulgaria | 2004 | Primary | 2014–2015 | 10–11 | |||||
| Bulgaria | 2004 | Lower Secondary | 2015–2016 | 11–12 | |||||
| … | … | … | … | … | … | … | … | … | … |
| SPAIN | Cohort | Educational Level | Year | Age | Enrollment (Non-Compulsory)— No. Students | Non-Compulsory Enrollment Rate | Repetition Rate—Total | Public School Repetition Rate | Private School Repetition Rate | Promotion Rate (Based on Enrolled Students)—Total | Public Promotion Rate (per Enrollment) |
|---|---|---|---|---|---|---|---|---|---|---|---|
| Catalonia | 1999 | Early childhood education | 2000–2001 | 1 | 15.940 | 26.5 | |||||
| Catalonia | 1999 | Early childhood education | 2001–2002 | 2 | 30.175 | 49.3 | |||||
| Catalonia | 1999 | Early childhood education | 2002–2003 | 3 | 181.397 | 99.3 | |||||
| Catalonia | 1999 | Early childhood education | 2003–2004 | 4 | 190.990 | 99.4 | |||||
| Catalonia | 1999 | Early childhood education | 2004–2005 | 5 | 198.705 | 98.4 | |||||
| Catalonia | 1999 | Primary | 2005–2006 | 6 | 1.5 | 1.9 | 0.8 | ||||
| Catalonia | 1999 | Primary | 2006–2007 | 7 | 1.6 | 1.9 | 1.1 | ||||
| Catalonia | 1999 | Primary | 2007–2008 | 8 | 1.1 | 1.2 | 0.9 | ||||
| Catalonia | 1999 | Primary | 2008–2009 | 9 | 1.4 | 1.6 | 1.1 | ||||
| Catalonia | 1999 | Primary | 2009–2010 | 10 | 1 | 1.2 | 0.9 | ||||
| Catalonia | 1999 | Primary | 2010–2011 | 11 | 1.2 | 1.2 | 1.3 | ||||
| Catalonia | 1999 | Lower secondary | 2011–2012 | 12 | 6 | 7.6 | 3.3 | 67.9 | 62 | ||
| Catalonia | 1999 | Lower secondary | 2012–2013 | 13 | 6.1 | 7.8 | 3.3 | 63 | 56.4 | ||
| Catalonia | 1999 | Lower secondary | 2013–2014 | 14 | 6.1 | 7.9 | 3.2 | 60.3 | 53.1 | ||
| … | … | … | … | … | … | … | … | … | … | … | … |
| Country | Cohort | Educational Level | Year | Age | Adjusted Net Enrollment Rate, Primary (%) | Adjusted Net Enrollment Rate, Primary, Female (%) | Adjusted Net Enrollment Rate, Primary, Male (%) | Adolescents out of School (% of Lower Secondary School Age) | Adolescents out of School, Female (% of Female Lower Secondary School Age) |
|---|---|---|---|---|---|---|---|---|---|
| Spain | 1999 | Primary | 2005–2006 | 6 | |||||
| Spain | 1999 | Primary | 2006–2007 | 7 | 99.83884 | ||||
| Spain | 1999 | Primary | 2007–2008 | 8 | |||||
| Spain | 1999 | Primary | 2008–2009 | 9 | |||||
| Spain | 1999 | Primary | 2009–2010 | 10 | |||||
| Spain | 1999 | Primary | 2010–2011 | 11 | |||||
| Spain | 1999 | Lower secondary | 2011–2012 | 12 | 1.443889976 | 1.387030005 | |||
| Spain | 1999 | Lower secondary | 2012–2013 | 13 | 2.105979919 | 2.024679899 | |||
| Spain | 1999 | Lower secondary | 2013–2014 | 14 | 2.346560001 | 2.132250071 | |||
| Spain | 1999 | Lower secondary | 2005–2006 | 15 | 2.625780106 | 2.434959888 | |||
| Spain | 1999 | Upper secondary | 2006–2007 | 16 | |||||
| Spain | 1999 | Upper secondary | 2007–2008 | 17 | |||||
| Spain | 1999 | Upper secondary | 2008–2009 | 18 | |||||
| Spain | 2004 | Primary | 2010–2011 | 6 | |||||
| Spain | 2004 | Primary | 2011–2012 | 7 | |||||
| Spain | 2004 | Primary | 2012–2013 | 8 | |||||
| Spain | 2004 | Primary | 2013–2014 | 9 | 99.60787 | ||||
| … | … | … | … | … | … | … | … | … | … |
3. Results
3.1. Subsection Sources for the Cohort Longitudinal Study of Educational Trajectory (RQ1)
3.2. Types of Information We Can Find in Selected Data Sources (RQ2)
3.3. Scope of Available Source Data in Education (RQ3)
4. Discussion
- (1)
- We have national and international statistical data sources that provide information on various aspects related to education and learning, investment in education, the school system, teachers, education levels, educational attainment, graduates, and more, controlled by numerous specific variables (such as sex, mothers’ level of education, school ownership, Internet access, and the number of books in the home). The data consist of either census or sample data. Census data is typically longitudinal (year to year), while sample data are collected periodically; however, as they are samples, they do not strictly meet longitudinal criteria. PISA, TIMSS, PIRLS, and PIAAC are longitudinal from the perspective of the country, not from the perspective of the cohorts participating in the study.
- (2)
- These data allow us to understand significant trends in education and specific aspects that we can infer through the development of models, utilizing statistical techniques, while always assuming certain margins of reliability. Predictive models in education are rare and can be significantly affected by uncontrolled variables whose effects are unknown. The level of prediction is limited in scope and timeframe.
- (3)
- In light of the analysis of available statistical data sources, we must state that while it would be possible to identify which educational actions improve education, the current instruments and databases do not allow for this. There is still no universal database (or by countries, regions, etc.) that is anonymized and complies with strict ethical standards of personal data protection, while also providing disaggregated data to measure the impact of each educational action known to us (and those that will be found in the future) on education and learning.
5. Conclusions
Author Contributions
Funding
Institutional Review Board Statement
Informed Consent Statement
Data Availability Statement
Conflicts of Interest
Appendix A. Initial Selection of Data Based on SDG 4
| Source | MET = Ministry of Education and Training; FWB = Federation of French-Wallonia | NSI = National Statistical Institute; ITU = International Telecommunication Union | MCE = Ministry of Children and Education; SD = Statistics Denmark; ICILS = International Computer and Information Literacy Study; PIAAC = Programme for the International Assessment of Adult Competencies; ICCS = International Civic and Citizenship Education Study | UNESCO HDX = Humanitarian Data Exchange; HSA = Hellenic Statistical Agency; ICCS = International Civic and Citizenship Education Study | GUI = Growing up in Ireland; CSO = Central Statistics Office; HBSC = University of Galway; ECCE = Early Childhood Care and Education scheme; HEA = Higher Education Authority; QNHS = Quarterly National Household Survey; NCCA = National Council for Curriculum and Assessment; DES = Department of Education and Skills; ERC = Educational Research Centre. | ISTAT = Italian National Institute of Statistics; INVALSI = National Institute for the Evaluation of the Education System; MIUR = Italian Ministry of Education, University, and Research; StCI = Save the Children Italy; AAI = ActionAid Italy | NEA = National Education Agency; EMIS = Education Management Information system; SVIS (Valdymo Informacine Sistema); OSP = Lithuanian Official Statistics Portal; EC= European Commission; ETM-EC = Education and Training Monitor by European Commission; EASIE = European Agency Statistics on Inclusive Education; OECD-EaG = OECD Education at a Glance; TALIS = Teaching and Learning International Survey -OECD-; ICILS = International Computer and Information Literacy Study by IEA; GEM-UNESCO = Global Education Monitoring Report; E4A-UNESCO (Education for All); UIS Sustainable Dev. Goals; WIDE = World Inequality Database on Education | DGEEC = Directorate General of Education and Science Statistics; IAVE = Instituto de Avaliaçao Educativas | “FNAE = Finnish National Agency for Education; SF = Statistics Finland; FIHW = Finnish Institute for Health and Welfare; PIAAC = Programme for the International Assessment of Adult Competencies; ICILS = International Computer and Information Literacy Study; ICCS = International Civic and Citizenship Education Study; MECF = Ministry of Education and Culture Finland Study)” | ||
| Country | BE (PSPC) | BG (Institut of Education) | DK (AU) | GR (KMOP) | ES (UB) | IE (DCU) | IT (UNISI) | LT (PPMI) | PT (DGEEC) | RO | FI (JUY) |
| SDG 4 | 2013–23—SDG4-UNESCO//UIS UNESCO (2017–23)//ES WORLD BANK (2005–2018)//WIDE | ||||||||||
| Target 4.1. By 2030, ensure that all girls and boys complete free, equitable, and quality primary and secondary education leading to relevant and effective learning outcomes | x | ||||||||||
| Indicator 4.1.1. Proportion of children and young people (a) in grades 2/3; (b) at the end of primary; and (c) at the end of lower secondary achieving at least a minimum proficiency level in (i) reading and (ii) mathematics, by sex | 2010–2023 (MCE) | x | x | 2015–2023 (INVALSI) 2000–2023 (PISA) | 2009–23 (NEA; EMIS; SVIS) | ||||||
| Indicator 4.1.1.: (sub-indicator) These are data on national exams (Valstybiniai brandos egzaminai—State Maturity Exams) taken by students at the end of their secondary education, typically in the 12th grade. The results are available for Lithuanian language and literature, and mathematics, among many other subjects. | 2006–24 (NEA) | ||||||||||
| Indicator 4.1.1. Suindicator: This test is taken by 10th-grade students to assess their academic performance, typically in subjects like Lithuanian language and literature and mathematics, at the end of their basic education level. | 2013–24 (NEA) | ||||||||||
| Indicator 4.1.1. Suindicator: Provides data on regular and non-formal education, student enrollment, foreign student participation, Olympiad winners, and public service statistics. | 2019–24 (OSP) | ||||||||||
| Indicator 4.1.1. Subindicator: Provides comprehensive education-related statistics, including data on formal and non-formal education, educational establishments from preschool to higher education, and culture. | 2012–22 (OSP) | ||||||||||
| Indicator 4.1.1. Sub-indicator: Provides data (comparative reports) on numerous indicators, such as early school leaving, regular, non-formal learning, and higher education. | 2024 (EC—Eurydice) | ||||||||||
| Indicator 4.1.1. Sub-indicator: Provides detailed analysis and data on Lithuania’s education system, focusing on indicators such as early school leaving, student performance, participation in secondary and vocational education, teacher shortages, and socio-economic disparities in education. | 2020–23 (ETM-EC) | ||||||||||
| Indicator 4.1.1. Sub-indicator: Provides comprehensive education and training statistics, including data on participation in formal education, vocational training, adult learning, learning mobility, education personnel, and education finance. | 2024 (Eurostat) | ||||||||||
| Indicator 4.1.1. Focuses on educational attainment, teachers, school performance, and public expenditure. Key aspects include the structure of Lithuania’s education system, vocational education, and academic performance comparisons with OECD averages. | 2023 (OECD, EaG) | ||||||||||
| Indicator 4.1.1. Provides data on teachers’ working conditions and learning environments in over 30 countries. It surveys a representative sample of lower secondary teachers and school leaders. It provides data on teacher-student ratios and engagement levels, key for educational inequality analysis. | 2008–18 (TALIS) | ||||||||||
| Indicator 4.1.1. Provides insights into students’ ability to use computers to investigate, create, and communicate effectively. It assesses how well students are prepared for life in a digital world. The study also includes contextual data on students’ home and school environments, teacher readiness, and digital resources. Additionally, it offers an optional assessment of computational thinking, covering programming and data structuring skills. | 2013–23 ICILS | ||||||||||
| Indicator 4.1.1. Provides detailed analyses of education systems globally, with a focus on technology access, usage, and its impact on learning outcomes. | 2002–23 (GEM-UNESCO) | ||||||||||
| Indicator 4.1.1. Provides comprehensive data on Lithuania’s progress towards the six Education for All goals, focusing on early childhood education, primary education, adult literacy, gender parity, and quality of education. It includes data on enrollment rates, access to education, educational outcomes, and funding, as well as information on national policies and strategies for improving education. | 2000–2015 (E4A, UNESCO) | ||||||||||
| Sub-indicator 4.1.1.1.1. Reading literacy of 4th-grade students and performance of 4th and 8th-grade students in mathematics and science. | 2018–2024 (Institute of Education) | 2011, 2016 (PIRLS), 2015–2019 (TIMSS) | |||||||||
| Sub-indicator 4.1.1.1.1. Proportion of young people who, at the end of lower secondary education, have achieved at least a minimum level of proficiency in reading (PISA) | 2000–2022 (PISA) | 2009–2022 (PISA) | 2000–2022 (PISA) | 2000–2022 (PISA) | 2019–22 (2022) PISA | 2000–22 (PISA) | 2009–2022 (PISA) | ||||
| Sub-indicator 4.1.1.2. Proportion of young people who, at the end of lower secondary education, have achieved at least a minimum level of proficiency in mathematics (PISA) | 2000–2022 (PISA) | 2012–2022 (PISA) | 2000–2022 (PISA) | 2000–2022 (PISA) | 2019–22 (2023) PISA | 2009–2022 (PISA) | |||||
| Sub-indicator 4.1.1.3. Proportion of young people who, at the end of primary school education, have achieved at least a minimum level of proficiency in reading (PIRLS/GUI/TIMSS NAMER) | 2006–2021 (PIRLS) | 2001–2021 (PIRLS) | 2006–2021 (PIRLS) | 2001-? (PIRLS) | 2011–22 (PIRLS); 2008–23 (GUI); 2009–21 (T.NAMER). | 1995–2019 (TIMMS) | 2011–2021 (PIRLS) | ||||
| Proportion of young people who, at the end of primary school education, have achieved at least a minimum level of proficiency in mathematics (TIMSS, NAMER, GUI). | 1995–2023 (TIMSS) | 2015–2023 (TIMSS) | 2007–2019 (TIMSS) | 1995–2019 (TIMSS); 2008–2023 (GUI); 2009–2021 (NAMER) (Last 2019) | 2001–2021 TIMSS | 2011–2023 (TIMSS) | |||||
| Indicator 4.1.2. Completion rate (primary education, lower secondary education, upper secondary education) | 2011–2021 (MET) | 2006–2022 (UNESCO); 2000–2021 (HSA) | x | 2008–24; 1991–2022 (Census) | 2010–2022 (ISTAT); 2019–2023 (MIUR) | 2000–2024 (FNAE) 2000–2017 (SF) | |||||
| Sub-indicator 4.1.2 The percentage ratio between the number of students who, at the end of a school year, pass (being able to move on to the next school year) and the number of students enrolled in that school year. We use the term “completion rate” when referring to achievement in the final year of a level of education, i.e., 9th and 12th grade. Notes: This indicator refers to general basic education, scientific-humanistic courses, courses with their own plans, and vocational courses. The term “completion rate” refers to the successful completion of basic or secondary education (9th or 12th grade, respectively). | 2019–2024 (NSI) | 2007–2024 (MCE) | 1990–2024 (UNESCO HDX) | 1999/2000–2022–23 (DGEEC) | |||||||
| Sub-indicator 4.1.3.1 Rate of students completing on the expected time all educational levels (1) primary education: first cycle in four years, second cycle in two years, (2) lower secondary education: third cycle, and (3) upper secondary education in three years. This indicator disaggregation is by regional level, School, and School Clusters. | 2013–2021 (FWB) | 2018–2023 (NSI) | 2015–2022 (Eurostat) | 2017–18/2021–22 (DGEEC) | |||||||
| Sub-indicator 4.1.4.1 Rate of students with school social support (ASE), completing on the expected time all the educations levels (1) primary education: first cycle in four years, second cycle in two years, (2) lower secondary education: third cycle and (3) upper secondary education in three years. This indicator is disaggregated by regional level and School Clusters. | 2017–18/2021–22 (DGEEC) | ||||||||||
| Sub-indicator 4.1.5.1 Equity indicator for regional level, School Clusters, and by education level—primary education (first and second cycle), lower secondary education (third cycle), and upper secondary education (general and vocational) | 2015–2023 (StCI) | 2017–18/2021–22 (DGEEC) | |||||||||
| Other indicator/s (specify) | Qualitative evaluations from teachers determine if students are considered “ready” for various upper secondary tracks. 2011–2024 (MCE) | x | |||||||||
| Target 4.2. By 2030, ensure that all girls and boys have access to quality early childhood development, care, and pre-primary education so that they are ready for primary education. | x | ||||||||||
| Indicator 4.2.1. Proportion of children aged 24–59 months who are developmentally on track in health, learning, and psychosocial well-being, by sex | x | 2011 (GUI); 2022 (CSO); 1998–2022 (HBSC) | 2017–18/2020/2024 (FIHW) | ||||||||
| Indicator 4.2.2. Participation rate in organized learning (one year before the official primary entry age), by sex | 2013–2022 (MET) | 2019–2024 (NSI) | 2013–2022 (Eurostat) | x | 2021–23 (ECCE) | 2010–2023 (StCI); 2010–2023 (ISTAT) | 2015–2023 (SF) | ||||
| Sub-indicator 4.2.2.1 Number of children with 5 and 6 years old enrolled in pre-school by sex | 1999–2000/2022–23 (DGEEC) | ||||||||||
| Sub-indicator 4.2.3.1 Real pre-school enrollment rate | 2013–2022 (Eurostat) | 2003–4/2022–23 (DGEEC) | |||||||||
| Sub-indicator 4.2.4.1 Gross enrollment rate in pre-school education | 2003–4/2022–23 (DGEEC) | ||||||||||
| Other indicator/s (specify) | x | ||||||||||
| Target 4.3. By 2030, ensure equal access for all women and men to affordable and quality technical, vocational, and tertiary education, including university education | x | ||||||||||
| Indicator 4.3.1. Participation rate of youth and adults in formal and non-formal education and training in the previous 12 months, by sex | 2007/2011/2016/2022 (NSI) | 1990–2022 (SD) | 1992–2023 (Eurostat) | 2021–22 (HEA); 2017–2022 (CSO) | 1999–2022 (SF) (FNAE) | ||||||
| Indicator: Participation rate of youth and adults in formal and non-formal education and training in the previous 12 months, by sex | x | 2003/2004–2022/23 (municipalities in Autonomous Regions since 2009/2010) (DGEEC) | |||||||||
| Indicator 4.3.2.1. Transition rate (after one year) between secondary education and higher education. | 2010–11/2021–22 (DGEEC) | ||||||||||
| Sub-indicator 4.3.4.1. Percentage of students continuing their studies in higher education one year after completing a short-cycle tertiary education course (CTeSP) by sex, age, region (NUTS II and district), higher education subsystem, and institution. | 2015–16/2021–22 (DGEEC) | ||||||||||
| Sub-indicator 4.3.5.1. Percentage of students who have completed a Bachelor’s or equivalent courses by sex, age, region (NUTS II and district), higher education subsystem and institution, and field of study. | 2006–2022 (UNESCO) | 2013–14/2021–22 (DGEEC) | |||||||||
| Sub-indicator 4.3.6.1 Percentage of students continuing their studies in higher education one year after completing a bachelor’s or equivalent course by sex, age, region (NUTS II and district), higher education subsystem and institution, and field of study. | 2015–16/2021–22 (DGEEC) | ||||||||||
| Other indicator/s (specify) | x | ||||||||||
| Target 4.4. By 2030, substantially increase the number of youth and adults who have relevant skills, including technical and vocational skills, for employment, decent jobs, and entrepreneurship | x | ||||||||||
| Indicator 4.4.1. Proportion of youth and adults with information and communications technology (ICT) skills, by type of skill | 2018–2022 (ITU) | x | 2017–24 (QNHS) | 2012/2023 (PIAAC) | |||||||
| Sub-indicator 4.4.1.1. Digital and information literacy of young people in the 8th grade. | 2013–2023 (ICILS) | 2022 (ICILS) | 2018 (IAVE) | 2018/2023 (ICILS) | |||||||
| Other indicator/s (specify) | x | ||||||||||
| Target 4.5. By 2030, eliminate gender disparities in education and ensure equal access to all levels of education and vocational training for the vulnerable, including persons with disabilities, indigenous peoples, and children in vulnerable situations. | x | ||||||||||
| Indicator 4.5.1. Parity indices (female/male, rural/urban, bottom/top wealth quintile, and others such as disability status, indigenous peoples, and conflict-affected, as data become available) for all education indicators on this list that can be disaggregated | 1990–2022 (SD) | x | 2012–19 (CSO) | 2010–2023 (StCI) | 2008–2024 (SF) | ||||||
| Indicator 4.5.1. Provides detailed statistics on the inclusion of learners with special educational needs (SEN) in mainstream education, special education settings, teacher support, and student outcomes. It includes data on the number of children/learners in the education system, SEN identification rates, inclusion rates, and public expenditure on inclusive education. | 2012–22 (EASIE) | ||||||||||
| Other indicator/s (specify) | x | ||||||||||
| Target 4.6. By 2030, ensure that all youth and a substantial proportion of adults, both men and women, achieve literacy and numeracy. | x | ||||||||||
| Indicator 4.6.1. Proportion of population in a given age group achieving at least a fixed level of proficiency in functional (a) literacy and (b) numeracy skills, by sex | 2012/2022 (PIAAC) | 2015 (PIAAC) | x | 2016–2019 (CSO) | 2011–2023 (PIAAC) | 2012/2023 (PIAAC) | |||||
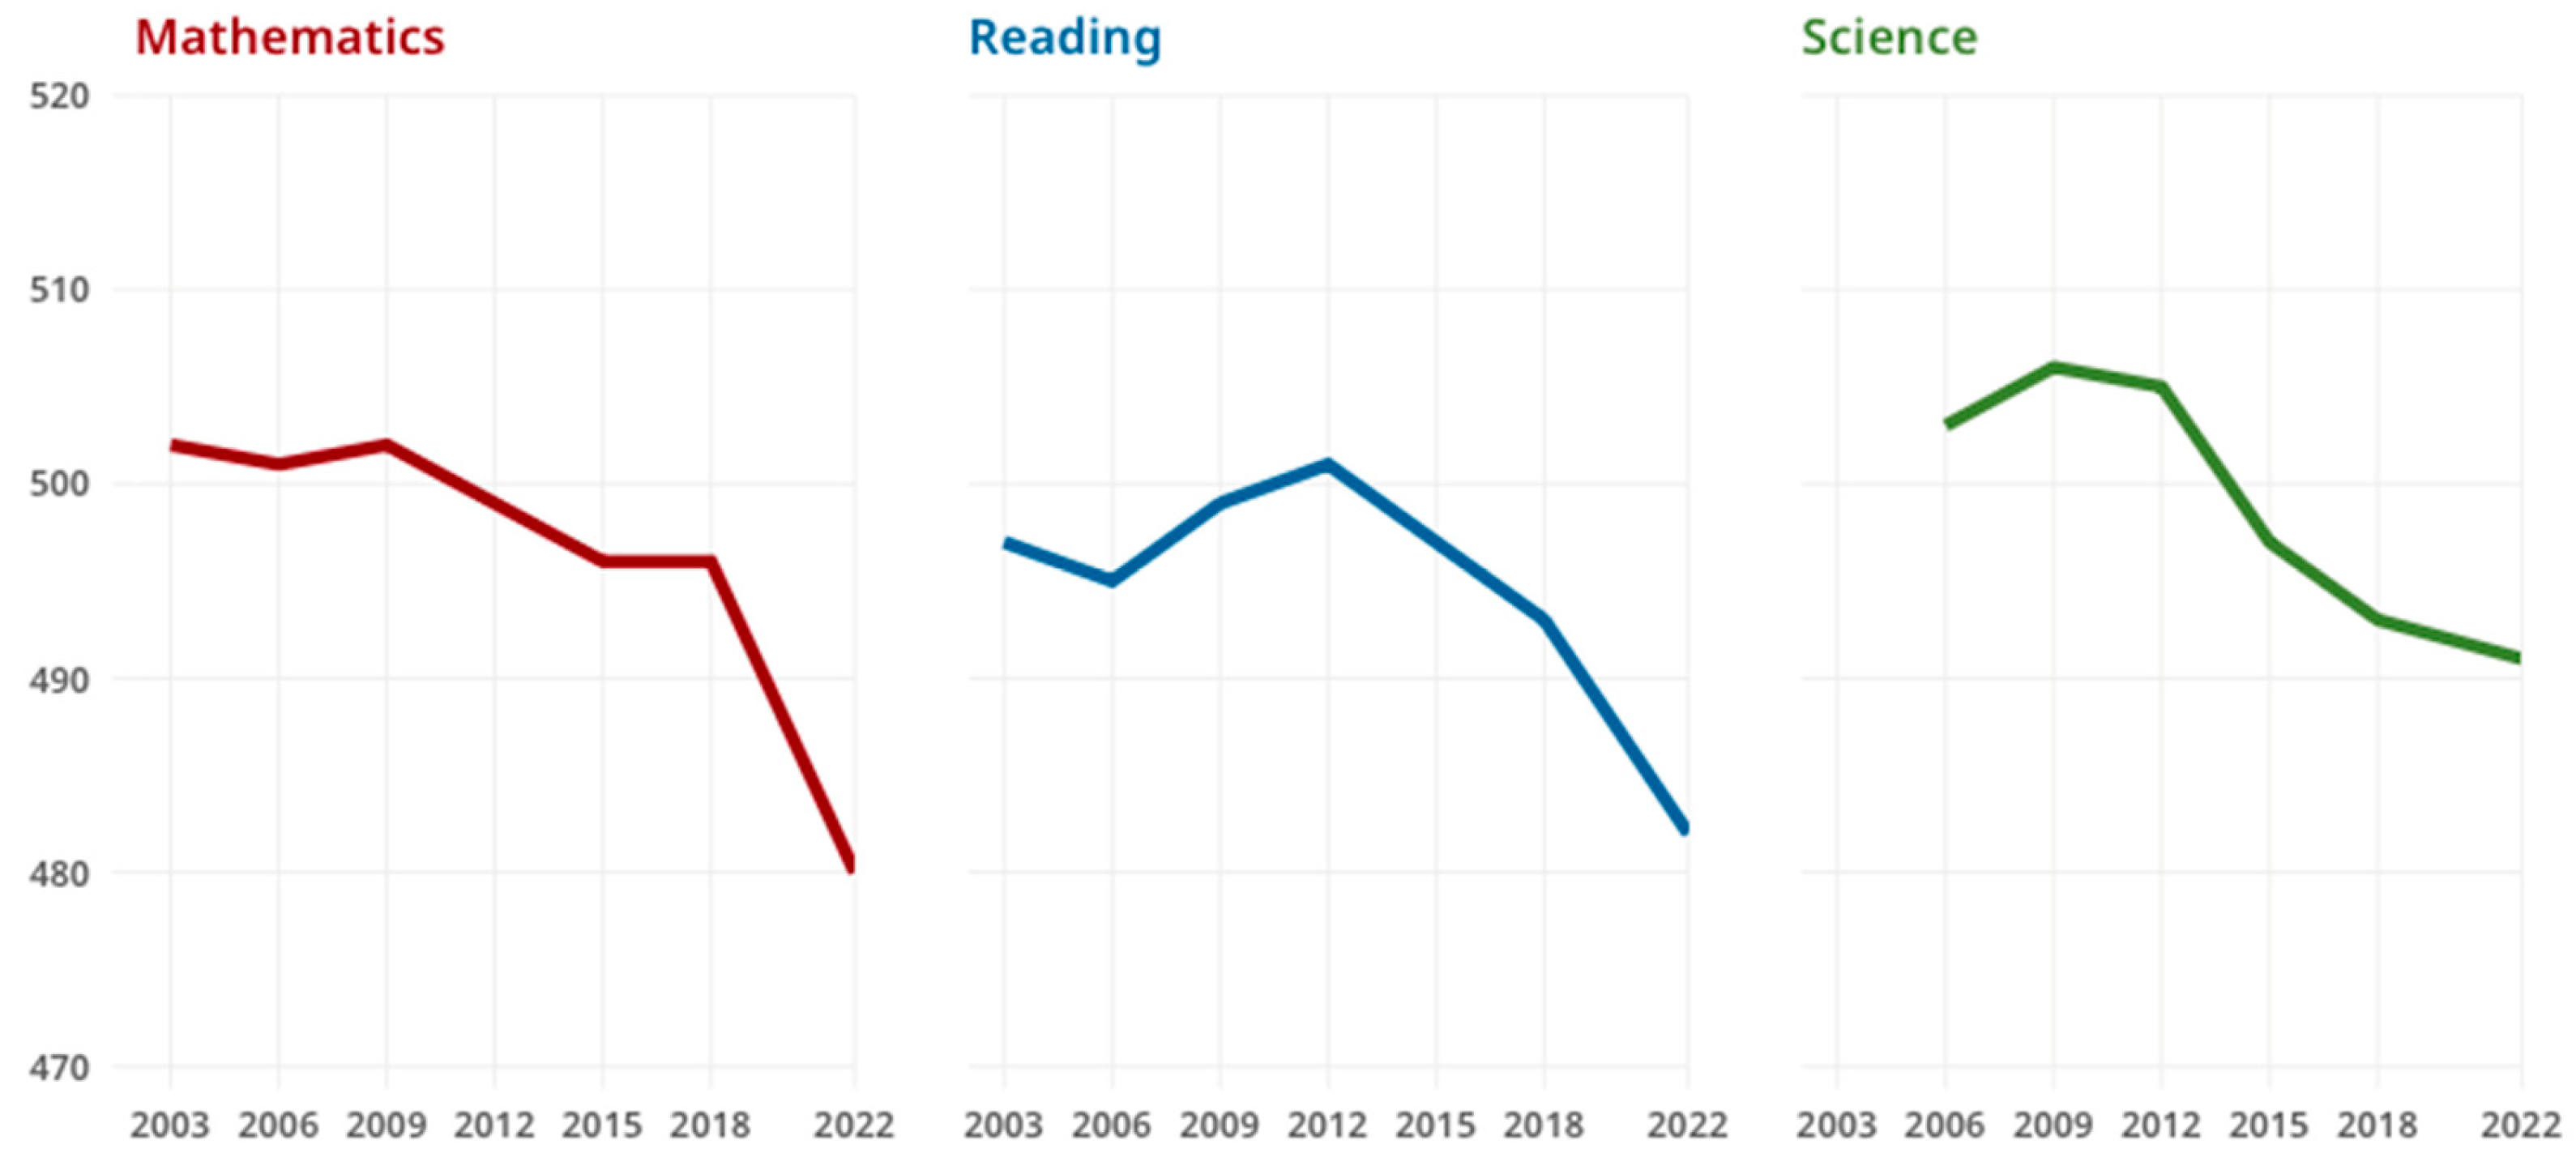
| Sub-indicator 4.6.1.1. Percentage of students with 15 years old by math and reading proficiency level (PISA) | “Reading—2000, 2009, and 2018 Mathematics—2003, 2012, and 2022 Science—2006, 2015, and 2025 (IAVE)” | ||||||||||
| Other indicator/s (specify) | x | ||||||||||
| Target 4.7. By 2030, ensure that all learners acquire the knowledge and skills needed to promote sustainable development, including, among others, through education for sustainable development and sustainable lifestyles, human rights, gender equality, promotion of a culture of peace and non-violence, global citizenship and appreciation of cultural diversity and of culture’s contribution to sustainable development | x | ||||||||||
| Indicator 4.7.1. Extent to which (i) global citizenship education and (ii) education for sustainable development are mainstreamed in (a) national education policies; (b) curricula; (c) teacher education, and (d) student assessment | 2009–2022 (ICCS) | 2009–? (ICCS) | x | 2016–22 (NCCA) | 2015–2023 (AAI) | 2016 (ICCS) | |||||
| Sub-indicator 4.7.1.1 Number of students of 2nd and 3rd cycles attending citizenship classes | 2023/22 (DGEEC) | ||||||||||
| Target 4.a. Build and upgrade education facilities that are child, disability, and gender sensitive and provide safe, non-violent, inclusive, and effective learning environments for all | x | ||||||||||
| Indicator 4.a.1. Proportion of schools offering basic services, by type of service | x | 2017–24 (DES, ERC) | 2000–2023 (SF) 2020–2022 (MECF) |
References
- Alexiu, Teodor-Mircea, Dorel Ungureanu, and Andreea Dorobanţu. 2010. Impact of education in terms of housing opportunities. Procedia—Social and Behavioral Sciences 2: 1321–25. [Google Scholar] [CrossRef]
- Campdepadrós-Cullell, Roger, and Lena De Botton. 2021. The role of the dialogical model of conflict resolution in the prevention of violent radicalization. In Islam and Security in the West. Edited by Stefano Bonino and Roberta Ricucci. London: Palgrave Macmillan, pp. 139–61. [Google Scholar] [CrossRef]
- Casella, George, and Roger Berger. 2024. Statistical Inference. Boca Raton: CRC Press. Abingdon: Taylor and Francis Group. [Google Scholar]
- Crespo-López, Alba, Rosa Valls-Carol, and Elisenda Giner-Gota. 2025. The co-creation and implementation of a protocol for the prevention of gender violence in a non-university adult educational center. Behavioral Sciences 15: 406. [Google Scholar] [CrossRef]
- Daniele, Vittorio. 2021. Socioeconomic inequality and regional disparities in educational achievement: The role of relative poverty. Intelligence 84: 101515. [Google Scholar] [CrossRef]
- Díez-Palomar, Javier, and Joan Cabré. 2015. Using dialogic talk to teach mathematics: The case of interactive groups. ZDM Mathematics Education 47: 1299–312. [Google Scholar] [CrossRef]
- Education Endowment Foundation. 2025. Teaching and Learning Toolkit. Available online: https://educationendowmentfoundation.org.uk/education-evidence/teaching-learning-toolkit (accessed on 23 June 2025).
- Elboj-Saso, Carmen, Alejandra Cortés-Pascual, Tatiana Íñiguez-Berrozpe, Raquel Lozano-Blasco, and Alberto Quílez-Robres. 2021. Emotional and Educational Accompaniment through Dialogic Literary Gatherings: A Volunteer Project for Families Who Suffer Digital Exclusion in the Context of COVID-19. Sustainability 13: 1206. [Google Scholar] [CrossRef]
- Flecha, Ramon. 2014. Scientific Evidence of Social Impact. Creative Commons. Available online: https://archive.org/details/scientific-evidence-social-impact_202106/mode/1up (accessed on 20 March 2025).
- Flecha, Ramon, ed. 2015. Successful Educational Actions for Inclusion and Social Cohesion in Europe. Berlin and Heidelberg: Springer. [Google Scholar]
- Flecha, Ramon. 2017. Social Impact of Community-Based Educational Programs in Europe. In Oxford Research Encyclopedia of Education. Oxford: Oxford University Press. [Google Scholar] [CrossRef]
- Flecha, Ramon, Rosa Valls-Carol, Lidia Puigvert, Marta Soler-Gallart, Lena de Botton, Javier Díez-Palomar, Adriana Aubert, Roger Campdepadrós-Cullell, Beatriiz Villarejo, Esther Roca-Campos, and et al. 2025. It is Very Clear what Improves Educational Results and What Does Not. International Journal of Sociology of Education, 1–27. [Google Scholar] [CrossRef]
- Flecha Garcia, Ramon, Esther Roca Campos, and Garazi Lopez de Aguileta. 2022. Scientific evidence-based teacher education and social impact. In Encyclopedia of Teacher Education. Edited by Michael Peters. Singapore: Springer Nature, pp. 1604–10. [Google Scholar] [CrossRef]
- Flury, Bernhard. 1988. Common Principal Components and Related Multivariate Models. Hoboken: John Wiley & Sons. [Google Scholar]
- Gallant, Ronald. 1987. Nonlinear Statistical Models. Hoboken: John Wiley & Sons. [Google Scholar]
- Hahs-Vaughn, Debbie. 2020. Statistical Concepts: A First Course. London: Routledge. [Google Scholar] [CrossRef]
- Hattie, John, and Eric Anderman. 2013. International Guide to Student Achievement. London: Routledge. [Google Scholar]
- Heiberger, Richard, and Burt Holland. 2015. Data and statistics. In Statistical Analysis and Data Display. Berlin and Heidelberg: Springer, pp. 15–38. [Google Scholar] [CrossRef]
- Jackson, Michelle, and David Cox. 2013. The principles of experimental design and their application in sociology. Annual Review of Sociology 39: 27–49. [Google Scholar] [CrossRef]
- Kingston, Paul, Ryan Hubbard, Brent Lapp, Paul Schroeder, and Julia Wilson. 2003. Why Education Matters. Sociology of Education 76: 53–70. [Google Scholar] [CrossRef]
- Kirsch, Irwin, Mary Louise Lennon, Anita Sands, Jean-François Rouet, Anne Britt, Tobias Richter, Dave Tout, Kees Hoogland, and Javier Díez-Palomar. 2025. Level Up: Raising the Skills of Adults in the United States and Other Countries. ETS Research Report. Available online: https://www.ets.org/Media/Research/pdf/RR-25-04.pdf (accessed on 15 April 2025).
- Kunnari, Jenni, Jouni Pursiainen, and Hanni Muukkonen. 2023. The relationship between secondary education outcomes and academic achievement: A study of Finnish educational sciences students. Journal of Further and Higher Education 47: 1155–68. [Google Scholar] [CrossRef]
- Lopez de Aguileta, Garazi. 2019. Developing School-relevant Language and Literacy Skills through Dialogic Literary Gatherings. International Journal of Educational Psychology 8: 51–71. [Google Scholar] [CrossRef]
- Lövdén, Martin, Laura Fratiglioni, Maria Glymour, Ulman Lindenberger, and Elliot Tucker-Drob. 2020. Education and Cognitive Functioning Across the Life Span. Psychological Science in the Public Interest 21: 6–41. [Google Scholar] [CrossRef] [PubMed]
- Martins, Lurdes, and Paula Veiga. 2010. Do inequalities in parents’ education play an important role in PISA students’ mathematics achievement test score disparities? Economics of Education Review 29: 1016–33. [Google Scholar] [CrossRef]
- Murtin, Fabrice, Johan Mackenbach, Domantas Jasilionis, and Marco Mira. 2017. Inequalities in longevity by education in OECD countries: Insights from new OECD estimates. In OECD Statistics Working Papers. No. 2017/02. Paris: OECD Publishing. [Google Scholar] [CrossRef]
- OECD. 2020. Education at a Glance 2020: OECD Indicators. Paris: OECD Publishing. [Google Scholar] [CrossRef]
- OECD. 2023a. Education at a Glance 2023: OECD Indicators. Paris: OECD Publishing. [Google Scholar] [CrossRef]
- OECD. 2023b. PISA 2022 Assessment and Analytical Framework. Paris: OECD Publishing. [Google Scholar] [CrossRef]
- Pustjens, Heidi, Eva Van De Gaer, Jan Van Damme, and Patrick Onghena. 2004. Effect of Secondary Schools on Academic Choices and on Success in Higher Education. School Effectiveness and School Improvement 15: 281–311. [Google Scholar] [CrossRef]
- Rabiner, David, Jennifer Godwin, and Kenneth Dodge. 2016. Predicting Academic Achievement and Attainment: The Contribution of Early Academic Skills, Attention Difficulties, and Social Competence. School Psychology Review 45: 250–67. [Google Scholar] [CrossRef]
- Raghupathi, Viju, and Wullianallur Raghupathi. 2020. The influence of education on health: An empirical assessment of OECD countries for the period 1995–2015. Archives of Public Health 78: 20. [Google Scholar] [CrossRef]
- Roca, Esther, Pilar Fernández, Maria Troya, and Ainhoa Flecha. 2024. The effect of successful educational actions in transition from primary to secondary school. PLoS ONE 19: e0304683. [Google Scholar] [CrossRef]
- Roca-Campos, Esther, Harkaitz Zubiri-Esnaola, Susana León-Jiménez, and Adrianna Aubert. 2024. Perceived Improvement of Literacy Skills of Students with and Without Special Educational Needs Through Dialogic Literary Gatherings. Disabilities 4: 1030–43. [Google Scholar] [CrossRef]
- Ruiz-Eugenio, Laura, Ana Toledo del Cerro, Sara Gómez-Cuevas, and Beatriz Villarejo-Carballido. 2021. Qualitative Study on Dialogic Literary Gatherings as Co-creation Intervention and Its Impact on Psychological and Social Well-Being in Women During the COVID-19 Lockdown. Frontiers in Public Health 9: 217. [Google Scholar] [CrossRef]
- Sánchez, Eva, Susana Miguélañez, and Fernando Abad. 2019. Explanatory factors as predictors of academic achievement in PISA tests. An analysis of the moderating effect of gender. International Journal of Educational Research 96: 111–19. [Google Scholar] [CrossRef]
- Schnell, Philipp, and Davide Azzolini. 2015. The academic achievements of immigrant youths in new destination countries: Evidence from southern Europe. Migration Studies 3: 217–40. [Google Scholar] [CrossRef]
- Stoet, Gijsbert, and David Geary. 2013. Sex Differences in Mathematics and Reading Achievement Are Inversely Related: Within- and Across-Nation Assessment of 10 Years of PISA Data. PLoS ONE 8: e57988. [Google Scholar] [CrossRef]
- Stuart, Allan, and Keith Ord. 1999a. Kendall’s Advanced Theory of Statistics. Vol I. Distribution Theory. Arnold: Hodder Headline Group. [Google Scholar]
- Stuart, Allan, and Keith Ord. 1999b. Kendall’s Advanced Theory of Statistics. Vol II. Classic inference and the Linear Model. Arnold: Hodder Headline Group. [Google Scholar]
- United Nations. 2016. THE 17 GOALS. Available online: https://sdgs.un.org/goals (accessed on 20 March 2025).
- Valls, Rosa, and Leonidas Kyriakides. 2013. The power of Interactive Groups: How diversity of adults volunteering in classroom groups can promote inclusion and success for children of vulnerable minority ethnic populations. Cambridge Journal of Education 43: 17–33. [Google Scholar] [CrossRef]
- Van den Besselaar, Peter, Ramon Flecha, and Alfred Radauer. 2018. Monitoring the Impact of EU Framework Programmes: Expert Report. Luxembourg: Publications Office of European Commission. [Google Scholar] [CrossRef]
- Von Eye, Alexander. 1990. Statistical Methods in Longitudinal Research. Volume I: Principles and Structuring Change. Cambridge: Academic Press. [Google Scholar]
| Study Cohort | Students Born in the Year | Period of Analysis | Years of Schooling Covered |
|---|---|---|---|
| Cohort 1 | 1999 | 2005–2017 | Primary and secondary education |
| Cohort 2 | 2004 | 2010–2022 | Primary and secondary education |
| Cohort 3 | 2009 | 2015–2021 | Primary education |
| Target | Indicators |
|---|---|
| T4.1. By 2030, ensure that all girls and boys complete free, equitable, and quality primary and secondary education leading to relevant and effective learning outcomes | I4.1.1. Proportion of children and young people (a) in grades 2/3; (b) at the end of primary; and (c) at the end of lower secondary achieving at least a minimum proficiency level in (i) reading and (ii) mathematics, by sex |
| I4.1.2. Completion rate (primary education, lower secondary education, upper secondary education) | |
| By 2030, ensure that all girls and boys have access to quality early childhood development, care, and pre-primary education so that they are ready for primary education. | I4.2.1. Proportion of children aged 24–59 months who are developmentally on track in health, learning, and psychosocial well-being, by sex |
| I4.2.2. Participation rate in organized learning (one year before the official primary entry age), by sex | |
| T4.3. By 2030, ensure equal access for all women and men to affordable and quality technical, vocational, and tertiary education, including university education | I4.3.1. Participation rate of youth and adults in formal and non-formal education and training in the previous 12 months, by sex |
| T4.4. By 2030, substantially increase the number of youth and adults who have relevant skills, including technical and vocational skills, for employment, decent jobs, and entrepreneurship | Proportion of youth and adults with information and communications technology (ICT) skills, by type of skill I4.4.2. |
| By 2030, eliminate gender disparities in education and ensure equal access to all levels of education and vocational training for the vulnerable, including persons with disabilities, indigenous peoples, and children in vulnerable situations. | I4.5.1. Parity indices (female/male, rural/urban, bottom/top wealth quintile, and others such as disability status, indigenous peoples, and conflict-affected, as data become available) for all education indicators on this list that can be disaggregated |
| T4.6. By 2030, ensure that all youth and a substantial proportion of adults, both men and women, achieve literacy and numeracy. | I4.6.1. Proportion of population in a given age group achieving at least a fixed level of proficiency in functional (a) literacy and (b) numeracy skills, by sex. |
| T4.7. By 2030, ensure that all learners acquire the knowledge and skills needed to promote sustainable development, including, among others, through education for sustainable development and sustainable lifestyles, human rights, gender equality, promotion of a culture of peace and non-violence, global citizenship and appreciation of cultural diversity and of culture’s contribution to sustainable development | I4.7.1. Extent to which (i) global citizenship education and (ii) education for sustainable development are mainstreamed in (a) national education policies; (b) curricula; (c) teacher education, and (d) student assessment |
| T4.a. Build and upgrade education facilities that are child, disability, and gender sensitive and provide safe, non-violent, inclusive, and effective learning environments for all | I4.a.1. Proportion of schools offering basic services, by type of service |
| Models of What the Working Matrix and the Final Matrix Would Look Like with the Desired Welfare Outcomes, With and Without Foreign Students. | |||||||||||||||
|---|---|---|---|---|---|---|---|---|---|---|---|---|---|---|---|
| Working Matrix (It Is Bigger Than the Other One Because Here Are the Years of Each Cohort) | Final Matrix with the Searched Results on Welfare (The Information Has Been Compressed) | ||||||||||||||
| Cohort | Country | Educational Level | Year | Educational Outcomes * | Socioeconomics + | Structuring Data | Quantitative Results | Binary Results to Compare the Correlation | |||||||
| 1999 | Belgium | Primary | 2005 | N/A | N/A | Cohort | Country | Educational Level | Edu. Results (No Foreign) (%) | Edu. Results (with Foreigners) (%) | Socioeconomy (%) | Edu. Success ≥50% (No Foreigners) | Edu. Success ≥ 50% (with Foreigners) | Resources >= at 50%? | |
| 1999 | Belgium | Primary | 2006 | N/A | N/A | 1999 | Belgium | Primary | 20 | 35 | 50 | FALSE | FALSE | TRUE | |
| 1999 | Belgium | Primary | 2007 | N/A | N/A | 1999 | Belgium | Lower | 32 | 25 | 75 | FALSE | FALSE | TRUE | |
| 1999 | Belgium | Primary | 2008 | N/A | N/A | 1999 | Belgium | Upper | 59 | 50 | 77 | TRUE | TRUE | TRUE | |
| 1999 | Belgium | Primary | 2009 | N/A | N/A | 2004 | Belgium | Primary | 55 | 60 | 25 | TRUE | TRUE | TRUE | |
| 1999 | Belgium | Primary | 2010 | N/A | N/A | 2004 | Belgium | Lower | 30 | 20 | 50 | FALSE | FALSE | TRUE | |
| 1999 | Belgium | Lower secondary | 2011 | N/A | N/A | 2004 | Belgium | Upper | 15 | 27 | 49 | FALSE | FALSE | FALSE | |
| 1999 | Belgium | Lower secondary | 2012 | N/A | N/A | 2009 | Belgium | Primary | 75 | 70 | 24 | TRUE | TRUE | FALSE | |
| 1999 | Belgium | Lower secondary | 2013 | N/A | N/A | 2009 | Belgium | Lower | 32 | 25 | 84 | FALSE | FALSE | TRUE | |
| 1999 | Belgium | Lower secondary | 2014 | N/A | N/A | ||||||||||
| 1999 | Belgium | Upper secondary | 2015 | N/A | N/A | ||||||||||
| 1999 | Belgium | Upper secondary | 2016 | N/A | N/A | 2009 | Belgium | Upper | 59 | 51 | 74 | ||||
| 2004 | Belgium | Primary | 2010 | N/A | N/A | 1999 | Bulgaria | Primary | 55 | 60 | 42 | TRUE | TRUE | TRUE | |
| 2004 | Belgium | Primary | 2011 | N/A | N/A | 1999 | Bulgaria | Lower | 20 | 30 | 75 | TRUE | TRUE | FALSE | |
| 2004 | Belgium | Primary | 2012 | N/A | N/A | 1999 | Bulgaria | Upper | 15 | 27 | 77 | FALSE | FALSE | TRUE | |
| 2004 | Belgium | Primary | 2013 | N/A | N/A | 2004 | Bulgaria | Primary | 75 | 70 | 25 | FALSE | FALSE | TRUE | |
| 2004 | Belgium | Primary | 2014 | N/A | N/A | 2004 | Bulgaria | Lower | 32 | 25 | 50 | TRUE | TRUE | FALSE | |
| 2004 | Belgium | Primary | 2015 | N/A | N/A | 2004 | Bulgaria | Upper | 59 | 51 | 49 | FALSE | FALSE | TRUE | |
| 2004 | Belgium | Lower secondary | 2016 | N/A | N/A | 2009 | Bulgaria | Primary | 55 | 60 | 24 | TRUE | TRUE | FALSE | |
| 2004 | Belgium | Lower secondary | 2017 | N/A | N/A | 2009 | Bulgaria | Lower | 20 | 30 | 84 | TRUE | TRUE | FALSE | |
| Source | Indicators |
|---|---|
| UNESCO | Achieving in mathematics (%) Achieving in Reading (%) both sexes Students experiencing bullying last 12 months (%) Attacks on students, personnel, and institutions (number of) Pupil-qualified teacher ratio (headcount basis) Students who have their first or home language as the language of instruction, both sexes (%) Total aid to education allocated to least developed countries (%) Initial government expenditure on education as a percentage of GDP (%) Initial private expenditure on education (household) as a percentage of GDP (%) Expenditure on education (public, households, ODA) as a percentage of GDP (%) |
| OECD—PISA | Science (average) Reading comprehension (average) Mathematics (average) Students with better results in at least one subject—level 5 or 6 (%) Pupils performing below level 2 in science (%) Students with low performance in the three subjects—below level 2 (%) Variation in science achievement explained by student socioeconomic status (%) Difference in science score associated with a one-unit increase in ESCS (score diff.) Between-school variation in science performance explained by student and school ESCS (%). |
| OECD—TIMSS | Average Achievement (Mathematics & Science) Average Achievement by content and cognitive domain, and by gender School Resources and Environment: Resource shortages, academic emphasis, discipline, safety/order, bullying, socioeconomic composition Language and Early Preparation: language spoken at home, preprimary attendance, early preparation, entry-level skills Home Learning Resources: Learning materials at home, early literacy and numeracy activities Teachers and School Leadership: Education, experience, job satisfaction, professional development participation, and needs Access and use of computers, testing on digital devices |
| Eurostat | Enrollment of children Enrollment of girls Total enrollment Completion of children Completion of girls Total completion Dropout rate (%) Total poverty risk (%) Risk of poverty in children under 18 years of age (%) Investment in education (million euros) Education expenditure as a percentage of GDP (%) |
| World Bank | Adjusted net enrollment rate (%) Adolescents and children out of school (%) Secondary education, vocational pupils, total and both sexes Secondary education, general pupils, total and both sexes School enrollment, primary and secondary (gross), gender parity index (GPI), total, and both sexes Repeaters, primary, total, and both sexes (% of total enrollment) Pupil-teacher ratio Persistence to grade 5, total and both sexes (% of cohort) Expenditure on education (% of government expenditure on education) Adjusted savings: education expenditure (current US$) Adjusted savings: education expenditure (% of GNI) Poverty headcount ratio at societal poverty line (% of population) Poverty headcount ratio at national poverty lines (% of population) |
| Databases | Indicators |
|---|---|
| Eurostat |
|
| UNESCO |
SDG4 Monitoring
|
Disclaimer/Publisher’s Note: The statements, opinions and data contained in all publications are solely those of the individual author(s) and contributor(s) and not of MDPI and/or the editor(s). MDPI and/or the editor(s) disclaim responsibility for any injury to people or property resulting from any ideas, methods, instructions or products referred to in the content. |
© 2025 by the authors. Licensee MDPI, Basel, Switzerland. This article is an open access article distributed under the terms and conditions of the Creative Commons Attribution (CC BY) license (https://creativecommons.org/licenses/by/4.0/).
Share and Cite
Soler-Gallart, M.; Avramov, D.; Zoidou Saripapa, N.; Melgarejo, K.; López, C.G.; Porras, M.T.; Pistón-Pozo, A.; Oliver, E.; Ramis-Salas, M.; Díez-Palomar, J.; et al. What Are the Statistics That Improve Education? Soc. Sci. 2025, 14, 425. https://doi.org/10.3390/socsci14070425
Soler-Gallart M, Avramov D, Zoidou Saripapa N, Melgarejo K, López CG, Porras MT, Pistón-Pozo A, Oliver E, Ramis-Salas M, Díez-Palomar J, et al. What Are the Statistics That Improve Education? Social Sciences. 2025; 14(7):425. https://doi.org/10.3390/socsci14070425
Chicago/Turabian StyleSoler-Gallart, Marta, Dragana Avramov, Nancy Zoidou Saripapa, Karol Melgarejo, Cristian González López, María Troya Porras, Alba Pistón-Pozo, Esther Oliver, Mimar Ramis-Salas, Javier Díez-Palomar, and et al. 2025. "What Are the Statistics That Improve Education?" Social Sciences 14, no. 7: 425. https://doi.org/10.3390/socsci14070425
APA StyleSoler-Gallart, M., Avramov, D., Zoidou Saripapa, N., Melgarejo, K., López, C. G., Porras, M. T., Pistón-Pozo, A., Oliver, E., Ramis-Salas, M., Díez-Palomar, J., & Lopez de Aguileta, G. (2025). What Are the Statistics That Improve Education? Social Sciences, 14(7), 425. https://doi.org/10.3390/socsci14070425